1. Introduction
Wheat (
Triticum aestivum) is a crucial global food crop, serving as a dietary staple for around 30% of the world’s population [
1,
2]. Growing over 218 million hectares worldwide, it is crucial for food security in both developed and developing nations facing food scarcity. The rapidly growing global population and the escalating impacts of climate change are placing considerable pressure on wheat production systems. Current yields, averaging around 3300 kg ha
−1, are significantly threatened by rising temperatures and more unpredictable weather patterns [
3,
4]. In addition, wheat output must rise by 60% to accommodate an anticipated population of 10 billion by 2050, requiring an annual yield increase of no less than 1.6% [
5,
6]. Accomplishing this is not straightforward because it is impeded by abiotic stresses such as elevated temperatures, dryness, and unpredictable precipitation patterns, which significantly hinder wheat yield. Making accurate predictions of wheat yield is a primary goal for breeders, but can be complicated not only by abiotic stress conditions but also by the variability existing between target environments and from plot to plot.
The classical breeding approach for yield improvement is still considered an informed “numbers game” where a large number of mid- and late-generation breeding lines are assessed in multi-location BP yield trials (also called yield trial plots). In the BP yield trials, GY per se is considered the main selection criterion. Along with environmental barriers, the BP trials are labor-intensive, costly, and time-consuming, often requiring several years and multiple locations to accurately assess yield stability. Nonetheless, traditional BP field trials are essential in the real-life scenario for identifying high-performing, suitable varieties for the target environments. To reduce these expenses and speed up the breeding cycle, breeders have long sought efficient tools that can provide early and reliable predictions of GY before initiating costly large-scale multi-location replicated trials. SP data, particularly from the mid-generation (F5–F7) stages of the breeding cycle, offers a promising solution.
Utilizing data collected on mid-generation breeding lines, especially from HTP platforms and single nucleotide polymorphism (SNP)-based molecular markers, could allow breeders to screen large numbers of genotypes quickly and cost-effectively before advancing only the most promising lines to later stages [
7]. In doing so, not only can time and labor be reduced, but selection intensity can be increased as well. This can also pose a great benefit to breeders when seeds are limited during the multi-location field trials phase of their breeding cycles.
A primary problem that arises in breeding is the weak association between GYs assessed in SP and BP trials. Historically, the performance of wheat lines in the mid-generation breeding phases has not reliably predicted their yield in broader, more typical conditions. To tackle this issue, breeders use sophisticated phenotyping technologies like UAV-based spectral data, capable of capturing critical physiological parameters, including canopy reflectance and temperature indices [
8]. When assessed in early yield trial stages (F
5–F
7 generation), these features may provide superior predictors of future yield potential in bigger plots, enabling breeders to make more educated choices at an earlier stage.
Developments in HTP have improved the capacity to estimate GY and other essential features in wheat, allowing researchers to take many types of data at all stages of the breeding cycle. UAV-based HTP systems, outfitted with multispectral, thermal, and hyperspectral sensors, provide breeders with an efficient and economical means to collect extensive phenotypic data [
9,
10,
11]. UAV methods provide the acquisition of time-series data at critical phases of the wheat development cycle, enabling the early selection of advantageous genotypes [
12]. Hinting at the potential for HTP data taken from lines earlier on in the breeding cycle to give information about the performance of key traits later in the process, namely GY. If this kind of data can accurately represent line performance at later stages, it could be used for making advancements of high-yielding lines and forego the unnecessary yield trials, or, adversely, for culling lines that will not end up performing well. Thus, allowing breeders to increase their selection intensity.
In HTP platforms, vegetation indices (VIs) like the normalized difference vegetation index (NDVI) and canopy temperature (CT) are recognized as dependable indicators of wheat biomass and yield potential when taken on sufficiently large plots. Multiple studies indicate that including HTP data (NDVI and CT) into genomic prediction models significantly improves yield prediction accuracy [
13,
14]. Additionally, canopy reflectance data, which offers insights into plant health and stress responses, has been shown to be useful to enhance the prediction capability of genomic prediction models [
15]. These data sources have been shown to correlate with GY when measured in large plots, but their potential to predict future yield from SP trials remains underexplored.
Despite multispectral and thermal imaging providing insights into plant phenotyping and yield predictions, hyperspectral imaging (HSI) delivers a far more comprehensive look into the physiology of a given line. HSI acquires reflectance data over several small spectral bands, enabling the detection of tiny changes in plant health, stress responses, and physiological characteristics that may be missed by other imaging methods [
16,
17]. The extensive spectrum data allows HSI to assess physiological traits, including chlorophyll concentration, photosynthetic efficiency, and water stress, which are essential for predicting GY under adverse circumstances [
18].
Studies have repeatedly shown that the integration of all hyperspectral bands acquired into genomic prediction models can significantly enhance prediction accuracy [
19,
20], compared to models that rely on vegetation indices calculated from a select number of bands. These models can effectively use hyperspectral data to predict future genotype performance, adeptly capturing intricate physiological responses to stress and environmental fluctuations [
16,
18]. Often surpassing conventional genomic models, or those that rely on phenomics data alone; HSI integration could help bridge the gap between SP traits and later-stage yield outcomes.
Machine learning (ML) methodologies, like Random Forest Regression (RFR) and gradient boosting regression (GBR), have shown efficacy in elucidating the intricate correlations between genomic and phenotypic data derived from BP experiments. These ML algorithms are adept at managing non-linear interactions between high-dimensional phenotypic data, such as hyperspectral indices, and SNP markers, rendering them optimal for predicting future performance based on early-stage data [
21]. By integrating SP data with sophisticated ML methodologies, breeders might improve the precision of their predictions, thereby reducing the need for costly BP trials and facilitating the early selection of better lines.
Despite these advancements, there have been few studies that directly evaluate how data collected from small plot (SP) trials, especially in mid-generation lines, can dependably predict yield performances in larger, replicated big plot (BP) trials across multiple years. The ability to use SP-derived high-throughput phenotypic and genomic data for forward prediction would represent a significant step toward increasing the efficiency of early selection, particularly in stages where breeders are constrained by seed quantity or testing resources. This work aims to address that gap by assessing whether integrated multi-omic models trained on SP data can match or approximate the predictive power of BP-based models, ultimately guiding resource allocation and selection intensity at earlier stages of the breeding pipeline.
As touched on, one of the primary difficulties in wheat breeding is the expense and duration needed to perform yield trials on BP. These trials, executed throughout the advanced phases of the breeding cycle, are resource-demanding but needed for pinpointing lines that should be selected. Accurate yield estimates for BP trials using data from SP during the first phases of the yield trial process offer an opportunity for breeders to substantially save expenses, increase selection intensity, and expedite the selection process [
8]. This research seeks to evaluate whether SP trials, in conjunction with HTP (such as NDVI, CT, and HSI) and genomics data, can produce predictions equal to those obtained from BP trials. By testing both within a single year and from year to year, we can see how temporal and environmental dynamics affect the predictions. It examines the predictive accuracy of GY in forward prediction scenarios, using data from one year to genotype performance in the following year. Through the integration of ML models to analyze the impact of various techniques on prediction accuracy, it also assesses whether models can capture complex interactions between genomic and phenotypic data from SP trials, improving their predictive capacity for BP performance.
2. Materials and Methods
2.1. Plant Genetic Materials and Experimental Design
Field tests were conducted throughout the growing seasons of 2021–22 (designated as 2022) and 2022–23 (designated as 2023) at the Plant Science Research and Education Unit (PSREU), University of Florida, Citra, FL, USA. A total of 312 facultative soft wheat advanced breeding lines, sourced from several wheat breeding programs around the southern United States, were assessed for this research (
Supplementary Table S1). The breeding lines were established through the SunGrains™ cooperative breeding initiative, which includes contributions from the University of Arkansas, Clemson University, the University of Florida, the University of Georgia, Louisiana State University, North Carolina State University, and Texas A&M University. The SunGrains™ effort aims to generate wheat lines that are responsive to the diverse conditions of the participating institutions. The varied genotype panel included in this research facilitates representation across many settings in the southern U.S., making it particularly effective for assessing performance under diverse environmental conditions often seen in this area.
To predict model accuracy across varying plot sizes, the 312 genotypes were planted in two different plot types: smaller head row-sized plots (SP) and larger yield trial-sized plots (BP). SP included unreplicated head rows arranged in three rows, each measuring roughly 0.933 square meters (1.53 m × 0.61 m), while BP (7-row), measuring 5.58 square meters (3.96 m × 1.41 m), was machine-planted. Trials were planted in mid-November of 2021 and 2022, organized in an augmented block design with one replication and 15 sub-blocks, which included repeated check genotypes to facilitate valid comparisons. Both BP and SP trials had 390 plots with repeated checks (AGS 3015, AGS 2024, and AGS 2060) known to be widely adapted to the southeastern United States. The checks were replicated within each sub-block, making up around 20% of the total plots. Both plot sizes underwent analogous management practices, characterized by uniform applications of fertilizer, herbicide, fungicide, and irrigation. This research exposed the lines to terminal heat stress at the grain-filling phases, since Citra often encounters temperatures beyond 30 °C during the critical post-anthesis period. By growing the same genotypes in both SP and BP trials, the link between performance in the small head-row plots and that found in larger yield trials was assessed.
2.2. Trait Measurement and UAV-Derived HTP
Data were collected on days to heading (DTH), GY, and other UAV-based HTP metrics, including normalized difference vegetation index (NDVI), canopy temperature (CT), and hyperspectral imaging (HSI). The experimental location in Citra, FL, consistently received elevated ambient temperatures surpassing 30 °C throughout the grain-filling stage in both years, which can cause the genotypes to experience heat stress during the reproductive stages. DTH was documented as the duration in days from planting until 50% of the plants attained heading, using the Zadoks growth scale [
22]. GY was assessed using a combine harvester for the BP and SP, with the harvested grain weight standardized to a moisture content of 13% and expressed in kg ha
−1. Yield values were recorded on a per-plot basis for over 300 individual genotypes across the two growing seasons, providing the dataset for model development and validation.
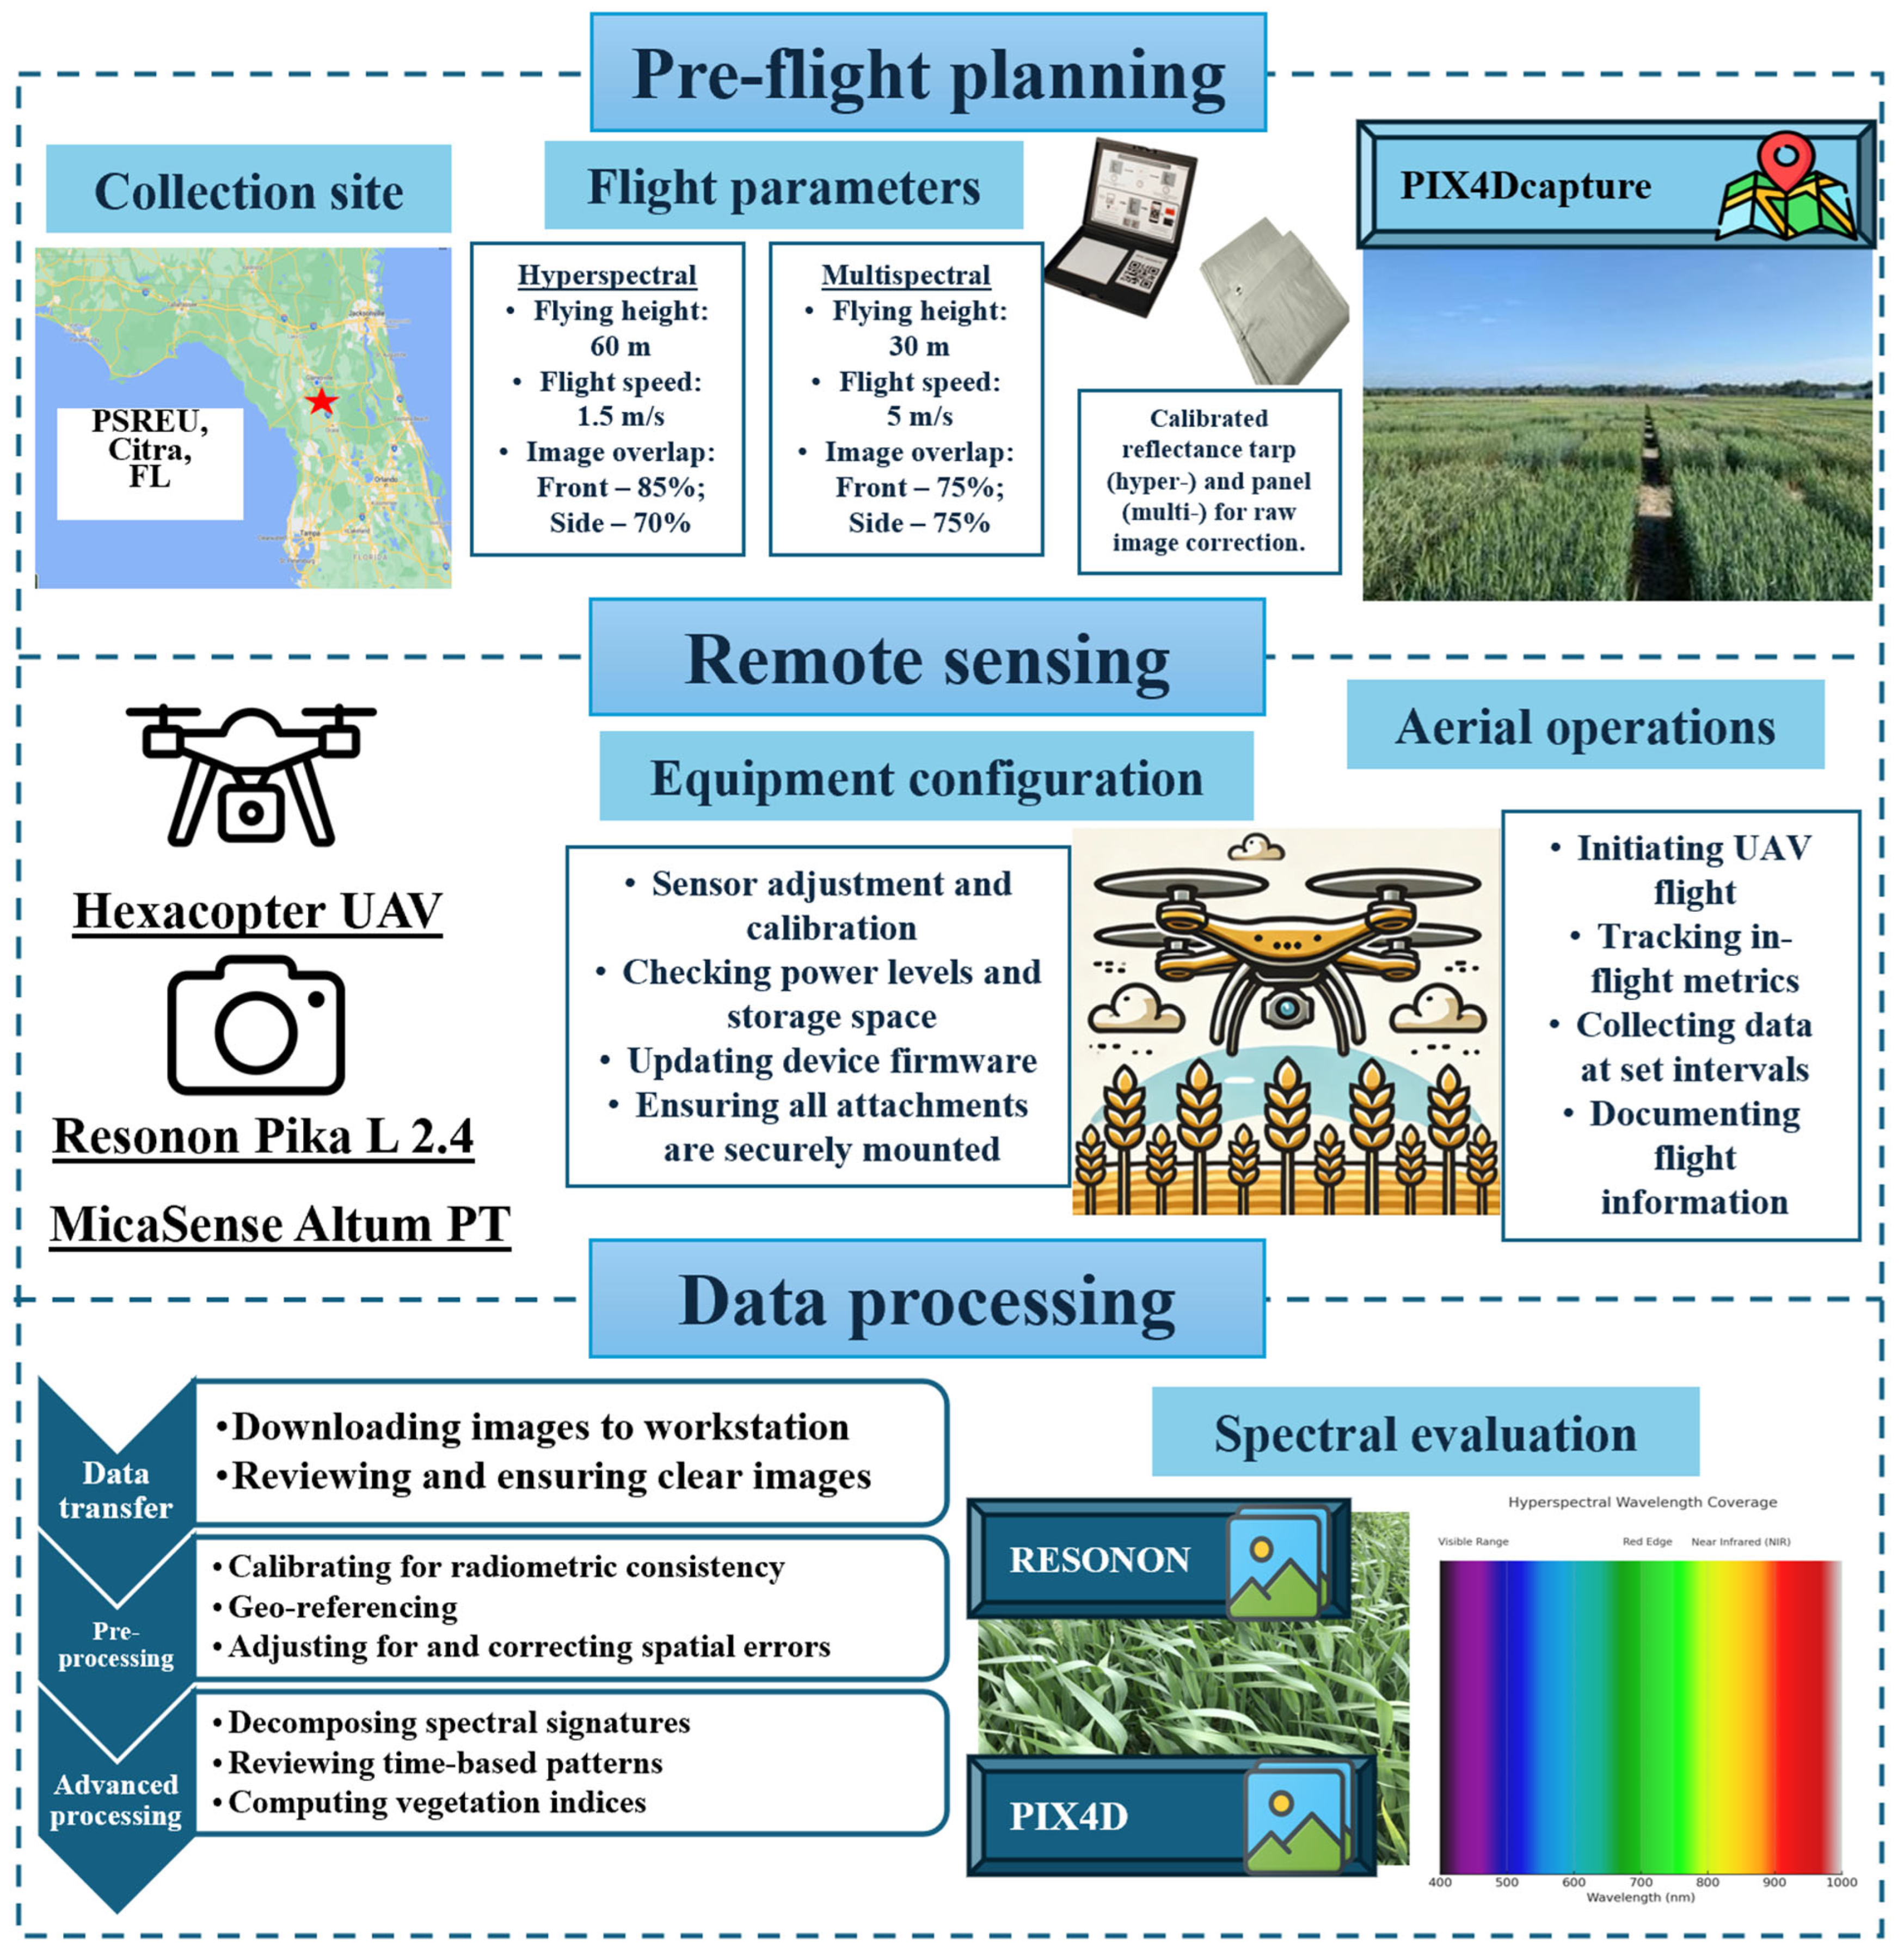
Multispectral NDVI and thermal CT data were acquired using a quadcopter UAV outfitted with the MicaSense Altum PT sensor, Shenzhen, China, which offers both multispectral and thermal imaging functionalities. UAV flights were executed twice throughout the growing season, with the first flight being conducted 5–7 days post-heading and the second flight happening two weeks later, aligning with critical growth phases indicative of GY [
23]. The UAV operated at a height of 30 m and a velocity of 1.5 m per second (m/s), achieving an 85% frontal overlap and a 70% lateral overlap between photographs to guarantee thorough coverage. Data were collected at solar noon and under clear weather to reduce the influence of cloud cover. The NDVI and CT data were processed using Pix4Dmapper to create orthomosaics, which were further analyzed in QGIS with the zonal statistics plugin to achieve plot-level averages for NDVI and CT.
Hyperspectral data were acquired with a hexacopter UAV equipped with a Resonon Pika L 2.4 hyperspectral camera (Resonon Inc., Bozeman, MT, USA). The UAV system operated at a typical height of 60 m and a speed of 1.5 m/s, with a front overlap of 85% and a side overlap of 70%, consistent with the multispectral and thermal flights. The Pika L camera acquires data within a spectral range of 380–1020 nm, segmented into 300 narrow bands. Two hyperspectral UAV flights were executed as well, with the timing remaining the same, where the first flight is about one week after heading, and the second flight two weeks thereafter. The data from both flights were averaged to account for temporal variance and minimize noise. The hyperspectral reflectance data were analyzed using Spectronon Pro software (version 3.4.11; Resonon Inc., Bozeman, MT, USA) for calibration and georectification, with regions of interest (RoIs) manually delineated for each plot.
Figure 1 offers a visualization of the workflow for the UAV data collection process.
Both of the UAV-derived HTP datasets underwent calibration utilizing standard reflectance panels and were adjusted for radiometric consistency. For multispectral and thermal data, a calibrated reflectance panel was imaged at the beginning and end of each UAV flight to account for ambient light variability and sensor drift. Raw digital numbers were converted to surface reflectance using the Pix4Dmapper software (version 4.8.4; Pix4D S.A., Lausanne, Switzerland) that applies empirical line correction based on the reflectance panel values. The hyperspectral data were radiometrically corrected using Spectronon Pro software, incorporating dark current subtraction and flat-field correction. Dark current correction removed sensor noise from shutter-closed exposures, while flat-fielding addressed spatial variations in sensor sensitivity using lab-acquired calibration frames.
The spatial corrections conducted included image alignment, orthomosaic generation, and georeferencing. A structure-from-motion approach was used to stitch overlapping images into high-resolution orthomosaic images of the fields. Ground control points (GCPs) distributed across the field were collected using an RTK-GNSS receiver and manually linked in the image processing software to enhance spatial precision. Ortho-mosaics were georeferenced to the WGS84 coordinate system.
Multispectral, thermal, and hyperspectral datasets were all analyzed using zonal statistics to extract spectral fingerprints from each plot. These statistics were calculated in QGIS (version 3.28.3; QGIS Development Team, Open Source Geospatial Foundation Project) as well as the previously mentioned Spectronon Pro software by overlaying field plot shapefiles and extracting per-plot summaries across image layers. The high-dimensional HSI data includes hundreds of narrow spectral bands that serve as potential spectral indicators, which can be used as predictive covariates in multivariate genomic selection models. NDVI, CT, and reflectance data from HSI were ultimately combined with SNP marker data to build integrative models for predicting GY. All UAV-derived features were linked to ground truth yield measurements at the individual plot level using unique genotype and plot identifiers. The final dataset used in modeling included all entries, ensuring statistical robustness. Prior to modeling, all predictor variables were standardized (mean = 0, SD = 1). Each plot was georeferenced to a specific genotype using a master field layout file to ensure consistent tracking across all UAV flights and seasons. Spectral and thermal traits were averaged across replicate flights to account for day-to-day variation and reduce environmental noise. For modeling, all genotypic data entries were included, totaling 312 unique wheat lines across two years. Figures showing only a limited number of points (e.g., n = 40) were designed for visual clarity and do not represent the actual validation dataset size.
2.3. Genotyping
Genetic characterization of wheat genotypes was conducted using a genotyping-by-sequencing (GBS)-based SNP markers. High-quality DNA was isolated from the leaf tissue of immature wheat seedlings using the sbeadex plant maxi kit (LGC Biosearch Technologies, Teddington, UK) on an oKtopure automated extraction equipment (LGC Genomics LLC, Teddington, UK). The GBS libraries were constructed via a two-enzyme digestion process with the restriction enzymes PstI and MspI. The fragmented DNA samples were ligated to unique barcoded sequencing adapters for each sample. A total of 384 uniquely barcoded libraries were combined and sequenced using Illumina Novaseq 6000 SP flowcells, with a read length of 100 base pairs (Illumina Inc., San Diego, CA, USA).
Sequencing reads were aligned to the International Wheat Genome Consortium [
24] RefSeqv1.0 reference genome using Burrows-Wheeler Aligner (BWA) version 0.7.12. SNP calling was performed with the TASSEL 5GBSv2 pipeline version 5.2.35. Markers exhibiting over 80% missing data, minor allele frequencies (MAFs) below 0.05, or heterozygosity above 10% were eliminated to maintain dataset quality. The filtering technique removed unreliable markers and enhanced the precision of future studies. The Beagle version 5.2 program was used for data imputation to resolve missing data issues. This approach utilizes linkage disequilibrium and k-nearest neighbor algorithms to predict absent genotypic values, hence enhancing the completeness of the genomic dataset. Following filtering and imputation, a final collection of 15,337 high-quality SNP markers was preserved, yielding a thorough genomic profile for each of the wheat genotypes.
2.4. Phenotypic Data Analysis
For each year, an ANOVA was carried out with the purpose of estimating the genotypic effect. The best linear unbiased estimates (BLUEs) were obtained for GY and the aerial-HTP derived spectral traits of NDVI, CT in degrees Celsius, and HSI data, separately for both the SP and BP trials. This is useful for removing biases from the fixed effects, ensuring that the effects of genotypes are properly estimated. For that, the R packages “lme4” version 1.1-7 and “emmeans” version 1.11.1 [
25] were implemented. In the model used to extract the BLUEs, the genotypes were treated as fixed effects, while both environment and block were considered random.
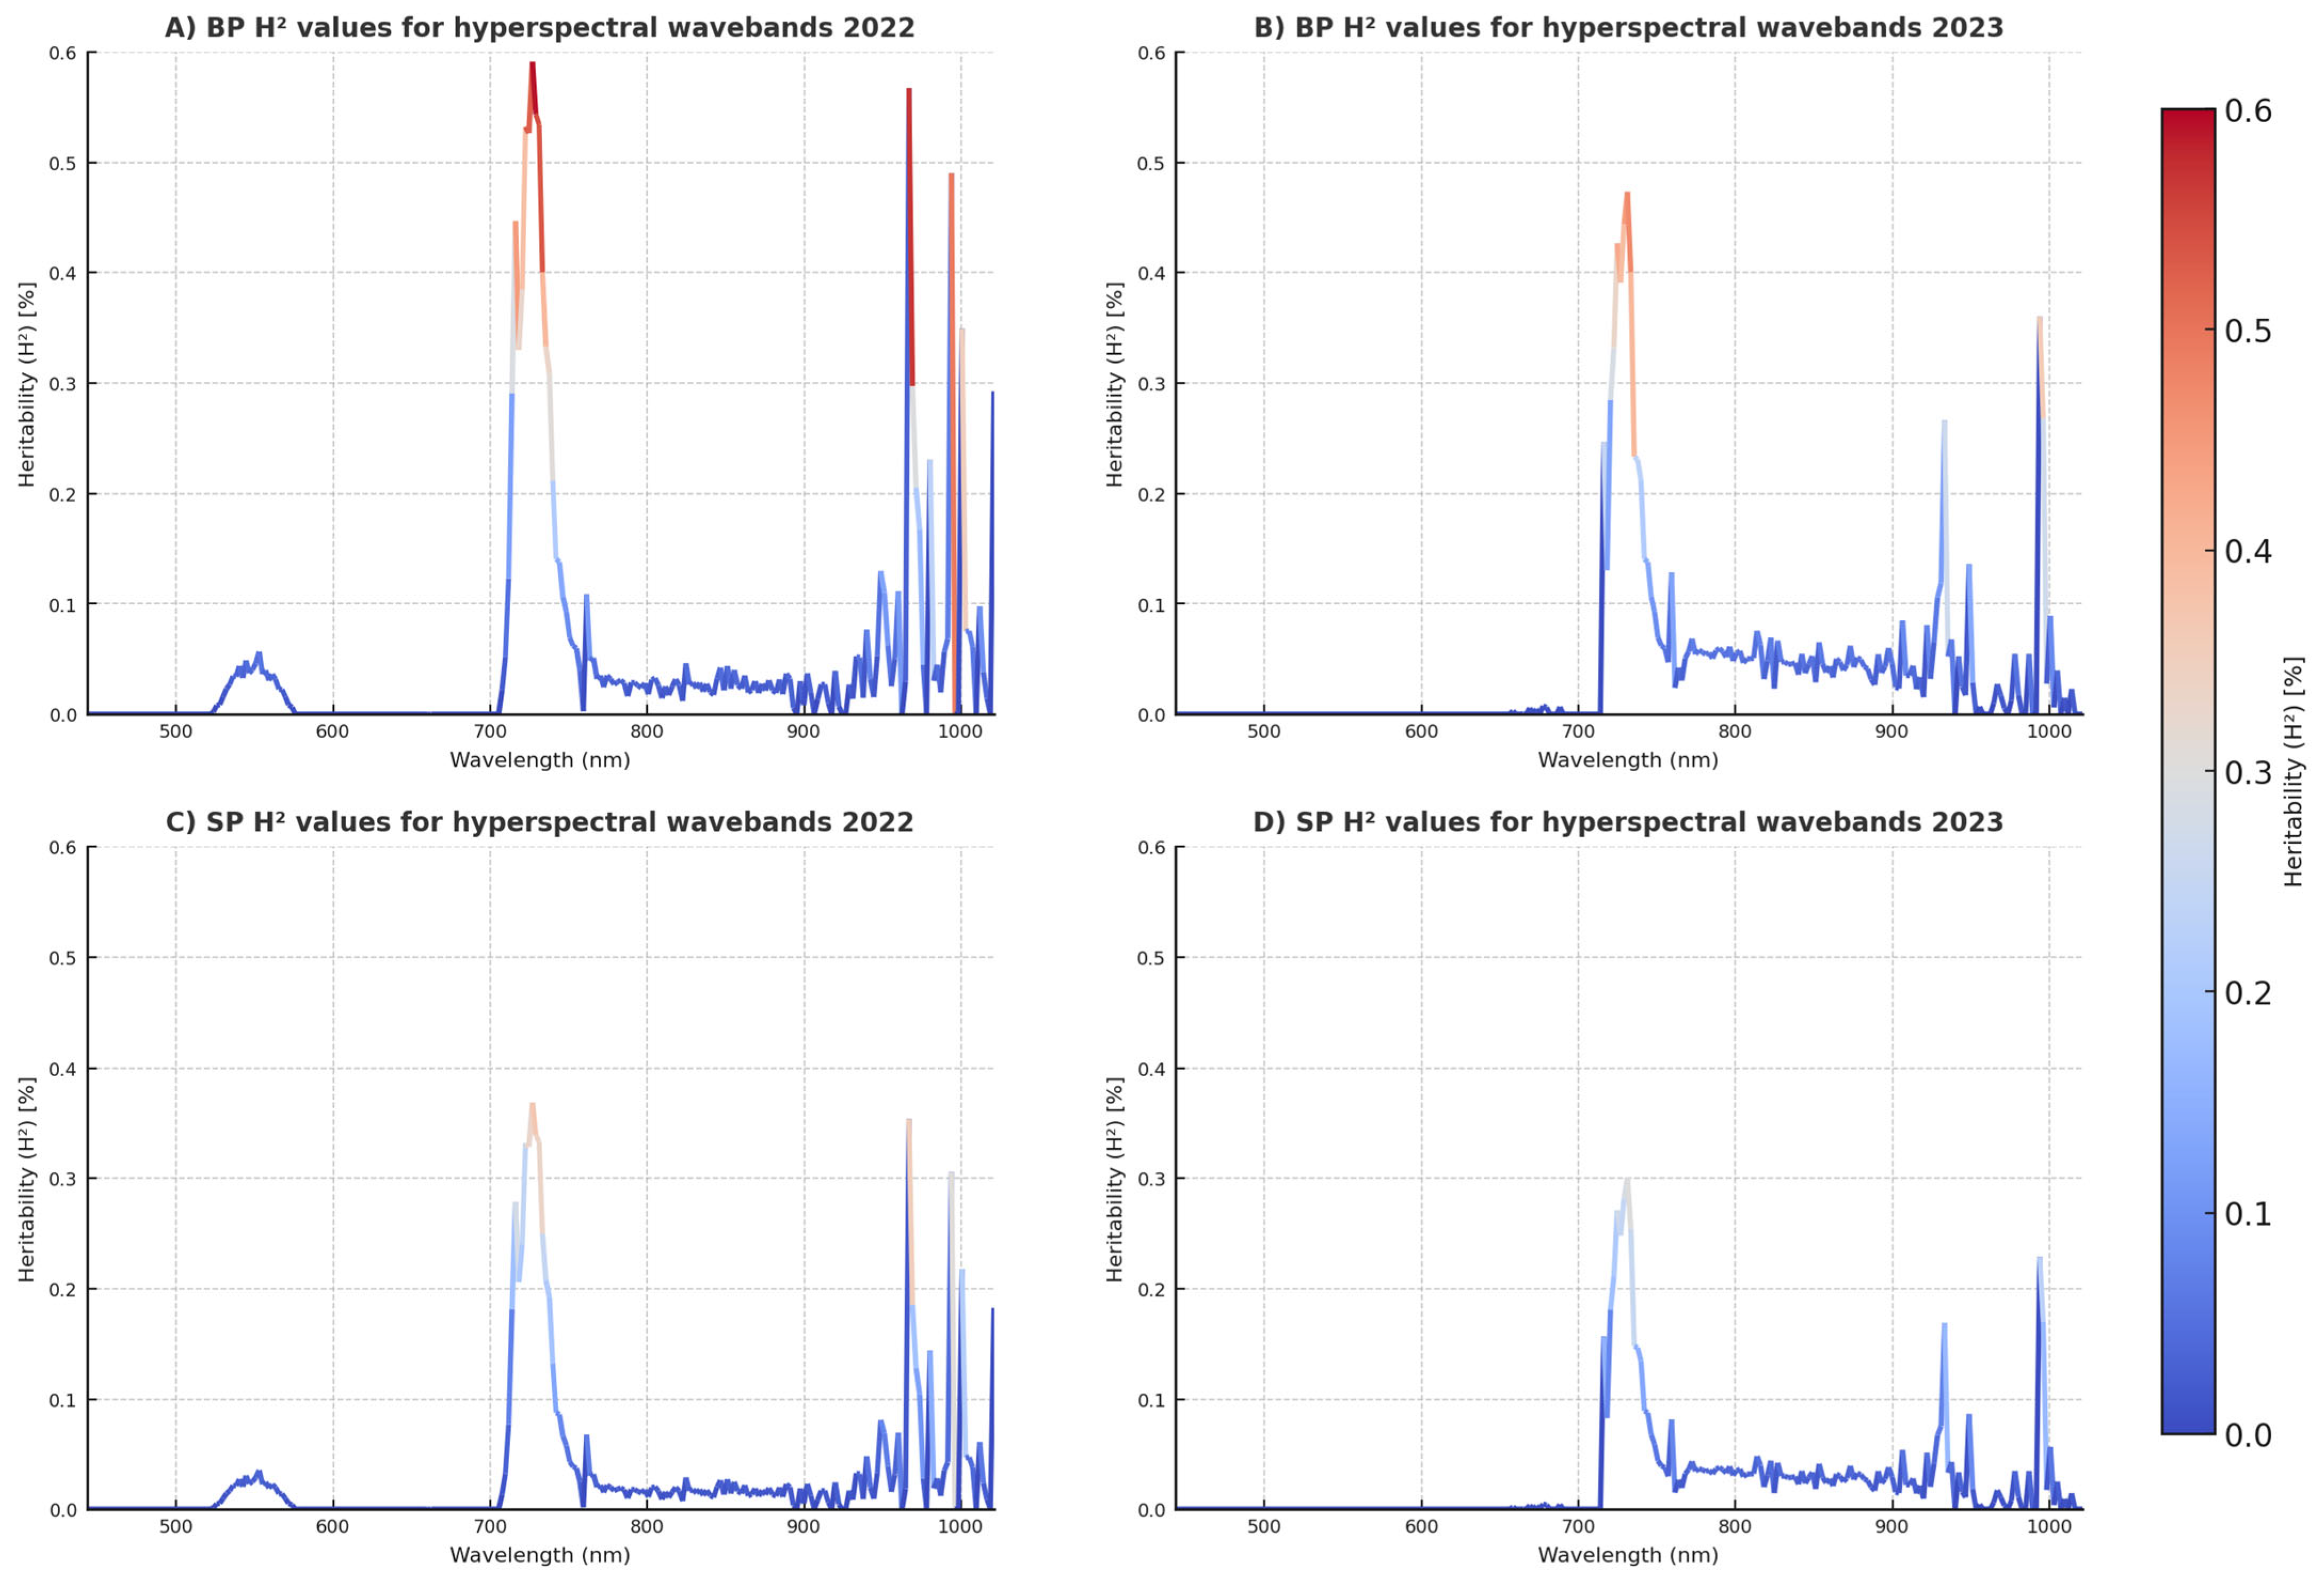
The block and error terms were assumed to follow independent normal distributions. DTH was included as a covariate to adjust for any potential confounding effects due to differences in phenological development, as DTH is often linked to GY, NDVI, and CT. Along with the BLUEs, variance components were extracted to compute broad-sense heritability (H2) by applying a model in which both genotype and block were used as random effects. From these variance components, H2 was calculated for each trait within each environment. By estimating H2, it is possible to quantify how much of the trait variation is attributable to genetic differences, providing information on how strongly the trait is controlled by genetics versus environmental factors. This helps assess the reliability of selecting certain traits under different environmental conditions. Separately analyzing each plot type (SP and BP) allows for an evaluation of genetic performance across environments and plot sizes.
2.5. Prediction Models
The research used five separate models to predict GY for wheat lines using several data types: genomic data (G), UAV-derived multispectral and thermal data (M), and UAV-acquired hyperspectral data (H). The BP and SP datasets were used separately for each model for yield prediction in BP trials. Genomic data were universally applicable across all lines, but M and H were used variably for each plot type. The models using BP-derived HTP data were designated B1 to B4, whilst those employing SP-derived HTP data were designated S1 to S4.
2.5.1. Genomic Data Model (G): B0
This model incorporated only G data (SNP markers) as predictors. SNP marker-based models are useful for identifying the genetic effects that contribute to yield, and this model provides the baseline for comparison. The model was applied exclusively to BP yield prediction and did not incorporate any HTP data. The equation for model B0 is as follows:
where
is the BLUE for GY of the ith genotype,
μ is the general mean,
is the genomic effect of the
ith genotype, with the vector of genomic effects
following a multivariate normal distribution such that
~N(0, G
) and
represents the genomic relationship matrix, and X is the standardized and centered (by columns) matrix of
p SNPs,
is the corresponding variance component; and
with
is the error term variance.
2.5.2. Multispectral and Thermal Data Model (M): B1 and S1
This model integrated UAV-based NDVI and CT data (M) into the predictions for BP GY. These models captured phenotypic differences observable through aerial HTP data and allowed the assessment of how well spectral and temperature-based indices could predict yield. Model B1 utilized M data from BP, while S1 used the same data but taken from SP. The equation for this linear predictor was:
where
is the main effect of the NDVI and CT kernel for the
ith genotype, representing the phenotypic information derived from UAV-based sensors (
Z). Where the joint distribution of the vector of phenomic effects is modeled as
, such that
represents a relationship matrix with Z as a matrix made up of the centered and standardized BLUE values of the
m phenotypic traits and
denotes the corresponding variance component.
2.5.3. Genomic and Multispectral + Thermal Data Model (G + M): B2 and S2
To explore whether combining G with M data improves prediction accuracy, the G + M model incorporated both data types as predictors. Model B2 combined the data types when taken from BP trials, while S2 used SP data for yield prediction in BP. The equation for these models is as follows:
where the terms have been elaborated upon above, this model aimed to leverage both the genetic background and the environmental effects captured by HTP data to provide more precise predictions.
2.5.4. Hyperspectral Data Model (H): B3 and S3
These models were built using UAV-based hyperspectral data (H) to predict GY. Like before, model B3 utilized BP H data, while S3 utilized SP H data to predict BP yield. The equation is as follows:
where
represents the main effect of the hyperspectral data (
S) for the
ith genotype, such that
, where
is the hyperspectral-derived relationship matrix with S as a matrix made up of the centered and standardized BLUE values of the
q hyperspectral wavebands and
denotes the corresponding variance component.
2.5.5. Genomics and Hyperspectral Data Model (G + H): B4 and S4
Model G + H combined both data types to predict yield and assess whether the integration of both data types improves prediction accuracy. Model B4 used BP H data alongside G, while S4 combined SP-derived H with G to predict BP yield. The equation for this model is as follows:
Through combining genetic and phenotypic data from hyperspectral imaging, this model aimed to improve the predictive power for yield under both BP and SP conditions.
2.5.6. Genomic, Phenomic, and Environmental Interaction Model (G × E, M × E, H × E): B2F, B4F, S2F, and S4F
To further enhance the prediction accuracy and account for the impact of environmental variability on yield, models incorporating environmental interactions (G × E, M × E, and H × E) were developed. These models integrate genomic (G), multispectral + thermal (M), and hyperspectral (H) data along with their interactions with the growing environment, defined here by year. The interaction terms allow for the assessment of how genotypes and phenotypic traits respond to differences in seasonal conditions. For forward predictions, these models were applied to predict BP yield across years. For instance: B2F incorporated G + M + G × E + M × E data from BP; B4F incorporated G + H + G × E + H × E data from BP; S2F incorporated G + M + G × E + M × E data from SP; S4F incorporated G + H + G × E + H × E data from SP. The equation for these models is as follows:
where
is the genomic effect for the
ith genotype;
is the phenotypic effect (M or H) for the
ith genotype;
is the genotype-by-environment interaction effect for the
ith genotype, capturing the variability of genetic performance across environmental conditions;
is the phenotypic-by-environment interaction effect for the
ith genotype, capturing the variability of phenotypic traits across environments; and
is the residual error.
2.5.7. Machine Learning Models
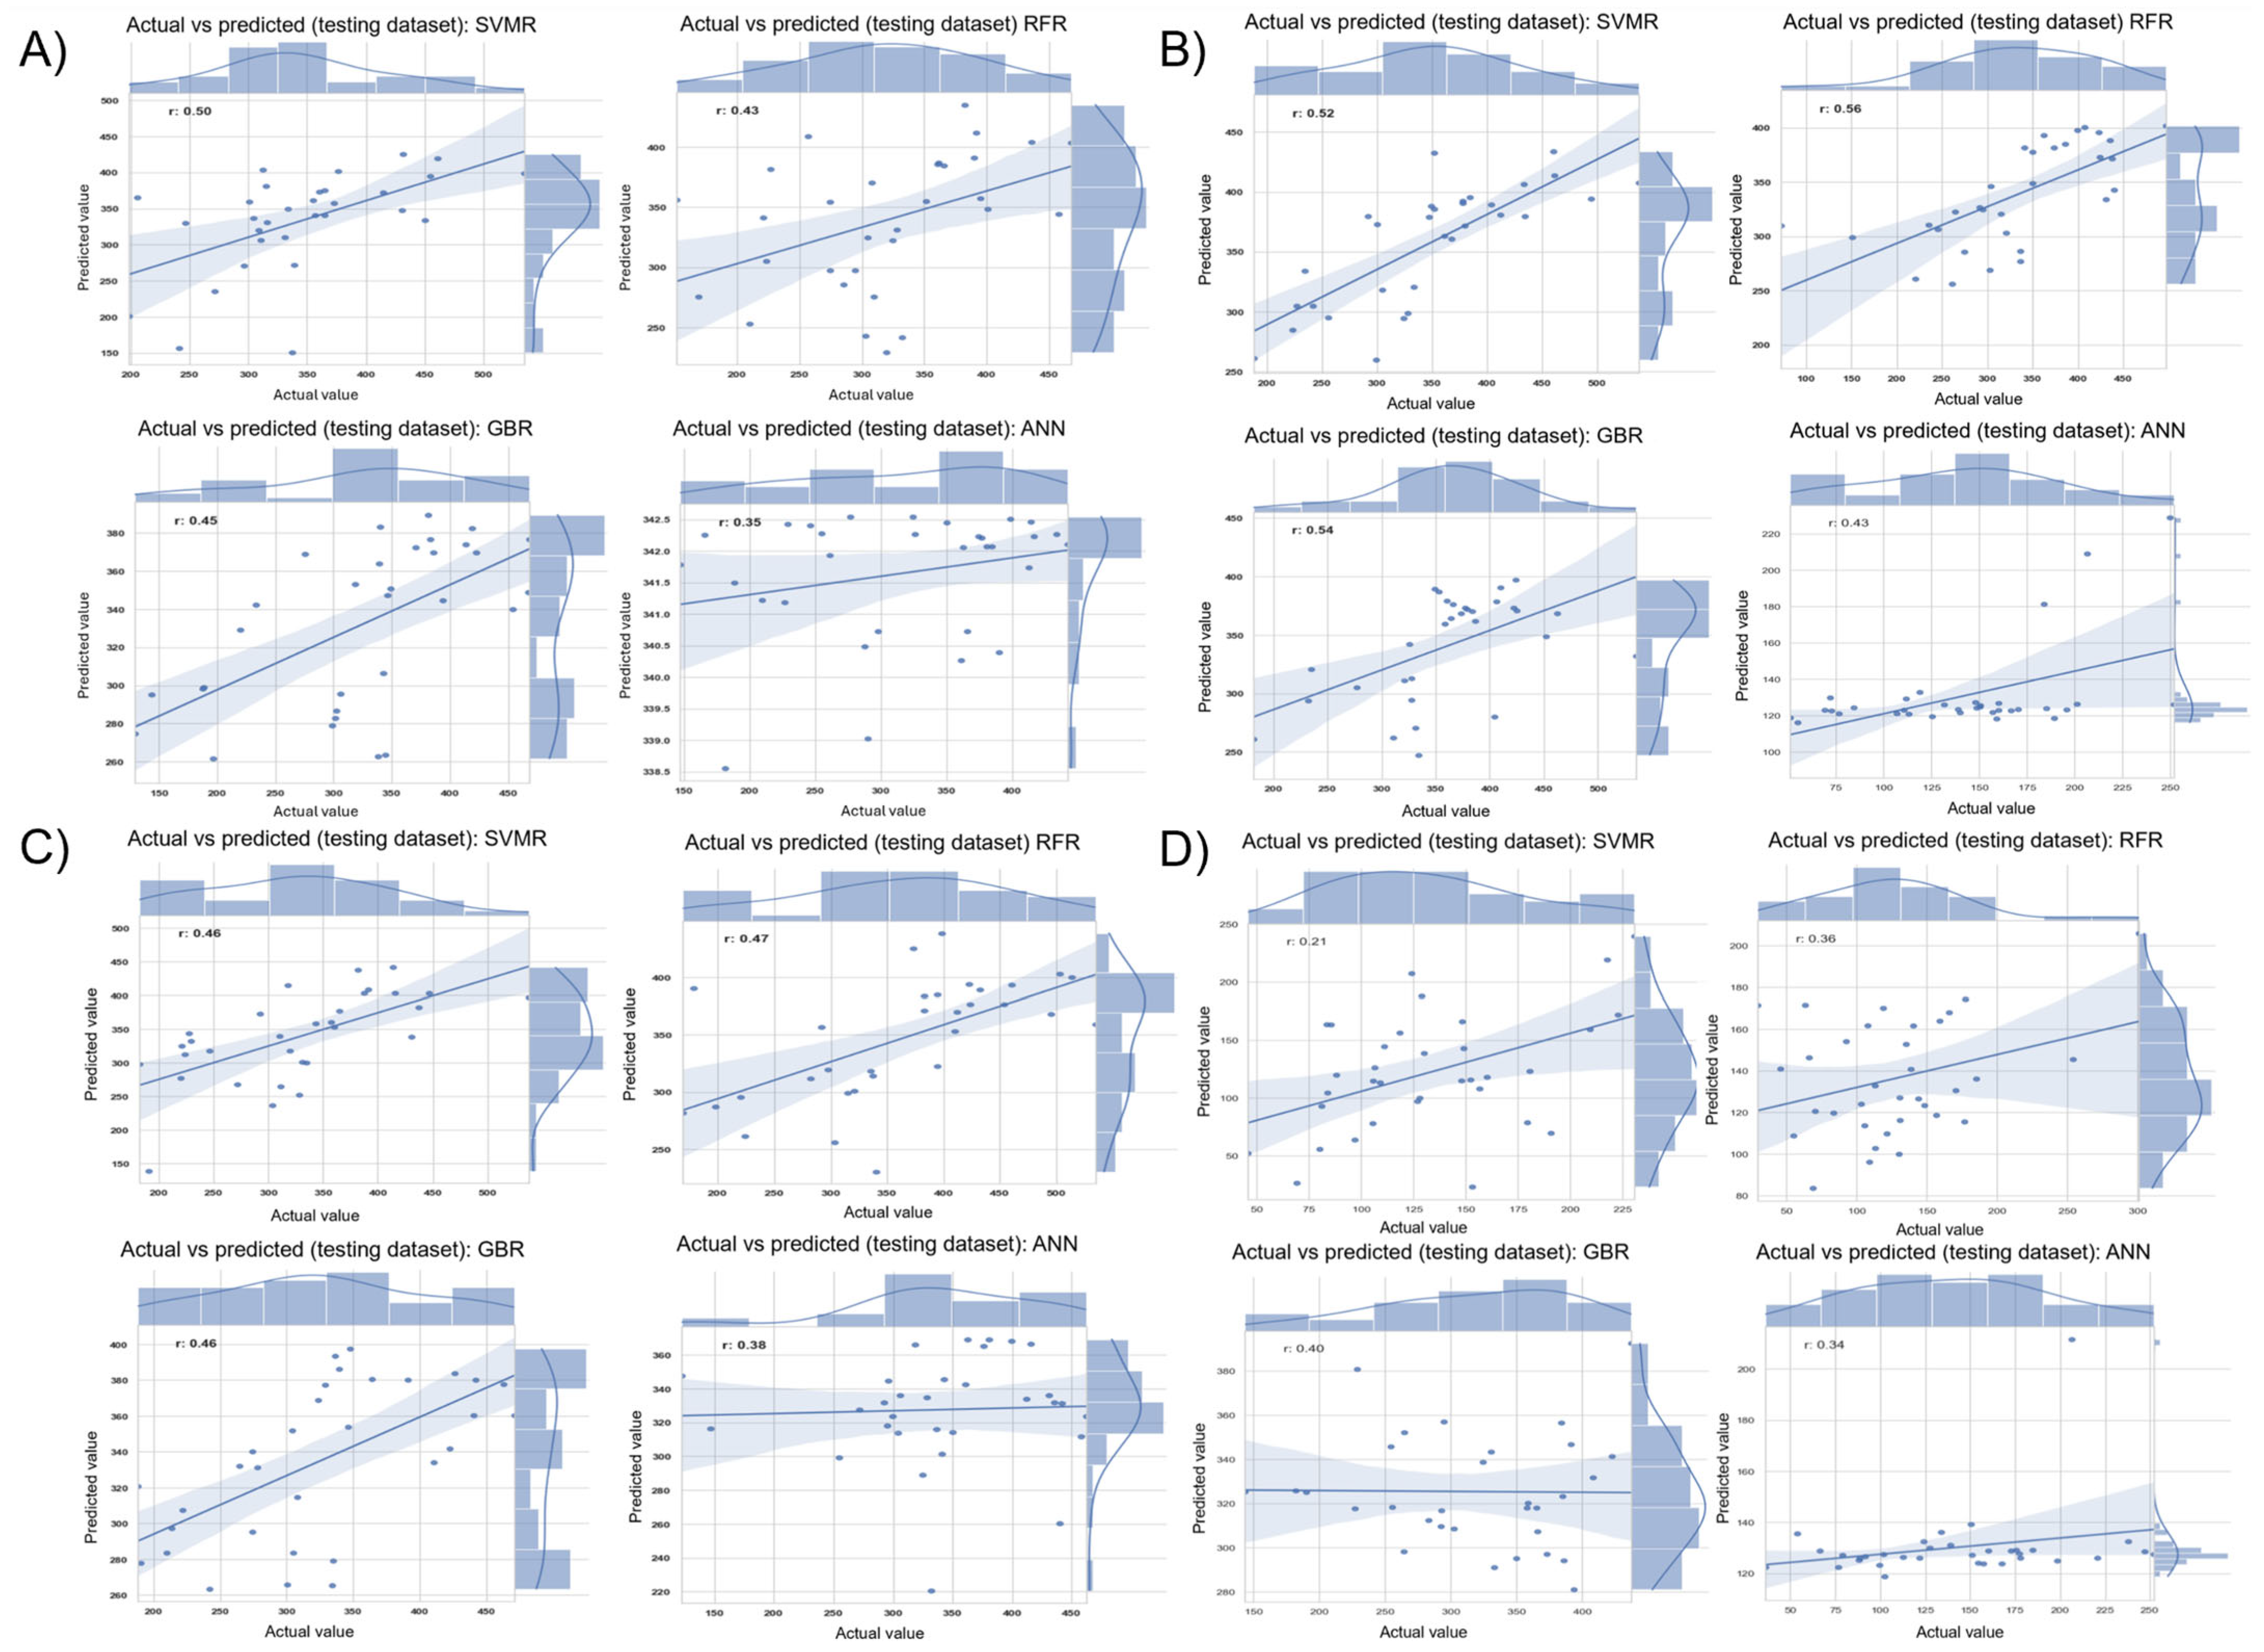
For the across-year GY prediction, several machine learning (ML) techniques using genomic (G), hyperspectral (H), and multispectral plus thermal (M) data were tested. Support vector machine regression (SVMR) was implemented for its ability to handle high-dimensional datasets with relatively small sample sizes. Random Forest Regression (RFR) was evaluated for its ensemble-based architecture, which constructs multiple decision trees on random subsets of the data and averages their predictions to reduce variance and overfitting. Gradient boosting regression (GBR) was tested for its capacity to iteratively improve performance through additive model construction. Lastly, an Artificial Neural Network (ANN) model was employed to capture complex, non-linear interactions between predictors and grain yield.
Hyperparameter tuning for all ML models was performed using a grid search strategy within each training fold, with five-fold internal cross-validation to identify the optimal parameter set. For SVMR, the regularization parameter (C: 0.1, 1, and 10), kernel type (linear or radial basis function), and kernel coefficient (gamma: ‘scale’, 0.1, and 1) were evaluated. RFR models were tuned across the number of trees (n_estimators: 100, 200, and 500), the number of features considered at each split (max_features: ‘sqrt’ and ‘log2’), and maximum tree depth (10, 20, or unrestricted). For GBR, tuning included learning rate (0.01, 0.05, and 0.1), number of estimators (100, 200, and 500), and tree depth (3, 5, and 10). ANN models were tested with various architectural and training configurations, including the number of hidden layers and neurons (e.g., 1 × 64, 2 × 64, and 2 × 128), activation functions (ReLU or tanh), batch size (32 and 64), learning rate (0.001 and 0.01), and optimizer (Adam). Final hyperparameter combinations for each model were selected based on the configuration that minimized root mean square error (RMSE) on the internal validation set within each fold.
All multivariate data combinations (e.g., G + M, G + H, G + M + E, etc.) were structured by horizontally concatenating the standardized predictor matrices (genomic markers, vegetation indices, and/or hyperspectral bands) for each line into a single design matrix. This matrix was then used as input for each model. For ANN models, a feedforward fully connected architecture was used, where the final output layer contained a single neuron with a linear activation function for grain yield prediction. All predictors were standardized prior to model training, and missing values (if any) were imputed using mean imputation within each feature set.
2.6. Cross Validation
A CV2 strategy like the one outlined in Jarquin et al. [
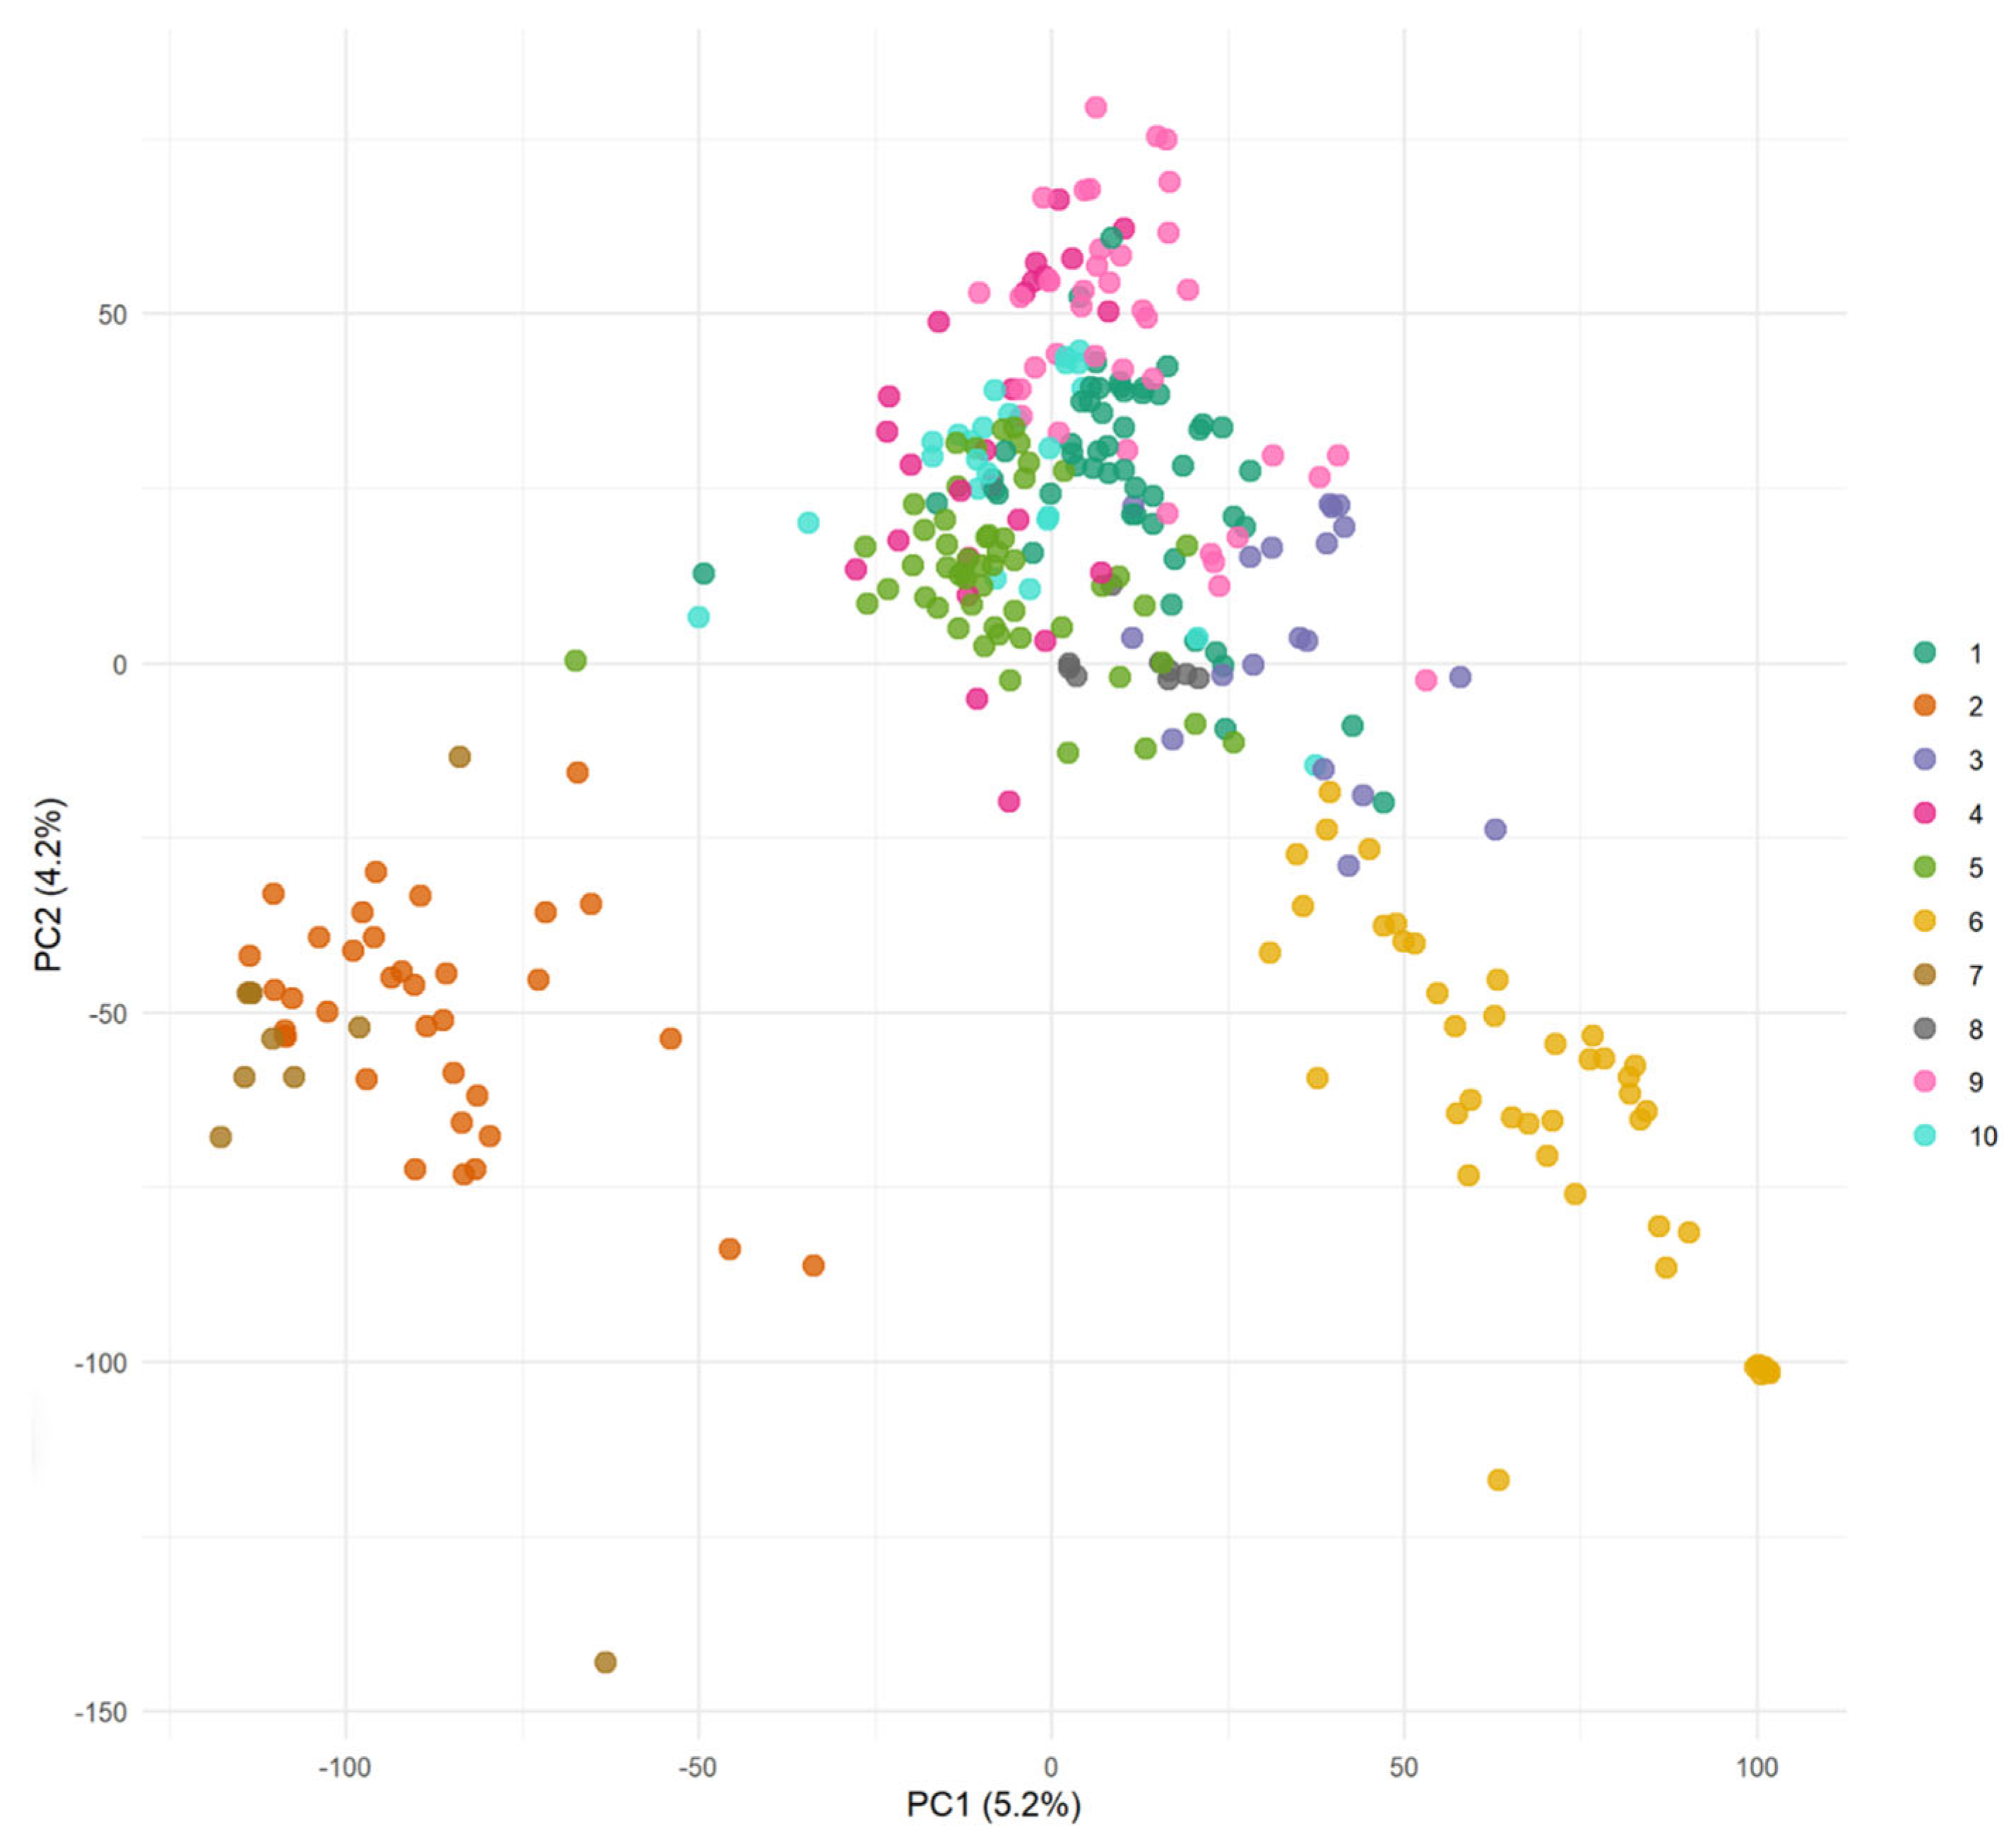
26] was used for within-year predictions. The population was divided into 10 clusters via discriminant analysis of principal components (DAPCs), which utilized year-specific SNP genotyping data to control for relatedness in the training and validation sets. This year-specific stratification ensured that clusters were unique to each year, avoiding any overlap of genotypes across years. The number of clusters was selected using the Bayesian Information Criterion (BIC), which identified the most parsimonious clustering configuration. PCA was separately used to visualize the population structure and confirm the presence of subgroup differentiation, but not for assigning clusters. This combined approach ensured that subpopulation structure was accounted for while preserving transparency in genetic diversity. The dataset was divided into five cross-validation subsets, with each subset serving as the validation set once, while the other four subsets constituted the training set. The procedure was carried out ten times, where 20% of the phenotypic information was concealed for validation inside each fold.
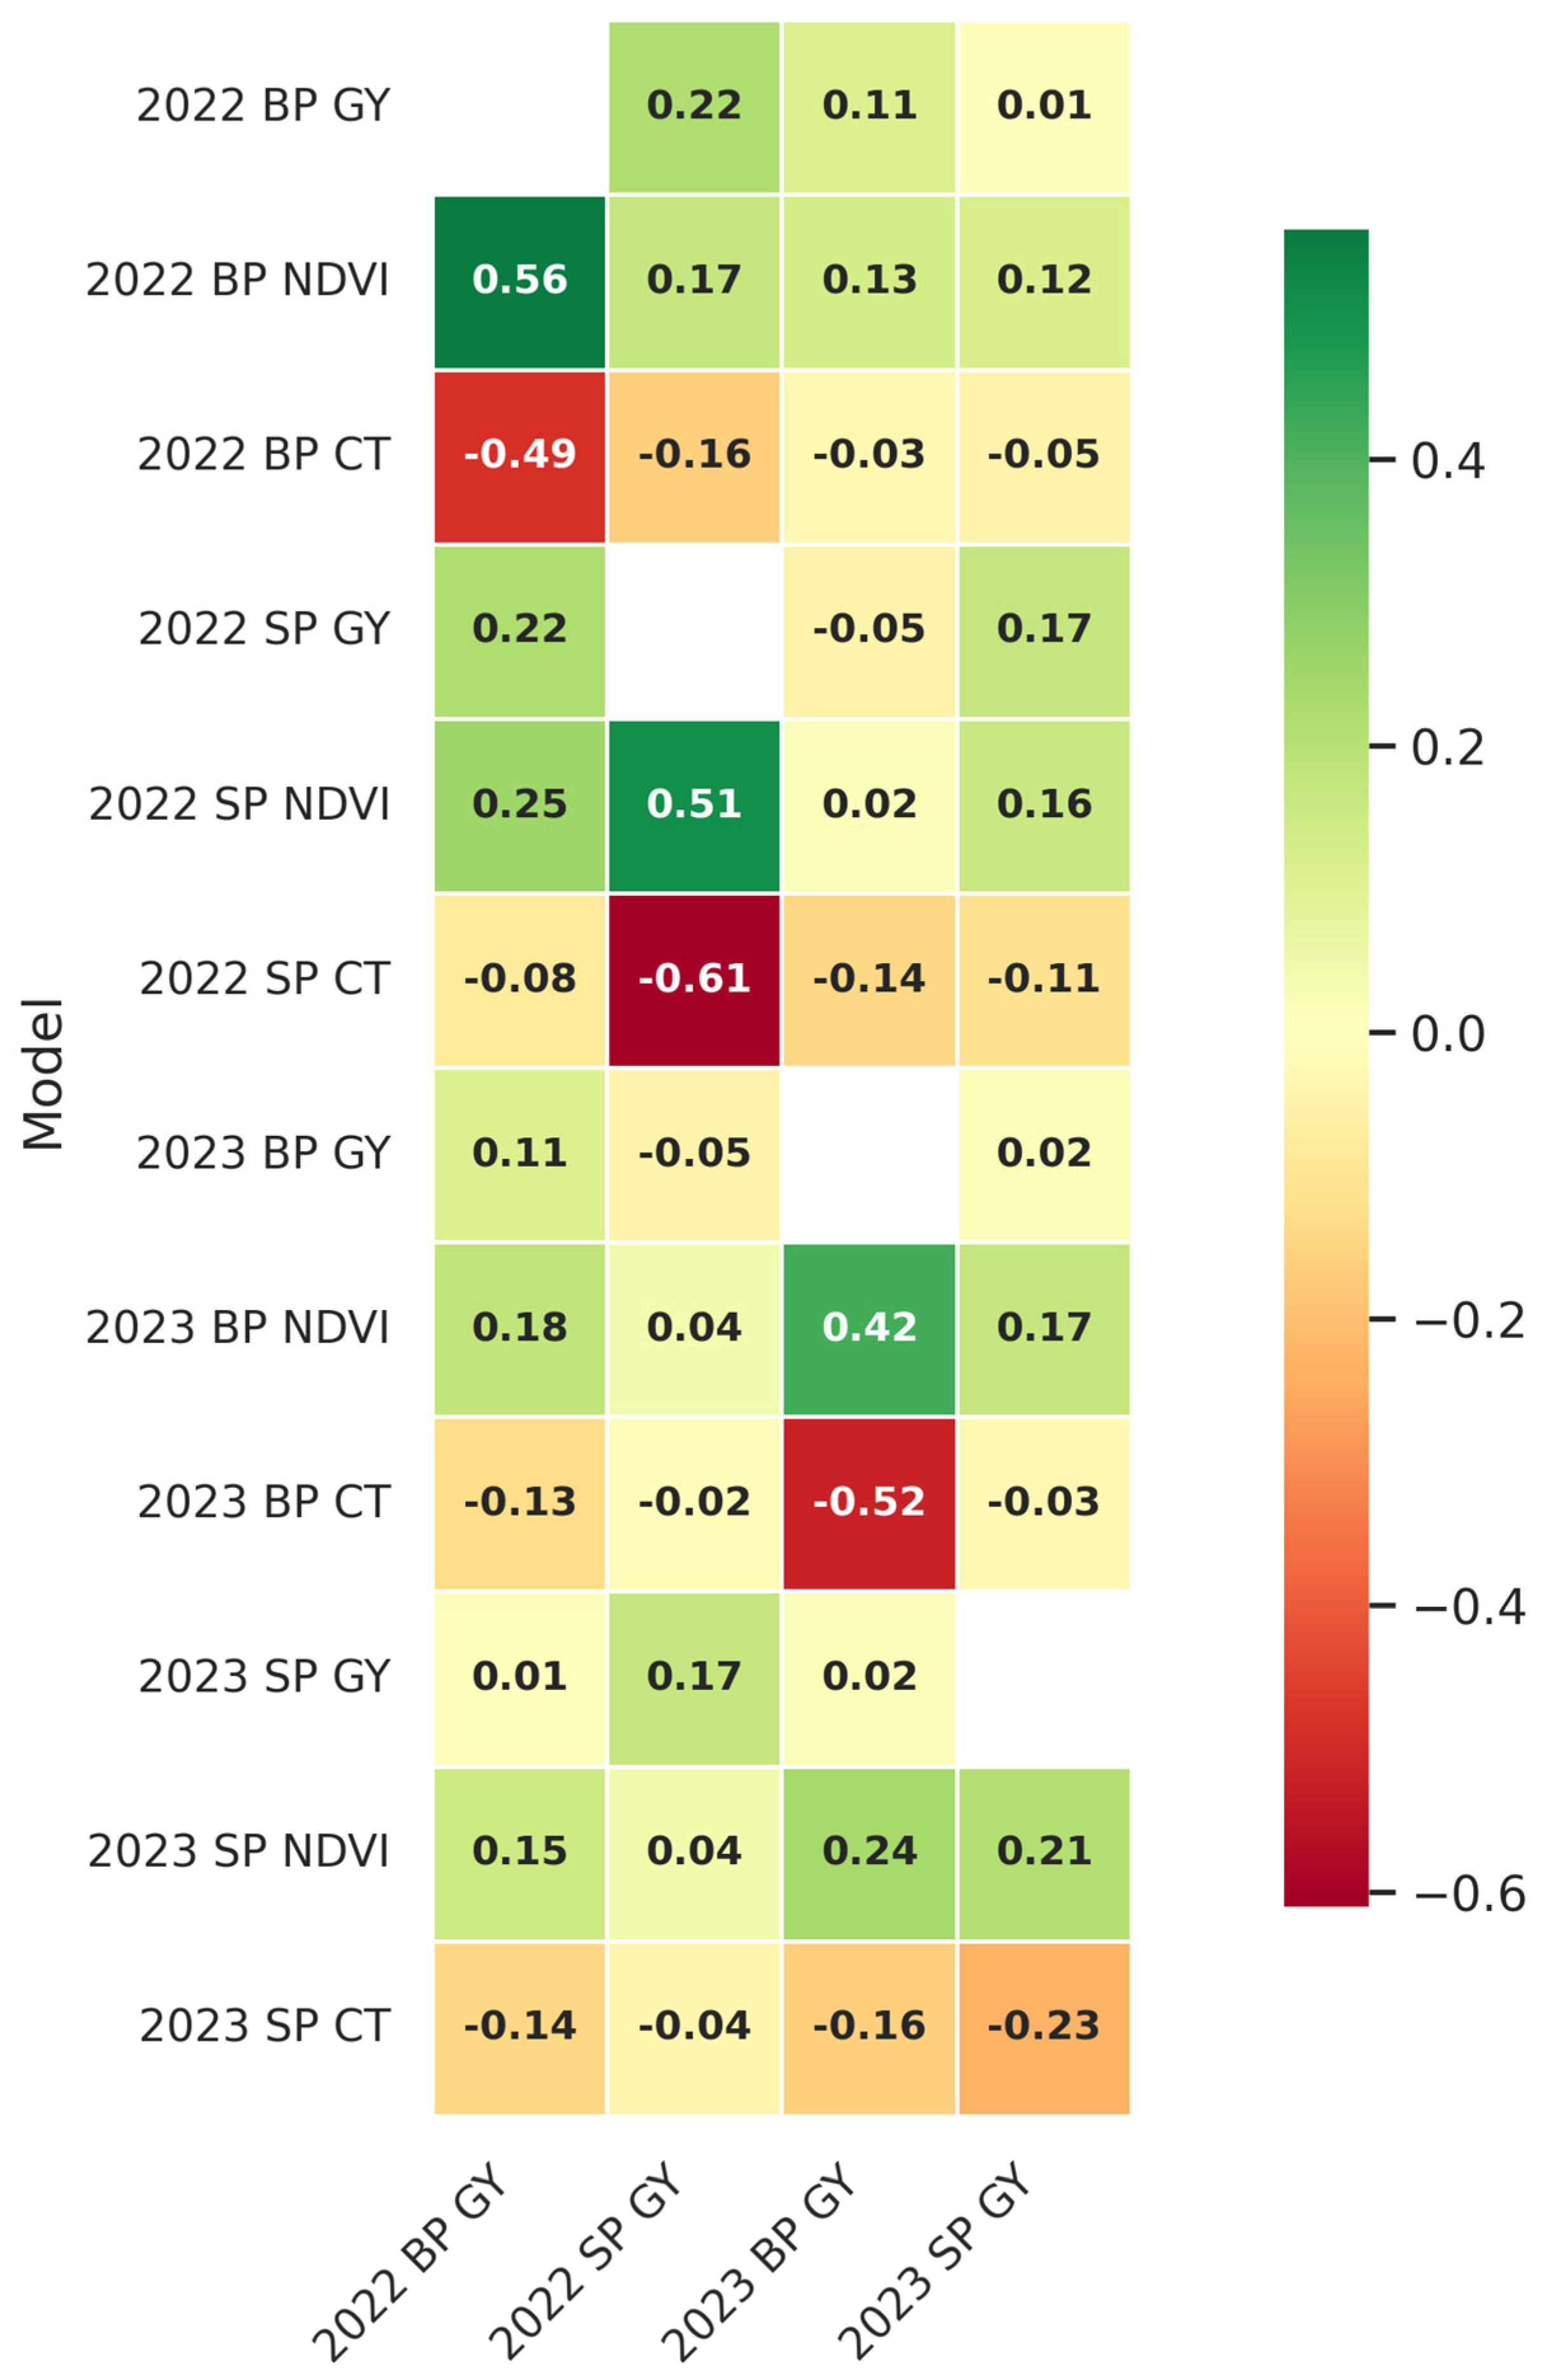
In the forward prediction scenario, a methodology was used to replicate authentic breeding circumstances, using data from previous years to predict performance in the following years. This predictive scenario evaluated the efficacy of models based on data from 2022 in predicting the yield of genotypes for the next year, 2023. This method offered insight into the models’ capacity to generalize across annual variations. Conversely, since the same genotypes were grown in both years, we leveraged the 2023 data to predict the 2022 results as well. To evaluate model performance within each environment, the Pearson correlation (ρ) between predicted and observed values was calculated. The coincidence index (CI) was used to assess the effectiveness of different models in identifying top-performing genotypes in forward prediction scenarios. The CI quantifies the proportion of genotypes shared between the predicted and observed top 25% for grain yield, providing a practical measure of a model’s utility in breeding programs where selecting superior genotypes is a key objective. To calculate the CI, the predicted rankings of genotypes were compared to their observed rankings for grain yield.
4. Discussion
One of the primary trends emerging from our findings was the difference found in predictive power between the SP- and BP-based models. Expectedly, the BP models, which benefit from larger plot sizes and greater environmental representation, generally showed superior GY prediction accuracies. With the increased plot size of GY trials, the advantage of capturing more environmental heterogeneity leads to more reliability in data collection, as observed in previous research [
27]. This sense of heightened environmental variability allows the BP-based modeling approaches to be better at generalizing across different locations and the conditions found therein. This is something vital for predicting yield stability across multiple years. However, the findings of our research imply that SP models have the potential to narrow this performance gap, especially when said models are enriched with the incorporation of HTP data. Although the SP trials by nature contain less environment variability, including UAV-based phenotyping sources like NDVI, CT, and HSI, as was performed in this research, allows for the SP models to capture a more exhaustive physiological profile of the genotypes being tested. Such added phenotypic depth can make up for the smaller plot size and make SP trials more viable for mid-stage selection [
28]. Our results suggest that although BP-based models typically achieve higher prediction accuracy, the SP-based models, when combined with HTP data, particularly NDVI and CT, performed reasonably well in comparison. Conveying the idea that even with the limitations inherent to the SP trials, when coupled with advanced phenotyping tools, they can still provide meaningful insights into GY selection.
Integrating HTP data sources into our approaches is critical for improving SP-based model performance, and though HSI is often seen as a powerful tool, in our current study, it did not manage to outperform more traditional methods like NDVI and CT. HSI offers high-dimensional phenotypic data by capturing reflectance across hundreds of narrow spectral bands, allowing it to detect subtle physiological traits that are closely linked to yield potential and are difficult to measure using simpler indices like NDVI and CT. However, HSI comes with significant drawbacks, including higher costs, greater technical complexity, and the need for more extensive data processing. In our case, despite its theoretical advantages, the SP models that relied on NDVI + CT outperformed those using HSI, suggesting that, under certain conditions, NDVI and CT are more practical and equally or more effective in capturing the key traits necessary for predicting grain yield from SP data [
18,
29].
The predictive accuracies observed in this study align well with findings from other wheat and small grain breeding studies that integrate genomic and HTP data. For example, Kaur et al. [
30], and Krause et al. [
19] demonstrated that combining genomic data with spectral indices or hyperspectral imaging can enhance grain yield predictions, reporting correlations ranging from 0.4 to 0.6 in stress environments. Similarly, Rutkoski et al. (2016) [
31] achieved accuracies between 0.4 and 0.7 using multi-trait genomic prediction models integrated with hyperspectral data. Our results, such as a forward prediction correlation of 0.51 for G + H models, are consistent with these findings, especially considering the use of data from a single environment. Further endeavors can incorporate multi-location trials could validate these findings further and explore their generalizability across diverse environments.
The physiological indicators of plant health, especially when identified in early-stage studies, provide a crucial insight into the genotype’s prospective efficacy in BP trials [
32]. Despite HSI data by nature being more information-dense, findings indicate that NDVI and CT, while effective for evaluating overall plant biomass and temperature, marginally surpassed HSI data integration in forward prediction scenarios using the SP-derived HTP data. The G + M model for SP forward prediction had a slightly superior accuracy (ρ = 0.45) compared to the G + H model (ρ = 0.43). This indicates that, in SP trials, NDVI and CT may just as or even more successfully capture essential features for yield prediction as does hyperspectral data in cross-year predictions. For the BP trials, HSI exhibited more predictive capability (ρ = 0.51) than NDVI and CT (ρ = 0.47), suggestive of HSI’s proficiency in identifying nuanced physiological responses essential for yield predicting in more expansive, heterogeneous contexts.
ML models showed variability in evaluating the prediction capability of the combined genomic and HTP data [
33]. The research examined different ML models, with RFR and GBR regularly identified as the top performers. These tree-based models proficiently capture the non-linear interactions among genetic, phenotypic, and environmental data, which are essential for managing high-dimensional information produced by UAV-based HTP systems. Our findings indicated that both RFR and GBR managed noisy data more effectively than SVMR and ANN, which encountered difficulties in situations characterized by significant environmental fluctuation, particularly with SP data. The enhanced effectiveness of RFR and GBR is likely attributable to their capacity to consolidate weaker predictors and decrease variation, which is essential in settings marked by significant volatility. Conversely, ANN models, which are prone to overfitting short datasets, were less adept at elucidating the intricate connections within our data, a phenomenon also noted in related yield prediction research [
34]. SVMR, while competitive, underperformed in our setting, perhaps owing to its need for bigger, more structured datasets to surpass tree-based models. While hyperparameter refinement was carried out to minimize overfitting during model training, the validation of these models was limited to performance in the same location (Citra, FL) across different years. Future studies leveraging multi-environment trial data could help confirm the broader applicability of these models by assessing their performance across diverse locations. The findings highlight the efficacy of ensemble tree-based methods for genomic prediction, especially in breeding programs functioning within intricate and variable contexts.
The specificity findings indicated that SP models integrating M and G data attained a maximum overlap of 51% with the highest-yielding lines that were observed in the BP trials. Showing that, despite reduced plot sizes and decreased environmental representation, SP models trained on G + M data may still effectively capture a significant amount of the top-performing lines. For forward prediction, using 2022 SP data to forecast 2023 BP performance, the specificity remained relatively high, with 43% to 45% of the top 25% lines being consistently recognized by the SP models for the BP yields. SP models, even when used for multi-year predictions, provide significant insights into high-yielding lines, although with a little decrease in predictive accuracy relative to within-year projections.
SP-derived models successfully identified a significant proportion of the high-yielding wheat lines recognized by BP-derived models, especially within the same growing season. The overlap in the top 25% of anticipated highest-yielding lines between SP and BP models demonstrates the potential of SP data to contribute to early selection decisions. For forward predictions, this overlap decreased, likely due to increased temporal variability influencing model predictions based on data from BP or SP trials. Nevertheless, SP models consistently provided meaningful insights for predicting GY performance in future years.
While achieving prediction accuracies of around 0.5 may seem modest, it is reasonable within the context of early-generation wheat breeding, where limited replication, small plot sizes, and consistent environmental variability appear to constrain model performance. In early-stage selection, where field trials are often unreplicated and constrained by limited seed or land, models with predictive correlations above 0.4 can provide enough signal to support enrichment of superior lines and culling of low performers. This is particularly relevant when HTP and genomic data are combined, as these approaches allow breeders to identify candidates worth advancing even before resource-intensive large plot trials are initiated.
In terms of predictor contribution, NDVI consistently emerged as a key variable across models, reflecting its well-established utility as a proxy for canopy vigor, photosynthetic efficiency, and overall biomass—factors closely tied to grain yield. In this study, we prioritized NDVI as the primary vegetation index due to its longstanding utility in yield prediction, biological interpretability, and consistent performance across environments. NDVI served as a reliable and widely accepted proxy for canopy vigor and biomass in our modeling framework. In practical terms, even moderate prediction accuracy allows breeders to eliminate a significant portion of underperforming lines, increasing selection intensity and reducing field costs without sacrificing long-term genetic gain. Prior studies have shown that genomic selection can deliver meaningful gains at similar accuracy levels [
35] and that multi-trait genomic models can further improve the prediction of complex traits like grain yield [
36]. While expanding the set of vegetation indices may marginally improve model performance, our findings indicate that NDVI alone captures the essential physiological variation relevant to yield under the conditions tested.
In terms of variable influence, vegetation indices like NDVI and CT consistently emerged as strong contributors in models using M data, aligning with their known associations with canopy vigor and thermal stress under heat conditions. In the hyperspectral models, reflectance features within the red-edge (~700–740 nm) and NIR (~750–900 nm) bands appeared to drive predictive performance, likely due to their linkage to chlorophyll content, biomass, and water status. Ensemble models such as RFR and GBR naturally provided variable importance rankings, from which these trends were inferred. The improvement in accuracy observed when combining genomic and phenomic inputs also suggests that these data types capture complementary biological signals relevant to yield performance across years.
The practical value of this framework lies in its ability to support early-stage selection decisions in wheat breeding using SP data, thereby reducing the resource burden associated with large-scale yield testing. By leveraging predictive models built on SP trials—especially when paired with HTP data such as NDVI, CT, and HSI, along with genomic information, breeders can enrich for superior lines and eliminate low performers earlier in the cycle. This enhances selection intensity and operational efficiency, particularly in the F5–F7 generations where replication is limited and seed quantity may restrict extensive BP evaluation. The scalability and non-destructive nature of UAV-based HTP platforms enable rapid, dynamic data collection across large populations, allowing for cost-effective prioritization of candidate lines [
37]. Although this study did not focus on identifying specific SNP markers, the demonstrated predictive value of genomic features highlights opportunities for follow-up analyses, such as SNP effect estimation or variable importance mapping, which may guide future marker-assisted selection efforts. Overall, while BP trials remain essential for final variety evaluation, SP trials, when augmented with HTP and machine learning models, offer a practical and scalable tool for accelerating genetic gain earlier in the breeding pipeline.
5. Conclusions
Through this research, the effectiveness of combining SP HTP and genetic data to predict GY in BP trials has been explored. Through the utilization of SNP markers and contemporary HTP data collection and integration techniques, namely NDVI and CT, and also HSI, accurate yield projections can be made earlier in the breeding cycle, thus presenting considerable opportunities to save time and expenses while enhancing selection intensity. Though BP size trials are the benchmark for yield prediction owing to their extensive environmental scope, the smaller plot trials, when integrated with HTP data and ML models, potentially could be a cost-efficient option for earlier selection. This method shows the potential to further optimize wheat breeding and expedite the creation of high-yield, hardy cultivars.
Although genomic and HTP data collection can involve additional investment, the potential savings from reducing the scale of downstream BP trials may offset these costs, particularly when early-stage decisions are improved. The intent of this framework is not to suggest that all breeding programs must adopt every data stream simultaneously, but rather to demonstrate how different data sources can be leveraged, individually or in combination, to improve predictive accuracy depending on available resources. For instance, in programs with limited access to hyperspectral imaging, models based on genomic and NDVI data alone still offer meaningful predictive value. Ultimately, the approach outlined here supports a flexible, modular strategy that breeding programs can adapt to their needs, allowing them to make evidence-based decisions about how and when to invest in more advanced phenotyping or genotyping tools.


 ,
, 


