Article

Thallium(I) Uptake and Accumulation by Wheat and Rice Plants

1
Department of Agricultural Chemistry, National Taiwan University, Taipei 106319, Taiwan
2
National Agricultural and Food Organization, Tsukuba 305-8604, Ibaraki, Japan
3
Department of Civil and Environmental Engineering, Massachusetts Institute of Technology, Cambridge, MA 02139, USA
4
Department of Plant, Soil and Microbial Sciences, Michigan State University, East Lansing, MI 48824, USA
*
Author to whom correspondence should be addressed.
Agronomy 2025, 15(12), 2918; https://doi.org/10.3390/agronomy15122918
Submission received: 5 November 2025 / Revised: 15 December 2025 / Accepted: 16 December 2025 / Published: 18 December 2025
(This article belongs to the Special Issue Soil Pollution and Remediation in Sustainable Agriculture)

Abstract

Thallium (Tl) is a highly toxic trace metal of increasing concern in agricultural soils. This study investigated the uptake, accumulation, and tissue-level distribution of Tl(I) in rice (Oryza sativa L.) and wheat (Triticum aestivum L.) grown in three agricultural soils differing in soil pH and texture. In the seedling pot experiment (0–100 mg kg−1 soil Tl), plant Tl concentrations increased dose-dependently, and were at least an order of magnitude lower in the alkaline soil than in the acidic soils. Bioaccumulation factors of roots and shoots generally exceeded unity and declined with increasing Tl dose in acidic soils, consistent with uptake saturation and physiological stress at high exposure. To elucidate how soil Tl speciation and pH regulate Tl availability, X-ray absorption spectroscopy (XAS) was used; it showed that Tl(I)—sorbed on illite was the predominant species in all soils (89–95%), with a minor fraction (5–11%) associated with non-specific adsorption. In maturity pots (5 mg kg−1 soil Tl), both crops grown in the moderately acidic, coarse-textured soil translocated a small fraction of absorbed Tl to grains, with wheat and rice containing 0.24 and 0.10 mg kg−1 Tl, respectively. Comparatively, plants in the more acidic soil failed to reach maturity, and grain Tl was not detected in the alkaline soil. LA-ICP-MS mapping revealed Tl enrichment in the bran and embryo of rice and in the crease, bran, and embryo of wheat, indicating that unpolished grains may pose higher dietary exposure risks than polished products. Overall, these findings demonstrate the key roles of soil pH and mineral composition in governing soil Tl availability and plant Tl uptake, whereas plant transport processes regulate grain Tl loading. In the absence of food-safety standards for Tl, the results of this study underscore the need to better understand and mitigate Tl transfer from contaminated soils into human food chains via cereal crops.

1. Introduction

Thallium (Tl) is a highly toxic element with a natural abundance in soils typically ranging from 0.2 to 2.8 mg kg−1 [1]. It occurs mainly in a thermodynamically stable monovalent state, Tl(I), with limited presence of Tl(III) [2]. Once Tl(I) is released into soils, Tl(I) can be readily taken up by plants and then transferred into the human food chain [3,4,5,6]. Background Tl concentrations in edible plants are generally low (0.03–0.3 mg kg−1) [7], but can be considerably higher in contaminated areas [5,8,9,10]. For example, Tl concentrations up to 500 mg kg−1 have been reported in green cabbage grown in contaminated soils in China [11], illustrating that plants can accumulate and tolerate Tl at elevated levels, making soil-to-plant transfer a critical exposure pathway. Previous toxicology studies showed that urinary Tl concentrations as low as 13–60 µg L−1 were associated with hepatic, renal, and myocardial dysfunction in children [12], and acute lethal doses for soluble Tl salts in humans were estimated at 10–15 mg kg−1 body weight, with fatalities reported at even lower exposures [13]. Reflecting this high human toxicity, the United States Environmental Protection Agency has established a maximum contaminant level of 2 μg L−1 for Tl in drinking water. However, no explicit food-safety limits have yet been established for Tl, including in staple cereal crops. Because elevated Tl accumulation in food crops represents a significant threat to human health, elucidating the mechanisms governing Tl uptake and accumulation in food crops is essential for evaluating and mitigating the risks associated with Tl-contaminated agricultural soils.
Plant uptake of trace elements, such as Tl, begins with their mobilization from soil particles through desorption or dissolution, enabling transport toward the root surface [14,15,16,17]. The fraction that becomes available to roots reflects the interplay between soil factors that control Tl chemical speciation and mobilization in soil, and plant traits such as root-system architecture (root length and density), rhizosphere modification, and the regulation of internal transport and detoxification [16,18,19]. For Tl, the monovalent Tl(I) species is highly soluble, with its retention by soils primarily governed by adsorption rather than precipitation [20,21,22]. The adsorption capacity of Tl(I) by soils is dependent on soil pH, CEC, and the abundance and type of soil colloids, especially clay minerals, Al/Fe oxides, Mn-oxides, and organic matter [21,23,24,25,26,27]. Micaceous clay minerals (such as illite, vermiculite, and smectite) exhibit a high affinity toward Tl(I) via interlayer/frayed-edge cation-exchange sites, where Tl+ ions can substitute for K+ and other cations [20,26,27]. Mn oxides not only bind Tl+ ions but can also oxidize Tl(I) to Tl(III), leading to Tl2O3 or Tl(OH)3 precipitation and further immobilization [28,29,30]. By contrast, Tl(I) sorption to organic matter, Al/Fe oxides, and kaolinite is primarily electrostatic [20,31,32,33], and thus non-specific as revealed by their similar XANES spectral features [26]. Because the retention of Tl(I) by soils is reversible [26], soil-solution Tl(I) can be replenished, implying high bioavailability to plants. Despite extensive evidence on these processes, how soil properties jointly regulate Tl uptake and accumulation in staple crops such as rice (Oryza sativa L.) and wheat (Triticum aestivum L.) remains poorly understood.
This study investigates the uptake and accumulation of Tl(I) in wheat and rice, two globally important staple crops that substantially contribute to the human diet. Given their high dietary consumption rates, Tl accumulation in their grains poses greater health risks than in most other crops. To evaluate the influence of soil properties on Tl behavior, three contrasting agricultural soils were selected to represent variations in pH (from acidic to alkaline) and texture (from fine to coarse), as soil acidity and clay mineral content are recognized as key factors governing Tl mobility and bioavailability [20,26,27,34]. Thallium speciation in soils was characterized using X-ray absorption spectroscopy (XAS) to identify dominant chemical forms. At the same time, Tl accumulation in plant tissues (roots, shoots, and grains) was quantified through bioaccumulation factors (BAFs). Furthermore, laser ablation inductively coupled plasma mass spectrometry (LA-ICP-MS) was employed to visualize the spatial distribution of Tl within wheat and rice grains, providing insights into potential exposure risks associated with polished versus unpolished grains. The findings of this study aim to enhance the understanding of soil–plant Tl transfer mechanisms and inform the reassessment of current soil quality standards to safeguard food safety and human health.

2. Materials and Methods

2.1. Soil Preparation

Soil samples were collected from agricultural fields in Taiwan that contained only their natural background Tl levels (0.36, 0.23, and 0.52 mg kg−1 for the Pc, Tn, and Tk soils, respectively), with no known anthropogenic Tl contamination: Pc soil (Typic Kandiudox, 24°54′27.9″ N 121°11′13.9″ E), Tn soil (Typic Dystrudept, 23°03′29.6″ N 120°19′44.0″ E), and Tk soil (Typic Dystrustept, 23°17′27.0″ N 120°20′28.2″ E). Samples were air-dried, ground, sieved (<2 mm), and stored in plastic containers. The basic properties and clay mineral composition of these soils are provided in Table S1. Briefly, the pH values of Pc, Tn, and Tk soils were 4.4, 4.9, and 8.2, respectively. The soil textures of Pc and Tk soils were silty clay loam, while Tn soil was silty loam. These were two acidic soils with different soil textures and two fine soils with different pHs, which provided contrasts in pH and texture for assessing relevant effects. The clay mineral compositions of these soils were mainly kaolinite and illite, except that Tk also contained a small fraction of chlorite (Table S2).
A Tl(I) stock solution (TlNO3; CAS No. 10102-45-1, Sigma-Aldrich, Burlington, MA, USA) of 1000 mg L−1 was added to the tested soils to establish the Tl levels of 0, 10, 20, 40, and 100 mg kg−1 for pot experiments. The soils were thoroughly mixed with the Tl stock solution and de-ionized water, incubated under submerged conditions for 4 weeks, and then air-dried. The Tl-containing soils were subjected to two wet–dry cycles at room temperature to enhance equilibration of added Tl with reactive soil constituents and to mimic irrigation/drying events in cultivated fields. After the second cycle, the soils were ground, sieved (<2 mm), and stored for further use.

2.2. Pot Experiments

Wheat (Triticum aestivum L. cv. Taichung 2) and rice (Oryza sativa L. cv. Taikeng 9) were selected because they are widely grown, locally adapted cultivars in Taiwan and are commonly used in regional agronomic trials. The seeds were sterilized with a 1:1 mixture of 10% sodium hypochlorite and 30% hydrogen peroxide for 30 min, followed by three rinses with de-ionized water. The sterilized wheat grains were germinated at room temperature for 5 days, while the sterilized rice grains were moistened with de-ionized water and germinated in the dark at 37 °C for 5 days. Germinated wheat grains were directly transferred to the soils in the pot experiments; rice seedlings were first grown in half-strength Kimura solution at 25 °C/20 °C (12 h/12 h, day/night) in a plant growth chamber until reaching the three-leaf stage before transplanting.
In the first pot experiment, the uptake of Tl by rice and wheat seedlings was examined as a function of soil Tl levels. Eight germinated wheat seeds or six rice seedlings were grown in 1 L polyethylene containers containing 0.5 kg of Tl-spiked soil containing 0, 10, 20, 40, and 100 mg kg−1 Tl. The elevated Tl concentrations used in the seedling experiment were selected to establish a clear dose–response relationship for assessing Tl availability, uptake, and toxicity under contrasting soil conditions. This concentration range also facilitates robust analytical detection, enabling accurate evaluation of how soil properties influence Tl availability and plant uptake. No basal fertilizers were applied in this first pot experiment in order to avoid confounding effects of nutrient addition on early Tl uptake and toxicity. Wheat seedlings were cultivated under 70% water-holding capacity at 20 °C/15 °C (day/night), and rice seedlings were grown under submerged conditions (5 cm water depth) at 25 °C/20 °C, both at 85% relative humidity in the phytotron facility of National Taiwan University. The experiment was conducted in triplicate with pots arranged randomly and repositioned every two days. Soil water content was monitored and adjusted every two days. Plants were harvested at 30 days after transplanting (DAT), freeze-dried, and homogenized for Tl analysis.
To assess plant tolerance to Tl stress, a tolerance index (T_ind) was calculated as the ratio of plant biomass in Tl-treated soils to that in the control soil, expressed as a percentage [35]:
T _ i n d % = B i o m a s s   i n   T l   t r e a t m e n t B i o m a s s   i n   c o n t r o l × 100 %
The second pot experiment evaluated the impact of soil properties on Tl accumulation in rice and wheat up to the time of grain harvest. The experiment used 1/5000-a Wagner pots (16 cm diameter, 20 cm height; surface area = 0.02 m2) filled with 3 kg of Tl-spiked soil, mixed with basal fertilizers, which were 120 kg N ha−1 (as urea) and 17.5 kg P ha−1 (as calcium superphosphate). No K fertilizer was added to avoid altering soil K status and thereby confounding K–Tl competition during plant growth. Based on the results from the first pot experiment, a soil Tl level of 5 mg kg−1 was chosen to represent a moderately contaminated soil, while avoiding plant mortality due to Tl toxicity and allowing grain production. Three germinated wheat seeds or three three-leaf-stage rice seedlings were transplanted into pots and grown for 100 DAT under the same phytotron conditions as in the first pot experiment. Each treatment was replicated in three pots. The pots were arranged in a randomized order and periodically re-randomized to minimize positional effects.
Soil and plant samples were collected at 100 DAT for Tl analysis. Soil samples were obtained by inserting four polypropylene straws (8 × 220 mm) perpendicularly into each pot, immediately immersing them in liquid nitrogen, and then freeze-drying the collected soils. Plant samples were washed with de-ionized water, separated into roots, shoots, and grains, dried at 60 °C for 5 days, weighed, and ground.

2.3. Analysis of Tl Content in Soil and Plant Samples

Plant samples (0.1~0.2 g) were digested by microwave-assisted digestion with 9 mL concentrated HNO3 and 1.5 mL 30% H2O2 at 185 °C, followed by filtration through a 0.22 μm syringe filter. Soil samples (0.5 g) were digested with 10 mL of a 3:1 HCl:HNO3 solution. Tl concentrations in all filtrates were determined by ICP-MS (7700×, Agilent Technologies, Santa Clara, CA, USA) using calibration curves freshly prepared from ICP Multi-Element Standard Certipur VIII (Merck KGaA, Darmstadt, Germany). The limit of quantification (LOQ) for Tl in solution was 0.017 μg L−1, calculated as 10σ/m, where σ is the standard deviation of the blank signal (n = 7) and m is slope of the calibration curve. Based on the sample mass and final digestion volume, this corresponded to a method LOQ of 6.8 μg kg−1 in plant tissues or soils. All samples were analyzed in triplicate with relative standard deviations < 10%. Matrix effects were controlled using internal quality-control samples. Method accuracy was verified using certified reference materials (SRM 2709a, NIST, Gaithersburg, MD, USA) for soil analysis, yielding recoveries within 90–110% of the certified Tl value. Because no certified reference material for Tl in plants was commercially available, the quality of Tl analysis in the plant samples was evaluated by spiking external Tl into NIST SRM 1573a (tomato leaf) at a concentration of 0.50 mg kg−1. The As content of the SRM was concurrently analyzed with Tl. The measured Tl and As concentrations were required to fall within 90–110% of the spiked Tl and certified As values, respectively.
The Tl concentrations in roots, shoots, or grains and the corresponding soil Tl concentrations were used to calculate the corresponding bioaccumulation factors (BAFs) [36]:
BAF ( r ,   s ,   g )   =   Tl   concentration   in   root   r ,   shoot   s ,   or   grain   ( g )   Soil   Tl   concentration

2.4. Tl LIII-Edge XAS Analysis

Soil samples were analyzed by Tl LIII-edge XAS at Beamline TLS 17C in the National Synchrotron Radiation Research Centre (NSRRC), Taiwan. The light source, beamline optics, and preparation of reference materials are described in our previous study [26]. The reference materials include TlCl, TlNO3, Tl(NO3)3, Tl(OH)3, Tl2CO3, Tl acetate, and Tl(I) adsorbed soil constituents (i.e., illite, montmorillonite, vermiculite, ferrihydrite, goethite, calcite, and humic acid). The monochromator energy was calibrated using the Se K-edge at 12,658 eV, which coincides with the Tl LIII-edge energy. Soil samples and reference materials were analyzed in at least three scans in fluorescence mode with a 13-element Ge array detector. At the same time, a Se foil was measured simultaneously with an ion chamber for energy calibration. After energy calibration and normalization, the obtained X-ray absorption near-edge structure (XANES) spectra were processed for linear combination fitting (LCF) using the Athena software (version 0.9.25), as described previously [26]. The best fit was selected based on the smallest R-factor (R = ∑(data − fit)2/∑data2). The detection limit for individual Tl species in the LCF was estimated to be ~5%. To avoid overfitting, an additional reference spectrum was included only when it accounted for at least 5% of the total signal and further improved the R-factor.

2.5. LA-ICP-MS Analysis

LA-ICP-MS was employed to examine the spatial distribution of Tl in wheat and rice grains, with K and other elements analyzed in parallel for comparison. Wheat and rice grains harvested from the Tn soil in the second pot experiment were selected because they contained higher Tl concentrations, ensuring better analytical quality.
The grains were embedded in epoxy resin (Sundhoma TC241, D. H. Material, Tokyo, Japan), sectioned longitudinally along the portrait axis into ~100-μm thick slices using a diamond saw, and polished to a smooth surface. Laser ablation was performed on whole-grain thin sections using an NWR193UC system (ESI, Huntington, UK) equipped with a frequency-quadrupled Nd:YAG laser (λ = 266 nm). The analysis was conducted in line-scan mode with a spot size of 20 μm and a repetition rate of 20 Hz. The ablated materials were transferred by argon gas to the ICP-MS (Agilent 7800, Agilent Technologies, Santa Clara, CA, USA), where the 205Tl signal (counts per second; CPS) was monitored. This isotope was selected for its high natural abundance and absence of isobaric interferences. Simultaneously, the 13C+ signal was monitored and used to normalize the Tl signal. Data were processed using Iolite v3.65 software (University of Melbourne, Melbourne, Australia).

2.6. Statistical Analysis of Data

Data from the pot experiments are reported as mean ± standard deviation. Because responses differed markedly among soils and dose–response patterns were non-parallel, Tl-dose effects were analyzed within each soil using one-way ANOVA with Fisher’s protected least significant difference (LSD) at p < 0.05, when the omnibus F-test was significant. ANOVA assumptions were checked by examining residuals for approximate normality and homogeneity of variance; as these assumptions were reasonably met, data were analyzed on the original scale. Compact letter displays indicate groups that differ significantly. All statistical analyses were performed using SAS 9.4 (SAS Institute Inc., Cary, NC, USA).
The values of BAF and T_ind were calculated from the corresponding treatment mean values of Tl concentration and biomass, respectively, and are presented as descriptive indices. No separate ANOVA was performed on these derived variables because their variability is already represented in the underlying data that were statistically analyzed.

3. Results and Discussion

3.1. Tl Uptake of Wheat and Rice Seedlings as a Function of Soil Tl Level

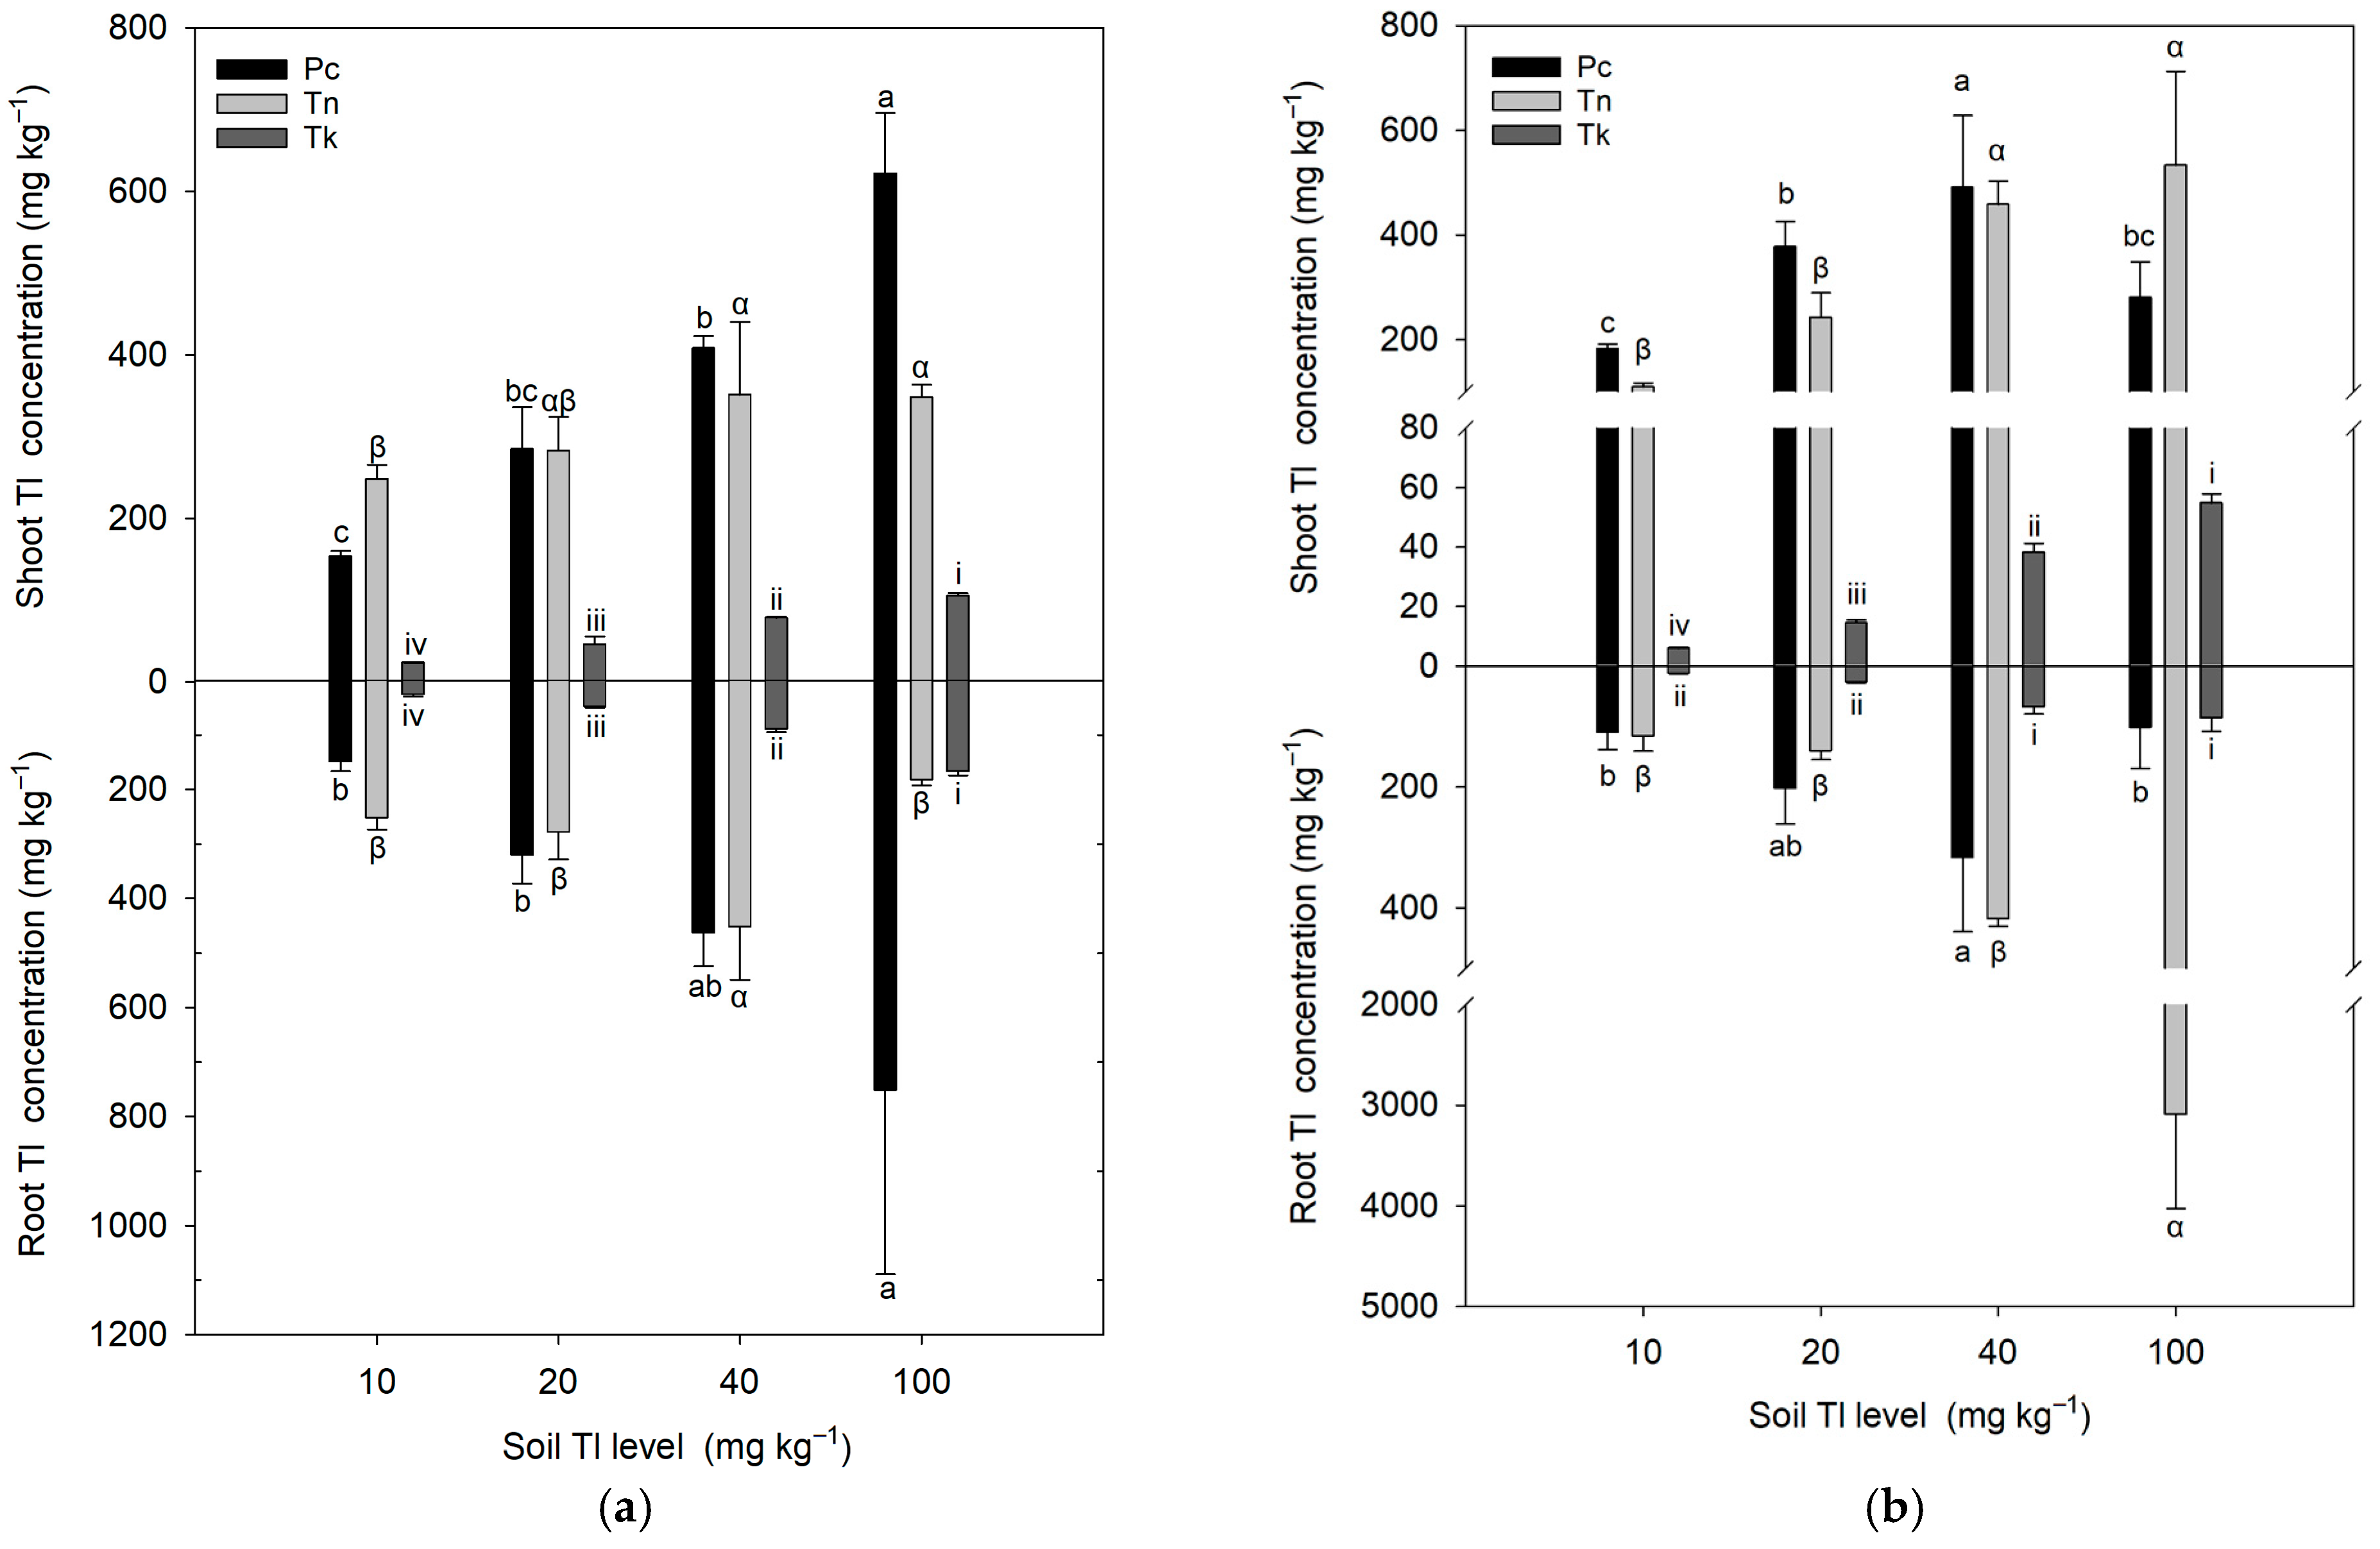
The effects of soil Tl concentrations (0–100 mg kg−1) on Tl accumulation and potential toxicity in wheat and rice seedlings were assessed at 30 DAT (Figure 1). The Tl concentrations of the controls were not shown because they were below the detection limit at the native soil Tl levels (i.e., 0.36, 0.23, and 0.52 mg kg−1 for Pc, Tn, and Tk soils, respectively). In wheat seedlings, Tl concentrations in shoots and roots ranged from 154–621 and 149–751 mg kg−1 in Pc soil, 248–351 and 182–452 mg kg−1 in Tn soil, and 23.8–105 and 25.3–166 mg kg−1 in Tk soil, respectively (Figure 1a). In rice seedlings, shoot and root Tl concentrations ranged from 182–491 and 101–316 mg kg−1 in Pc soil, 109–534 and 115–3090 mg kg−1 in Tn soil, and 5.9–54.8 and 11.4–85.5 mg kg−1 in Tk soil, respectively (Figure 1b). Tl uptake by both crops increased with increasing soil Tl level, consistent with a dosage effect. Biomass reductions occurred at soil Tl levels as low as 10 mg kg−1, with rice exhibiting more pronounced growth inhibition than wheat (Table S2). Growth suppression of both roots and shoots was more pronounced in the acidic soils (Pc and Tn) than in the alkaline Tk soil, reflecting higher Tl availability due to lower adsorption under acidic conditions [26,37] and, consequently, higher Tl accumulation and stronger toxicity. The extremely high Tl content (3090 mg kg−1) observed in rice roots grown in Tn soil at 100 mg kg−1 is therefore likely due to enhanced Tl mobility in this acidic and coarse soil, leading to rapid root influx, combined with the reduced root biomass in plants that survived Tl toxic stress (Table S2).
The BAF values of wheat and rice seedlings grown under varying soil Tl levels are summarized in Table 1. BAF serves as an indicator of soil Tl availability and plant uptake efficiency [38,39]. For wheat seedlings, the BAFr and BAFs values were in the ranges of 7.5–16.0 and 6.2–15.4 in PC soil, 1.8–25.2 and 3.5–24.8 in Tn soil, and 1.7–2.5 and 1.1–2.4 in Tk soil, respectively. For rice seedlings, the corresponding values were 2.8–18.9 and 1.0–11.1 in PC soil, 7.0–30.9 and 5.3–12.1 in Tn soil, and 0.9–1.7 and 0.5–1.0 in Tk soil, respectively. Most BAF values exceeded unity, indicating high soil Tl availability and effective Tl uptake by both crops [38,39]. The consistently higher BAF values in the acidic soils compared to the alkaline Tk soil demonstrated the enhanced mobility and bioavailability of Tl(I) under low pH conditions. In two acidic soils, both BAFr and BAFs generally declined with increasing soil Tl, except for BAFr in the Tn soil at 40 and 100 mg kg−1. The exceptionally high Tl concentration in rice roots (3090 mg kg−1) from Tn soil at 100 mg kg−1 yielded a BAFr value of 30.9 (Figure 1b; Table 1). This inverse relationship between BAF and soil Tl in acidic soils suggests that internal physiological stress at high Tl exposure may limit further accumulation, thereby diminishing the external influence of soil Tl availability [39]. In contrast, the low BAF values in Tk soil showed little dependence on soil Tl, consistent with the limited overall Tl accumulation in both crops under alkaline conditions.
Both crops exhibited higher BAFs values, indicating effective translocation from soil to root and then to shoot. The active translocation to aerial parts is consistent with previous findings [37,40,41]. Thallium toxicity was primarily manifested as growth inhibition, oxidative stress, leaf chlorosis, and disruption of K homeostasis [41,42]. To further quantify plant tolerance of Tl toxicity, shoot biomass was used to calculate the tolerance index (T_ind; Equation (1)), a standardized metric for comparing species and evaluating dose-dependent toxic effects [35]. Shoot T_ind was preferred over root T_ind because it was difficult to completely recover fine roots from soils, resulting in higher uncertainty in root T_ind values. As shown in Table 2, wheat exhibited T_ind values of 10–43% in Pc soil, 11–34% in Tn soil, and 50–70% in Tk soil. Comparatively, rice showed more severe reductions in T_ind values in both acidic soils (≤10%), but retained relatively higher T_ind values in the Tk soil at lower Tl levels (Table 2). These findings indicate both crops are more sensitive under acidic conditions, consistent with the higher BAF values observed. At higher soil Tl levels, the decreasing T_ind values reflect the limited physiological adaptation of both plants to mitigate the detrimental consequences of higher Tl accumulation in the plants [39]. Overall, integrating BAF and T_ind data indicated that rice generally accumulates less Tl than wheat at the same soil Tl level, yet was overall less tolerant to Tl toxicity.
Both crops accumulated substantially more Tl in Pc and Tn soils than in Tk soil, resulting in more pronounced Tl toxicity. This pattern reflects reduced Tl availability under alkaline conditions, regardless of whether the crop is submerged (rice) or non-submerged (wheat). In addition to the role of soil pH on Tl availability to rice and wheat, the effect of soil texture on Tl concentrations in rice became pronounced under higher Tl concentration (Figure 1b). Specifically, the rice plants grown in the acidic, coarse-textured Tn soil increased in Tl concentrations to a similar level as the acidic, fine-textured Pc soil with increasing Tl concentrations. This suggested that the Tl availability to plants could be affected by soil texture, especially clay content, where that of Pc (39.5%) and Tk (38.8%) was almost four times that of Tn (11.2%) (Table S1). According to semi-quantitative XRD analysis, Pc soil contains 49% kaolinite and 51% illite; Tn soil 67% kaolinite and 33% illite; Tk soil 23% kaolinite, 66% illite, and 11% chlorite (Table S1). These contrasting clay mineral assemblages are expected to modulate affinity for Tl [20,26] and thereby regulate soil Tl availability.
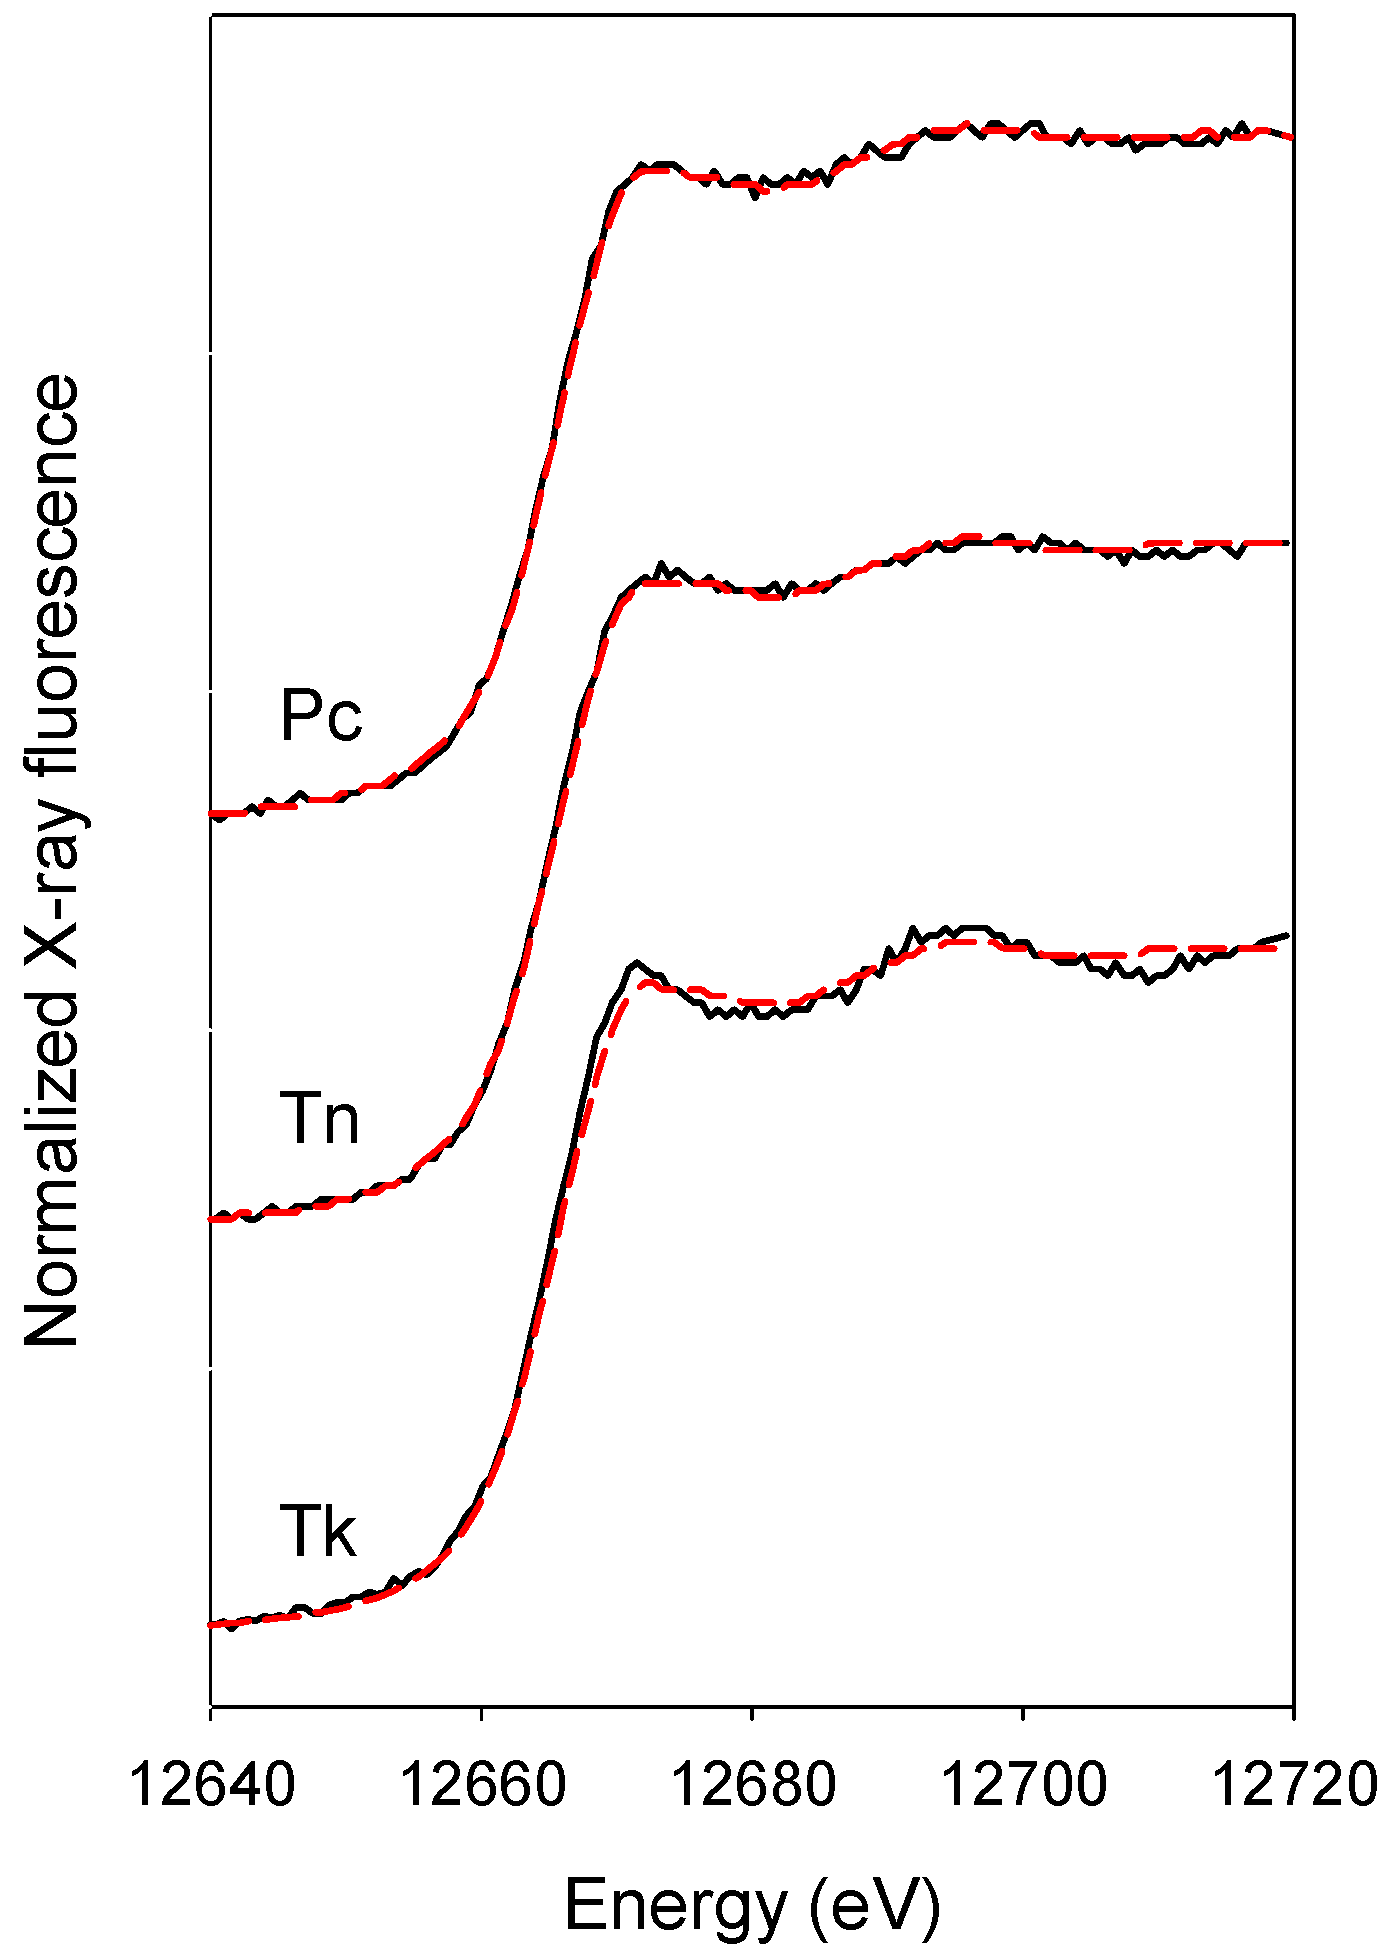
To further clarify the role of soil chemistry and mineralogy in Tl bioavailability, Tl LIII-edge XANES spectra were obtained for soils with the highest Tl level to ensure higher signal-to-noise ratios and minimize analytical uncertainty in LCF (Figure 2). The LCF results (Table 3) showed that Tl(I) adsorbed on illite, representing Tl(I) bound to micaceous minerals, particularly illite in these soils, with high binding affinity for Tl+ ions, accounted for 94%, 95%, and 89% of total Tl in Pc, Tn, and Tk soils, respectively. The dominant role of micaceous minerals in Tl adsorption is consistent with previous findings [20,26]. In comparison, Tl(I) adsorbed on ferrihydrite, representing non-specific sorption of Tl+ ions on other soil colloids such as oxides and humic substances, accounted for only 6%, 5%, and 11% in Pc, Tn, and Tk soils, respectively. These materials mainly form outer-sphere complexes with Tl+ ions, resulting in weaker adsorption [20,31].
Element uptake by roots involves desorption from soil particles, diffusion from bulk soil to rhizosphere, and uptake into roots, while re-immobilization may occur through adsorption or precipitation [14,16,17]. Because soil Tl adsorption is partially reversible [26], soil Tl availability is ultimately governed by soil factors (e.g., pH, mineral composition) that control Tl desorption kinetics during transport to roots [18,19]. The higher illite content and alkaline pH of Tk soil together enhance Tl retention and reduce Tl availability, consistent with the low BAF values observed in this soil. In contrast, enhanced protonation and reduced competition at low pH in Pc and Tn soils increase Tl mobility, leading to higher plant Tl uptake. Among the three soils, Tn has the lowest illite content, combined with a low pH and coarse texture (Table S1), resulting in higher BAF values and an extremely high root Tl concentration of rice at a soil Tl level of 100 mg kg−1. This combined mineralogical/pH control reconciles the contrasting BAF values across soils: enhanced Tl retention under higher-pH conditions limits Tl mobility and supply to roots, whereas more mobile Tl in acidic soils promotes greater Tl uptake and toxicity.

3.2. Tl Accumulation in Different Parts of Wheat and Rice Plants

In the second pot experiment, wheat and rice were grown to grain maturity (100 DAT) in the three soils spiked with 5 mg kg−1 Tl. This concentration minimized acute toxicity while allowing for the assessment of Tl partitioning among plant tissues. Both crops grown in the acidic Pc soil failed to reach harvest maturity, showing severe toxic effects and high residual Tl in vegetative tissues (36.9 and 167.0 mg kg−1 in the roots and shoots of wheat, and 84.0 and 47.1 mg kg−1 in the roots and shoots of rice, respectively). In contrast, plants in the alkaline Tk soil completed their growth cycle, accumulated markedly lower Tl concentrations, with 5.6 mg kg−1 (roots) and 3.0 mg kg−1 (shoots) in wheat, and 3.7 mg kg−1 (roots) and 3.6 mg kg−1 (shoots) in rice; Tl in grains was below the detection limit. As Tn soil supported full plant growth and measurable Tl concentrations in roots, shoots, and grains, it was selected to examine Tl partitioning into grains, the edible portion most relevant to dietary exposure. This condition represents a realistic worst-case scenario, in which plants survive under Tl stress while still translocating and retaining Tl in edible tissues.
As shown in Table 4, the Tl concentrations in the grains of wheat and rice grown in Tn soil were 0.24 and 0.10 mg kg−1, respectively, indicating that Tl transfer to grains was about 2.5 times higher in wheat than in rice at the same soil Tl level. The corresponding BAFg values were 0.05 and 0.02 for wheat and rice, which were approximately two orders of magnitude smaller than the respective BAFr and BAFs values. These results indicate that both crops possess physiological mechanisms that regulate the translocation of Tl to grains. Thus, only a small fraction of absorbed Tl is translocated to grains, even when roots and shoots accumulate relatively high Tl concentrations under the conditions examined here. Interestingly, the BAFr and BAFs values were higher in rice (5.3 and 4.1) than in wheat (2.4 and 3.9), suggesting that rice accumulated more Tl in vegetative tissues but was less efficient in translocating Tl to grains.
Tl movement during grain filling broadly aligns with K (re)distribution within both crops, supported by their close ionic similarity (Tl+ 1.49 Å; K+ 1.33 Å) [43] and evidence that Tl competes with K during uptake through pathways associated with K transport [2,13,41,44]. These observations suggest that Tl could partially engage transport processes involved in K movement within plants. Similar behaviors have been documented for other monovalent metals, such as cesium [45] and rubidium [46], which also interact with K transport pathways, offering a helpful comparison for understanding Tl transport in plants. In cereals, K is supplied to developing grains mainly through phloem transport during grain filling, whereas xylem flow predominates earlier and supplies vegetative tissues [45]. Meanwhile, cross-species comparisons revealed that K (re)mobilization efficiency from leaves is substantially higher in wheat (approximately 90–95%) than in rice (approximately 40–50%) [45,46,47]. The greater K remobilization efficiency and phloem loading capacity in wheat help explain why wheat exhibits a higher proportion of Tl in grains, despite its lower overall uptake. In contrast, rice accumulates more Tl in vegetative tissues but relatively restricts the transfer of Tl to grains. A clearer understanding of Tl–K interactions will require future studies, potentially including functional analyses of KT/HAK/KUP potassium transporters in wheat [48,49] and rice [50,51] under Tl exposure.

3.3. Spatial Distribution of Tl and K in Grains

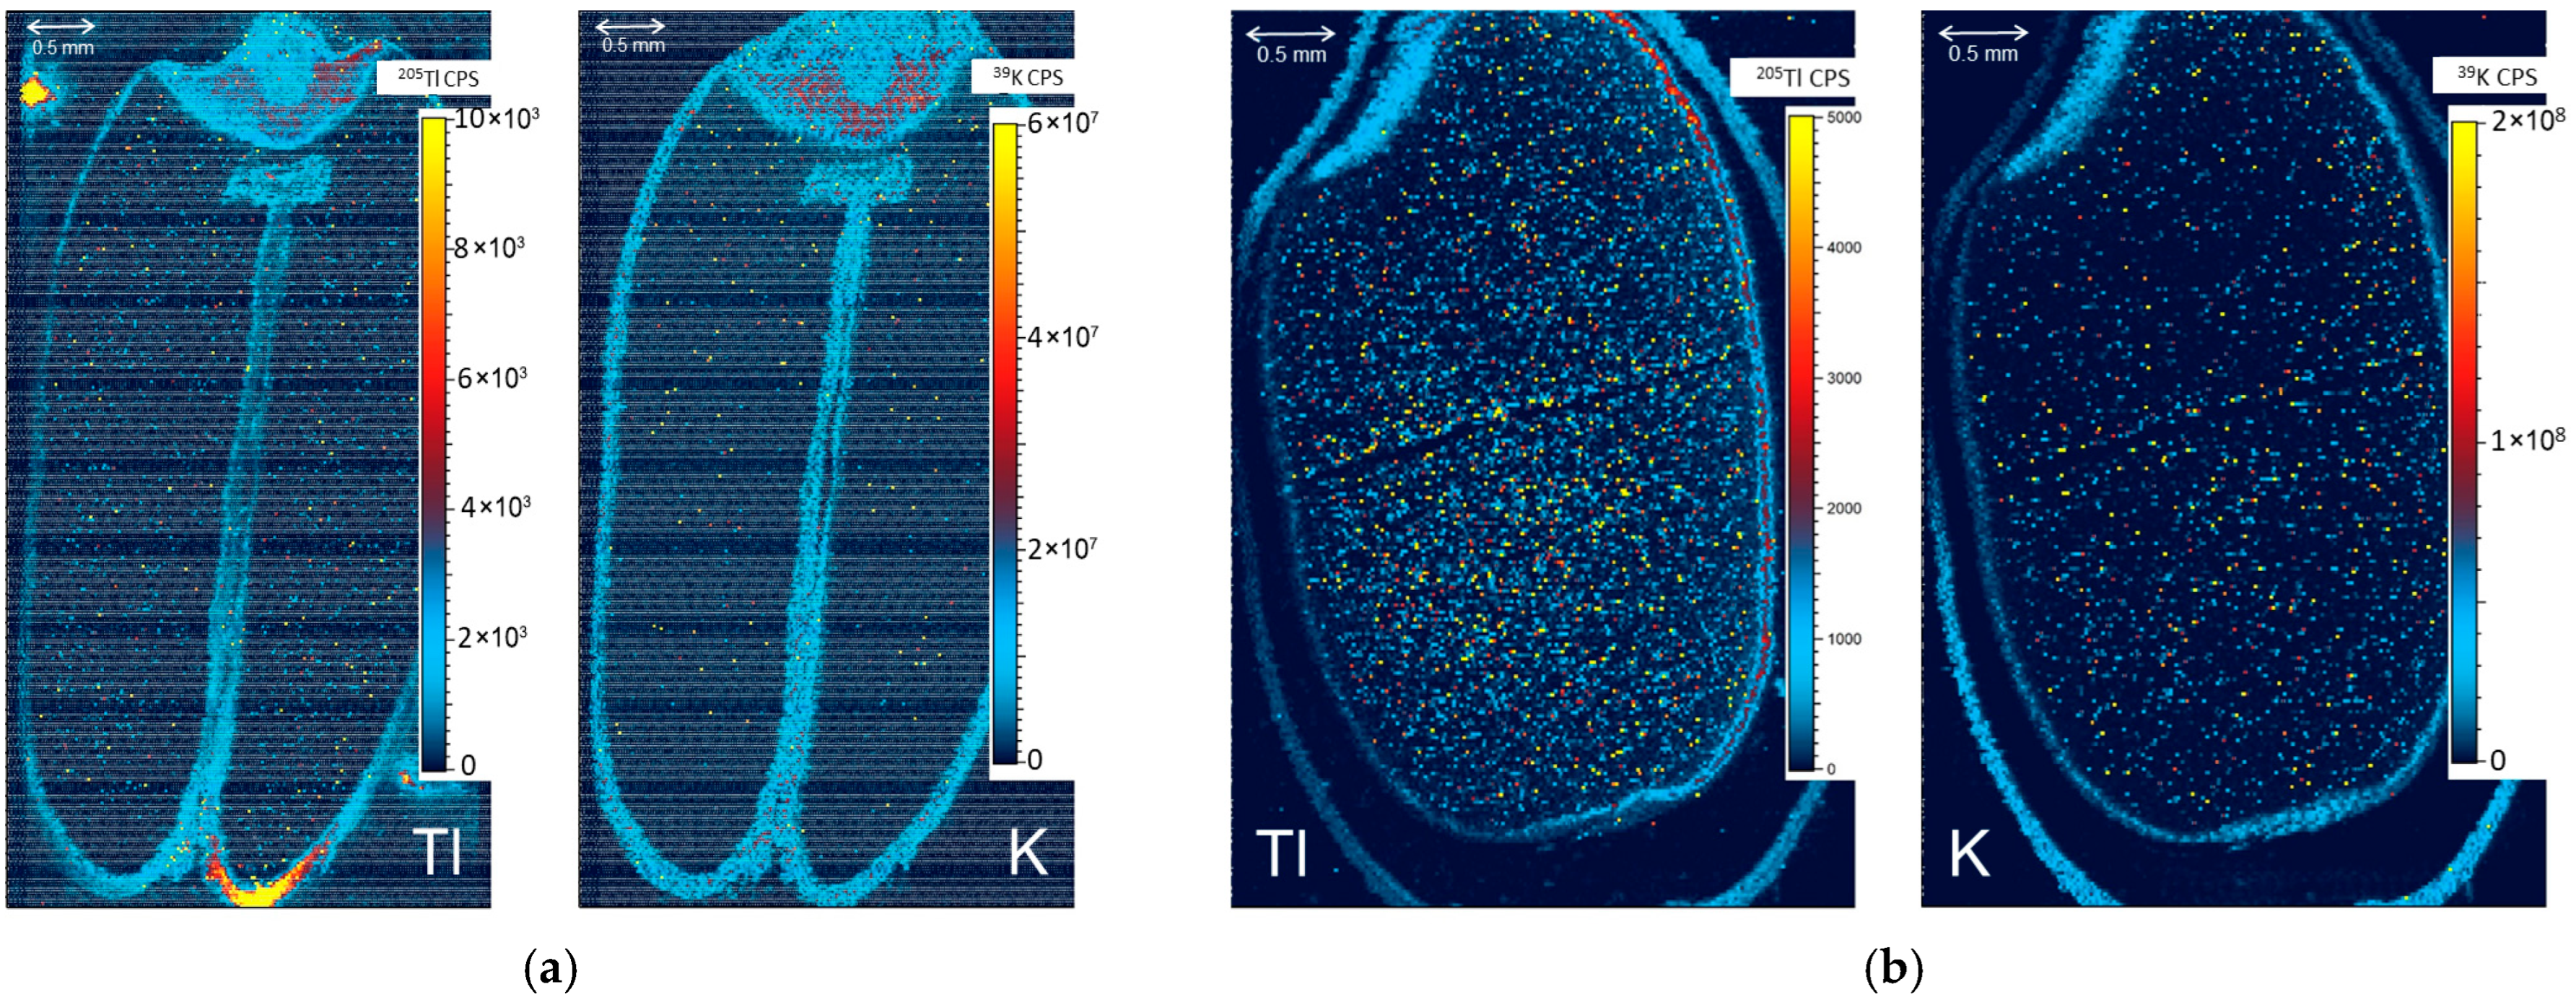
To further examine the distribution of Tl within grains, LA-ICP-MS was used to map Tl and K in cross-sections of wheat and rice grains (Figure 3). Potassium was mapped together with Tl because Tl+ is known to compete with K+ for uptake and transport [2,13,41,44]. Signal intensities of both elements were relatively low within the endosperm. In wheat, Tl was concentrated in the crease, bran, and embryo regions, with the strongest signal in the embryo, closely matching the K pattern. In rice, Tl and K signals were mainly concentrated in the bran and embryo, showing comparable enrichment along the grain periphery.
The spatial co-localization of Tl and K in bran and embryo regions suggests that Tl entering developing grains is loaded into similar grain tissues as K, consistent with the broader redistribution trends described in Section 3.2. However, the underlying transport mechanisms remain unclear. These findings indicate that Tl absorbed by wheat and rice plants can be transferred to edible tissues, highlighting its potential entry into the food chain. Notably, a recent toxicological study reported that children exhibited markedly higher sensitivity to Tl exposure than adults, with a lethal dose as low as one-tenth of the adult level [12]. Therefore, Tl contamination in cereal-based foods, particularly infant products, warrants careful attention because of the associated health risks.
The preferential localization of Tl in outer grain layers implies a higher potential dietary exposure when unpolished (whole) grains are consumed. Because milling and polishing remove most of the bran and part of the embryo, these processes could markedly reduce Tl concentrations in wheat- and rice-based food products. In addition, cultivation in soils with higher pH and greater clay content may suppress Tl bioavailability as shown in Tk soil, while adequate K fertilization could competitively inhibit Tl uptake [44]. However, because soil K exists at millimolar levels, whereas Tl occurs only in trace concentrations, the extent of the K-Tl competitive relationship remains complex and merits further investigation.

4. Conclusions

This study demonstrated that rice and wheat can effectively take up Tl from soil. Plant Tl accumulation increased with soil Tl level, but the extent of uptake and associated toxicity varied markedly among soils and between species. Wheat was generally more tolerant of Tl toxicity and allocated a relatively larger fraction of absorbed Tl to grains than rice, which retained more Tl in vegetative tissues. The combined patterns of bioaccumulation and tolerance indices suggest that physiological stress constrains Tl uptake at elevated soil Tl levels. Both crops accumulated substantially more Tl in the acidic soils than in the alkaline soil. The predominance of Tl(I) adsorbed on micaceous minerals, as indicated by the XANES-LCF results of Tl-containing soils, highlights the crucial role of soil mineralogy in regulating soil Tl retention. Together, these findings suggest that Tl contamination in soils with lower pH and lower micaceous mineral content can pose a greater environmental risk by enhancing soil Tl availability and promoting its uptake and accumulation in crop plants.
Overall, our results indicate that Tl behavior in crop–soil systems is influenced by the interacting effects of soil chemistry (pH, mineral composition) and plant tolerance and allocation mechanisms. They provide a basis for developing soil and crop management strategies, such as pH regulation, appropriate nutrient (especially K) management, and crop selection, to reduce soil Tl availability and limit its entry into cereal-based food chains. The preferential localization of Tl in outer grain layers suggests a higher potential for dietary exposure when unpolished (whole) grains are consumed; conversely, milling and polishing can potentially reduce Tl content in final food products. Importantly, under certain soil conditions, wheat and rice can tolerate Tl exposure until harvest, allowing soil-derived Tl to accumulate in grains at levels that may approach or exceed dietary safety thresholds. Currently, no explicit food-safety standards have been established for Tl in cereal grains; therefore, these results provide a valuable basis for future risk assessment and refining soil and crop management strategies to limit Tl entry into the human food chain. These conclusions are based on pot experiments with added Tl(I) and a limited set of soils and crop cultivars. They should therefore be corroborated by field-scale studies that include a broader range of soils and Tl sources, as well as evaluate additional wheat and rice genotypes to identify cultivars with lower grain Tl accumulation. Mechanistic work on Tl–K interactions, particularly the roles of K transporters in Tl uptake, is essential for a better understanding of Tl transfer to grains. Integrating such physiological and field data with exposure assessment will improve the development of management and regulatory strategies to limit Tl entry into cereal-based food chains.

Supplementary Materials

The following supporting information can be downloaded at: https://www.mdpi.com/article/10.3390/agronomy15122918/s1, Text S1: Analysis of soil properties and clay mineral composition; Table S1: Basic properties and clay mineral composition of the studied soils; Table S2: Root and shoot biomasses of wheat and rice seedlings grown under different soil Tl levels for 30 days. References [52,53,54,55,56,57,58] are cited in the Supplementary Materials file.

Author Contributions

P.-T.Y.: Investigation, methodology, conceptualization, and writing—original draft preparation; H.-F.C.: Investigation and writing—review and editing; L.-S.H. and T.-J.C.: Validation, formal analysis, and data curation; S.-L.W.: Resources, supervision, funding acquisition, and writing—review and editing. All authors have read and agreed to the published version of the manuscript.

Funding

The National Science and Technology Council, Taiwan (Grant No. MOST-106-2313-B-002-017-MY3 and MOST-109-2313-B-002-048-MY3), the Environmental Analysis Laboratory, Environmental Protection Administration, Taiwan (EPA-107-1603-02-01), and National Taiwan University, Taiwan (Grant No. 109L891303).

Data Availability Statement

The original contributions presented in this study are included in the article and supplementary material. Further inquiries can be directed to the corresponding author.

Acknowledgments

The authors are grateful for the technical services provided by the National Synchrotron Radiation Research Center, a national user facility supported by the Ministry of Science and Technology of Taiwan (ROC). The authors are grateful to Jyh-Fu Lee for the technical assistance in the XAS analysis conducted at Beamline 17C, NSRRC, and to Kuo-Chen Yeh for providing access to the LA-ICP-MS analysis.

Conflicts of Interest

The authors declare no conflicts of interest.

References

  1. Peter, A.L.; Viraraghavan, T. Thallium: A review of public health and environmental concerns. Environ. Int. 2005, 31, 493–501. [Google Scholar] [CrossRef]
  2. Karbowska, B. Presence of thallium in the environment: Sources of contaminations, distribution and monitoring methods. Environ. Monit. Assess. 2016, 188, 640. [Google Scholar] [CrossRef]
  3. Migaszewski, Z.M.; Gałuszka, A. Abundance and fate of thallium and its stable isotopes in the environment. Rev. Environ. Sci. Bio/Technol. 2021, 20, 5–30. [Google Scholar] [CrossRef]
  4. LaCoste, C.; Robinson, B.; Brooks, R. Uptake of thallium by vegetables: Its significance for human health, phytoremediation, and phytomining. J. Plant Nutr. 2001, 24, 1205–1215. [Google Scholar] [CrossRef]
  5. Jiang, Y.; Wei, X.; He, H.; She, J.; Liu, J.; Fang, F.; Zhang, W.; Liu, Y.; Wang, J.; Xiao, T.; et al. Transformation and fate of thallium and accompanying metal(loid)s in paddy soils and rice: A case study from a large-scale industrial area in China. J. Hazard. Mater. 2022, 423, 126997. [Google Scholar] [CrossRef] [PubMed]
  6. Duri, L.G.; Visconti, D.; Fiorentino, N.; Adamo, P.; Fagnano, M.; Caporale, A.G. Health Risk Assessment in Agricultural Soil Potentially Contaminated by Geogenic Thallium: Influence of Plant Species on Metal Mobility in Soil-Plant System. Agronomy 2020, 10, 890. [Google Scholar] [CrossRef]
  7. Kabata-Pendias, A.; Szteke, B. Trace Elements in Abiotic and Biotic Environments; CRC Press: Boca Raton, FL, USA, 2015; p. 440. [Google Scholar]
  8. Jia, Y.L.; Xiao, T.F.; Zhou, G.Z.; Ning, Z.P. Thallium at the interface of soil and green cabbage (Brassica oleracea L. var. capitata L.): Soil-plant transfer and influencing factors. Sci. Total Environ. 2013, 450, 140–147. [Google Scholar] [CrossRef] [PubMed]
  9. Maluszynski, M.J.; Maluszynska, I. Evaluation of the soil quality from areas with varying degrees of pollution. Desalination Water Treat. 2016, 57, 1034–1037. [Google Scholar] [CrossRef]
  10. Pavlickova, J.; Zbiral, J.; Smatanova, M.; Habarta, P.; Houserova, P.; Kuban, V. Uptake of thallium from naturally-contaminated soils into vegetables. Food Addit. Contam. 2006, 23, 484–491. [Google Scholar] [CrossRef]
  11. Xiao, T.; Guha, J.; Boyle, D.; Liu, C.-Q.; Chen, J. Environmental concerns related to high thallium levels in soils and thallium uptake by plants in southwest Guizhou, China. Sci. Total Environ. 2004, 318, 223–244. [Google Scholar] [CrossRef]
  12. Duan, W.; Wang, Y.; Li, Z.; Fu, G.; Mao, L.; Song, Y.; Qu, Y.; Ye, L.; Zhou, Q.; Yang, F.; et al. Thallium exposure at low concentration leads to early damage on multiple organs in children: A case study followed up for four years. Environ. Pollut. 2020, 258, 113319. [Google Scholar] [CrossRef]
  13. Fujihara, J.; Nishimoto, N. Thallium-poisoner’s poison: An overview and review of current knowledge on the toxicological effects and mechanisms. Curr. Res. Toxicol. 2024, 6, 100157. [Google Scholar] [CrossRef]
  14. Barber, S.A. A diffusion and mass-flow concept of soil nutrient availability. Soil Sci. 1962, 93, 39–49. [Google Scholar] [CrossRef]
  15. Barber, S.A.; Walker, J.M.; Vasey, E.H. Mechanisms for Movement of Plant Nutrients from Soil and Fertilizer to Plant Root. J. Agric. Food Chem. 1963, 11, 204–207. [Google Scholar] [CrossRef]
  16. Jungk, A.; Claassen, N. Ion Diffusion in the Soil–Root System. In Advances in Agronomy; Sparks, D.L., Ed.; Academic Press: New York, NY, USA, 1997; Volume 61, pp. 53–110. [Google Scholar]
  17. Hinsinger, P. How do plant roots acquire mineral nutrients? Chemical processes involved in the rhizosphere. In Advances in Agronomy; Sparks, D.L., Ed.; Academic Press: New York, NY, USA, 1998; Volume 64, pp. 225–265. [Google Scholar]
  18. Hinsinger, P.; Bengough, A.G.; Vetterlein, D.; Young, I.M. Rhizosphere: Biophysics, biogeochemistry and ecological relevance. Plant Soil 2009, 321, 117–152. [Google Scholar] [CrossRef]
  19. York, L.M.; Carminati, A.; Mooney, S.J.; Ritz, K.; Bennett, M.J. The holistic rhizosphere: Integrating zones, processes, and semantics in the soil influenced by roots. J. Exp. Bot. 2016, 67, 3629–3643. [Google Scholar] [CrossRef]
  20. Martin, L.A.; Wissocq, A.; Benedetti, M.F.; Latrille, C. Thallium (Tl) sorption onto illite and smectite: Implications for Tl mobility in the environment. Geochim. Cosmochim. Acta 2018, 230, 1–16. [Google Scholar] [CrossRef]
  21. Vanek, A.; Komarek, M.; Vokurkova, P.; Mihaljevic, M.; Sebek, O.; Panuskova, G.; Chrastny, V.; Drabek, O. Effect of illite and birnessite on thallium retention and bioavailability in contaminated soils. J. Hazard. Mater. 2011, 191, 170–176. [Google Scholar] [CrossRef]
  22. Vanek, A.; Mihaljevic, M.; Galuskova, I.; Chrastny, V.; Komarek, M.; Penizek, V.; Zadorova, T.; Drabek, O. Phase-dependent phytoavailability of thallium—A synthetic soil experiment. J. Hazard. Mater. 2013, 250, 265–271. [Google Scholar] [CrossRef]
  23. Liu, J.; Lippold, H.; Wang, J.; Lippmann-Pipke, J.; Chen, Y. Sorption of thallium(I) onto geological materials: Influence of pH and humic matter. Chemosphere 2011, 82, 866–871. [Google Scholar] [CrossRef]
  24. Vanek, A.; Grosslova, Z.; Mihaljevic, M.; Ettler, V.; Chrastny, V.; Komarek, M.; Tejnecky, V.; Drabek, O.; Penizek, V.; Galuskova, I.; et al. Thallium contamination of soils/vegetation as affected by sphalerite weathering: A model rhizospheric experiment. J. Hazard. Mater. 2015, 283, 148–156. [Google Scholar] [CrossRef] [PubMed]
  25. Voegelin, A.; Pfenninger, N.; Petrikis, J.; Majzlan, J.; Plotze, M.; Senn, A.C.; Mangold, S.; Steininger, R.; Gottlicher, J. Thallium Speciation and Extractability in a Thallium- and Arsenic-Rich Soil Developed from Mineralized Carbonate Rock. Environ. Sci. Technol. 2015, 49, 5390–5398. [Google Scholar] [CrossRef]
  26. Lin, H.Y.; Chuang, T.J.; Yang, P.T.; Guo, L.Y.; Wang, S.L. Adsorption and desorption of thallium(I) in soils: The predominant contribution by clay minerals. Appl. Clay Sci. 2021, 205, 106063. [Google Scholar] [CrossRef]
  27. Wick, S.; Baeyens, B.; Fernandes, M.M.; Gottlicher, J.; Fischer, M.; Pfenninger, N.; Plotze, M.; Voegelin, A. Thallium sorption and speciation in soils: Role of micaceous clay minerals and manganese oxides. Geochim. Cosmochim. Acta 2020, 288, 83–100. [Google Scholar] [CrossRef]
  28. Bidoglio, G.; Gibson, P.N.; Ogorman, M.; Roberts, K.J. X-ray absorption spectroscopy investigation of surface redox transformations of thallium and chromium on colloidal mineral oxides. Geochim. Cosmochim. Acta 1993, 57, 2389–2394. [Google Scholar] [CrossRef]
  29. Nielsen, S.G.; Wasylenki, L.E.; Rehkämper, M.; Peacock, C.L.; Xue, Z.; Moon, E.M. Towards an understanding of thallium isotope fractionation during adsorption to manganese oxides. Geochim. Cosmochim. Acta 2013, 117, 252–265. [Google Scholar] [CrossRef]
  30. Cruz-Hernandez, Y.; Villalobos, M.; Marcus, M.A.; Pi-Puig, T.; Zanella, R.; Martinez-Villegas, N. Tl(I) sorption behavior on birnessite and its implications for mineral structural changes. Geochim. Cosmochim. Acta 2019, 248, 356–369. [Google Scholar] [CrossRef]
  31. Deng, H.-M.; Chen, Y.-H.; Wu, H.-H.; Liu, T.; Wang, Y.-L.; Wu, G.-Y.; Ye, H.-P. Adsorption of Tl(I) on Na–montmorillonite and kaolinite from aqueous solutions. Environ. Earth Sci. 2016, 75, 752. [Google Scholar] [CrossRef]
  32. Chen, W.; Huangfu, X.; Xiong, J.; Liu, J.; Wang, H.; Yao, J.; Liu, H.; He, Q.; Ma, J.; Liu, C.; et al. Retention of thallium(I) on goethite, hematite, and manganite: Quantitative insights and mechanistic study. Water Res. 2022, 221, 118836. [Google Scholar] [CrossRef]
  33. Chen, W.; Huangfu, X.; Xiong, J.; Liu, H.; He, Q. Dynamic retention of thallium(I) on humic acid: Novel insights into the heterogeneous complexation ability and responsiveness. Water Res. 2023, 239, 120053. [Google Scholar] [CrossRef] [PubMed]
  34. Xiao, X.; Zhou, W.; Guo, Z.; Peng, C.; Xu, R.; Zhang, Y.; Yang, Y. Thallium content in vegetables and derivation of threshold for safe food production in soil: A meta-analysis. Sci. Total Environ. 2024, 912, 168845. [Google Scholar] [CrossRef]
  35. Wilkins, D.A. The measurement of tolerance to edaphic factors by means of root growth. New Phytol. 1978, 80, 623–633. [Google Scholar] [CrossRef]
  36. Pachura, P.; Ociepa-Kubicka, A.; Skowron-Grabowska, B. Assessment of the availability of heavy metals to plants based on the translocation index and the bioaccumulation factor. Desalination Water Treat. 2016, 57, 1469–1477. [Google Scholar] [CrossRef]
  37. Huang, L.-S.; Yang, P.-T.; Lu, Y.-A.; Liu, W.-L.; Chuang, T.-J.; Wang, S.-L. Uptake of Thallium(I) by Rice Seedlings Grown in Different Soils: Key Soil Properties Determining Soil Thallium Availability. Agronomy 2024, 14, 718. [Google Scholar] [CrossRef]
  38. Khan, A.; Khan, S.; Khan, M.A.; Qamar, Z.; Waqas, M. The uptake and bioaccumulation of heavy metals by food plants, their effects on plants nutrients, and associated health risk: A review. Environ. Sci. Pollut. Res. Int. 2015, 22, 13772–13799. [Google Scholar] [CrossRef]
  39. Antoniadis, V.; Levizou, E.; Shaheen, S.M.; Ok, Y.S.; Sebastian, A.; Baum, C.; Prasad, M.N.V.; Wenzel, W.W.; Rinklebe, J. Trace elements in the soil-plant interface: Phytoavailability, translocation, and phytoremediation–A review. Earth-Sci. Rev. 2017, 171, 621–645. [Google Scholar] [CrossRef]
  40. Liu, J.; Luo, X.; Wang, J.; Xiao, T.; Chen, D.; Sheng, G.; Yin, M.; Lippold, H.; Wang, C.; Chen, Y. Thallium contamination in arable soils and vegetables around a steel plant—A newly-found significant source of Tl pollution in South China. Environ. Pollut. 2017, 224, 445–453. [Google Scholar] [CrossRef] [PubMed]
  41. Chang, H.F.; Tseng, S.C.; Tang, M.T.; Hsiao, S.S.Y.; Lee, D.C.; Wang, S.L.; Yeh, K.C. Physiology and molecular basis of thallium toxicity and accumulation in Arabidopsis thaliana. Ecotoxicol. Environ. Saf. 2024, 276, 116290. [Google Scholar] [CrossRef]
  42. Espinosa, F.; Ortega, A.; Espinosa-Vellarino, F.L.; Garrido, I. Effect of thallium (I) on growth, nutrient absorption, photosynthetic pigments, and antioxidant response of Dittrichia plants. Antioxidants 2023, 12, 678. [Google Scholar] [CrossRef]
  43. Rusznyák, I.; György, L.; Ormai, S.; Millner, T. On some potassium-like qualities of the thallium ion. Experientia 1968, 24, 809–810. [Google Scholar] [CrossRef]
  44. Renkema, H.; Koopmans, A.; Hale, B.; Berkelaar, E. Thallium and potassium uptake kinetics and competition differ between durum wheat and canola. Environ. Sci. Pollut. Res. 2015, 22, 2166–2174. [Google Scholar] [CrossRef]
  45. Etienne, P.; Diquélou, S.; Prudent, M.; Salon, C.; Maillard, A.; Ourry, A. Macro and Micronutrient Storage in Plants and Their Remobilization When Facing Scarcity: The Case of Drought. Agriculture 2018, 8, 14. [Google Scholar] [CrossRef]
  46. Maillard, A.; Diquélou, S.; Billard, V.; Laîné, P.; Garnica, M.; Prudent, M.; Garcia-Mina, J.-M.; Yvin, J.-C.; Ourry, A. Leaf mineral nutrient remobilization during leaf senescence and modulation by nutrient deficiency. Front. Plant Sci. 2015, 6, 317. [Google Scholar] [CrossRef] [PubMed]
  47. Sperotto, R.A.; Vasconcelos, M.W.; Grusak, M.A.; Fett, J.P. Effects of different Fe supplies on mineral partitioning and remobilization during the reproductive development of rice (Oryza sativa L.). Rice 2012, 5, 27. [Google Scholar] [CrossRef] [PubMed]
  48. Cheng, X.; Liu, X.; Mao, W.; Zhang, X.; Chen, S.; Zhan, K.; Bi, H.; Xu, H. Genome-Wide Identification and Analysis of HAK/KUP/KT Potassium Transporters Gene Family in Wheat (Triticum aestivum L.). Int. J. Mol. Sci. 2018, 19, 3969. [Google Scholar] [CrossRef]
  49. Grabov, A. Plant KT/KUP/HAK Potassium Transporters: Single Family—Multiple Functions. Ann. Bot. 2007, 99, 1035–1041. [Google Scholar] [CrossRef]
  50. Gupta, M.; Qiu, X.; Wang, L.; Xie, W.; Zhang, C.; Xiong, L.; Lian, X.; Zhang, Q. KT/HAK/KUP potassium transporters gene family and their whole-life cycle expression profile in rice (Oryza sativa). Mol. Genet. Genom. 2008, 280, 437–452. [Google Scholar] [CrossRef]
  51. Li, W.; Li, M.; Li, S.; Zhang, Y.; Li, X.; Xu, G.; Yu, L. Function of Rice High-Affinity Potassium Transporters in Pollen Development and Fertility. Plant Cell Physiol. 2022, 63, 967–980. [Google Scholar] [CrossRef]
  52. Thomas, G.W. Soil pH and soil acidity. In Methods of Soil Analysis. Part 3. Chemical Methods; Sparks, D.L., Ed.; Soil Science Society of America: Madison, WI, USA, 1996; pp. 475–490. [Google Scholar]
  53. Nelson, D.W.; Sommers, L.E. Total carbon, organic carbon, and organic matter. In Methods of Soil Analysis. Part 3. Chemical Methods; Sparks, D.L., Ed.; Soil Science Society of America: Madison, WI, USA, 1996; pp. 961–1010. [Google Scholar]
  54. Gee, G.W.; Bauder, J.W. Particle-size analysis. In Methods of Soil Analysis. Part 1. Physical and Mineralogical Methods, 2nd ed.; Klute, A., Ed.; Soil Science Society of America: Madison, WI, USA, 1986; pp. 383–411. [Google Scholar]
  55. Summer, M.E.; Miller, W.P. Cation exchange capacity and exchange coefficients. In Methods of Soil Analysis. Part 3. Chemical Methods; Sparks, D.L., Ed.; Soil Science Society of America: Madison, WI, USA, 1996; pp. 1201–1229. [Google Scholar]
  56. Jackson, M.L.; Lim, C.H.; Zelazny, L.W. Oxides, hydroxides, and aluminosilicates. In Methods of Soil Analysis. Part 1. Physical and Mineralogical Methods, 2nd ed.; Klute, A., Ed.; Soil Science Society of America: Madison, WI, USA, 1986; pp. 101–150. [Google Scholar]
  57. Harris, W.; White, G.N. X-ray diffraction techniques for soil mineral identification. In Methods of Soil Analysis Part 5—Mineralogical Methods; Ulery, A.L., Drees, L.R., Eds.; Soil Science Society of America: Madison, WI, USA, 2008; pp. 81–115. [Google Scholar]
  58. Biscayes, P.E. Mineralogy and sedimentation of recent deep-sea clays in the Atlantic Ocean and the adjacent seas and oceans. Geol. Soc. Am. Bull. 1965, 76, 803–832. [Google Scholar] [CrossRef]
Figure 1. Tl concentrations (mg kg−1) in the shoots (top) and roots (bottom) of wheat (a) and rice (b) seedlings at 30 DAT across Tl treatments (0–100 mg kg−1) in Pc, Tn, and Tk soils. Values are mean ± standard deviation (n = 3), y-axis breaks indicate compressed ranges for visibility, and different letters (i.e., a, b, c, i, ii, iii, iv, α, β) denote significant differences among Tl doses within each soil by one-way ANOVA followed by Fisher’s protected LSD test (p < 0.05).
Agronomy 15 02918 g001
Figure 2. Tl LIII-edge XANES spectra (black solid lines) and linear combination fits (red dashed lines) of the soil samples spiked with 100 mg kg−1 Tl.
Agronomy 15 02918 g002
Figure 3. Spatial distributions of 205Tl and 39K in the (a) wheat and (b) rice grains with Tl treatment analyzed with LA-ICP-MS (CPS: counts per second).
Agronomy 15 02918 g003
Table 1. Bioaccumulation factors (BAF) of wheat and rice seedlings grown under different soil Tl levels for 30 days.
Soil Tl Level (mg kg−1)Wheat—Pc SoilWheat—Tn SoilWheat—Tk Soil
BAFrBAFsBAFrBAFsBAFrBAFs
1014.915.425.224.82.52.4
2016.014.313.914.12.42.3
4011.610.211.38.82.22.0
1007.56.21.83.51.71.1
Soil Tl Level (mg kg−1)Rice—Pc SoilRice—Tn SoilRice—Tk Soil
BAFrBAFsBAFrBAFsBAFrBAFs
1011.018.211.510.91.10.6
2010.118.97.012.11.30.7
407.912.310.411.51.71.0
1001.02.830.95.30.90.5
BAFr, bioaccumulation factor of Tl in roots; BAFs, bioaccumulation factor of Tl in shoots.
Table 2. Tolerance index (T_ind, %) values of wheat and rice seedlings grown in the soils with varying Tl levels for 30 days.
Soil Tl Level (mg kg−1)WheatRice
Pc SoilTn SoilTk SoilPc SoilTn SoilTk Soil
1043346561085
202326705380
401614573367
1001011504323
Table 3. Linear combination fitting results of the Tl LIII-edge XANES spectra of the soil samples spiked with 100 mg kg−1 Tl.
SoilTl Speciation (%)R Factor (×10−4)
Tl(I)-IlliteTl-Ferrihydrite
Pc94 (2) 6 (2)4.5
Tn95 (3)5 (3)6.8
Tk89 (4)11 (4)13
The number in parentheses is the uncertainty estimated by the Athena software. R = ∑(data − fit)2/∑data2.
Table 4. Tl concentrations and BAF values for roots (r), shoots (s), and grains (g) of wheat and rice grown in Tn soil spiked with 5 mg kg−1 Tl (n = 3).
PlantTl Concentration in Plant Tissue (mg kg−1)BAFrBAFsBAFg
RootsShootsGrains
Wheat11.9 ± 0.719.6 ± 0.20.24 ± 0.62.43.90.05
Rice26.7 ± 0.620.6 ± 1.50.10 ± 0.25.34.10.02
Disclaimer/Publisher’s Note: The statements, opinions and data contained in all publications are solely those of the individual author(s) and contributor(s) and not of MDPI and/or the editor(s). MDPI and/or the editor(s) disclaim responsibility for any injury to people or property resulting from any ideas, methods, instructions or products referred to in the content.