Abstract
Precise distinguishing of maize blends and the evaluation of kernel losses enhances the accurate measurement of harvest loss. To address the low accuracy and poor anti-interference ability of traditional maize kernel detection methods under complex conditions, this paper proposes a multi-channel kernel impact detection algorithm based on discrete wavelet transform (DWT). The algorithm extracts feature band energies of kernel impacts through DWT multi-resolution analysis and counts kernels based on the duration of the energy signal. Therefore, weak signals are able to be effectively detected, thus correcting the missed errors that traditional monitoring systems produce for weak kernel signals. The monitoring system’s efficacy was assessed across various operational conditions. Test findings reveal that within the operating ranges of kernel flow rate of 20–40 kernels/s, sensor mounting angle of 30–60°, and mounting height of 300–500 mm, the system’s average detection accuracy reaches 94.4% and maintains good stability under different conditions. Compared with traditional detection systems, the system designed in this research exhibits superior sensitivity to weak kernel signals and higher monitoring accuracy. Finally, it was verified via practical field experiments that the designed sensor basically achieved the expected performance, and the recognition accuracy of the kernels in the mixture reaches 94%.
1. Introduction
Maize is one of the main staple food crops worldwide, with consistent harvests being vital for food security and sustainable agricultural advancement [1,2]. Mechanization and intelligent development in maize harvesting can reduce labor costs and harvest losses while increasing efficiency, which is essential for safeguarding food security [3]. Currently, the loss rate of most maize harvesters fails to meet the requirements of the new national standards [4], and they are unable to accurately detect maize loss rates under working conditions mixed with impurities such as maize cobs. According to existing research and analysis, kernel loss could lead to economic losses exceeding USD 40 per hectare [5,6]. At present, post-harvest loss detection mainly relies on manual collection and calculation, preventing operators from obtaining real-time information on kernel loss, thus affecting the control of the harvester and ultimately reducing work efficiency and economic returns [7,8]. Therefore, the development of sensors for loss monitoring is crucial for attaining accurate cleaning parameter regulation and enhancing financial returns.
Among current main international loss monitoring sensors, the sensor designed by John Deere for identifying kernel and impurity particles shifts from overall structural vibration sensing to direct local material response, improving the response speed to kernel signals. Its three-layer sandwich structure can locate the kernel’s impact position, enabling the possibility of precise control. However, the calibration model for monitoring kernel loss through electrical signals is easily affected by factors such as kernel mass and mounting angle [9]. Farmwave [10] has developed a kernel harvest loss monitoring device based on machine vision, which calculates kernel loss from images captured by a camera and reduces harvest loss by adjusting the harvester’s forward speed and cleaning fan speed. However, in complex field environments, the vision system is susceptible to interference from lighting, soil color, and crop residue cover. Nevertheless, in-depth analysis shows that both collision-based monitoring (like John Deere) and machine-vision-based monitoring (like Farmwave) face fundamental challenges when dealing with the complex, dynamic actual operating conditions of combine harvesters. Collision-based monitoring systems rely on the mass and velocity of kernels, resulting in poor signal stability and a tendency to miss lightweight kernels. Machine-vision-based monitoring systems are limited by lighting and residue occlusion interference, which affect the reliability and robustness of kernel identification. Therefore, it is necessary to develop a monitoring method that can resist environmental interference and directly extract the essential features of the signal to achieve accurate monitoring of kernel loss.
During the cleaning and separation process of harvesters, many researchers have designed various methods to obtain kernel loss rates. At present, methods for identifying lost maize kernels mainly include sound signals generated by impacts, image recognition, and piezoelectric signals generated by impacts [11,12,13]. Shen Yuhao et al. proposed an acoustic signal-based detection method that improves empirical mode decomposition (EMD) method to denoise the collected acoustic signals while preserving kernel signals, achieving kernel loss detection for wheat kernels [14]. Sound signal recognition identifies kernels and impurities by collecting different sounds produced when they strike a sensitive plate using a microphone. However, in actual operations, the complex working environment of harvesters means external noise interferes with collected sound signals, affecting recognition accuracy [12]. Cheng Shangkun et al. obtained maize kernel pile contour maps using photoelectric sensors and calculated the losses by computing the mass of kernel piles [15]. Environmental dust particles may throw a wrench in the works during image recognition, significantly hampering performance and compromising accuracy. For this reason, it remains primarily at the experimental stage where environmental noise has little impact [3,16]. Wellington et al. [17] proposed an image-based maize kernel monitoring method that classifies kernels and impurities based on differences in color and shape after denoising and segmenting the acquired images, but it is easily affected by environmental conditions such as illumination. Monhollen et al. [18] monitored loss kernels using a camera with a specially designed lighting device, but that system is complex and can be affected by environmental factors such as straw residues. Jahari et al. [19] used dual-illumination machine vision technology, acquiring paddy images with two cooperating light sources and identifying kernels based on image color and shape features; however, under high-frequency kernel flow, kernels tend to pile up and stick together, causing a decrease in recognition accuracy.
Currently, sensors based on the piezoelectric effect have been applied to identify signals of crop kernels such as rice and wheat [20,21,22,23]. Li Yibo et al. established a kernel detection model by extracting kernel signal features through combining time-frequency diagrams of kernel vibration electrical signals and short-time Fourier transform [22,24], but the kernels were dropped from a preset height for the experiments, and the sensor mounting height had a considerable impact on monitoring accuracy. Jin Mingzhi et al. increased the detection accuracy of rice by adding damping rubber to reduce the signal attenuation time [20]. However, damping rubber causes the frequency domains of kernels and impurities to become closer, leading to erroneous counts. Zhou Liming et al. [25] designed a signal-strength-based adaptive threshold voltage comparator to improve the measurement accuracy for wheat, but the threshold changes slowly, making it less suitable for high-frequency kernel impact monitoring and reducing its adaptability.
This study proposes a method for maize kernel recognition by extracting third- and fourth-level signals from the characteristic frequency bands of kernels through a discrete wavelet transform, utilizing the physical properties of maize materials to reconstruct the energy signals. The duration of the characteristic impact energy signal is compressed to approximately 0.5 ms, achieving a higher temporal resolution suitable for high-frequency kernel impacts. Given the inherent stability of maize’s physical properties, the designed monitoring system effectively resists environmental and impurity noise interference, directly extracting essential signal features with enhanced robustness.
In summary, mainstream monitoring systems distinguish kernels from impurities based on differences in physical properties (hardness and elasticity) between the kernel and the piezoelectric sensor [26], using voltage peaks in the time-domain signal or specific frequency components [27,28]. Because impact signals from maize kernels and impurities have similar characteristics, some researchers apply high-pass filtering to remove impurity signals and monitor the number of lost kernels using a fixed threshold [4]. However, once the circuit for this method is designed, the filter parameters are unable to be changed, resulting in poor flexibility and a tendency to miss small kernel signals. Conventional vibration-sensor detection methods are limited by complicated mechanical transmission paths and sensitivity to mounting position, while acoustic-signal-based detection methods are constrained by environmental noise and multiple-reflection interference. This study deeply integrates the time-frequency analysis advantages of the discrete wavelet transform with the physical characteristics of kernel collisions, shifting the detection principle from amplitude to characteristic frequency band energy to enhance the detection capability for small-mass kernels. For various crop varieties, optimal decomposition levels are obtained by inputting their characteristic frequency bands and sampling rates, then reconstructing the energy signals for identification, achieving improved universality. A complete set of optimized feature extraction and detection solutions for frequency bands is also proposed.
2. Materials and Methods
2.1. Maize Loss Materials Preparation
After passing through the cleaning sieve in the maize combine harvester, the maize kernels and broken cob pieces are thrown out together. Most existing studies have concluded that, because of the relatively light weight of crushed husks, the signals generated by the sensitive plate are extremely weak. Therefore, the cleaning material primarily consists of maize kernels and broken maize cobs [12,29]. As shown in Figure 1, the maize variety selected in the experiment are Zhengdan 958 (Weifang City, Shandong Province, China) maize kernels and broken maize cobs.
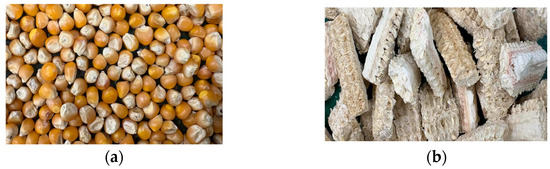
Figure 1.
Cleaning loss material. (a) Maize kernel; (b) maize cob.
2.2. Impact Signal Acquisition Device Design
Traditional sensors directly fix piezoelectric materials to the sensitive plate [30]. Although this improves the sensor’s sensitivity to impact, noise during real operation may cause vibrations, leading to counting errors. To reduce the detection errors caused by environmental noise, the designed device is displayed in Figure 2. The impact signal acquisition device of the loss monitoring sensor consists of a base 304 steel plate (120 mm × 85 mm × 1 mm), damping rubber, an array-type 304 steel plate (80 mm × 10 mm × 1 mm), and a 1 × 8 array-type piezoelectric film sensor (10 mm × 50 mm) (Jinzhou Kexin Electronic Material Co., Ltd., Jinzhou, China). As shown in Figure 2, the damping rubber not only reduces environmental noise but also prevents resonance between adjacent piezoelectric film sensors.
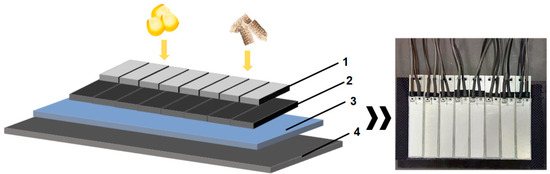
Figure 2.
Impact signal acquisition device. (1) PVDF piezoelectric film; (2) 304 steel plate; (3) damping rubber; (4) 304 steel plate base.
The piezoelectric sensor uses PVDF piezoelectric film sensors produced by Jinzhou Kexin Electronic Material Co., Ltd., Jinzhou, China. Its performance parameters are shown in Table 1.

Table 1.
PVDF piezoelectric film performance parameters.
2.3. Charge Amplifier Circuit Design
The feedback capacitance and feedback resistance of the charge amplifier circuit are adjusted according to the charge amount of the piezoelectric film. In this paper, an RC network is used to convert the charge signal into an equivalent voltage signal. The circuit performance parameters include the transfer sensitivity, cutoff frequency, and voltage decay time, defined as follows:
where is the equivalent output voltage; Q is the charge output generated by the PVDF piezoelectric film; is the cutoff frequency; is the decay time of the output signal; , are the resistance and capacitance as displayed in Figure 3.
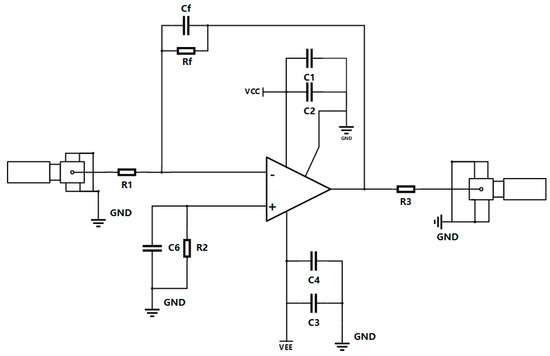
Figure 3.
Charge amplifier circuit.
The data acquisition range of the monitoring system’s data collector is ±5 V. The material falls freely from a height of 400 mm, with a terminal velocity of approximately: . Assuming the impact time is on the order of milliseconds, the expected peak output charge is . Under the condition that the data acquisition input’s maximum range is 5 V, with , the maximum allowable charge is , ensuring the circuit voltage will not saturate. Experimental testing ultimately confirmed meets the design requirements. To minimize signal decay time as much as possible, designed . With a cutoff frequency of 1.6 kHz, the circuit does not affect the acquisition of the kernel and other relevant signals, since their frequencies are all above this limit. The designed charge amplifier circuit is shown in Figure 3, and the impact signals generated by kernels and maize cobs are shown in Figure 4 and Figure 5, respectively.
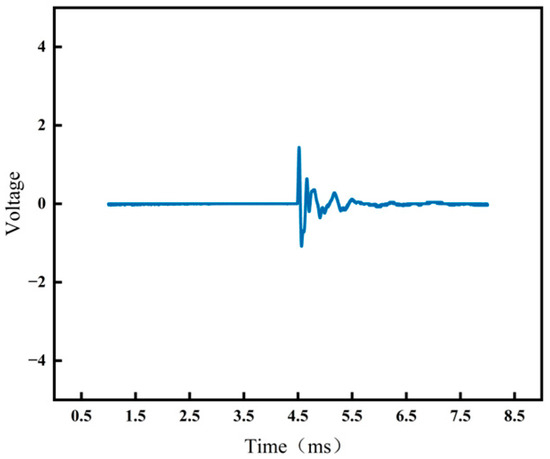
Figure 4.
Voltage signal of kernel.
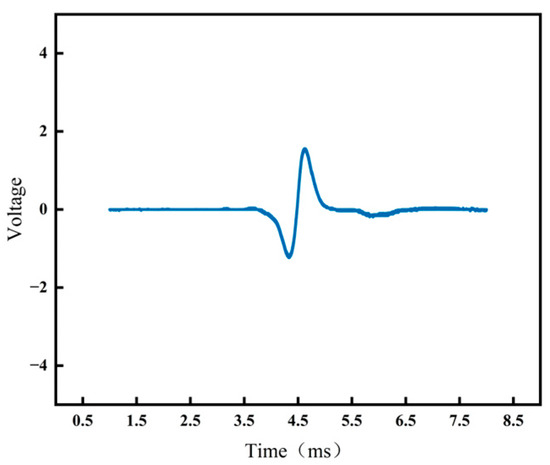
Figure 5.
Voltage signal of cob.
2.4. Signal Analysis of Maize Kernels and Cobs
To study the differences between signals generated by the kernel and cobs on the sensitive plate, maize kernels and broken maize cobs are selected from cleaned materials under the same test conditions. They are dropped from a height of 400 mm to collide with the sensitive plate, and the output signals are collected using an oscilloscope. After impacting the PVDF piezoelectric film, the materials generate voltage signals through the signal circuit. The signals from maize kernels and broken maize cobs are very similar in the time domain and difficult to distinguish. By applying Fast Fourier Transform (FFT), the kernel and maize cob signals are converted into frequency domain graphs, as shown in Figure 6 and Figure 7. Maize cob signals mostly occur at frequencies below 6 kHz, while maize kernel signals still have distribution in the 6 kHz~26 kHz range. Therefore, for signals with similar frequency distributions, discrete wavelet transform (DWT) is used to capture the characteristics of the impact signals. By discretizing the scale and translation parameters, the signals are decomposed into wavelet basis functions at different scales, achieving time-frequency localization analysis of the kernel signals, enhancing the signal characteristics in the characteristic frequency bands, and thereby realizing the separation of maize kernel and impurity signals.
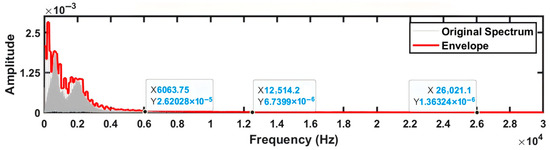
Figure 6.
Cob signal spectrum after FFT transformation.
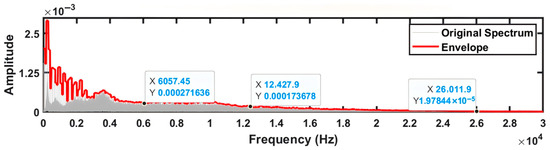
Figure 7.
Kernel signal spectrum after FFT transformation.
2.5. Discrete Wavelet Transform Kernel Monitoring
The collision between maize kernels and the piezoelectric material is essentially a transient impact event, and its voltage signal exhibits the typical short-duration shock characteristics. Traditional sensor detection methods are limited by complex mechanical conduction paths and sensitivity to the mounting location, and the voltage amplitudes produced by maize kernels and impurities are similar, making accurate distinction and counting extremely difficult.
The traditional Fourier transform cannot provide good time and frequency resolutions simultaneously, so an innovative counting algorithm was proposed based on reconstructing the signal duration using the discrete wavelet transform [31,32]. The duration of collisions between kernels and broken maize cobs is about 2 ms, corresponding to 400 samples at a 200 ksps sampling rate, providing a sufficient time-domain resolution for discrete wavelet analysis. The adjustable time-frequency window of the discrete wavelet transform is used to resolve the time-frequency structure of short transient impact signals. Experimental analysis shows that there is an intrinsic difference in frequency-domain characteristics between maize kernels and cobs. Kernel impact signals exhibit broadband characteristics in the frequency domain, mainly concentrated in the 6–26 kHz range. Choosing 6–26 kHz as the kernel feature band can effectively avoid the main bands of mechanical vibration and environmental noise, while covering the high-frequency components of kernel impact signals and avoiding the computational burden of excessively high frequencies.
Discrete wavelet transform decomposes signals into different scale spaces through multi-resolution analysis, and its mathematical expression is:
is the decomposition level; is the translation parameter that controls the position of the wavelet in the time domain; is the conjugate of the mother wavelet; is the input original signal.
In this algorithm, symlet6 wavelet with an approximate linear phase is selected to reduce signal distortion [33]. symlet6 has a short duration with a support length of 11, which highly matches the transient characteristics of kernel collision signals. The time resolution at a sampling rate of 200 ksps is < 2 ms, ensuring that the algorithm can accurately locate the collision starting point, laying the foundation for subsequent accurate counting. Wavelet decomposition is implemented through a series of high-pass and low-pass filters, decomposing the signal into different frequency bands, focusing on the characteristic frequency band of the kernel signal, with the approximate coefficients and detail coefficients at the j-th layer:
After calculating the coverage range of each frequency band and the overlap ratio with the target frequency, reconstruct the detail signals from the selected decomposition levels to obtain the time-domain representations of these bands, using the inverse wavelet transform to reconstruct the detail signals. Based on Parseval’s theorem, this algorithm innovatively constructs multi-band fused energy features. The discrete wavelet transform has the property of energy conservation; that is, the energy of the original signal equals the sum of the energies of the detail signals at each level and the energy of the approximation signal:
is the approximation signal at level J; is the detail signal at level j.
The vibration signals generated by maize kernel collisions are mainly distributed in the frequency band range of 6–26 kHz. Therefore, the set of decomposition layers with the highest target band overlap is selected to calculate the multi-band fusion instantaneous energy , determine the threshold according to the energy characteristics, and detect the kernel signals with sudden energy increases.
Band-optimized selection mechanism:
Traditional selection of wavelet decomposition levels often relies on experience or trial and error. To address this, this paper proposes an optimized wavelet decomposition level selection mechanism based on frequency coverage assessment, which dynamically selects the optimal combination of decomposition levels by quantifying the degree of matching between each decomposition level and the target feature frequency band. This mechanism, by taking into account the physical characteristics of kernel collisions and the system sampling parameters, quantifies the extent to which wavelet sub-bands utilize the target band and evaluates the proportion of the target band covered by the analyzed sub-bands. It automatically determines the optimal combination of wavelet decomposition levels to achieve feature extraction. According to the signal band analysis of kernel and maize cob in Section 2.4, the characteristic frequency band is 6–26 kHz. By selecting wavelet decomposition levels that match the characteristic frequencies of kernel collisions, the instantaneous energy of each band is extracted and fused into a composite energy feature to realize collision event detection.
For the level wavelet decomposition, its corresponding frequency range is:
is the sampling frequency. The calculation of the overlap is based on the ratio of the intersection to the union of frequency intervals, using the following mathematical expression:
Overlap length:
Target frequency bandwidth:
Wavelet bandwidth:
Normalized overlap:
measures the band coverage efficiency; measures the target band coverage completeness. .
reduces subjectivity in weight assignment to some extent and achieves balanced optimization of dual indicators through multiplication operations. Ultimately, the two decomposition layers 3 and 4 were selected with the combined frequency band [6.25 kHz, 25 kHz], achieving 93.75% coverage of the target frequency band and effectively covering its core region. By selectively reconstructing the target decomposition layers, computational load is reduced. Further analysis of processing performance shows that the processing time for 20 s of single-channel data is approximately 0.2 s, significantly less than the data acquisition time, thus meeting the stringent real-time processing delay requirements for combine harvester detection.
By concentrating the energy distributed across multiple related frequency bands, the collision characteristics of the kernels are enhanced, frequency bands unrelated to the collision features are ignored, and noise interference is reduced. The energy fusion preserves the time resolution of the original signal, making it easier to locate kernel collision events. The result of the maize kernel signal after discrete wavelet transforms and reconstruction is shown in Figure 8.
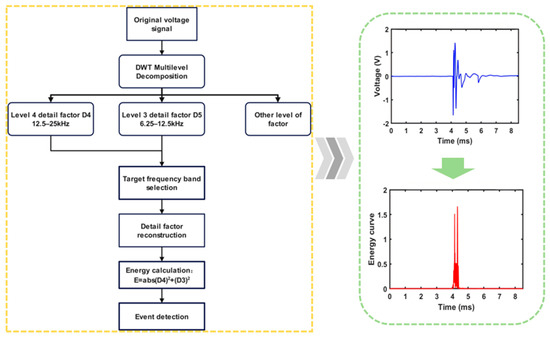
Figure 8.
A schematic diagram of the signal processing system.
2.6. Traditional Kernel Monitoring Systems
In order to quantify the system noise, the traditional monitoring system collected noise signals consisting only of impurities with the sensor mounted at a 40° angle and a height of 400 mm. This signal was processed through the same 4th-order Butterworth band-pass filter (6–26 kHz) and envelope extraction as the kernel signals; the measured voltage amplitude range was 0.01–0.374 V. To avoid false counts caused by noise and to provide a safety margin, the voltage trigger was set slightly above the measured maximum noise signal at 0.4 V. Under the same conditions, the envelope amplitudes of the vast majority of kernel impact signals were significantly higher than the trigger value, with a typical distribution range of 0.59–1.87 V. Therefore, setting 0.4 V as the voltage trigger ensures the system can effectively detect kernel signals and reduces the background noise false alarm rate to zero. After filtering and envelope detection, the signal is converted into a square wave by the voltage trigger for counting. To avoid interference from instantaneous noise signals, the duration of the square wave signal must be greater than formula (3) (the decay time of the charge amplifier circuit signal) for a kernel to be counted.
2.7. Design of a Maize Kernel Loss Monitoring System
The impact of loss maize kernels and impurities on the PVDF piezoelectric film generates a mixed impact signal after passing through a charge amplification circuit. Figure 9 shows the original input kernel signal. By applying the discrete wavelet transform to extract kernel characteristic signals within the 6.25–25 kHz frequency range, energy signals produced by maize kernels can be obtained while signals from cobs are filtered out. Figure 10 and Figure 11 show the voltage signals of the original voltage signal transformed into energy curves using traditional filtering and discrete wavelet energy transformation, respectively.
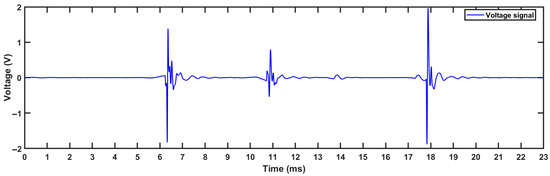
Figure 9.
Original kernel voltage signal.
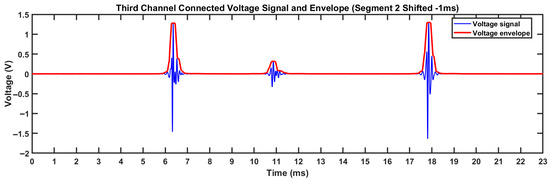
Figure 10.
Filtered kernel signal.
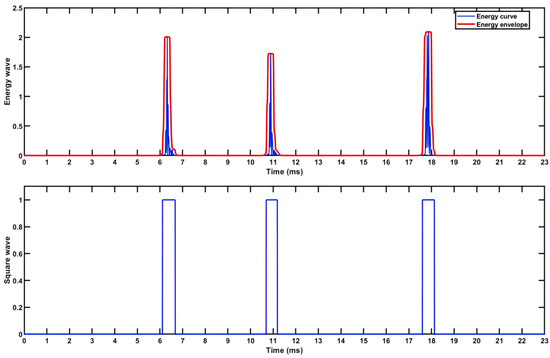
Figure 11.
Energy envelope signal and square wave counting signal.
It can be observed that, during kernel identification, since the duration of the energy signal is approximately 0.5 ms, two kernel signals separated by more than 0.5 ms can be accurately identified. Compared to traditional monitoring systems where the detection time for a single kernel is about 2 ms, the proposed detection method reduces kernel processing time. As shown in Figure 10, traditional filtering may further weaken subtle kernel signal features, leading to missed kernel counts. In contrast, as demonstrated in Figure 11, the energy curve derived from the discrete wavelet transform enhances weak kernel signal characteristics, thereby reducing missed detections compared to conventional methods.
During monitoring, some external disturbances still cause slight vibrations within the 6.25 kHz to 25 kHz range, potentially generating interfering signals. To reduce errors in identification and counting, this system proposes a counting method based on the output duration of energy signals, excluding those with durations shorter than the time constant of the charge amplification circuit, .
The schematic diagram of the maize loss monitoring system is shown in Figure 12. The system consists of a loss monitoring sensor, signal processing circuitry, an FPGA development board, and an upper computer. When different materials impact the sensor, the sensor transmits charge signals to the signal processing circuit. These signals are then acquired by the FPGA development board and transmitted via Ethernet to the host computer for detection and kernel counting.
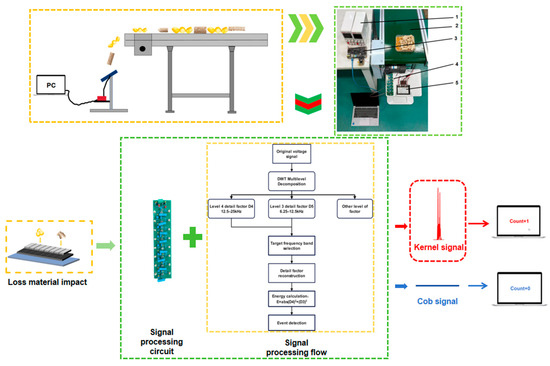
Figure 12.
Monitoring system and signal processing flowchart. (1) Power; (2) conveyor belt; (3) FPGA development board and acquisition card; (4) signal processing circuit; (5) impact signal acquisition device.
3. Results and Discussion
3.1. Sensor Testing Performance Across Varying Flow Rates and Mounting Locations
In this study, the maize kernel sensor was placed at the outlet and subjected to impact from the material using a conveying device in the indoor laboratory. To comprehensively evaluate changes in the sensor monitoring accuracy in various operating conditions, the experiment selected the combine harvesters with a typical maximum feeding rate of 10 kg/s as the reference condition. Thus, this experiment controls the kernel flow rate at 20–40 grains/s [8,34], ensuring that all kernel samples impacted the sensor within 10 s. Based on sensor mounting angles and height parameters documented in the existing study [3,12,29], the research involved numerous comparative tests on various mounting heights and angles. Specific experimental parameters are detailed in Table 2, and trials were triplicated to validate the result consistency.
Table 2.
Experimental condition settings.
To compare and analyze the differences in the monitoring performance of sensors under various working conditions, experiments were conducted by testing the sensors under diverse kernel flow conditions and at different mounting heights and positions.
Figure 13 illustrates the monitoring accuracy when sensors are impacted at different mounting position under various flow conditions, and Figure 13a–c depicts experimental outcomes for flow rates of 20, 30, and 40 grains per second. To achieve a deeper understanding of how the mounting height and angle of sensor placement impact the precision of system and the interplay of different elements, we use the Design-Expert 13 software for conducting an objective analysis.
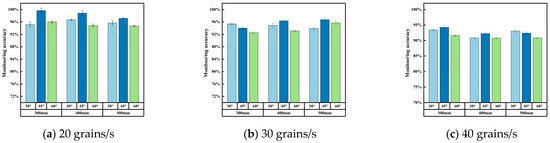
Figure 13.
Monitoring accuracy under different experimental conditions.
The comprehensive findings are meticulously displayed in Table 3. In Table 3, variables A, B, and C denote kernel flow, mounting height and mounting angle, respectively.
Table 3.
Variance analysis of regression equation.
In Table 3, the regression analysis yielded highly statistically significant results (p < 0.01), thus validating a considerable functional connection between the model and the independent variables. Concurrently, the p-value exceeding 0.1 for the ‘Lack of Fit’ factor suggests the regression model exhibits superior fit quality. While the sensor mounting height failed to present as statistically significant (p > 0.05), implying that kernel impact height variations do not substantially influence the sensor monitoring precision, the mounting angle was statistically significant, with a p-value below 0.05 that highlights its effect on monitoring precision.
The statistical analysis reveals that the flow rate has a remarkable influence on monitoring accuracy, because of the p-value falling below the 0.01 threshold. When examining multi-factor interactions, we find that both the combined effect of the flow rate and sensor mounting angle (AC) and the interplay between the sensor mounting height and mounting angle (BC) demonstrate statistical significance, with their respective p-values lower than 0.05. These findings clearly reveal that these interaction factors play a substantial role in monitoring.
The subfigures (a–c) of Figure 14 illustrate the influence of different experimental factors on precision after testing the sensor’s performance at various mounting heights and angles under a flow rate of 20–40 grains/s.
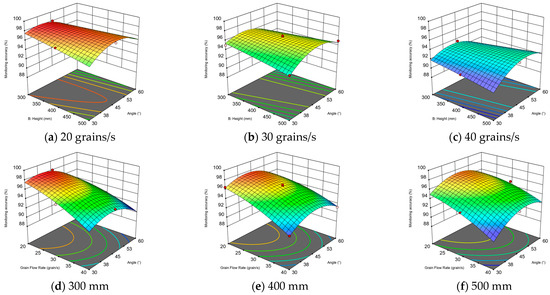
Figure 14.
Impact of combined factors on monitoring accuracy.
The subfigures (d–f) of Figure 14 shed light on how changes in the kernel flow rate and mounting angle impact monitoring accuracy at three different kernel impact levels—300, 400, and 500 mm. To elucidate the functional dependence of monitoring accuracy on key parameters, response surface curves are used to analyze the relationship between each influencing factor and the sensor monitoring accuracy.
- (1)
- Analysis of the significant impact of the kernel flow rate on monitoring accuracy
The data from Table 3 and Figure 14 illustrates an obvious correlation between kernel flow rate and accuracy. Monitoring accuracy and kernel flow rate have an inverse relationship. At a rate of 20 grains flowing per second, the sensor shows high precision, reaching a remarkable 96.5% accuracy. However, when the rate jumps to 30 grains per second, the accuracy takes a hit, dipping down to 94.7%. And at a flow rate of 40 grains per second, the precision declines even further, settling at 92.1%. Once the kernel flow rate surges dramatically, the sensors will be instantly overwhelmed by a large amount of kernel. If the impact intervals between kernels are too small, there is undoubtedly a risk of missed detections. Collisions among kernels may also cause some kernels to leave the monitoring zone, resulting in missed counts. Existing test results on kernel loss monitoring sensors indicate that signal decay time is a direct factor limiting sensor performance [35,36]. By reducing the signal decay time for individual kernels, the monitoring system’s accuracy within a given time unit can be improved. This study reconstructs characteristic frequency band energy signals through discrete wavelet transform technology, reducing single-core monitoring time consumption to 25% of the original solution, thus significantly enhancing the monitoring system’s detection capabilities.
- (2)
- Analysis of the insignificant impact of the sensor mounting height on monitoring accuracy
Analysis of Table 3 and Figure 14 indicates that the mounting height (B) does not exert a statistically significant effect on precision (p > 0.05) under the premise of fixed angle. However, this observation diverges from the existing consensus in the research [3,37], which asserts a marked influence of impact height on the performance of loss monitoring sensors. In contrast to the traditional method, the detection method proposed in this paper, based on discrete wavelet transform (DWT), identifies characteristic frequencies (6–26 kHz) excited by maize kernel collisions, which are determined by material properties and structural mechanics and are independent of the sensor mounting height. By selectively reconstructing the characteristic frequency bands to ensure the physical consistency of the detection basis and utilizing the duration parameter of the energy signal to achieve the effective monitoring of kernels, the interference of the mounting height can be further reduced, and the robustness is stronger than that of traditional methods. Current studies indicate monitoring systems are typically mounted at heights of 250–550 mm [6,12,38]. Thus, the established monitoring system height satisfies the criteria.
- (3)
- Analysis of the significant impact of the sensor mounting angle on monitoring accuracy
Figure 14 illustrates that the sensor’s monitoring precision climbs at first and then plateaus, showing a pattern that mirrors earlier research outcomes [39,40]. This trend is observed as the sensor’s mounting angle shifts between 30° and 60°. Analysis of the possible causes for this trend leads to the following conclusions: when the mounting angle is set too low, irregular kernel motion may cause secondary rebound after impacting the sensor, leading to collisions with surrounding kernels and thus reducing measurement accuracy. Conversely, excessive mounting angles reduce the monitoring coverage, possibly preventing the kernel impact with the sensor and causing counting inaccuracies. Based on the above analysis, the typical feeding capacity for a maize combine harvester ranges from 6 to 10 kg/s [1]. The current study indicates that during harvesting at a throughput of 10 kg/s, the sensor receives kernel impact frequencies between 20 and 40 grains per second [8,34,36], which falls within the kernel flow conditions tested in this study. Consequently, under standard field conditions, our monitoring system come to an average precision of 94.4%, which is basically sufficient to satisfy industry standards for assessing maize loss in agricultural settings.
3.2. Monitoring System Comparison Test
To assess the benefits of the kernel monitoring system, this experiment designed comparative tests with a traditional monitoring system that converts filtered signals into envelope signals and detects kernel signals through signal duration. The impact signal acquisition equipment and signal processing circuit remain consistent in both systems. To evaluate the monitoring capability of the sensor, experiments are conducted at 40° with a mounting height of 400 mm. Then, both systems’ accuracy is contrasted at various levels of material loss. Multiple compound combinations are formulated and mixed [41,42,43], as detailed in Table 4. Each experimental configuration is repeated three times.
Table 4.
Mixture material design.
Figure 15 presents comparative evaluation data for the novel monitoring system versus the traditional system. The data reveals that when the proportion of material loss is at a low level, the monitoring accuracy shows the lowest value when adding 5% mass proportion of samples. As the proportion of lost material increases, the accuracy of both monitoring systems shows a certain degree of improvement. Through experiments, it was found that, compared to traditional monitoring systems, the system proposed in this study achieved an average recognition precision for kernels in mixtures that were 6.2%, 5.2%, and 5.1% higher, respectively. This is because traditional loss monitoring systems rely on filtered voltage amplitude extracted from time-domain signals, and when the kernel mass proportion is small, there are more broken maize cobs. Due to the non-uniform mass and volume of maize cobs, larger maize cobs easily collide with kernels, causing the generated voltage amplitude to decrease, which severely degrades the performance of traditional monitoring systems and results in missed monitoring. Discrete wavelet transform focuses on the physical characteristic frequency of kernels and is less affected by changes in collision methods. Through energy detection and characteristic frequency band analysis, kernel features are better enhanced, noise interference is reduced, and missed monitoring is decreased.
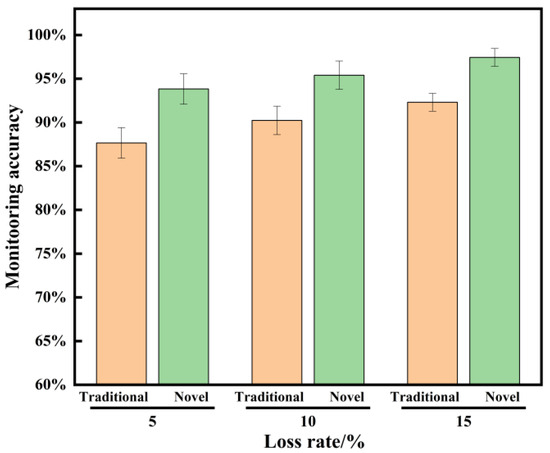
Figure 15.
Accuracy comparison of different monitoring systems.
Due to the random shape and mass of broken maize cobs, monitoring becomes difficult. During their fall, larger broken cob fragments may collide with other cobs or kernels, increasing errors.
As shown in Figure 15, comparative experiments under different kernel loss rates indicate that the traditional monitoring system achieves an average accuracy of 90.1%, while the system designed in this study achieves an average accuracy of 95.5%, representing a 5.4% improvement over the traditional system. This is because the traditional system relies solely on voltage amplitude in a specific frequency domain for identification; kernel signals that collide with cobs may have reduced amplitudes and thus be missed, leading to increased counting errors. Therefore, the proposed system, which enhances kernel energy features, demonstrates superior and more stable performance.
3.3. Actual Field Test
As shown in Figure 16, to evaluate the performance of the kernel loss sensor, tests were conducted in Weifang City, Shandong Province in October 2025. The planting variety was Zhengdan 958. The test used the Lovol Gushen 4LZ-7G1A tracked full-feed combine harvester (Weichai Lovol Smart Agriculture Technology Co., Ltd., Weifang, China), with a cutting width of 2300 mm, engine power of 89 kW, feeding speed of 7 kg/s, and a grain tank capacity of 1450 L. The experiment was based on the Lovol Gushen 4LZ-7G1A platform (Weichai Lovol Smart Agriculture Technology Co., Ltd., Weifang, China), with 20 m standard operating area Zhengdan 958 maize as the test subject. The signal processing circuit and acquisition device can be powered by a rechargeable lithium battery, converting the charge signal generated by the collision signal into a voltage signal for acquisition. During the test, a mesh bag was used to synchronously collect the mixture falling on the sensor. The collected kernels were then manually counted. The test results and manually counted kernel quantities are shown in Table 5.
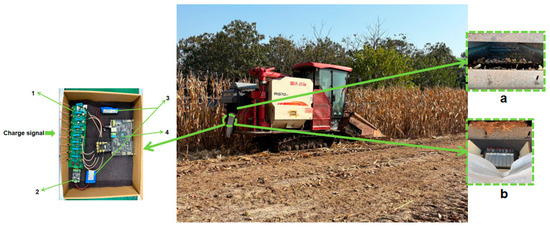
Figure 16.
Monitoring device mounting diagram. a. Clean screening sieve; b. impact signal acquisition device. 1. Signal processing circuit; 2. voltage module; 3. power; 4. signal acquisition equipment.
Table 5.
Maize monitoring experimental data.
Figure 17a shows the original signal in the field experiment, Figure 17b shows the energy signal features of the third and fourth layers extracted from the original signal using a discrete wavelet transform, which are converted into the envelope signal as shown in Figure 17c. Finally, grain counting is performed using the square wave in Figure 17d.
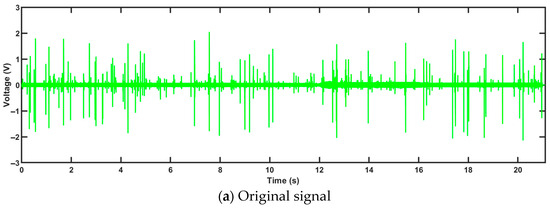
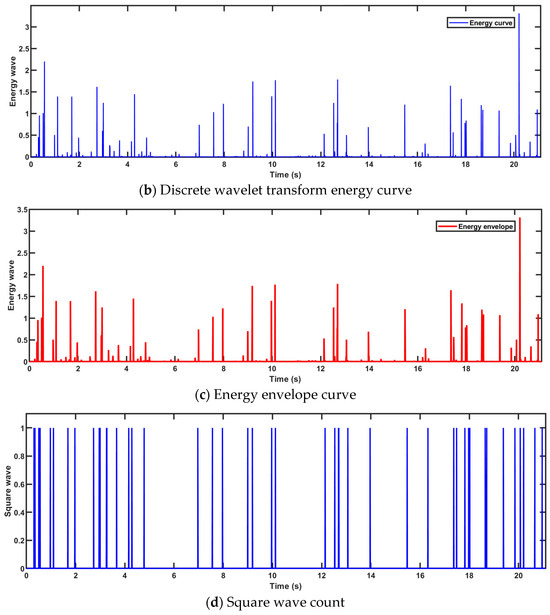
Figure 17.
Original signal and recognition count results.
In the maize kernel loss detection experiment, although two sets of data show monitoring accuracy below 93%, this may have been due to excessive airflow from the wind sieve, which blew the kernels directly into the collection bag without colliding with the sensor. The system’s mean monitoring precision achieving 94% basically meets the technical specifications of the loss monitoring system, verifying its ability to achieve the expected performance objectives.
4. Conclusions
To address the problems of low recognition accuracy and poor anti-interference capability in maize kernel loss monitoring systems, this study examined the frequency domain signal differences in piezoelectric signals among different maize samples. Because of the frequency domain differences between different maize materials, an algorithm was proposed that extracts the third and fourth layer signals through a discrete wavelet transform, reconstructs the energy signal of kernels, and uses the duration of the energy signal for kernel counting. This solves the problem of traditional sensors missing weak kernel signals and reduces the processing time of kernel signals. A frequency-band-optimized selection mechanism was proposed, which establishes a dual-index evaluation model of coverage efficiency and coverage integrity to achieve optimal matching of the characteristic frequency band (6–26 kHz) for maize kernel collisions. This overcomes the limitations of traditional methods that rely on empirical settings to some extent. To validate the dependability of the novel sensor apparatus, tests under variable working conditions including different sensor mounting angles, heights, and different kernel flow rates, as well as comparative performance tests of different monitoring systems, showed that the system has a stable monitoring performance with an average accuracy rate maintained at 94.4%. This experiment establishes a solid theoretical groundwork for implementing the monitoring solution in real-world applications. Field trials conclusively demonstrated that the custom-designed sensor maintains an average 94% detection rate and has good recognition capability for kernels in mixtures.
Future research can conduct integrated testing on a higher feed rate and more advanced combine harvester platforms to further explore the performance boundaries and universality of the system under extreme working conditions. Additionally, more diversified datasets should be collected, including different maize varieties and extreme noise interference scenarios, to train and test a more universal monitoring system, thereby further enhancing the system’s versatility.
Author Contributions
Conceptualization, W.Y.; methodology, W.Y.; software, W.C.; validation, W.C. and F.Z.; formal analysis, W.C.; investigation, W.C.; resources, W.Y.; data curation, W.C.; writing—original draft preparation, W.C.; writing—review and editing, W.Y. and F.Z.; visualization, W.C.; supervision, W.Y.; project administration, W.Y.; funding acquisition, W.Y. All authors have read and agreed to the published version of the manuscript.
Funding
This research was funded by [National Key R&D Program of China] grant number [No. 2024YFD2000103].
Data Availability Statement
The original contributions presented in this study are included in the article. Further inquiries can be directed to the corresponding author.
Conflicts of Interest
The authors declare that they have no known competing financial interests or personal relationships that could have appeared to influence the work reported in this paper.
References
- Fan, C.; Zhang, D.; Yang, L.; Cui, T.; He, X.; Zhao, H.; Dong, J. Development and performance evaluation of a guide vane inclination automatic control system for corn threshing unit based on feedrate monitoring. Comput. Electron. Agric. 2022, 194, 106745. [Google Scholar] [CrossRef]
- Wojcieszak, D.; Przybył, J.; Czajkowski, Ł.; Majka, J.; Pawłowski, A. Effects of Harvest Maturity on the Chemical and Energetic Properties of Corn Stover Biomass Combustion. Materials 2022, 15, 2831. [Google Scholar] [CrossRef]
- Gou, F.; Wang, J.; Ni, Y.; Qian, Z.; Yang, T.; Jin, C. A Review of Innovative Design and Intelligent Technology Applications of Threshing Devices in Combine Harvesters for Staple Crops. INMATEH Agric. Eng. 2025, 75, 706–725. [Google Scholar] [CrossRef]
- Wang, Z. Design of Threshing and Separating Device about Corn Grain Harvester and Automatic Control System of Entrainment Loss. Master’s Thesis, Jiangsu University, Zhenjiang, China, 2021. [Google Scholar]
- Yang, Q.; Zhang, P.; Ma, Z.; Liu, D.; Guo, Y. Agricultural Economic Resilience in the Context of International Food Price Fluctuation—An Empirical Analysis on the Main Grain–Producing Areas in Northeast China. Sustainability 2022, 14, 14102. [Google Scholar] [CrossRef]
- Dong, J.; Cui, T.; Zhang, D.; Yang, L.; He, X.; Xiao, T.; Li, C.; Xing, S.; Jiang, Y.; Wang, H. Design and test of real-time monitoring system for maize entrainment loss based on piezoelectric signal classification. Measurement 2025, 242, 116050. [Google Scholar] [CrossRef]
- Bomoi, M.I.; Nawi, N.M.; Abd Aziz, S.; Mohd Kassim, M.S. Sensing Technologies for Measuring Grain Loss during Harvest in Paddy Field: A Review. AgriEngineering 2022, 4, 292–310. [Google Scholar] [CrossRef]
- Liu, Y.; Li, M.; Wang, J.; Feng, L.; Wang, F.; He, X. Design and test of entrainment loss detection system for corn kernel direct harvester. Nongye Jixie Xuebao/Trans. Chin. Soc. Agric. Mach. 2023, 54, 140–149. [Google Scholar]
- Bischoff, L.; Pfeiffer, D.W.; Phelan, J.J. Particulate Matter Impact Sensor. U.S. Patent 10,126,153, 13 November 2018. [Google Scholar]
- Farmwave Vision Systems [EB/OL]. Available online: https://farmwave.com/collections/farmwave-vision-systems (accessed on 3 September 2025).
- Yaoming, L.; Yi, C. Monitoring method and device of attachment loss in combine harvester. Int. Agric. Eng. J. 2011, 20, 14–19. [Google Scholar]
- Wu, Y.; Li, X.; Mao, E.; Du, Y.; Yang, F. Design and development of monitoring device for corn grain cleaning loss based on piezoelectric effect. Comput. Electron. Agric. 2020, 179, 105793. [Google Scholar] [CrossRef]
- Liu, C.; Leonard, J. Monitoring actual grain loss from an axial flow combine in real time. Comput. Electron. Agric. 1993, 9, 231–242. [Google Scholar] [CrossRef]
- Shen, Y.; Gao, J.; Jin, Z. Research on Acoustic Signal Identification Mechanism and Denoising Methods of Combine Harvesting Loss. Agronomy 2024, 14, 1816. [Google Scholar] [CrossRef]
- Cheng, S.; Han, H.; Qi, J.; Ma, Q.; Liu, J.; An, D.; Yang, Y. Design and Experiment of Real-Time Grain Yield Monitoring System for Corn Kernel Harvester. Agriculture 2023, 13, 294. [Google Scholar] [CrossRef]
- Fu, J.; Yuan, H.; Zhao, R.; Chen, Z.; Ren, L. Peeling Damage Recognition Method for Corn Ear Harvest Using RGB Image. Appl. Sci. 2020, 10, 3371. [Google Scholar] [CrossRef]
- Wellington, C.K.; Bruns, A.J.; Sierra, V.S.; Phelan, J.J.; Hageman, J.M.; Dima, C.; Boesch, H.; Herman, H.; Pezzementi, Z.A.; Male, C.R. Grain Quality Monitoring. U.S. Patent 10,664,726, 26 May 2020. [Google Scholar]
- Monhollen, N.S.; Shinners, K.J.; Friede, J.C.; Rocha, E.M.C.; Luck, B.D. In-field machine vision system for identifying corn kernel losses. Comput. Electron. Agric. 2020, 174, 105496. [Google Scholar] [CrossRef]
- Jahari, M.; Yamamoto, K.; Miyamoto, M.; Kondo, N.; Ogawa, Y.; Suzuki, T.; Habaragamuwa, H.; Ahmad, U. Double Lighting Machine Vision System to Monitor Harvested Paddy Grain Quality during Head-Feeding Combine Harvester Operation. Machines 2015, 3, 352–363. [Google Scholar] [CrossRef]
- Jin, M.; Zhao, Z.; Chen, S.; Chen, J. Improved piezoelectric grain cleaning loss sensor based on adaptive neuro-fuzzy inference system. Precis. Agric. 2022, 23, 1174–1188. [Google Scholar] [CrossRef]
- Li, M.; Zhao, J.; Yang, X. Building a new machine learning-based model to estimate county-level climatic yield variation for maize in Northeast China. Comput. Electron. Agric. 2021, 191, 106557. [Google Scholar] [CrossRef]
- Li, Y.; Hou, Y.; Cui, T.; Tan, D.S.; Xu, Y.; Zhang, D.; Qiao, M.; Xiong, L. Classifying grain and impurity to assess maize cleaning loss using time–frequency images of vibro-piezoelectric signals coupling machine learning. Comput. Electron. Agric. 2024, 227, 109583. [Google Scholar] [CrossRef]
- Yilmaz, D.; Sagiroglu, H.C. Development of measurement system for grain loss of some chickpea varieties. Measurement 2015, 66, 73–79. [Google Scholar] [CrossRef]
- Mashayekhi, M.; Estekanchi, H.E.; Vafai, H. Simulation of Endurance Time Excitations via Wavelet Transform. Iran. J. Sci. Technol.-Trans. Civ. Eng. 2019, 43, 429–443. [Google Scholar] [CrossRef]
- Zhou, L.; Yuan, Y.; Zhang, J.; Niu, K. Improving Design of a PVDF Grain Loss Sensor for Combine Harvester. In Computer and Computing Technologies in Agriculture XI, Proceedings of the 11th IFIP WG 5.14 International Conference, CCTA 2017, Changchun, China, 12–15 August 2017; Springer: Cham, Switzerland, 2017; pp. 208–217. [Google Scholar]
- Al-Sammarraie, M.; Alhadithy, S. Determination of Grain Losses on Combine Harvester. J. Sci. Eng. Res. 2021, 8, 196–202. [Google Scholar]
- Qu, Z.; Lu, Q.; Shao, H.; Le, J.; Wang, X.; Zhao, H.; Wang, W. Design and Test of a Grain Cleaning Loss Monitoring Device for Wheat Combine Harvester. Agriculture 2024, 14, 671. [Google Scholar] [CrossRef]
- Xu, L.; Wei, C.; Liang, Z.; Chai, X.; Li, Y.; Liu, Q. Development of rapeseed cleaning loss monitoring system and experiments in a combine harvester. Biosyst. Eng. 2019, 178, 118–130. [Google Scholar] [CrossRef]
- Wang, Z.; Che, D.; Bai, X. Design and experiment of cleaning loss monitoring device for corn combined harvester. Trans. Chin. Soc. Agric. Mach 2018, 49, 100–108. [Google Scholar] [CrossRef]
- Zhang, M.; Jiang, L.; Wu, C.; Wang, G. Design and Test of Cleaning Loss Kernel Recognition System for Corn Combine Harvester. Agronomy 2022, 12, 1145. [Google Scholar] [CrossRef]
- Kaveh, A.; Mahdavi, V.R. A new method for modification of ground motions using wavelet transform and enhanced colliding bodies optimization. Appl. Soft Comput. 2016, 47, 357–369. [Google Scholar] [CrossRef]
- Kaveh, A.; Mahdavi, V.R. Modification of ground motions using wavelet transform and VPS algorithm. Earthq. Struct. 2017, 12, 389–395. [Google Scholar] [CrossRef]
- Priyadarshini, M.S.; Bajaj, M.; Zaitsev, I. Energy feature extraction and visualization of voltage sags using wavelet packet analysis for enhanced power quality monitoring. Sci. Rep. 2025, 15, 2226. [Google Scholar] [CrossRef] [PubMed]
- Liu, G.; Yang, Y.; Guo, X.; Liu, W.; Xie, R.; Ming, B.; Xue, J.; Wang, K.; Li, S.; Hou, P. A global analysis of dry matter accumulation and allocation for maize yield breakthrough from 1.0 to 25.0 Mg ha−1. Resour. Conserv. Recycl. 2023, 188, 106656. [Google Scholar] [CrossRef]
- Liang, Z. Selecting the proper material for a grain loss sensor based on DEM simulation and structure optimization to improve monitoring ability. Precis. Agric. 2021, 22, 1120–1133. [Google Scholar] [CrossRef]
- Dong, J.; Zhang, D.; Yang, L.; Cui, T.; He, X.; Ma, R.; Zhao, H.; Li, C.; Xing, S. Design and experiment of maize kernel loss monitoring system based on signal interval duration. Comput. Electron. Agric. 2023, 213, 108230. [Google Scholar] [CrossRef]
- Wei, D.; Wu, C.; Jiang, L.; Wang, G.; Chen, H. Design and Test of Sensor for Monitoring Corn Cleaning Loss. Agriculture 2023, 13, 663. [Google Scholar] [CrossRef]
- Li, J.; Liang, Z.; Zhu, F.; Liu, C. Optimum of Grain Loss Sensors by Analyzing Effects of Grain Collision Attitude on Signal Characteristics. Electronics 2022, 11, 3187. [Google Scholar] [CrossRef]
- Li, Y.M.; Liang, Z.W.; Zhao, Z.; Xu, L.Z.; Chen, Y.; Tang, Z. Calibration experiment of grain loss monitoring sensor in combine harvester. Trans. Chin. Soc. Agric. Mach. 2012, 43, 79–83. [Google Scholar] [CrossRef]
- Dong, J.; Zhang, D.; Yang, L.; Cui, T.; He, X.; Jing, M.; Li, C.; Xing, S.; Jiang, Y. Research on monitoring model for maize entrainment loss sensor applicable to different operating parameters. Comput. Electron. Agric. 2024, 220, 108854. [Google Scholar] [CrossRef]
- Li, Y.; Tan, D.S.; Cui, T.; Fan, H.; Xu, Y.; Zhang, D.; Qiao, M.; Hou, Y.; Xiong, L. Design and validation of novel maize grain cleaning loss detection system based on classification models of particle time-domain signals. Comput. Electron. Agric. 2024, 220, 108908. [Google Scholar] [CrossRef]
- Wang, K.; Xie, R.; Ming, B.; Hou, P.; Xue, J.; Li, S. Review of combine harvester losses for maize and influencing factors. Int. J. Agric. Biol. Eng. 2021, 14, 1–10. [Google Scholar] [CrossRef]
- Du, Y.; Zhang, L.; Mao, E.; Li, X.; Wang, H. Design and experiment of corn combine harvester grain loss monitoring sensor based on EMD. Trans. Chin. Soc. Agric. Mach. 2022, 53, 158–165. [Google Scholar]


Disclaimer/Publisher’s Note: The statements, opinions and data contained in all publications are solely those of the individual author(s) and contributor(s) and not of MDPI and/or the editor(s). MDPI and/or the editor(s) disclaim responsibility for any injury to people or property resulting from any ideas, methods, instructions or products referred to in the content. |
© 2025 by the authors. Licensee MDPI, Basel, Switzerland. This article is an open access article distributed under the terms and conditions of the Creative Commons Attribution (CC BY) license (https://creativecommons.org/licenses/by/4.0/).