Abstract
Autonomous mowers’ navigation pattern plays a crucial role in turfgrass quality, influencing both esthetic and functional performance. However, despite extensive research on mowing efficiency, the effects of different navigation patterns on turfgrass damage and visual quality remain inadequately investigated. This study aimed to evaluate the impact of three different autonomous mower navigation patterns (random, vertical, and chessboard) on operational performance and the effect of trampling activity on turfgrass. Each pattern was tested in terms of data on the number of passages, distance traveled (m), number of intersections and the percentage of area mowed using a remote sensing system and an updated custom-built software. Green coverage percentage was assessed weekly using image analysis (Canopeo app) to evaluate the turfgrass green coverage. The green coverage percentage, together with the number of passages, is analyzed and correlated. The random pattern generated the highest number of passages and intersections, leading to lower average green coverage (64%) compared with the chessboard (80%) and vertical (81%) patterns. Data of the green coverage percentage in the function of the average number of passages recorded using the custom-built software for each pattern fit the asymptotic regression model. The effective number of passages to reach 60% green cover (EP60) was 56.26, 87.30, and 155.32 for random, vertical, and chessboard, respectively. The model could be integrated into DSS, useful for the end user in turf management in order to maintain a high quality. Future studies should extend this approach to other species and environmental conditions, integrating the effective dose (in terms of passages) method for smart mowing management.
1. Introduction
Healthy lawns and well-kept landscapes help prevent erosion caused by water, support flood control, improve air quality, and enhance the visual appearance of green area, boosting, for example, the visual appeal of entire neighborhoods in the cities [1,2,3]. In this regard, urban municipalities and urban planners consider the lawn design as an additional and supportive key component of a sustainable environment, where esthetic, ecological, and social perspectives should be thoughtfully integrated and balanced [4]. While ecological aspects can be analyzed and quantified more easily, the esthetic and social ones are much harder to measure; what is certain for esthetic aspects is that a healthy, unstressed lawn will be able to maintain a higher degree of esthetic quality [5]. Among the stress factors, repeated foot and machine traffic is a major stress factor that impacts lawn appearance, often causing patches with faded green color and poor grass growth [6]. In this context, turfgrasses are widely used in residential, recreational, and urban landscapes due to their uniform appearance, durability, and ability to provide ecosystem services such as soil stabilization and microclimate regulation [7]. Their esthetic and functional value makes them a key component of well-maintained public green spaces. Because of their prevalence and the high frequency of mowing operations required to maintain them, turfgrasses are particularly sensitive to mechanical stress and trampling [8]. This makes them an appropriate model for evaluating the performance and ecological impact of autonomous mowing systems, unlike other ornamental or native plant species that are managed with different maintenance regimes [9]. In addition, research indicates that repeated traffic damages the turfgrass, diminishing its functional health by creating thin, worn areas and restricting plant development, also having an important effect on esthetic appeal [10]. In addition, different mowing patterns have proven to have an impact on the visual appeal and functional performance of sport fields [11]. Other results highlighted the role of mowing patterns in enhancing the visual appeal of turfgrass by making it appear more orderly and esthetically pleasing. This effect is due to light reflection, which varies depending on the orientation of the grass blades after mowing, creating different shades of green that enrich the overall appearance of the lawn [12]. Moreover, the idea that varying mowing patterns can improve the visual quality of the lawn, making it more esthetically pleasing, is supported [13]. However, it is difficult to determine to what extent this occurs and when is the right time to change the mowing pattern in the management schedule of a green area. In previous study Luglio et al. [14] investigated the impact of different mowing patterns on the performance of an autonomous mower, analyzing a series of parameters related to the robot operational performance and movement dynamics within areas of the same size. However, the impact that different patterns may have on turfgrass performance has not yet been thoroughly and objectively investigated. Sportelli et al. [15] have mainly focused on the impact that different patterns can have on turf quality by measuring this impact with visual methods, which are therefore not objective and difficult to validate [16]. According to Hernandez et al. [17], a further limitation of these methods is that they restrict the evaluation of turfgrass quality to expert subjects with specific skills, making it difficult for the average user, such as a homeowner with a private lawn, to make informed decisions regarding turfgrass management. This also reduces the practicality of decision-making for municipal administrations, which may be responsible for maintaining high-value green areas also using autonomous mowing systems [18]. In addition to the technical and perceptual challenges, lawn mowing has increasingly become a central aspect of domestic and public green area maintenance, requiring a significant investment of time, effort, and financial resources [19,20]. As of recent projections, the global market for lawn mowing machinery is estimated to reach $27.5 billion by 2025 [1]. Beyond the initial acquisition costs, ongoing maintenance and the procurement of additional landscaping equipment further increase the financial burden. Moreover, the continued use of gasoline-powered mowers contributes to the carbon footprint, especially in urban areas where landscaping plays a key esthetic and recreational role. As a result, there is an increasing push toward more innovative, sustainable, and precise solutions such as autonomous mowers which offer the potential to reduce emissions, improve efficiency, and support smarter turf management practices [21].
Therefore, a more reliable and easily verifiable method would be necessary to determine when, how, and whether to intervene in turfgrass management, in order to ensure the maintenance of quality and provide a comfortable and accessible environment for the users [22]. Among the most common interventions in mowing management with autonomous mowers is the selection of the appropriate cutting height, which should be chosen according to the specific context [23]. This parameter can also be used to promote wild zones, particularly in urban areas, as a means of supporting biodiversity [24]. Another aspect that can be adjusted is the mowing frequency and the type of navigation pattern [14]. In this regard, the integration of monitoring systems and Decision Support Systems (DSSs) is gaining attention in turfgrass and landscape management [25]. These technologies enable data-driven approaches for scheduling mowing activities based on real-time or historical information, improving the timing, efficiency, and consistency in operations. Smart scheduling algorithms, when combined with autonomous mowing technologies, can further enhance sustainability and turf quality by adapting interventions to site-specific conditions and stress levels (e.g., traffic, growth rate, or weather) [26]. Such systems not only could help professional greenkeepers but also empower less experienced users to make informed decisions. To make informed decisions, tools with a high degree of precision are needed, capable of collecting and integrating relevant data into the decision-making process [27]. An example is the software described by Luglio et al. [14], which analyzes data gathered through an RTK-GPS system and provides information on the area covered by an autonomous mower, the number of passes, overlaps, and colorimetric maps to visualize areas subjected to higher machine traffic. This type of data is extremely valuable for analyzing operational performance, but further investigation is needed to better understand the relationship between the number of passes, overlaps, and variations in turfgrass cover. Regarding the turfgrass cover in terms of green cover percentage, there are many scientific papers which cite the NTEP color scale, which, as the quality one, is subject to subjective evaluations that can vary from one operator to another and therefore does not allow for the adoption of a standardized criterion [28]. Supporting the previous statement is the reported low correlation (r < 0.68) among experienced researchers when rating the same turf plots for parameters such as color [28]. However, digital image analysis has proven to be a useful tool for quantifying turfgrass color [28]. Such insights could provide quantitative information about trampling intensity and related turf stress and quality, enabling more informed adjustments to mowing schedules not only in terms of frequency and cutting height, but also mowing patterns. In addition, while mowing efficiency has been studied extensively, the influence of different navigation patterns on turfgrass damage and its visual appearance remains poorly understood.
This study aims to analyze and compare three different autonomous mower cutting patterns (random, vertical, and chessboard), collecting data on machine performance and green coverage percentage variation. The green coverage percentage, together with the number of passages, is analyzed and correlated to assess the effective number of passages which can influence turf degradation in terms of green cover percentage. These data are used to standardize trampling evaluation by creating a 1–10 coverage scale based on the number of passages, supporting future decisions in smart mowing scheduling and turf quality assessment.
2. Materials and Methods
2.1. Experimental Field Trials
The trial was carried out at the Podere Rottaia of the Department of Agriculture, Food, and Environment of the University of Pisa (San Piero a Grado, Pisa, Italy—43°40′ N, 10°19′ E, 6 m a. s. l.). The trial was performed on a bermudagrass (Cynodon dactylon × Cynodon transvaalensis cv ‘Patriot’) mature stand with a slight infestation of Paspalum spp. and Trifolium spp. (20% total for both genera). Before the beginning of the trial, the entire area was managed with a ride-on mower with a cutting height of 4 cm. The weather conditions during the test period were collected from the local weather station (Figure 1) (San Piero a Grado (PI), with a focus on May, June, July, and August, 2025). Sprinkler irrigation was applied and managed to prevent water stress.
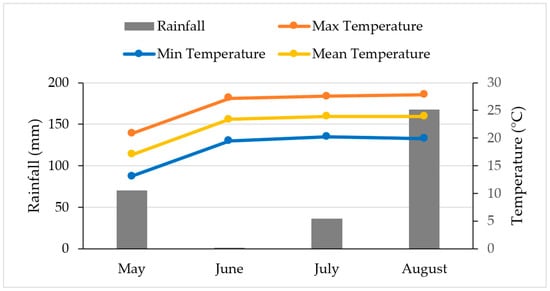
Figure 1.
Weather conditions during the trial period.
From May to August 2025, three different patterns on plots of 50 m2 each were evaluated. The adopted experimental layout consisted of a randomized complete block design with three replications for a total surface area of 450 m2. The mowing management system consisted of an autonomous mower weighing 13.8 kg, with systematic and random trajectories, set to operate every day in each area with a cutting height of 3 cm. The ultrasonic sensors of the autonomous mower were disabled to ensure smoother movement within the area and to prevent interruptions during the working activity that could compromise the planned analyses in the experimental area completely free of obstacles. The autonomous mower was equipped with two driving wheels. The main factor was the mowing pattern type (three levels: vertical, chessboard, and random). The vertical mowing pattern was characterized by a parallel scheme; the autonomous mower followed parallel paths and it started each mowing session at the designated point of the lawn and moved in the same direction, creating a striped pattern [29]. The chessboard mowing pattern was characterized by two parallel schemes; the autonomous mower cut the entire area following one direction, in the next cutting session it moved at a 90° angle to the previous cut. The alternating directions between each session created a chessboard pattern on the turfgrass [29]. The random mowing pattern was characterized by a casual scheme; the autonomous mower performed the cutting activity in various directions [30]. The autonomous mowers employed worked at an average speed of 0.46 m s−1 with a cutting-disk revolving speed of 2300 rpm and a working width of 240 mm; it was able to work with the three different patterns according to the working schedule. The autonomous mowers were left working until the areas were totally mown for the systematic patterns; in the area mowed by random pattern, the autonomous mower was left working for two hours, because it was the time deemed necessary to complete the area, in accordance with what was observed and indicated in the manufacturer’s operator manual [31].
2.2. Assessment
Green cover, representing the visual soil turfgrass green coverage, was determined by capturing images within a square frame measuring 50 × 50 cm; six photos for each pattern were taken every week for the entire duration of the test. The green coverage percentage was used to evaluate the effect of different patterns’ trampling activity on turfgrass quality. The photos were always taken at the same locations highlighted at the beginning of the test. Given the importance of image quality in this type of analysis, which can be affected by cloud distortion, rain, and frost, the photographs were taken on cloud-free days between 10 a.m. and 2 p.m., in accordance with Patrignani and Ochsner [32]. In addition, following the guidelines of Govindasamy et al. [33], the images were captured at a 90° downward angle within the area delimited by the square frame, using a support to keep the camera steady. These images were then analyzed using the Canopeo app (v 2.0, Oklahoma State University Department of Plant and Soil Sciences 374 AGH, Stillwater, OK 74078), which conducts an automatic color threshold (ACT) classification using the color value in the red–green–blue system [32]. The selected pixels analyzed by the app were chosen according to the ratios of R/G, B/G and the excess green index, obtaining a binary image with white pixels for the green canopy and the black ones for the not-green canopy. The green canopy classification ranges from 0 for the not-green canopy to 1 for the 100% green canopeo [32,34,35].
Data on number of passages, distance travelled (m), number of intersections, and percentage of area mowed were collected through two Emlid Reach RTK (Emlid Tech Kft., Budapest, Hungary) and then analyzed with the new version of the “Robot mower tracking data calculator” software (Ver. 2.5.0.0), both extensively described by Luglio et al. [14]. These operating data were analyzed for a complete cutting cycle considering one pass for the vertical; two passes, one vertical and one horizontal, to obtain the chessboard pattern; and the achievement of approximately 100% of coverage for the random.
2.3. Statistical Analysis
The data of number of passages, distance traveled (m), number of intersections and percentage of area mowed were analyzed with analysis of variance (ANOVA).
The data normality was verified using the Shapiro–Wilk test, and the Bartlett test was used for homoscedasticity. The data were transformed with a square root transformation when necessary, to respect the normality assumption. The least significant difference (LSD) test at 0.05 of probability was conducted with the package “agricolae”(version 1.3-7). For this data analysis, the R software (version 4.4.3, R Core Team, Vienna, Austria) was used.
A generalized linear model with a binomial distribution and a logit link function was used to analyze the green coverage percentage as a function of the factors data, pattern and repetitions. Since percentage data are typically not normally distributed, the cited model was adopted to analyze the percentage of green cover, in accordance with Wilson et al., Warton et al., and Singh [36,37,38], in order to ensure the reliability of the analyses. Estimated marginal means were computed for each level of the pattern, data factors and their interaction, and pairwise comparisons were conducted using Bonferroni adjustment for multiple testing.
The relationship between number of passages (considered as “dose”) and green coverage was analyzed using non-linear regression models implemented via the drm() function from the drc package in R (version 3.0-1 for the package, version 4.4.3, R Core Team, Vienna, Austria for R software ) [39]. A three-parameter log-logistic model (LL.3) was applied; this model estimates the upper limit and sets the lower limit equal to 0. In addition, this model estimates the dose corresponding to the inflection point (ED50), and the slope around that point. The analysis was performed on the full dataset, including the navigation pattern variable as a curve identifier (curveid). The non-linear model is expressed by a three-parameter log-logistic function (1):
where the parameter b represents the slope of the curve around the inflection point, indicating the rate of change in that region. The parameter d corresponds to the upper limit of the curve, or the maximum response value that can be reached. The parameter e refers to the x-value (in this case, the number of passes) that produces a response of 50% between the lower and upper limits of the curve [40]. The “ggplot2” package (version 4.0.1) was used to generate graphs.
The green coverage values (ranging from 0% to 100%) were converted into a qualitative scale from 1 to 10 (e.g., the value 1 corresponds to green cover percentage between 0% to <10%, the value 7 corresponds to green cover percentage between 60% to <70% and the value 10 corresponds to green cover percentage between 90% and 100%). This transformation allowed for intuitive visual representation of model predictions. The ED60, considered as the average number of passages required to reach 60% of green coverage, was extracted for each pattern. The ED60 was selected on the basis of the relation between NDVI and visual quality, with NDVI and green cover percentage investigated by [41]. Based on these data, an acceptable value of NDVI (NDVI > 0.70) corresponds to a visual quality >6 and it can be correlated with 60% of green cover percentage. This value of green cover percentage was used to set EP60: the average number of passages to reach the 60% of green cover percentage of the turfgrass. Predicted values across the range of observed passages were then plotted, showing the coverage progression over time for each pattern on the 1–10 scale. This scale was created to objectively evaluate an important aspect of the quality of the turf so as to avoid an empirical evaluation subject to the influence of the operator’s role.
3. Results
3.1. Operative Parameters Analysis
Analysis of variance revealed that the navigation pattern had a significant effect on number of passages (p = 4.38 × 10⁻⁵), distance traveled (p = 7.98 × 10⁻⁵), number of intersections (p = 2.127 × 10⁻⁴), and percentage of area mowed (p = 0.0191) (Table 1).

Table 1.
Results of the one-way ANOVA method evaluating the effect of navigation pattern on the number of passages, the distance traveled, the number of intersections, and the percentage of area mowed by the autonomous mower.
The mean value of the number of passages revealed that the higher number of passages was recorded for the random navigation pattern (469,823.5) and the lowest one for the vertical navigation pattern (151,452.3) (Figure 2); the same trend was observed for the distance traveled (random = 2431.89 m and vertical = 799.64 m) and for the intersections (random = 12,989 and vertical = 328.66) (Figure 3 and Figure 4). Regarding the percentage of area mowed, no differences were detected for the random (95.53) and vertical pattern (95.34), and the highest value was recorded for the chessboard pattern (99.45) (Figure 5).
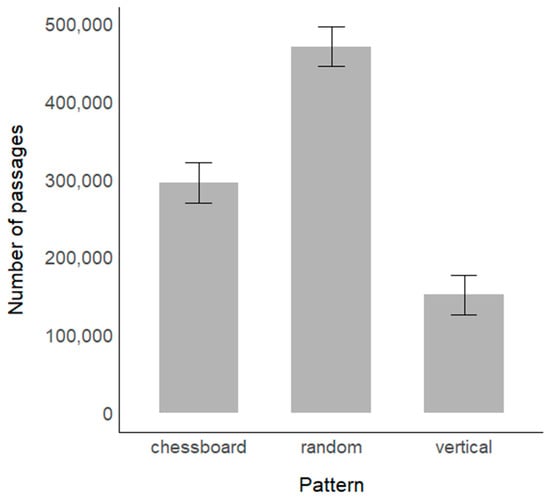
Figure 2.
Mean value of the number of passages in the function of navigation pattern (Pattern). LCL (Lower Confidence Limit) and UCL (Upper Confidence Limit) are reported.
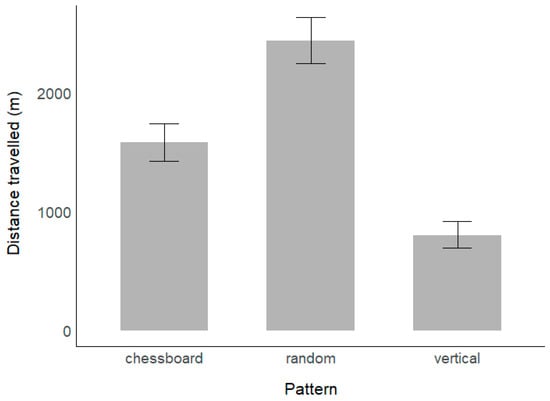
Figure 3.
Mean value of the distance traveled in the function of navigation pattern (Pattern). LCL (Lower Confidence Limit) and UCL (Upper Confidence Limit) are reported.
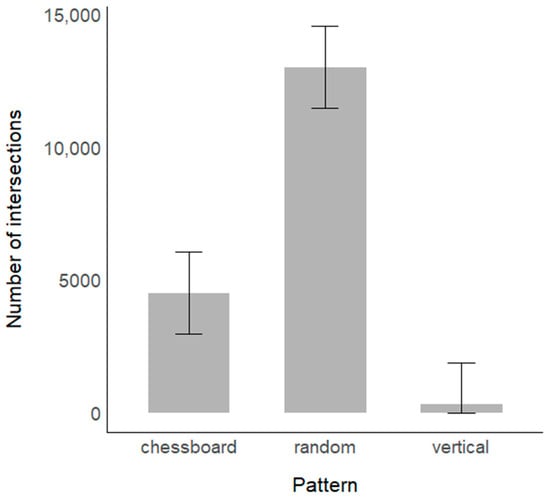
Figure 4.
Mean value of the number of intersections in the function of navigation pattern (Pattern). LCL (Lower Confidence Limit) and UCL (Upper Confidence Limit) are reported.
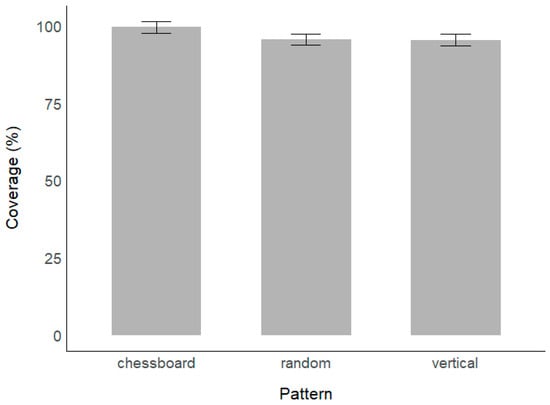
Figure 5.
Mean percentage of the area coverage in the function of navigation pattern (Pattern). LCL (Lower Confidence Limit) and UCL (Upper Confidence Limit) are reported.
3.2. Green Cover Percentage
The analysis with the generalized linear model revealed that the green coverage percentage was significantly affected by the navigation pattern (p < 0.001), the month (p < 0.001), and their interaction (p < 0.001). In Figure 6 the mean values of the green cover percentage are shown in the function of different patterns with relative LCL and UCL. The confidence intervals and the Bonferroni significance from the pairwise comparison show no significant difference between chessboard (80%) and vertical (81% a) patterns; the lowest value was detected for the random navigation pattern (64%).
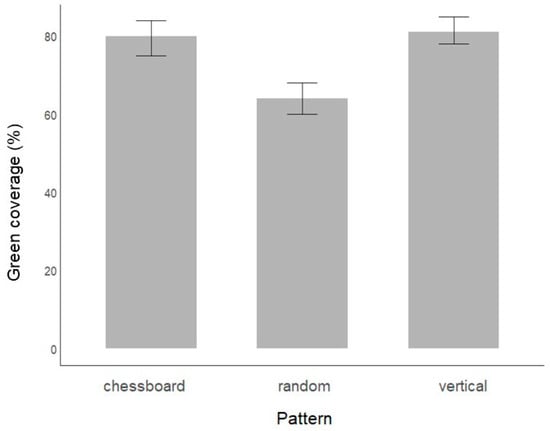
Figure 6.
Mean value of the green coverage percentage in the function of navigation pattern. LCL (Lower Confidence Limit) and UCL (Upper Confidence Limit) are reported.
In Figure 7 the mean values of the green cover percentage are shown in the function of the different surveys in different months with relative LCL and UCL. The confidence intervals and the Bonferroni significance from the pairwise comparison show no significant difference between the first three surveys (92%, 88% and 77%), an intermediate value for July (56%), and the lowest value for August (47%).
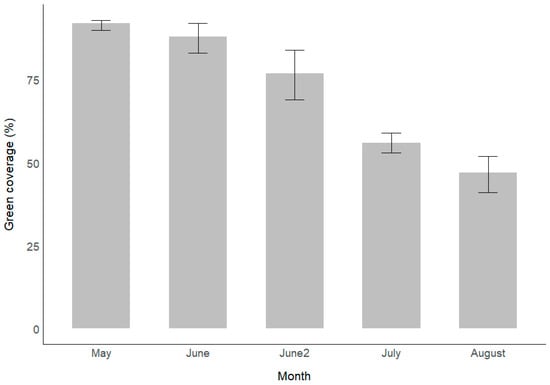
Figure 7.
Mean value of the green coverage percentage in the function of month. LCL (Lower Confidence Limit) and UCL (Upper Confidence Limit) are reported.
Overall, as shown in Figure 8, all patterns exhibit a similar trend across all months. However, in June 2, the random pattern becomes statistically different from both the chessboard and vertical patterns. Although not statistically significant, this divergence begins to emerge from the first survey in June.
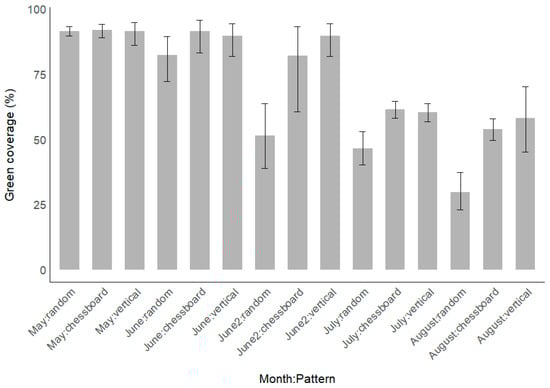
Figure 8.
Mean value of the green coverage percentage in the function of month and navigation pattern. LCL (Lower Confidence Limit) and UCL (Upper Confidence Limit) are reported.
3.3. Green Cover Percentage and Number of Passages
In accordance with the lack-of-fit test (p = 0.1483), data of green coverage percentage in the function of the average number of passages recorded using the custom-built software for each pattern fit the asymptotic regression model. In Figure 9 the green coverage (%) trend is shown as a function of the number of autonomous mower passages. Table 2 reports the non-linear asymprotic regression model parameters for each navigation pattern.
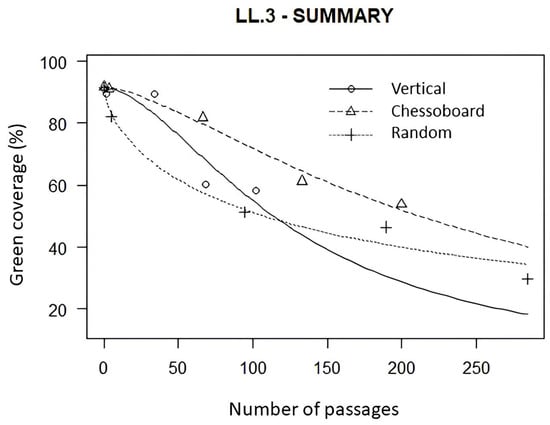
Figure 9.
Green cover percentage as a function of the average number of passages for each navigation pattern.
Table 2.
The parameter of the non-linear asymptotic regression and effective average number of passages of each navigation pattern estimated from the three-parameter log-logistic model.
By estimating the average number of passages from the model, it emerges that the number of days required to reach 60% coverage varies depending on the pattern based on the mean value of passages for each navigation pattern recorded with the custom-built software. No differences were detected for the EP60 values of random pattern and vertical one (95% confidence interval (CI) = −84.19 and 22.11) with an average number of passages of 71.78; differences were detected both for random and chessboard (95% confidence interval (CI) = −161.78 and −36.33) and chessboard and vertical (95% confidence interval (CI) = 24.59 and 111.44), with chessboard achieving a number of passages of 155.32.
3.4. Green Coverage Level Estimation Scale
Figure 10 shows the estimated green cover percentage expressed on a scale from 1 to 10 based on the average number of passages. This figure also highlights how the random pattern reaches the threshold of seven with fewer passages. In this regard, the precise value of estimated average number of passages necessary to reach the 60% of green coverage percentage are shown in Figure 10: 87.3 for the vertical pattern, 155.3 for the chessboard pattern, and 56.26 for the random pattern. The 60% of green coverage percentage for the random pattern was reached in less time than other patterns (15.17 days for the random pattern vs. 42.22 days for the vertical pattern and 93.56 days for the chessboard pattern).
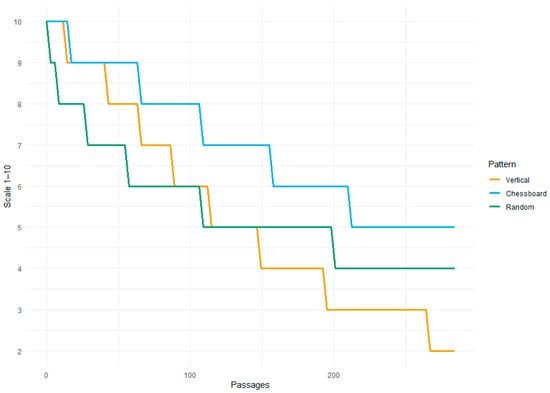
Figure 10.
The green cover percentage scale as a function of the number of passages.
4. Discussion
In the present study, the collected data showed that the chessboard pattern reached the highest value of coverage (99.45%). On the other side, the random navigation pattern resulted in a significantly higher number of passages (469,823.5), distance traveled (2431.89 m), and intersections (12,989), confirming the findings reported by Sportelli et al. [15]. The random distribution of trajectories in the random pattern, although guaranteeing a fair percentage of coverage in the long term, produces greater mechanical stress on some areas of the turfgrass, accelerating the compaction phenomena and the deterioration of the turfgrass [15,42]. Conversely, systematic patterns, particularly the chessboard configuration, proved to offer a better compromise between coverage and turf preservation in terms of fewer passages compared to the random pattern. These results confirm the preliminary observations of Sportelli et al., who highlighted the esthetic and functional advantages of regular mowing trajectories, although their analysis was limited to non-objective visual assessments [15].
Regarding green coverage percentage, a significant difference was observed among the patterns, with the random pattern averaging 64% coverage, in contrast to the systematic patterns, which maintained an average of 80%. This evidence suggests that an excessive number of passages, such as those recorded in the random pattern, acts as a mechanical stress factor, reducing both the photosynthetic capacity and the vegetative density of the turfgrass. These findings are consistent with existing literature on turfgrass responses to wear and mechanical traffic stress [10,43]. The data presented in Figure 8 show a temporal evolution of green coverage that suggests a progressive deterioration of the turfgrass, with increasing differences among mowing patterns over the months. The first three surveys, conducted between May and early June, do not reveal statistically significant differences and display relatively narrow confidence intervals, indicating a substantial uniformity among treatments. These results highlight a clear decline in green coverage over time (also shown in Figure 7), which can be attributed to the progressive accumulation of mechanical stress caused by the repeated passage of the autonomous mower over the same areas. This behavior is particularly evident in the random pattern, where the lack of a regular distribution of mower passages led to a more rapid turfgrass deterioration as early as mid-June. These findings are consistent with those reported by Han et al. and Mutlu et al., who demonstrated that repeated traffic induces negative physiological effects on herbaceous vegetation, reducing leaf density, ground cover, and chlorophyll content [44,45]. Similarly, according to Fan et al., traffic represents one of the main sources of physical stress for turfgrass, impairing photosynthetic efficiency, compacting the soil, and compromising overall plant health [46]. Moreover, data from Wei et al. indicate that traffic can significantly alter soil microflora, with indirect consequences on root development and turf resilience [47]. These phenomena may help explain the marked reduction in green cover observed during the warmer months, when turfgrass is already subject to environmental stresses such as heat and drought. The analysis of the trend in green coverage as a function of the number of mowing passages using a three-parameter asymptotic non-linear regression model allowed us to estimate key parameters for each pattern, highlighting substantial differences in the turfgrass response to mechanical stress induced by the autonomous mower. The model parameters indicate that the random and vertical patterns exhibit a lower average number of passage (71.78) to reach a 60% of green coverage compared to the chessboard pattern (155.32). The introduction of the EP60 indicator (Effective Passages 60%), defined as the number of passages required to reduce green coverage to 60%, a value considered a critical threshold corresponding to NDVI > 0.70 and visual quality > 6 [41]. The temporal result is also interesting, highlighting that based on the average robot passage rates for each pattern, the 60% threshold under the random pattern is reached more quickly 15.17 days for the random pattern compared to 42.22 days for the vertical pattern and 93.56 days for the chessboard pattern. These results suggest that the random trajectory arrangement causes greater overlap of passages on the same areas in fewer days of cutting, leading to localized stress and early vegetation degradation, compared to both the vertical and the chessboard. This finding is consistent with Fan et al., who notes that traffic or wear stress is an important abiotic stress in turf management, especially in sports fields, golf courses, home lawns, and public green space [46]. Traffic stress can directly damage plant tissues via pressure, tearing, and scuffing, and indirectly limit grass growth by altering soil physical properties. Indeed, the total number of passages per cutting cycle is significantly higher in the random pattern (469,823.5), followed by the chessboard (295,055.7) and vertical patterns (151,452.3). The differences observed in Figure 8 compared to Table 2 and Figure 10 may be explained by the absence of the effect of seasonality in the model used. Information derived from predictive models, such as the estimated number of days required for turfgrass to remain within an acceptable green cover threshold, can be integrated into decision support systems or mobile applications to assist turf managers in optimizing maintenance schedules [48,49].
5. Conclusions
The results confirm that the navigation pattern of the autonomous mower significantly influences both the operational performance (number of passages, distance traveled, number of intersections, and percentage of area mowed) and the green coverage percentage. The random pattern, although it generates less coverage than the chessboard, causes a high density of passages in the same areas, as shown by the number of intersections (number of intersections (12,989)), increasing mechanical stress and accelerating the degrade of vegetation. The temporal evolution of green cover shows that until early June patterns produce similar covers; however, from mid-June the differences emerge clearly, especially for the random pattern. This suggests that the accumulated stress begins to manifest itself more noticeably with the passage of time and with the intensity of repeated traffic. The use of the three-parameter asymptotic regression model allowed us to estimate the characteristic parameters for each pattern and to introduce the indicator EP60; that is, the number of passages required to reduce the green cover percentage to 60%. This indicator has proven useful for quantifying traffic wear and comparing the effectiveness of different patterns (56.26, 87.30, and 155.32 passes for random, vertical, and chessboard, respectively). The adoption of systematic cutting patterns, in particular the chessboard, offers a more favorable trade-off between operational efficiency and turf conservation, compared to random.
Although it has introduced a quantitative approach, the study is limited by some factors: the experiment took place under context-specific conditions, herbaceous species (bermudagrass), seasonal period, and local environmental conditions. Therefore, future studies could extend the analysis to different turfgrass species and in variable climatic contexts, integrate environmental factors into the model (seasonality, temperature, humidity, soil texture) to improve the predictivity of the model, and develop decision-making systems (DSS) and intelligent algorithms that can suggest in real-time the optimal cutting pattern based on the state of the turfgrass. The investigation could be complemented with additional parameters such as soil moisture variation and soil penetration resistance. In addition, future work could investigate how different design aspects of autonomous mowers such as blade configuration, cutting width, navigation system, and traction mode affect performance parameters like green cover, cutting uniformity, and operational efficiency. A deeper understanding of the interaction between machine design and motion algorithms could further improve predictive models and optimize turf management. In this regard, further tests could be carried out to evaluate more combinations of patterns, in order to understand which combination can maintain quality over the long term. Moreover, it would be useful to determine whether any of the navigation patterns are capable of bringing the percentage of green coverage back above the threshold.
Author Contributions
Conceptualization, S.M.L. and M.F. (Marco Fontanelli); methodology, S.M.L. and L.G.; software, M.F. (Mattia Fontani); validation, C.F., M.R., S.M., and M.V.; formal analysis, S.M.L. and L.G.; investigation, S.M.L. and L.G.; resources, M.F. (Marco Fontanelli), M.R., and M.V.; data curation, S.M.L. and C.F.; writing—original draft preparation, S.M.L. and L.G.; writing—review and editing, S.M.L., L.G., and M.F. (Mattia Fontani); visualization, M.R. and A.P.; supervision, M.F. (Marco Fontanelli) and C.F.; project administration, M.F. (Marco Fontanelli) and A.P.; funding acquisition, M.F. (Marco Fontanelli) and M.R. All authors have read and agreed to the published version of the manuscript.
Funding
This research received no external funding.
Data Availability Statement
Data are contained within this paper.
Acknowledgments
The authors sincerely thank Husqvarna AB, Sweden, for providing the machine, Lorenzo Greci, Romano Zurrida from DAFE for their technical assistance.
Conflicts of Interest
The authors declare no conflicts of interest.
References
- Kayode, A.O.; Ishola, B.D.; Olubunmi, I.E.; John, A.A. Fuzzy Logic Track Control of an Automated Lawnmower. IAES Int. J. Robot. Autom. 2022, 11, 122–131. [Google Scholar] [CrossRef]
- Braun, R.C.; Mandal, P.; Nwachukwu, E.; Stanton, A. The Role of Turfgrasses in Environmental Protection and Their Benefits to Humans: Thirty Years Later. Crop Sci. 2024, 64, 2909–2944. [Google Scholar] [CrossRef]
- Sharky, B. Nature-Based Design in Landscape Architecture, 1st ed.; Routledge: New York, NY, USA, 2024; ISBN 978-1-003-42887-9. [Google Scholar]
- Semeraro, T.; Scarano, A.; Buccolieri, R.; Santino, A.; Aarrevaara, E. Planning of Urban Green Spaces: An Ecological Perspective on Human Benefits. Land 2021, 10, 105. [Google Scholar] [CrossRef]
- Ignatieva, M.; Nielsen, S.; Martin, D.J. Recognising Lawns as a Part of “Designed Nature”. Pioneering Study of Lawn’s Plant Biodiversity in Australian Context. Urban Ecosyst. 2025, 28, 137. [Google Scholar] [CrossRef]
- Akther, S.M.; Hu, J.; Miller, G.; Shi, W. Foot Traffic on Turf Primarily Shaped the Endophytic Bacteriome of the Soil-Rhizosphere-Root Continuum. Front. Microbiol. 2025, 16, 1488371. [Google Scholar] [CrossRef]
- Lindsey, A.J.; Schiavon, M.; Unruh, J.B.; Kenworthy, K. Urban Landscapes: Turfgrass Benefits. Grasses 2025, 4, 3. [Google Scholar] [CrossRef]
- Bock, H.W.; Morse, O.B.; Rossi, F.S.; Groffman, P.M.; Sparks, J.P.; Wickings, K.G. Lawn Management Intensity Leads to Contrasting Effects on Belowground Ecology and Turfgrass Aesthetic. Urban For. Urban Green. 2025, 104, 128628. [Google Scholar] [CrossRef]
- Viola, P.; Olivadese, M.; Minelli, A. Turfgrass Through Time: Historical Uses, Cultural Values, and Sustainability Transitions. Agronomy 2025, 15, 1095. [Google Scholar] [CrossRef]
- Carrow, R.N.; Martin Petrovic, A. Effects of Traffic on Turfgrasses. In Agronomy Monographs; Waddington, D.V., Carrow, R.N., Shearman, R.C., Eds.; American Society of Agronomy, Crop Science Society of America, Soil Science Society of America: Madison, WI, USA, 2015; pp. 285–330. ISBN 978-0-89118-224-5. [Google Scholar]
- Luglio, S.M.; Frasconi, C.; Gagliardi, L.; Raffaelli, M.; Peruzzi, A.; Volterrani, M.; Magni, S.; Fontanelli, M. Analysis of Football Pitch Performances Based on Different Cutting Systems: From Visual Evaluation to YOLOv8. Agronomy 2024, 14, 2645. [Google Scholar] [CrossRef]
- Sessoms, F. Light Reflection and Mowing Patterns 2023. Available online: https://turf.umn.edu/light-reflection-and-mowing-patterns (accessed on 11 December 2025).
- Owen, M.C.; Lanier, J.D. Best Management Practices for Lawn and Landscape Turf, Version 1.51; Umass Extension: BMPs for Lawn Landscape Turf. 2016. Available online: http://extension.umass.edu/turf (accessed on 11 December 2025).
- Luglio, S.M.; Frasconi, C.; Gagliardi, L.; Raffaelli, M.; Peruzzi, A.; Pieri, S.; Volterrani, M.; Magni, S.; Fontanelli, M. Tracking Long-Distance Systematic Trajectories of Different Robot Mower Patterns with Enhanced Custom-Built Software. AgriEngineering 2025, 7, 30. [Google Scholar] [CrossRef]
- Sportelli, M.; Fontanelli, M.; Pirchio, M.; Frasconi, C.; Raffaelli, M.; Caturegli, L.; Magni, S.; Volterrani, M.; Peruzzi, A. Robotic Mowing of Tall Fescue at 90 Mm Cutting Height: Random Trajectories vs. Systematic Trajectories. Agronomy 2021, 11, 2567. [Google Scholar] [CrossRef]
- Kazemi, F.; Golzarian, M.R.; Nematollahi, F. Quality Assessment of Turfgrasses Using NTEP Method Compared to an Image-Based Scoring System. J. Ornam. Plants 2020, 10, 167–178. [Google Scholar]
- Hernandez, A.; Bushman, S.; Johnson, P.; Robbins, M.D.; Patten, K. Prediction of Turfgrass Quality Using Multispectral UAV Imagery and Ordinal Forests: Validation Using a Fuzzy Approach. Agronomy 2024, 14, 2575. [Google Scholar] [CrossRef]
- Ababneh, A. Smart Urban Management of Green Space. J. Des. Resil. Archit. Plan. 2023, 4, 339–353. [Google Scholar] [CrossRef]
- Soldat, D.J.; Brosnan, J.T.; Chandra, A.; Gaussoin, R.E.; Kowalewski, A.; Leinauer, B.; Rossi, F.S.; Stier, J.C.; Unruh, J.B. Estimating Economic Minimums of Mowing, Fertilizing, and Irrigating Turfgrass. Agric. Environ. Lett. 2020, 5, e20032. [Google Scholar] [CrossRef]
- Saidani, M.; Kim, H. Quantification of the Environmental and Economic Benefits of the Electrification of Lawn Mowers on the US Residential Market. Int. J. Life Cycle Assess. 2021, 26, 1267–1284. [Google Scholar] [CrossRef]
- Palladini, A.; Guerrini, L.; Fontanelli, M.; Bortolini, L. Analysis of Technical Characteristics and Main Performances in Commercial Autonomous Lawn Mowers; Springer Nature: Cham, Switzerland, 2024; pp. 354–361. [Google Scholar]
- Ignatieva, M.; Haase, D.; Dushkova, D.; Haase, A. Lawns in Cities: From a Globalised Urban Green Space Phenomenon to Sustainable Nature-Based Solutions. Land 2020, 9, 73. [Google Scholar] [CrossRef]
- Gagliardi, L.; Fontanelli, M.; Luglio, S.M.; Frasconi, C.; Raffaelli, M.; Peruzzi, A.; Caturegli, L.; Sciusco, G.; Federighi, T.; Magni, S.; et al. Assessment of the Effects of Autonomous Mowers on Plant Biodiversity in Urban Lawns. Horticulturae 2024, 10, 355. [Google Scholar] [CrossRef]
- Winkler, J.; Pasternak, G.; Sas, W.; Hurajová, E.; Koda, E.; Vaverková, M.D. Nature-Based Management of Lawns—Enhancing Biodiversity in Urban Green Infrastructure. Appl. Sci. 2024, 14, 1705. [Google Scholar] [CrossRef]
- Carlson, M.G.; Gaussoin, R.E.; Puntel, L.A. A Review of Precision Management for Golf Course Turfgrass. Crop Forage Turfgrass Manag. 2022, 8, e20183. [Google Scholar] [CrossRef]
- Santhoshini, P.; Helen Prabha, K.; Jaibalaji, S.T.; Krishna Vishwa, C.B.; Kumar, H.R.; Mano Sundar, S. Implementation of Automatic Lawn Mower System for Smart Lawn Maintenance. In Proceedings of the 2024 4th International Conference on Artificial Intelligence and Signal Processing (AISP), Vijayawada, India, 26–28 October 2024; IEEE: Vijayawada, India, 2024; pp. 01–07. [Google Scholar]
- Padhiary, M.; Saha, D.; Kumar, R.; Sethi, L.N.; Kumar, A. Enhancing Precision Agriculture: A Comprehensive Review of Machine Learning and AI Vision Applications in All-Terrain Vehicle for Farm Automation. Smart Agric. Technol. 2024, 8, 100483. [Google Scholar] [CrossRef]
- Karcher, D.E.; Richardson, M.D. Quantifying Turfgrass Color Using Digital Image Analysis. Crop Sci. 2003, 43, 943–951. [Google Scholar] [CrossRef]
- What Is Meant by Systematic Cutting? Available online: https://www.husqvarna.com/it/supporto/husqvarna-self-service/cosa-si-intende-per-taglio-sistematico-ka-70248/ (accessed on 11 December 2025).
- Husqvarna. Husqvarna Automower® and CEORA®—Frequently Asked Questions. Available online: https://www.husqvarna.com/ch-it/apprendimento-e-scoperta/domande%20frequenti%20sui%20robot%20tagliaerba/ (accessed on 11 December 2025).
- Husqvarna. Husqvarna Automower 520/550 Operator’s Manual; Husqvarna AB: Stockholm, Sweden, 2018. [Google Scholar]
- Patrignani, A.; Ochsner, T.E. Canopeo: A Powerful New Tool for Measuring Fractional Green Canopy Cover. Agron. J. 2015, 107, 2312–2320. [Google Scholar] [CrossRef]
- Govindasamy, P.; Mahawer, S.K.; Sarangi, D.; Halli, H.M.; Das, T.K.; Raj, R.; Pooniya, V.; Muralikrishnan, L.; Kumar, S.; Chandra, A. The Comparison of Canopeo and Samplepoint for Measurement of Green Canopy Cover for Forage Crops in India. MethodsX 2022, 9, 101916. [Google Scholar] [CrossRef]
- Paruelo, J.M.; Lauenroth, W.K.; Roset, P.A. Technical Note: Estimating Aboveground Plant Biomass Using a Photo-Graphic Technique. J. Range Manag. 2000, 53, 190–193. [Google Scholar] [CrossRef]
- Richardson, A.D.; Jenkins, J.P.; Braswell, B.H.; Hollinger, D.Y.; Ollinger, S.V.; Smith, M.-L. Use of Digital Webcam Images to Track Spring Green-up in a Deciduous Broadleaf Forest. Oecologia 2007, 152, 323–334. [Google Scholar] [CrossRef]
- Wilson, E.; Underwood, M.; Puckrin, O.; Letto, K.; Doyle, R.; Caravan, H.; Camus, S.; Bassett, K. The Arcsine Transformation: Has the Time Come for Retirement? Memorial University of Newfoundland: St. John’s, NL, Canada, 2013. [Google Scholar]
- Warton, D.I.; Hui, F.K.C. The Arcsine Is Asinine: The Analysis of Proportions in Ecology. Ecology 2011, 92, 3–10. [Google Scholar] [CrossRef]
- Singh, A. Generalized Linear Model Approach to Analyzing Proportional Data. Acta Hortic. 2013, 1012, 1167–1172. [Google Scholar] [CrossRef]
- Ritz, C.; Strebig, J.C. Drc: Analysis of Dose-Response Curves 2005, version 3.0-1; R Core Team: Vienna, Austria, 2016. [Google Scholar]
- Some Useful Equations for Nonlinear Regression in R. 2019. Available online: https://www.statforbiology.com/nonlinearregression/usefulequations (accessed on 11 December 2025).
- Bremer, D.J.; Lee, H.; Su, K.; Keeley, S.J. Relationships between Normalized Difference Vegetation Index and Visual Quality in Cool-Season Turfgrass: II. Factors Affecting NDVI and Its Component Reflectances. Crop Sci. 2011, 51, 2219–2227. [Google Scholar] [CrossRef]
- Luglio, S.M.; Sportelli, M.; Frasconi, C.; Raffaelli, M.; Gagliardi, L.; Peruzzi, A.; Fortini, V.; Volterrani, M.; Magni, S.; Caturegli, L.; et al. Monitoring Autonomous Mowers Operative Parameters on Low-Maintenance Warm-Season Turfgrass. Appl. Sci. 2023, 13, 7852. [Google Scholar] [CrossRef]
- Harivandi, M.A. Turfgrass Traffic and Compaction: Problems and Solutions; UCANR Publications: Oakland, CA, USA, 2002. [Google Scholar]
- Han, L.-B.; Song, G.-L.; Zhang, X. Preliminary Observations on Physiological Responses of Three Turfgrass Species to Traffic Stress. HortTechnology 2008, 18, 139–143. [Google Scholar] [CrossRef]
- Sever Mutlu, S.; Irkörücü, D.; Sancar, B.; Bahar, T. Evaluation of Vegetative Bermudagrasses for Traffic Tolerance. In XXX International Horticultural Congress IHC2018: VII Conference on Landscape and Urban Horticulture, IV Conference on 1279; ISHS: Istanbul, Turkey, 2020; pp. 153–158. [Google Scholar] [CrossRef]
- Fan, J.; Zhang, W.; Amombo, E.; Hu, L.; Kjorven, J.O.; Chen, L. Mechanisms of Environmental Stress Tolerance in Turfgrass. Agronomy 2020, 10, 522. [Google Scholar] [CrossRef]
- Wei, H.; Wang, Y.; Zhang, J.; Ge, L.; Liu, T. Changes in Soil Bacterial Community Structure in Bermudagrass Turf under Short-Term Traffic Stress. Agriculture 2022, 12, 668. [Google Scholar] [CrossRef]
- Lindblom, J.; Lundström, C.; Ljung, M.; Jonsson, A. Promoting Sustainable Intensification in Precision Agriculture: Review of Decision Support Systems Development and Strategies. Precis. Agric. 2017, 18, 309–331. [Google Scholar] [CrossRef]
- Carrow, R.N.; Krum, J.M.; Flitcroft, I.; Cline, V. Precision Turfgrass Management: Challenges and Field Applications for Mapping Turfgrass Soil and Stress. Precis. Agric. 2010, 11, 115–134. [Google Scholar] [CrossRef]
Disclaimer/Publisher’s Note: The statements, opinions and data contained in all publications are solely those of the individual author(s) and contributor(s) and not of MDPI and/or the editor(s). MDPI and/or the editor(s) disclaim responsibility for any injury to people or property resulting from any ideas, methods, instructions or products referred to in the content. |
© 2025 by the authors. Licensee MDPI, Basel, Switzerland. This article is an open access article distributed under the terms and conditions of the Creative Commons Attribution (CC BY) license (https://creativecommons.org/licenses/by/4.0/).