Article

Nutrient Distribution in the Soil Profile Under Different Tillage Practices During a Long-Term Field Trial

Crop Research Institute, Drnovská 507/73, CZ-161 06 Praha, Czech Republic
*
Author to whom correspondence should be addressed.
Agronomy 2024, 14(12), 3017; https://doi.org/10.3390/agronomy14123017
Submission received: 14 November 2024 / Revised: 5 December 2024 / Accepted: 17 December 2024 / Published: 18 December 2024
(This article belongs to the Section Innovative Cropping Systems)

Abstract

:
Conservation tillage practices are increasingly used in agricultural systems. However, these practices require a complex approach regarding soil nutrition. Adequate nutrient content in soils is important for crop production, as reduced and no-tillage practices change the distribution of nutrient contents (P, K, Mg, and Ca) in the soil profile, necessitating new approaches for agronomists in crop nutrition. Little is known about the time changes in nutrient distribution in the soil profile under conservation tillage practices. Long-term field experiments with conventional (CT—plowing to 20–22 cm), reduced (RT—chiseling to 8–10 cm), and no-tillage (NT) practices were established in Prague–Ruzyně (Czech Republic) in 1995. This four-year crop rotation consisted of winter wheat changing with oilseed rape or pea. The soil nutrient contents have been determined since 2009 using the Mehlich 3 method and through extraction in 0.5 M ammonium acetate. The obtained results showed that P, K, and, to a lesser extent, Mg contents increased in the soil surface layer (0–10 cm) under the reduced and no-tillage practices, whereas Ca and pH values showed an opposite trend. We found an unbalanced ratio of nutrients in the upper soil layer in RT and NT caused by a high concentration of the monovalent cation K+ and the leaching of the divalent cations Ca2+ and Mg2+ into the deeper soil layers. In conventional practices, the ion contents are equalized throughout the topsoil due to the soil inverting during plowing. The determination of nutrient contents in deeper soil layers revealed that, over time, calcium, magnesium, and potassium were transported to deeper parts of the soil profile under RT and especially NT. Low nutrient ratios were found in the surface layer under RT and NT, negatively affecting the quality of the soil surface layer, including its structure. Fertilizer management and nutrient ratios in soils under RT and NT should be considered to maintain and possibly improve sustainable agricultural practices in fields with reduced or no-tillage practices. Furthermore, nutrient contents and their mutual ratios should be evaluated in more soil layers under these systems, enabling the detection of eventual problems in the upper layer that must be addressed by changing fertilization.

1. Introduction

Adequate nutrient content in the soil is a prerequisite for healthy plant growth. At present, more and more fields are cultivated using conservation tillage practices. These have many advantages, but some aspects require more attention from agronomists. Conservation tillage practices (reduced or no tillage with or without straw stubble covering) are widely used to mitigate the negative effects of intensive tillage. However, achieving sustainable agricultural development and eco-environmental protection requires a deeper understanding of the effect of conservation tillage on soil biological and chemical properties (e.g., soil organic matter, nutrients, metal cations and their relationships, and pH) [1]. Overall, conservation tillage practices are expected to improve soil fertility through reducing disturbances and residue retention [2].
Reduced or no-tillage practices are often recommended to increase the SOC in topsoil, which promotes good structure, increased infiltration, and reduced soil erosion rates when compared with conventional plowing; however, the results are controversial when considering the whole soil profile [3,4,5]. The long-term use of conservation tillage practices and the application of mineral fertilizers to the soil surface can lead to a gradual accumulation of nutrients in the surface layer and, conversely, decrease their contents at a greater depth in the soil profile. No-tillage farming can severely impact soil in multiple ways, including increased nutrient stratification and increased bulk density [6]. In fact, P, Mg, and Ca concentrations at the soil surface are higher under no-tillage practices than in disk tillage practices [7]. Similarly, Wright et al. [8] reported that the nutrient distribution in the soil profile varies between cropping systems under reduced tillage, with significantly more P, K, Mn, Fe, Cu, and Zn found in the 0–15 cm soil layer in comparison with the 60–90 cm layer. Gill et al. [9] reported that the stratification of soil nutrients was greater under no-tillage systems than under minimum tillage systems, with P concentration declining with depth, while pH, Ca, and Mg increased. The stratification and concentration of soil organic carbon, N, P, and K in the upper soil layer have also been reported [7,8,9,10,11,12]. Jiang et al. [13] found higher exchangeable Ca2+ and Mg2+ contents in the topsoil under NT than under CT. Nutrient stratification in soils is also dependent on N fertilization, which increases yields and ultimately leads to higher nutrient removal during crop harvests, explaining the decreasing plant-available nutrient concentrations with increasing N fertilization rates [8]. On the other hand, when deep tillage was introduced into continuous tillage, a reduction of bulk density and lower nutrient stratification were observed [14].
Fewer mobile nutrients remain in the surface soil layer under conservation tillage practices, whereas mobile nutrients can be transported to deeper layers. Reduced or no-tillage systems lead to higher soil bulk density and compaction and mobile nutrient accumulation in deeper layers because there is no soil inversion, which mixes nutrients in the soil profile. This can cause root-restricting layers and lower crop yields. There are several ways to break these layers, such as choosing deep-rooting crops [15,16,17,18] (for example, oilseed rape) or, even better, reducing tillage to promote biopore formation through higher earthworm activity [15]. Soil tillage destroys macropore pathways, which can enhance nutrient transportation into the subsoil [12]. Enhancing the nitrification capacity and increasing root exudation with greater root growth under NT conditions can also increase the acidity of surface soil [2,11].
The basic cation saturation in soils should range from 60 to 75% for calcium (Ca), 10 to 20% for magnesium (Mg), 3 to 5% for potassium (K), and 15% for other cations [19,20,21,22]. Soil metal cations, such as exchangeable calcium (Ca2+) and magnesium (Mg2+), are also chemical drivers of aggregation, which can form cationic bridges with clay particles and organic carbon, protecting the organic matter from decomposition [23]. The altered distribution of nutrient contents in the soil profile under conservation tillage practices can lead to a degree of underestimation (Ca and Mg) or overestimation (K, Na, and NH4-N) of the nutrient contents in the soil top layer and erroneous evaluations of the nutrient content in the soil profile. The surface soil layer can be vulnerable, for example, when soils are fertilized with monovalent cations (e.g., K+), with their increased concentration on the soil surface leading to the leaching of other nutrients (e.g., Mg2+ and Ca2+) into deeper soil layers, consequently deteriorating the soil structure. The pH value and Ca2+ and K+ concentrations in soils, as well as the yield capacity of plants, are also factors affecting the agronomic effectiveness of Mg fertilization in crop yield and Mg application rates [24]. The different surface reactions of metal ions with variably charged soil particles can considerably influence particle interactions and their aggregation, sedimentation, dispersion, and transportation [23].
Most current research states that soil conservation tillage methods result in nutrient stratification in the soil profile, but few address these problems in nutrient studies over the long term. One of the current gaps is the absence of long-term observations of the development and transport of nutrients in the soil profile under different soil tillage practices. Insufficient attention is also being paid to mutual nutrient ratios in soils, which differ under conservation practices from conventionally tilled soils and can subsequently influence other soil characteristics. We conducted a sixteen-year observation of the nutrient contents in several layers of the soil profile in a long-term field experiment with various soil tillage practices to determine their distribution and study their changes over the duration of the experiment. We also examined the transport and possible pathways of nutrients under continental climate conditions. There is no other long-term experiment with three soil cultivation practices in the Czech Republic that has illustrated the effects of different tillage systems on soil characteristics and drawn attention to needed changes in management when changing tillage methods. The possible risks of altered nutrient contents were also considered.

2. Materials and Methods

2.1. Site Description

A long-term field trial was established on a permanent arable field in 1995 at the Crop Research Institute (CRI) of Prague (Czech Republic: 50°05′ N; 14°17′ E). The climatic region is warm and moderately dry [25]. The altitude is 360 m above sea level, the mean annual temperature during the studied period (2009–2024) was 10.1 °C (ranging from 8.3 °C to 11.1 °C), and the mean annual precipitation was 509 mm (ranging from 345 mm to 731 mm; Crop Research Institute Prague–Ruzyně Meteorological Station). The soil type is classified as illimerized luvisol [26]. The parent material is loess mixed with highly weathered chalk [27]. The soil texture is silty clay loam: pH (0.01 M CaCl2) 7.0 and pH (H2O) 7.8; SOC 1.3%; texture: sand 15.8%, silt 54.9%, and clay 29.3%. The average nutrient content extracted using the Mehlich 3 method was as follows: P—61 mg kg−1; K—176 mg kg−1; Ca—3650 mg kg−1; Mg—137 mg kg−1; CEC—191 mmol kg−1.

2.2. Field Trial

Before the experiment, the field had been conventionally tilled. Two main blocks (95 m × 95 m) were established. After that, the blocks were divided into three parts for three tillage practices: CT = moldboard plowing down to 20–22 cm; RT = chisel plowing of the surface soil layer to a depth of 8–10 cm; and NT = without tillage. Each tillage practice used appropriate corresponding machinery (12 m wide and 95 m long) [25]. The tillage practices were then randomly divided into sub-blocks spatially distributed along the entire length of the given tillage. Five sub-blocks with identical N fertilization in each practice were sampled once a year. The crop rotation (winter wheat–pea–winter wheat–oilseed rape) was applied alternately in each main block. All post-harvest crop residues remained in the field and were incorporated into the soil according to tillage practice: completely under CT; partly under RT, leaving more than 30% on the surface; and remaining on the surface under NT as the mulch covering the soil surface. In autumn, phosphorus and potassium fertilizers were applied to the experimental field at the same dosages. Phosphorus fertilizers were applied annually as diammonium phosphate (23 kg P ha−1). Potassium was applied annually as potassium chloride in different doses: up to the year 2018—66 kg K ha−1; since the year 2020—46 kg K ha−1. The potassium fertilization doses were decreased due to deteriorated soil particles on the soil surface. Beginning in 2020, magnesium was provided annually as magnesium sulfate to the oilseed rape in a 15 kg Mg ha−1 dose. Nitrogen fertilizers were applied as calcium ammonium nitrate and urea ammonium nitrate solution in a 120–160 kg N ha−1 dose only during winter wheat and rapeseed growth.

2.3. Nutrient Determination

The soil samples were collected annually in the second half of May from each tillage practice in 5 repetitions from the sub-blocks at different soil layers (0–0.1, 0.1–0.2, and 0.2–0.3 m). The soil samples were airdried and sieved to <2 mm. Nutrient contents were determined using two extracting methods: (i) The Mehlich 3 method, the standard for nutrient determination for state administrative purposes, which focuses on potentially available nutrient fractions. This acidic (pH = 2.5) extractant releases nutrients from the soil (s) that are potentially available to plants. (ii) Extraction via NH4 acetate at pH = 7, which releases more readily available exchangeable fractions. Nutrient contents determined in this way are more indicative of their availability to plants. Briefly [28,29], 100 mL of Mehlich 3 extractant (0.2 mol/L CH3COOH, 0.015 mol/L NH4F, 0.013 mol/L HNO3, and 0.25 mol/L NH4NO3, 0.001 mol/L EDTA) was mixed with 10 g of airdried soil and shaken at 200 rpm in a 250 mL plastic flask for 10 min. The exchangeable nutrient contents were determined with the following procedure [30]: 0.05 M NH4 acetate + 0.005 M NH4 fluoride was adjusted to pH 7. In total, 100 mL of the solution was mixed with 5 g of air-dried soil by hand with a stick for 30 s; after that, the solution rested for 16 h at laboratory temperature (20–22 °C). Afterward, the solution was mixed by hand 4 times for 30 s at 5 min intervals. All solutions were filtered on Whatman 40 filters. Clear solutions were analyzed for nutrient contents using a Thermo Fisher Scientific 7400 iCAP ICP-OES analyzer (Carlsbad, CA, USA).

2.4. Ratios of Cation Equivalents

The ratios of the cation equivalents were calculated as follows: The exchangeable nutrient contents (determined in NH4 acetate extract, expressed in mg kg−1 of soil) were divided by the atomic weight of the nutrients and their valency (K—39.098, Mg—24.305/2 = 12.15, and Ca—40.078/2 = 20.039). The final Mg and Ca equivalents were calculated as mutual proportions with potassium equivalents.
Equivalent K = Keq = content of exchangeable K in soil (mg K kg−1)/39.098;
Equivalent Mg = Mgeq = content of exchangeable Mg in soil (mg Mg kg−1)/(24.305/2);
Equivalent Ca = Caeq = content of exchangeable Ca in soil (mg K kg−1)/(40.078/2).
Nutrient ratio = K:Mg:Ca = 1:(Mgeq/Keq):(Caeq/Keq).

2.5. Soil pH Measurement

Soil pH values were measured in CaCl2 and H2O extracts. In total, 20 g of airdried soil was mixed with 50 mL of CO2-free deionized water and shaken for one hour. The suspension rested for 16 h and was shaken for 10 min, and pH was measured. In total, 10 g of airdried soil was mixed with 50 mL of 0.01 M CaCl2·2H2O solution and shaken for one hour. After one hour of rest, its pH was measured.

2.6. Statistical Analysis

Statistical calculations were performed using Statistica 14.0 (TIBCO, Santa Clara, CA, USA). The results are expressed as mean values for each crop rotation cycle, treatment, and measurement. Factorial ANOVA, considering crop rotation cycles, tillage, and depth, was used to evaluate the effects on soil nutrients. The same letters in the figures indicate statistically identical values according to Tukey’s test (p ≤ 0.05). The Pearson correlation coefficients were used to assess the effects of soil tillage, depth, and crop rotation cycle on nutrients. The confidence level was as follows: * for p ≤ 0.050, the differences are significant at the 95% confidence level; ** for p ≤ 0.010, the differences are significant at the 99% confidence level; *** for p ≤ 0.001, the differences are significant at the 99.99% confidence level; at p > 0.050, there are no significant differences (differences are significant at less than the 95% confidence level).

3. Results

3.1. Nutrient Contents in a Soil Profile Under Different Soil Tillage Practices

An analysis of the nutrient contents in the soil samples using both methods (Mehlich 3 and NH4 acetate) showed that phosphorus, potassium, and magnesium under RT and NT were concentrated in the 0–10 cm layer. These most significantly differed from nutrient contents in the deeper layers (Figure 1 and Figure 2). The P, K, and Mg contents were more equilibrated among the 0–10 and 10–20 cm soil layers due to soil inversion under CT. Lower nutrient contents were found in the 20–30 cm layer, into which the plowing (up to 22 cm) penetrated only a small part. A different trend was observed for Ca, the content of which most significantly increased in deeper soil layers under RT and NT using the Mehlich 3 extract. To a lesser extent, a similar trend was observed when Ca was extracted using NH4 acetate.
Each extraction method targets different nutrient fractions in the soil profile. Increased NH4 acetate nutrient contents under RT and NT were noted in the surface soil layer compared with CT. The NH4-acetate-extractable nutrients generally represented a lower proportion of soil nutrients. On average, NH4-acetate-extractable phosphorus in the 0–10 cm soil layer represented 6.86% of P extracted using Mehlich 3, and this proportion increased to 11.88% and 13.28% under RT and NT, respectively. Similarly, a higher proportion of NH4 acetate nutrient contents was observed in the surface layer for K (87.41% under CT, 99.68% under RT, and 97.34% under NT), Mg (48.84% under CT, 54.54% under RT, and 55.59% under NT), and Ca (27.19% under CT, 30.87% under RT, and 30.50% under NT). Increased NH4 acetate P, K, and Mg were noted in the 10–20 cm layer under RT compared with CT, whereas a decrease was noted for NH4 acetate Ca. The NH4 acetate K proportion increased in comparison with CT in the 10–20 cm layer under NT, whereas a decrease was observed for P, Mg, and Ca. NH4 acetate proportions of P, Mg, and Ca decreased in the lowest soil layer under RT and NT. A decrease in NH4 acetate K in the same layer was noted only for RT.
Over the studied years, the nutrient content in the different layers changed. The percentage expressions of the nutrient contents in the surface layer (100%) and deeper layers were used to clearly observe the nutrient shifts in the soil profile (Table 1).

3.2. Phosphorus

NH4 acetate extracted approximately ten times less phosphorus from the soil than the Mehlich 3 reagent (Figure 1 and Figure 2). However, the same regularities in the distribution of phosphorus in the soil profile were found for both methods. The percentage of phosphorus was relatively balanced among the layers under CT, with a slight increase in P content in the 10–20 cm layer compared with the surface (Table 1). The highest percentages (106% after Mehlich 3 and 126% after ammonium acetate extraction) were found in the second crop rotation. Reduced P content in the 20–30 cm layer was recorded mainly in the last years (2021–2024) at 74% after determination with the Mehlich method 3 and 56% after determination with ammonium acetate. For RT, the P content decreased sharply and statistically significantly below 10 cm. The 10–20 cm layer content reached only 55–67% and 23–48% using Mehlich 3 and NH4 acetate extraction, respectively, compared with the surface layer. Between the deeper layers of the soil without treatment, the differences were usually no longer significant. The same trend was found for NT. In the 10–20 cm layer, the percentage of P content compared with the surface layer was 47–55% with the Mehlich 3 method but only 17–24% with the NH4 acetate method. In the deepest monitored layer, 20–30 cm, both methods provided a phosphorus content of 4–7%, lower than in the 10–20 cm soil. NH4 acetate extraction showed decreased phosphorus content in the last two rotations at both deeper layers, but the Mehlich 3 method did not confirm this trend.

3.3. Potassium

The absolute potassium contents in the soil determined by both methods hardly differed (Figure 1 and Figure 2); the same distribution trends were found for phosphorus. The K distribution between the monitored soil layers was the most balanced in CT, with the highest content in the middle 10–20 cm layer at 104–113% of the surface. Under RT and NT, the highest potassium content was found in the surface layer, but its decrease with depth was not as pronounced as that of phosphorus: in the 10–20 cm layer, it reached more than 60% under RT and over 50% under NT. A decrease in the potassium content of the soil was expected in the last rotation due to a reduction in the applied dose of potassium fertilizers starting in 2020.

3.4. Magnesium

The representation of the divalent elements Mg and Ca in the monitored layers was less variable than for phosphorus and potassium due to their higher soil mobility (Figure 1 and Figure 2). However, the differences between tillage practices were lower than for P and K. The Mg percentage determined by the Mehlich 3 method under CT ranged from 98 to 103% in all three monitored layers (Table 1). The results obtained using Mehlich 3 for RT were very similar to those for NT. The Mg percentage in the 10–20 cm layer decreased to 79–85% and 74–87% of the surface layer under RT and NT, respectively, and by approximately another 10% in the 20–30 cm layer. Under NT, a slight increase in Mg content in the deepest layer among the rotations was detected. The exchangeable Mg fraction found in the NH4 acetate decreased more significantly with depth. The Mg percentages in deeper soil layers were approximately 10% lower than in the Mehlich 3 extract. Annually applying Mg fertilizers starting in 2020 increased the Mg content in all soil layers, as determined using the Mehlich 3 method (Figure 1), but an increase in the exchangeable fraction was not detected (Figure 2).

3.5. Calcium

A different calcium distribution in the soil profile compared with the nutrients described above was found using the Mehlich 3 method. The Ca content under RT and NT in the 0–10 cm layer was lower than CT in all studied crop rotations (Figure 1). The lowest Ca contents were extracted from the 0–10 cm surface layer for all soil tillage technologies, except for two rotations under NT, where at 10–20 cm, the Ca content decreased to 94 and 97% of the amount found on the surface layer (Table 1). The biggest differences between the monitored soil layers were found for RT. In the untreated 10–20 cm and 20–30 cm layers, the Ca content reached 111–124% and 124–128% of the amount found in the surface layer. Only small changes in the Ca percentage in the deeper soil layers were observed during crop rotations.
The exchangeable Ca trend differed from Ca-Mehlich 3 (Figure 2). Under CT, the Ca percentage in NH4 acetate ranged from 100 to 108% in the 10–20 cm layer and 97 to 109% in the 20–30 cm layer compared with the 0–10 cm layer when higher percentages were obtained in the last studied crop rotation. Under the RT and NT conservation techniques, the highest exchangeable Ca contents were again obtained at the 0–10 cm surface layer and the lowest at 10–20 cm, and a further increase was found at 20–30 cm, indicating leaching of the mobile form of Ca. The Ca percentage at 10–20 cm reached at least 87% and 78% of the value obtained at the surface layer under RT and NT, respectively (similarly, 93% and 86% at the 20–30 cm layer). An increasing trend was detected among the rotations at both deeper layers under RT and NT.

3.6. Nutrient Ratios
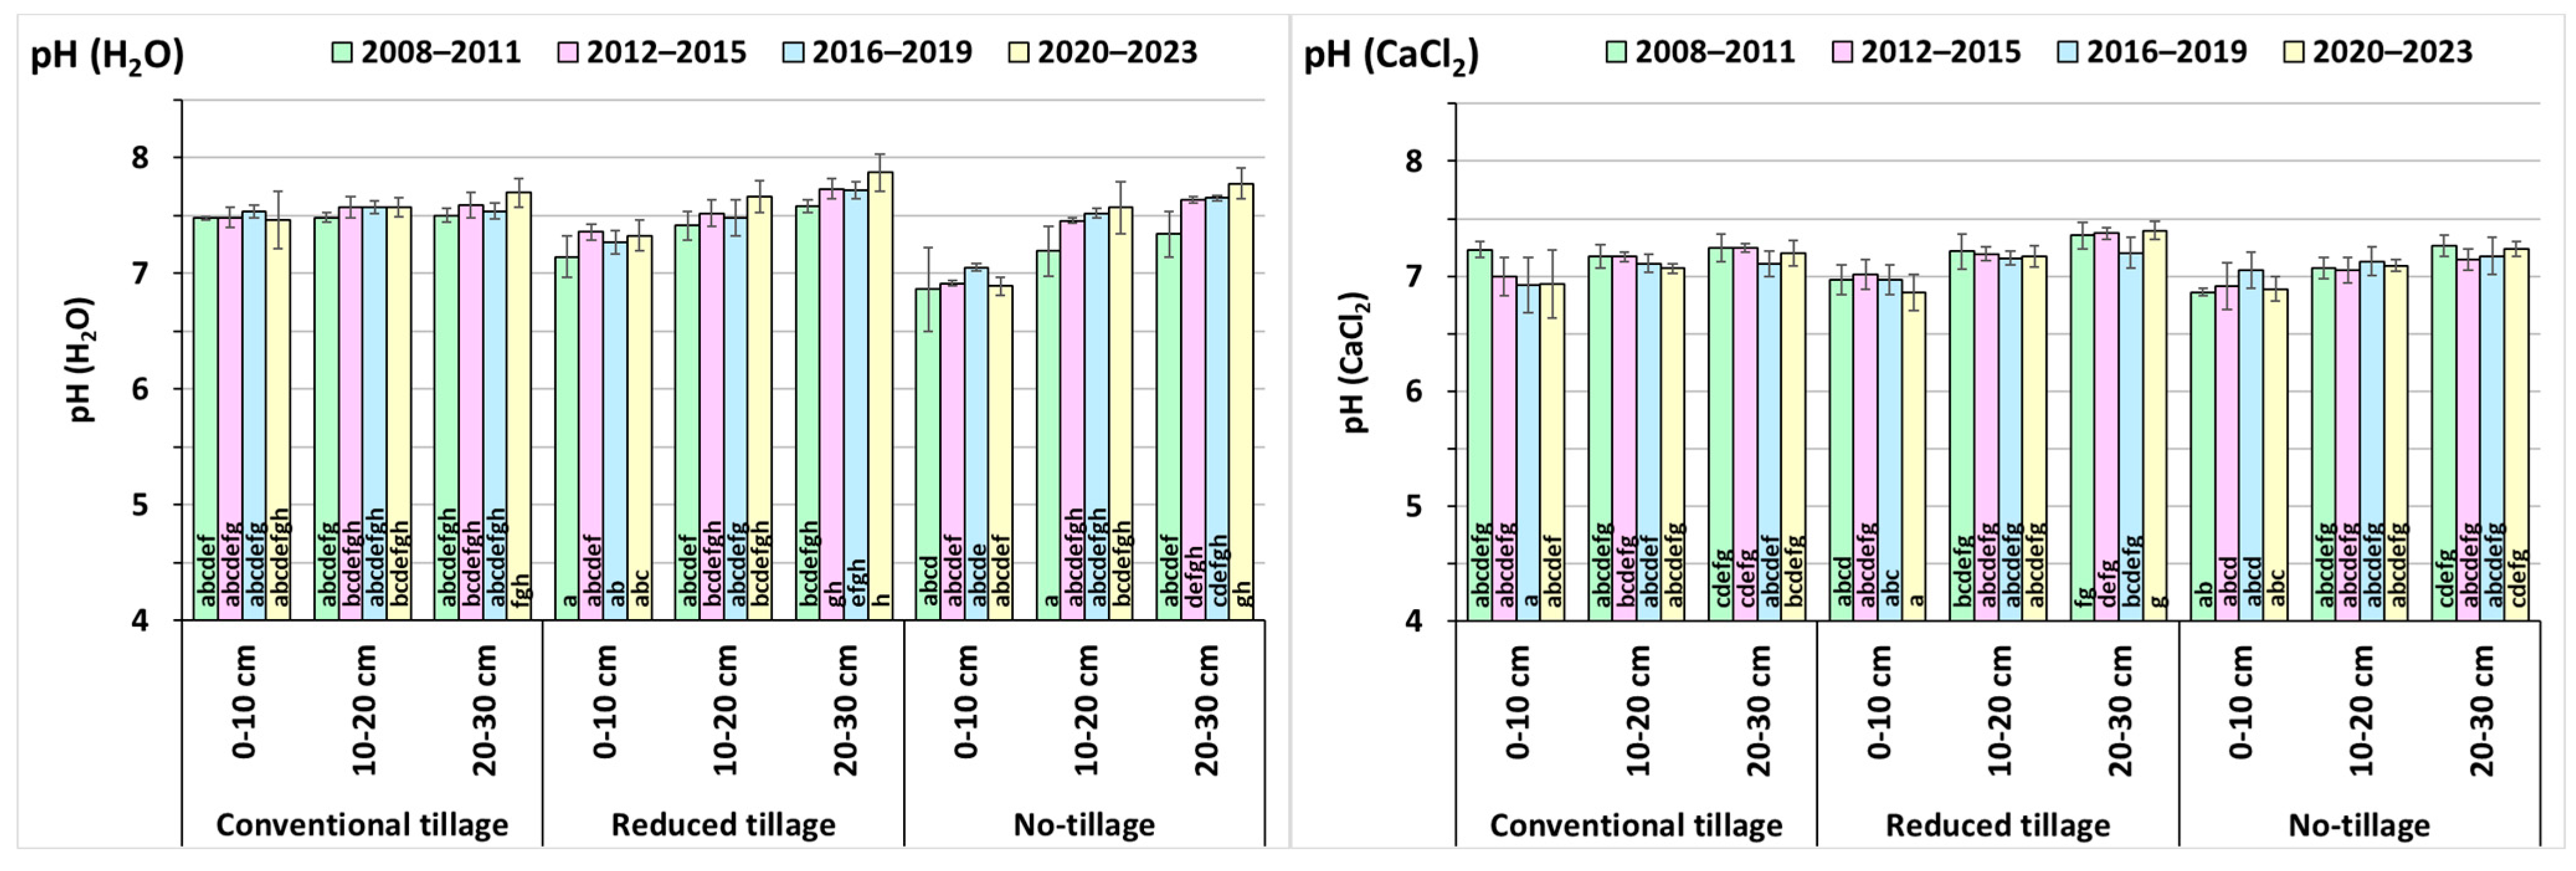
Given its composition and low pH value, the Mehlich 3 reagent proportionally extracts more cations than ammonium acetate [22]. Therefore, the base cation ratios were calculated using nutrient-exchangeable fractions determined with NH4 acetate extractant (Table 2). The K:Mg:Ca ratio should be 1:2–3:10–15 to ensure proper soil functions [30,31].
In our long-term experiment, the K:Mg ratio did not reach the recommended optimal value of 1:2–3 in any soil tillage practice, not even at the observed depths. For this reason, magnesium sulfate was applied annually starting in 2020, which was originally mainly a source of sulfur for growing rapeseed. Under CT, the K:Mg ratio was more balanced among the layers due to the regular cultivation and turning of the soil, reaching the lowest values in the 10–20 cm middle layer. A higher K:Mg ratio was noted at all depths in the last studied crop rotation (2021–2024) (Table 2). High potassium content in the surface layer led to the lowest K:Mg ratio values, 1:1.27–1.49 and 1:1.24–1.28, under RT and NT conservation technologies, respectively. In the deeper layers, the K:Mg ratios increased. Similarly, as with CT, a higher K:Mg ratio under RT and NT was noted in later years.
Calcium is one of the essential elements affecting soil structure. On average, this ratio ranged between 11 and 13 under CT in all layers, with a decreasing tendency over time. A low K:Ca ratio was found in the surface layer under RT 7.77–8.15 and especially NT 7.21–7.88, where no clear increasing or decreasing trend in this ratio was found (Table 2). The K:Ca ratio increased in deeper layers of the soil profile up to the optimal value (13.41) at 10–20 cm under NT. The K:Ca ratios in the 20–30 cm layer showed optimal values with a gradual decreasing trend over the study period under both tillage technologies. To maintain a good structure and preserve all soil functions, it is necessary to achieve optimal nutrient ratios, especially in the surface layer. Therefore, mobile nutrients prone to leaching, such as calcium, must be regularly replenished, and limestone or dolomite limestone should be applied.

3.7. Soil pH

Soil pH was determined in H2O and CaCl2. Both measures showed decreased soil pH in the 0–10 cm layer under RT and NT in all studied periods, as well as an increase in the deeper soil layers. The pH under CT was more equilibrated within all soil layers. Unlike under CT, the pH under RT and NT increased in the deeper soil layers and in each crop rotation (Figure 3). The increasing pH values in deeper soil layers under RT and NT may have originated in calcium gradually leaching into deeper soil layers. The pH values correlated with increased Mehlich 3 Ca contents in the corresponding layers (Table 3). However, no relationship was found between pH values and Ca in NH4 acetate. In fact, the studied soil was classified as illimerized luvisol, with neutral to alkalic pH and considerable amounts of weathered chalk.

3.8. Relationships Between Nutrient Contents in Soil and pH

The soil nutrients were determined between 2009 and 2024, enabling us to evaluate four crop rotations (Table 3). The effects of tillage were related to the depth and technique used. A correlation analysis of P, K, and Mg with the Mehlich 3 method showed significant negative correlations with soil depth, but a positive correlation was found for Ca. The crop rotation cycle correlated negatively with phosphorus, magnesium, and calcium. NH4 acetate P, K, and Mg negatively correlated with depth, but no significant correlation was found for Ca. The crop rotation cycle only significantly correlated with Mg.
Both methods showed mutually significant positive correlations between K, P, and Mg; conversely, negative correlations were found for Ca-Mehlich 3, and positive correlations were found for Ca-NH4 acetate. Soil pH was positively correlated with soil depth, crop rotation cycle, and Ca, whereas mostly negative correlations were found for the other nutrients.
ANOVA test showed a significant effect of tillage, soil depth, and cycle of crop rotation for P, K, and Ca determined by both methods Mehlich 3 and NH4 acetate when analyzed single parameters. Mutual effects of tillage and depth were obtained for P and K (Table 4). The significant effect of tillage on Mg was shown only for NH4-acetate, whereas depth, cycle of crop rotation, and mutual effect of tillage and depth were obtained by both Mehlich 3 and NH4-acetate. Other mutual parameters did not show significant effects.
Figure 4 illustrates the creation of macropores by soil macrofauna, mainly earthworms. Due to regular soil inversion, plowing disrupts the activity of larger macrofauna and eliminates their paths in the soil. By contrast, non-tilled soil does not disrupt these paths, enabling nutrient movement, for example, through precipitation or even macrofauna activity.

4. Discussion

Reduced or no-tillage practices are becoming more and more popular in agricultural practice. Their use is associated with an increasing need for conservation tillage due to ongoing climate change, as they reduce CO2 emissions and water loss from the soil [25,32,33,34,35]. On the other hand, the long-term use of conservation tillage practices brings new challenges in soil fertilization, such as changes in nutrient distribution [1,8,10,35,36]. Moldboard plows prevent the stratification of most soil chemical parameters, such as soil acidity, soil organic carbon, extractable P, exchangeable Ca and Mg, and cation exchange capacity [37]. Unlike in conventional tillage, soil phosphorus and potassium under reduced and no-tillage practices mostly cumulate in the surface soil layers [8,9,10,38], whereas a decrease was observed in the lower parts of the soil profile. The P and K concentrations in the surface soil layer can also be affected by the crops grown in the soil [39]. In one study, the greatest stratification and differences between surface and subsurface soils occurred for P, followed by K [8]. These results are consistent with our findings, where phosphorus concentrations under RT and NT decreased more rapidly in deeper layers of the soil profile in comparison with potassium (Figure 1 and Figure 2; Table 1), whereas Ca contents determined using Mehlich 3 increased. Possible Mg leaching in deeper soil layers was not very pronounced due to annual fertilization with MgSO4, which started in 2020 due to increased potassium contents found in the surface soil layer, an imbalance in their mutual ratios, and a greater need for sulfur in fertilizers, resulting in higher Mg content in the surface soil layer. The results were also confirmed by significant correlations between the soil depth and nutrient concentrations (Table 3).
Sixteen years of monitoring the nutrient contents in the soil profile under CT, RT, and NT allowed us to detect nutrient shifts over time. Phosphorus (P) is of particular concern because of its role in aquatic system eutrophication [40]. The vertical stratification of soil P contents was observed in our field experiment without a clear leaching trend via macropores from the surface to the subsoil. The type of tillage had no significant impact on P-leaching losses [12]. Our results showed a decreasing percentage trend for P-NH4 acetate contents in the soil profile under RT and NT, confirming previous findings showing that conservative tillage practices can effectively prevent phosphorus leaching in deeper soil. Phosphorus moves slowly in the soil, is easily fixed, and is usually enriched in the surface layer. Combined with the inherently low utilization efficiency of P by crops, stratification can further reduce this efficiency [1].
Nutrient cycling is based on biological factors such as organic carbon content and microbial and enzymatic activities [41]. Soil organic carbon and microbial biomass concentrate in the soil surface layer under RT and NT, whereas a decrease in their contents has been noted in deeper soil layers [42]. CT, unlike RT and especially NT, increases soil oxidization and mineralization in soil organic matter, releasing more soil nutrients beneficial to plant growth [43,44]. Indeed, lower crop yields have been found under NT compared with CT and RT [42]. Jobbággy and Jackson (2001) [45] showed that extractable P and exchangeable K were nutrients with consistently high concentrations in topsoil, supporting the prediction that the most limiting nutrients for plants have the shallowest distributions. Along a weathering–leaching intensity gradient, the total base saturation decreases, but the relative contribution of exchangeable K+ to base saturation increases. The role of plant cycling in vertical distributions of soil properties may be noticeable at various temporal scales. A comparison of conventional and conservation tillage systems showed that nutrient transport becomes noticeable after about a decade [45].
In our study, the K, Mg, and Ca percentages mostly increased in deeper layers of the soil profile over the years, but the same effect was not observed for phosphorus. The authors attribute this shift in the soil profile to the movement of nutrients along with water through macropores. In soils subjected to long-term reduced and (in particular) no-tillage practices, many macropores emerged due to greater soil macro-edaphon activity, above all, earthworms (Figure 4). Quantification and soil macropore characteristics were not the subjects of this study; however, this observation supported previous findings of Budhathoki et al. [46], showing significantly higher macropore diameters and branch lengths in soil cores sampled from a no-tillage corn field compared with a conventionally tilled field resulting from undisturbed faunal and floral activity under no-tillage. Macropores facilitated nutrient transport into the deeper layers of the soil profile; this was also confirmed by Galdosa et al. [47], who found that the long-term adoption of ZT leads to higher macroporosity and pore connectivity, which is likely to have positive implications for nutrient cycling, root growth, soil gas fluxes, and water dynamics.
In addition, rapeseed was included in the crop rotation once over four years. The rapeseed roots under NT remained intact in the soil. They moved vertically and decomposed gradually, creating drains that (together with precipitation) facilitated nutrient shifts into deeper soil layers and mitigated the nutrient stratification in the soil profile under RT and NT. This allowed nutrients to move along them and through spaces remaining after their decomposition. The action of macro-edaphons contributes to the shift in nutrients to the lower layers of the soil as they transport post-harvest residues from the surface deeper into the soil. The contribution of earthworms to water regulation and purification, nutrient cycling, carbon sequestration, aggregation, fragmentation, macropore formation, etc., was described by Blouin et al. [48]. According to Sutri et al. [49], no-tillage fields have higher earthworm abundance and species richness, indicating favorable habitat conditions compared with other tillage systems; conversely, intensive tillage negatively affects earthworm communities, changing their habitat and relocating food sources.
Kinetic energy from rainfall is one of the most active factors in soil solute transport during runoff [50]. When potassium concentrates on the soil surface, the effective raindrop kinetic energy results in higher K contents in deeper soil layers. Therefore, an appropriate soil structure is essential for effective water absorption. This is particularly influenced by a balanced ratio of monovalent and divalent cations. The soils in our field experiment contained considerable amounts of weathered chalk, possibly creating similar conditions and competition among cations in the sorption complex. In addition, the decreased pH (Figure 3) in the soil surface may have also played an important role.
Administrative authorities in the Czech Republic use the Mehlich 3 method to determine nutrients in soil over the long term [27]. This method is simple and robust and, therefore, applicable in a wide range of laboratories. In addition, one extraction agent is sufficient to determine the content of several nutrients, which is advantageous in itself, but the method’s pH is also low, helping to extract even less accessible nutrient fractions, not only plant-available nutrients. From this perspective, determining nutrient-exchangeable fractions in 0.5 M ammonium acetate extract with neutral pH better corresponds to the nutrient uptake by plants [51], and it is convenient for calculating their mutual ratios in the sorption complex.
Soil health and quality depend on the right ratio between cations: 60 to 75% for calcium (Ca), 10 to 20% for magnesium (Mg), and 3 to 5% for potassium (K) [19,20,21,22]. This results in an equivalent K:Mg:Ca ratio of 1:2–3:10–15 [30,31]. When K+ contents in soils increase, Mg2+ availability is significantly inhibited because of competition between cations [52]. Inappropriate ratios K:Mg:Ca can facilitate the leaching of divalent cations such as Ca2+ and Mg2+ into deeper soil layers [27], which we observed mainly for Ca. Increased K concentrations in soils can significantly decrease Mg concentrations in plant tissues [52]. We found a low proportion of Mg and Ca equivalents to K in the surface soil layers under RT and NT compared with CT (Table 2); in the case of Mg, this can also be a limiting factor for crop yields and quality [21,53]. Potassium salt and progressive soil acidification inputs can be due to the absence of Mg fertilizers, depleting magnesium reserves despite their significant contents in topsoils [54]. Indeed, Mg deficiency is becoming a significant limiting factor in intensive crop production systems, especially in soils fertilized only with N, P, and K, and this is one of the reasons for the regular application of Mg in our long-term field experiment. Calcium in soil is greatly important from a chemical and physical perspective and to biological processes in soil. An inappropriate K:Mg:Ca ratio in the surface layer, together with decreasing pH values, can cause soil structure deterioration. Therefore, it is important to monitor cation ratios, especially in the topsoil, and maintain good conditions through regular liming with dolomitic limestone.

5. Conclusions

Our field experiment showed that the long-term use of reduced and no-tillage practices increased concentrations of P, K, and Mg in the surface soil layer in comparison with conventional tillage. On the contrary, the Ca contents and pH values decreased in the surface layer and increased in deeper layers without inverting (under RT and NT). These changes were more detectable when using the Mehlich 3 method. The concentration of the monovalent cation K+ led to inappropriate nutrient ratios in the surface layer. K:Mg:Ca ratios in the surface layer were lower under RT and NT, compared to CT, and increased in deeper layers in correspondence with decreasing potassium content. The determination of nutrient contents in deeper soil layers revealed that, over time, calcium, potassium, and magnesium can be shifted to deeper parts of the soil profile under RT and especially NT. This tendency was not entirely evident for phosphorus. The transport of potassium into deeper soil layers was mainly caused by rainfall; this was associated with greater macro-fauna activity and, thus, a larger quantity of macropores. The surface layer of reduced and no-tilled soil was vulnerable due to inadequate K:Mg:Ca ratios and lower pH, negatively affecting other soil properties. In conservation practices, it is therefore necessary to take into account not only the needs of plants but also the effects of individual nutrients on the quality of the soil surface layer, including its structure. Under CT, nutrients are distributed evenly in the soil profile. Under RT and NT, nutrient contents and their mutual ratios should be evaluated in more soil layers, enabling the detection of eventual problems in the upper soil layer that must be addressed by changing fertilization. It is difficult to determine these inconsistencies through the classic sampling of soil from the entire 0–30 cm layer.

Author Contributions

Conceptualization, P.R. and G.M.; methodology, G.M. and P.R.; software, G.M.; validation, H.K., P.R. and R.V.; formal analysis, G.M., R.V. and M.K.; investigation, R.V. and M.K.; resources, P.R.; data curation, G.M.; writing—original draft preparation, G.M.; writing—review and editing, P.R. and H.K.; visualization, G.M.; supervision, P.R.; project administration, H.K.; funding acquisition, P.R. and H.K. All authors have read and agreed to the published version of the manuscript.

Funding

This research was funded by the National Agency for Agricultural Research of the Czech Republic, NAZV, no: QL24020149, and the Ministry of Agriculture, no: MZE-RO0423.

Data Availability Statement

The original contributions presented in this study are included in the article. Further inquiries can be directed to the corresponding author.

Conflicts of Interest

The authors declare no conflicts of interest.

References

  1. Lv, L.G.; Gao, Z.B.; Liao, K.H.; Zhu, Q.; Zhu, J.J. Impact of conservation tillage on the distribution of soil nutrients with depth. Soil Till. Res. 2023, 225, 105527. [Google Scholar] [CrossRef]
  2. Sithole, N.J.; Magwaza, L.S.; Mafongoya, P.L. Conservation agriculture and its impact on soil quality and maize yield: A South African perspective. Soil Till. Res. 2016, 162, 55–67. [Google Scholar] [CrossRef]
  3. Chenu, C.; Angers, D.A.; Barré, P.; Derrien, D.; Arrouays, D.; Balesdent, J. Increasing organic stocks in agricultural soils: Knowledge gaps and potential innovations. Soil Tillage Res. 2019, 188, 41–52. [Google Scholar] [CrossRef]
  4. Wiesmeier, M.; Urbanski, L.; Hobley, E.; Lang, B.; von Lützow, M.; Marin-Spiotta, E.; van Wesemael, B.; Rabot, E.; Ließ, M.; Garcia-Franco, N.; et al. Soil organic carbon storage as a key function of soils—A review of drivers and indicators at various scales. Geoderma 2019, 333, 149–162. [Google Scholar] [CrossRef]
  5. Cooper, H.V.; Sjögersten, S.; Lark, R.M.; Mooney, S.J. To till or not to till in a temperate ecosystem? Implications for climate change mitigation. Environ. Res. Lett. 2021, 16, 054022. [Google Scholar] [CrossRef]
  6. Ramadhan, M.N. Significance of tillage techniques of some soil properties and maize production: A review. Int. J. Agric. Stat. Sci. 2023, 19, 1251–1265. [Google Scholar] [CrossRef]
  7. Bauer, P.J.; Frederick, J.R.; Busscher, W.J. Tillage effect on nutrient stratification in narrow- and wide-row cropping systems. Soil Till. Res. 2002, 66, 175–182. [Google Scholar] [CrossRef]
  8. Wright, A.L.; Hons, F.M.; Lemon, R.G.; McFarland, M.L.; Nichols, R.L. Stratification of nutrients in soil for different tillage regimes and cotton rotations. Soil Till Res. 2007, 96, 19–27. [Google Scholar] [CrossRef]
  9. Gill, K.S. Early season root growth, soil aggregation and stratification of nutrients and soil properties after six annual treatments of fertilizer rates and seeding systems. J. Plant Nutr. 2021, 45, 1134–1148. [Google Scholar] [CrossRef]
  10. Yang, F.; He, B.; Dong, B.; Zhang, G. Film mulched ridge–furrow tillage improves the quality and fertility of dryland agricultural soil by enhancing soil organic carbon and nutrient stratification. Agric. Water Manag. 2024, 292, 108686. [Google Scholar] [CrossRef]
  11. Duiker, S.W.; Beegle, D.B. Soil fertility distributions in long-term no-till, chisel/disk and moldboard plow/disk systems. Soil Till. Res. 2006, 88, 30–41. [Google Scholar] [CrossRef]
  12. Han, K.; Kleinman, P.J.A.; Saporito, L.S.; Church, C.; McGrath, J.M.; Reiter, M.S.; Tingle, S.C.; Allen, A.L.; Wang, L.Q.; Bryant, R.B. Phosphorus and Nitrogen Leaching Before and After Tillage and Urea Application. J. Environ. Qual. 2015, 44, 560–571. [Google Scholar] [CrossRef]
  13. Jiang, X.; Hu, Y.; Bedell, J.H.; Xie, D.; Wright, A.L. Soil organic carbon and nutrient content in aggregate-size fractions of a subtropical rice soil under variable tillage. Soil Use Manag. 2011, 27, 28–35. [Google Scholar] [CrossRef]
  14. Li, L.; Guan, J.; Chen, S.; Zhang, X. Intermittent Deep Tillage on Improving Soil Physical Properties and Crop Performance in an Intensive Cropping System. Agronomy 2022, 12, 688. [Google Scholar] [CrossRef]
  15. Burger, D.J.; Schneider, F.; Bauke, S.L.; Kautz, T.; Don, T.; Amelung, W. Fifty years after deep-ploughing: Effects on yield, roots, nutrient stocks and soil structure. Eur. J. Soil Sci. 2023, 74, e13426. [Google Scholar] [CrossRef]
  16. Perkons, U.; Kautz, T.; Uteau, D.; Peth, S.; Geier, V.; Thomas, K.; Lütke Holz, K.; Athmann, M.; Pude, R.; Köpke, U. Root-length densities of various annual crops following crops with contrasting root systems. Soil Till. Res. 2014, 137, 50–57. [Google Scholar] [CrossRef]
  17. Schneider, F.; Don, A. Root-restricting layers in German agricultural soils. Part II: Adaptation and melioration strategies. Plant Soil 2019, 442, 419–432. [Google Scholar] [CrossRef]
  18. Kautz, T.; Amelung, W.; Ewert, F.; Gaiser, T.; Horn, R.; Jahn, R.; Javaux, M.; Kemna, A.; Kuzyakov, Y.; Munch, J.C.; et al. Nutrient aquisition from arable subsoils in temperate climates: A review. Soil Biol. Biochem. 2013, 57, 1003–1022. [Google Scholar] [CrossRef]
  19. Soto, A.L.; Culman, S.W.; Herms, C.; Sprunger, C.; Doohan, D. Managing soil acidity vs. soil Ca:Mg ratio: What is more important for crop productivity? Crop Forage Turfgrass Manag. 2023, 9, e20210. [Google Scholar] [CrossRef]
  20. Chaganti, V.N.; Culman, S.W.; Herms, C.; Sprunger, C.D.; Brock, C.; Soto, A.L.; Doohan, D. Base cation saturation ratios, soil health, and yield in organic field crops. Agron. J. 2021, 113, 4190–4200. [Google Scholar] [CrossRef]
  21. Chaganti, V.N.; Culman, S.W. Historical perspective of soil balancing theory and identifying knowledge gaps: A review. Crop Forage Turfgrass Manag. 2017, 3, 1–7. [Google Scholar] [CrossRef]
  22. Culman, S.W.; Brock, C.; Doohan, D.; Jackson-Smith, D.; Herms, C.; Chaganti, V.N.; Kleinhenz, M.; Sprunger, C.D.; Spargo, J. Base cation saturation ratios vs. sufficiency level of nutrients: A false dichotomy in practice. Agron. J. 2021, 113, 5623–5634. [Google Scholar] [CrossRef]
  23. Tian, R.; Li, H.; Zhu, H.; Liu, X.; Gao, X. Ca2+ and Cu2+ induced aggregation of variably charged soil particles: A comparative study. Soil Sci. Soc. Am. J. 2013, 77, 774–781. [Google Scholar] [CrossRef]
  24. Cakmak, I.; Yazici, A.M. Magnesium: A forgotten element in crop production. Better Crops 2010, 94, 23–25. [Google Scholar]
  25. Mühlbachová, G.; Růžek, P.; Kusá, H.; Vavera, R. CO2 Emissions from Soils under Different Tillage Practices and Weather Conditions. Agronomy 2023, 13, 3084. [Google Scholar] [CrossRef]
  26. IUSS; ISTRIC; FAO. World Reference Base for Soil Resources; FAO: Rome, Italy, 2006. [Google Scholar]
  27. Hejcman, M.; Kunzová, E.; Šrek, P. Sustainability of winter beat production over 50 years of crop rotation and N, P and K fertilizer application on illimerized luvisol in the Czech Republic. Field Crops Res. 2012, 139, 30–38. [Google Scholar] [CrossRef]
  28. Mehlich, A. Mehlich 3 soil test extractant: A modification of Mehlich 2 extractant. Commun. Soil Sci. Plant Anal. 1984, 15, 1409–1416. [Google Scholar] [CrossRef]
  29. Zbíral, J. Determination of plant-available micronutrients by Mehlich 3 soilextractant—A proposal of critical values. Plant Soil Environ. 2016, 62, 527–531. [Google Scholar] [CrossRef]
  30. Matula, J. Optimization of Nutrient Status of Soils by KVK-UF Soil Test. Methodology for Praxis; Crop Research Institute: Prague, Czech Republic, 2007; 48p, ISBN 978-80-87011-16-4. (In Czech) [Google Scholar]
  31. Loide, V. A bout the effect of the contents and ratios of soil’s available calcium, potassium and magnesium in liming of acid soils. Agronomy Res. 2004, 2, 71–82. [Google Scholar]
  32. Mühlbachová, G.; Kusá, H.; Růžek, P.; Vavera, R. CO2 emissions in a soil under different soil tillage practices. Plant Soil Environ. 2022, 68, 253–261. [Google Scholar] [CrossRef]
  33. Lu, X.; Lu, X.; Tanveer, S.K.; Wen, X.; Liao, Y. Effects of tillage management on soil CO2 emission and wheat yield under rain-fed conditions. Soil Res. 2015, 54, 38. [Google Scholar] [CrossRef]
  34. Yao, Y.; Li, G.; Lu, Y.; Liu, S. Modelling the impact of climate change and tillage practices on soil CO2 emissions from dry farmland in the Loess Plateau of China. Ecol. Model. 2023, 478, 110276. [Google Scholar] [CrossRef]
  35. Ferreira, E.V.D.; Anghinoni, I.; Carvalho, P.C.D.; Costa, S.E.V.G.D.; Cao, E.G. Soil potassium content in an integrated crop-livestock system under no-tillage with different grazing intensities. Revista Bras. Ciencia Sol. 2009, 33, 1675–1684. [Google Scholar] [CrossRef]
  36. Franzluebbers, A.J.; Hons, F.M. Soil-profile distribution of primary and secondary plant-available nutrients under conventional and no tillage. Soil Till. Res. 1996, 39, 229–239. [Google Scholar] [CrossRef]
  37. Tshuma, F.; Rayns, F.; Labuschagne, J.; Bennett, J.; Swanepoel, P.A. Effects of long-term (42 years) tillage sequence on soil chemical characteristics in a dryland farming system. Soil Till. Res. 2012, 212, 105064. [Google Scholar] [CrossRef]
  38. Calistru, A.E.; Filipov, F.; Cara, I.G.; Cioboata, M.; Topa, D.; Jitareanu, G. Tillage and Straw Management Practices Influences Soil Nutrient Distribution: A Case Study from North-Eastern Romania. Land 2024, 13, 625. [Google Scholar] [CrossRef]
  39. Singh, A.; Ghimire, R.; Acharya, P. Soil profile carbon sequestration and nutrient responses varied with cover crops in irrigated forage rotations. Soil Till. Res. 2024, 238, 106020. [Google Scholar] [CrossRef]
  40. Ryan, M.H.; Tibbett, M.; Lambers, H.; Bicknell, D.; Brookes, P.; Barrett-Lennard, E.G.; Ocampo, C.; Nicol, D. Pronounced surface stratification of soil phosphorus, potassium and sulfur under pastures upstream of a eutrophic wetland and estuarine system. Soil Res. 2017, 55, 657–669. [Google Scholar] [CrossRef]
  41. He, L.; Lu, S.; Wang, C.; Mu, J.; Zhang, Y.; Wang, X. Changes in soil organic carbon fractions and enzyme activities in response to tillage practices in the Loess Plateau of China. Soil Till. Res. 2021, 209, 104940. [Google Scholar] [CrossRef]
  42. Mühlbachová, G.; Kusá, H.; Růžek, P. Soil characteristics and crop yields under different tillage techniques. Plant Soil Environ. 2015, 61, 566–572. [Google Scholar] [CrossRef]
  43. Ahl, C.; Joergensen, R.G.; Kandeler, E.; Meyer, B.; Woeler, V. Microbial biomass and activity in silt and sand kams after long-term shallow tillage in central Germany. Soil Till. Res. 1998, 49, 93–104. [Google Scholar] [CrossRef]
  44. Zhu, K.; Ran, H.Y.; Wang, F.F.; Ye, X.; Niu, L.A.; Schulin, R.; Wang, G. Conservation tillage facilitated soil carbon sequestration through diversified carbon conversions. Agric. Ecosys. Environ. 2022, 337, 108080. [Google Scholar] [CrossRef]
  45. Jobbágy, E.G.; Jackson, R.B. The distribution of soil nutrients with depth: Global patterns and the imprint of plants. Biogeogeochemistry 2001, 53, 51–77. [Google Scholar] [CrossRef]
  46. Budhathoki, S.; Lamba, J.; Srivastava, P.; Williams, C.; Arriaga, F.; Karthikeya, K.G. Impact of land use and tillage practice on soil macropore characteristics inferred from X-ray computed tomography. Catena 2022, 210, 105886. [Google Scholar] [CrossRef]
  47. Galdosa, M.V.; Piresb, L.F.; Cooperc, H.V.; Calonegod, J.C.; Rosolemd, C.A.; Mooney, S.J. Assessing the long-term effects of zero-tillage on the macroporosity of Brazilian soils using X-ray Computed Tomography. Geoderma 2019, 337, 1126–1135. [Google Scholar] [CrossRef]
  48. Blouin, M.; Hodson, M.E.; Delgado, E.A.; Baker, G.; Brussaard, L.; Butt, K.R.; Dai, L.; Dendooven, L.; Peres, G.; Tondoh, J.E.; et al. A review of earthworm impact on soil function and ecosystem services. Eur. J. Soil Sci. 2013, 64, 161–182. [Google Scholar] [CrossRef]
  49. Sutri, M.; Ivask, M.; Kuu, A.; Escuer-Gartius, J.; Reintam, E.; Shanskiy, M. The effects of agricultural practices on earthworm communities in Estonia. Eur. J. Soil Biol. 2024, 122, 103662. [Google Scholar] [CrossRef]
  50. Wang, Q.J.; Horton, R.; Shao, M.G. Effective raindrop kinetic energy influence on soil potassium transport into runoff. Soil Sci. 2002, 167, 369–376. [Google Scholar] [CrossRef]
  51. Matula, J. A relationship between multi-nutrient soil tests (Mehlich 3, ammonium acetate, and water extraction) and bioavailability of nutrients from soils for barley. Plant Soil Environ. 2009, 55, 173–180. [Google Scholar] [CrossRef]
  52. Li, H.X.; Chen, Z.J.; Zhou, T.; Liu, Y.; Zhou, J.B. High potassium to magnesium ratio affected the growth and magnesium uptake of three tomato (Solanum lycopersicum L.) cultivars. J. Integr. Agric. 2018, 17, 2813–2821. [Google Scholar] [CrossRef]
  53. Poonpakdee, C.; Khawmee, K.; Onthong, J. Response of Rubber Tree Saplings to Dolomite and Kieserite Application and K:Mg Ratio. Pertanika J. Sci. Technol. 2021, 29, 2465–2479. [Google Scholar] [CrossRef]
  54. Domagała-Świątkiewicz, I.; Gąstoł, M.; Kiszka, A. Effect of nitrogen and potassium fertilization on the magnesium content in vineyard soil, and in the leaves and berries of Bianca and Sibera grapevine cultivars. J. Elem. 2019, 24, 755–769. [Google Scholar]
Figure 1. Nutrient contents in soils under different soil tillage practices determined using the Mehlich 3 method. The same letters in the figures indicate statistically identical values according to Tukey’s test (p ≤ 0.05).
Agronomy 14 03017 g001
Figure 2. Nutrient contents in soils under different soil tillage practices determined using NH4 acetate. The same letters in the figures indicate statistically identical values according to Tukey’s test (p ≤ 0.05).
Agronomy 14 03017 g002
Figure 3. Soil pH under different soil tillage practices determined in deionized water and CaCl2. The same letters in the figures indicate statistically identical values according to Tukey’s test (p ≤ 0.05).
Agronomy 14 03017 g003
Figure 4. Soil macro-fauna macropores under different soil tillage practices (spring 2024 after pea rotation).
Agronomy 14 03017 g004
Table 1. Percentage of nutrients in the soil profile under different soil tillage practices relative to the surface soil layer.
Mehlich 3NH4 Acetate
Nutrient/
Tillage
Depth (cm)2009–20122013–20162017–20202021–20242009–20122013–20162017–20202021–2024
Phosphorus
CT0–10100100100100100100100100
10–2010110610098101126113109
20–3090959174911048656
RT0–10100100100100100100100100
10–205567645848403323
20–304347434120201911
NT0–10100100100100100100100100
10–204955475523241719
20–304248414817201114
Potassium
CT0–10100100100100100100100100
10–20111104106108106112106113
20–30979899921031069795
RT0–10100100100100100100100100
10–206268636160656258
20–305752505143475151
NT0–10100100100100100100100100
10–205055555254525451
20–304245454941434447
Magnesium
CT0–10100100100100100100100100
10–2010010210110395101102108
20–309810099100999898105
RT0–10100100100100100100100100
10–207985838277727670
20–306672697057575961
NT0–10100100100100100100100100
10–207484878265797978
20–306572747556666466
Calcium
CT0–10100100100100100100100100
10–20104101100104100101101108
20–30107102102111979898109
RT0–10100100100100100100100100
10–2012411311111487919188
20–30125124127128939595106
NT0–10100100100100100100100100
10–20109941009778828283
20–3011910110610886888894
Table 2. K:Mg:Ca nutrient ratios in soils under different tillage practices and at different depths.
TillageDepth (cm) 2009–20122013–20162017–20202021–2024
CT0–101:1.62:13.151:1.61:12.231:1.55:11.921:1.70:11.83
10–201:1.45:12.381:1.45:10.831:1.50:11.641:1.64:11.47
20–301:1.56:12.331:1.48:11.291:1.57:12.311:1.89:13.61
RT0–101:1.27:7.771:1.46:8.301:1.42:8.211:1.49:8.15
10–201:1.64:11.391:1.53:11.011:1.74:12.811:1.82:12.66
20–301:1.68:16.881:1.65:15.901:1.66:16.711:1.80:16.81
NT0–101:1.24:7.321:1.26:7.441:1.21:7.881:1.29:7.21
10–201:1.49:10.651:1.77:10.811:1.78:13.411:1.96:12.10
20–301:1.70:15.371:1.77:14.101:1.77:16.061:1.81:14.49
Table 3. Multiple relationships between tillage practices, soil depth, and crop rotation cycle with soil nutrients determined with the Mehlich 3 method, NH4 acetate, and pH. Abbreviations: ns—nonsignificant. * p ≤ 0.05; ** p ≤ 0.01; *** p ≤ 0.001.
CropMehlich 3Ammonium Acetate
TillageDepthRotationKPMgCaKPMgCapH-H2OpH-CaCl2
Tillage-0.000 ns0.000 ns 0.135 ns 0.064 ns 0.045 ns−0.258 ** 0.168 ns 0.160 ns 0.144 ns−0.095 ns−0.152 ns−0.013 ns
Depth -0.000 ns−0.707 ***−0.713 ***−0.654 *** 0.546 ***−0.695 ***−0.687 ***−0.685 ***−0.040 ns 0.601 *** 0.649 ***
Crop rotation -−0.012 ns−0.247 ** 0.432 *** 0.196 * 0.058 ns−0.176 ns 0.190 *−0.105 ns 0.299 **−0.085 ns
K-M 3 - 0.874 *** 0.743 ***−0.437 *** 0.927 *** 0.900 *** 0.783 *** 0.133 ns−0.570 ***−0.494 ***
P-M 3 - 0.577 ***−0.575 *** 0.823 *** 0.921 *** 0.672 *** 0.134 ns−0.639 ***−0.556 ***
Mg-M 3 -−0.332 *** 0.743 *** 0.589 *** 0.793 ***−0.016 ns−0.400 ***−0.531 ***
Ca-M 3 -−0.442 ***−0.524 ***−0.535 ***−0.029 ns 0.692 *** 0.588 ***
K-NH4 Ac - 0.915 *** 0.888 *** 0.190 *−0.545 ***−0.525 ***
P-NH4 Ac - 0.781 *** 0.253 **−0.618 ***−0.498 **
Mg-NH4 Ac - 0.279 **−0.547 ***−0.567 ***
Ca-NH4 Ac -−0.126 ns−0.037 ns
pH-H2O - 0.607 ***
pH-CaCl2 -
Table 4. ANOVA test considering tillage practices, soil depth, and crop rotation cycle with soil nutrients determined with the Mehlich 3 method, NH4 acetate. (* p ≤ 0.05).
NutrientParameterMehlich 3NH4 Acetate
pp
PTillage0.012 *0.000 *
Depth0.000 *0.000 *
Cycle of crop rotation0.000 *0.000 *
Tillage*Depth0.000 *0.000 *
Tillage*Cycle of crop rotation0.3180.501
Depth*Cycle of crop rotation0.2300.069
Tillage*Depth*Cycle of crop rotation0.8040.516
KTillage0.000 *0.000 *
Depth0.000 *0.000 *
Cycle of crop rotation0.0690.000 *
Tillage*Depth0.000 *0.000 *
Tillage*Cycle of crop rotation0.2020.817
Depth*Cycle of crop rotation0.6830.589
Tillage*Depth*Cycle of crop rotation0.9430.912
MgTillage0.1390.001 *
Depth0.000 *0.000 *
Cycle of crop rotation0.000 *0.000 *
Tillage*Depth0.000 *0.000 *
Tillage*Cycle of crop rotation0.2160.667
Depth*Cycle of crop rotation0.5990.804
Tillage*Depth*Cycle of crop rotation0.9510.898
CaTillage0.000 *0.007 *
Depth0.000 *0.043 *
Cycle of crop rotation0.014 *0.000 *
Tillage*Depth0.000 *0.001 *
Tillage*Cycle of crop rotation0.1410.161
Depth*Cycle of crop rotation0.1200.507
Tillage*Depth*Cycle of crop rotation0.8200.972
Disclaimer/Publisher’s Note: The statements, opinions and data contained in all publications are solely those of the individual author(s) and contributor(s) and not of MDPI and/or the editor(s). MDPI and/or the editor(s) disclaim responsibility for any injury to people or property resulting from any ideas, methods, instructions or products referred to in the content.

