Article

Response of Bread Wheat Cultivars to Terminal Water Stress and Cytokinin Application from a Grain Phenotyping Perspective

Department of Plant Production and Genetics, School of Agriculture, Shiraz University, Shiraz 7155713876, Iran
*
Author to whom correspondence should be addressed.
Agronomy 2024, 14(1), 182; https://doi.org/10.3390/agronomy14010182
Submission received: 15 November 2023 / Revised: 29 December 2023 / Accepted: 9 January 2024 / Published: 15 January 2024
(This article belongs to the Section Water Use and Irrigation)

Abstract

:
A better understanding of the responsiveness of grain phenotypic indices to terminal water stress (TWS) in wheat might help explain grain weight variations and determine which grain traits are most affected. A two-year field experiment (2020–2021 and 2021–2022) was conducted to identify how TWS and exogenous cytokinin application might affect grain weight and grain dimensions in three bread wheat cultivars using high-throughput digital image phenotyping. The results showed that the effects of growing seasons, irrigation, and cultivars were significant on grain weight and phenotypic indices. In our study, TWS significantly reduced thousand grain weight (24.62%, 14.65%) and grain development in the width directions MinFeret, i.e., minimum caliper diameter (10.70%, 6.64%) and Minor, i.e., the minor axes of the best fitted ellipses to the grains (10.91%, 6.65%), or synthesized indices including Area/Perim. (9.01%, 5.42%), Area × Circ. (17.30%, 10.13%), Minor/Solid. (10.26%, 6.32%), MinFeret/Solid. (10.01%, 6.11%), Area × Solid (13.94%, 7.96%), Perim. × Circ. (9.07%, 5.42%), A1 (29.99%, 17.09%), and A2 (30.20%, 17.27%) in each growing season, respectively. Regardless of the factors causing these variations, a sustained relationship was found between thousand grain weight and phenotypic indices, with significant positive correlations. The stronger positive correlation between thousand grain weight and grain width indices (r ≥ 0.965) showed important implications for grain development and filling. The Torabi cultivar performed better than the Sirvan and Pishgam in both growing season conditions. In addition, the technical advantages of developing phenotyping approaches, the present study could contribute to a better physiological evaluation of wheat cultivars in multivariate environments.

1. Introduction

Bread wheat (Triticum aestivum L.), a globally important cereal crop, is susceptible to significant disruptions caused by sudden shifts in environmental and climatic conditions. Climate variability accounted for 35% of the variation in worldwide wheat production, with disparities between cold and warm locations [1]. Wheat production has shifted dramatically due to global warming, with predicted losses reaching up to 6.4% for every 1 °C increase in temperature [2]. Drought is anticipated to raise the likelihood of wheat production loss by over 12% by the end of this century in various cropping areas [3]. Several authors have underlined the significance of better understanding wheat physiology to achieve future wheat yield improvements. Two numerical factors—the number of grains per area and the thousand grain weight (TGW)—are often the foundations of wheat grain yield. It has been shown that the critical driver of grain yield, especially during optimum conditions, is the number of grains per area, determined prior to anthesis [4]. However, with further constraints, TGW may be most severely affected during the reproductive period [5].
The climate in the southern region of Iran is semiarid, with a Mediterranean rainfall pattern. This raises air temperature and evapotranspiration during the latter phases of the winter wheat growing season, particularly in June and July. The crop may be exposed to water stress after flowering (terminal water stress) due to the convergence of these weather patterns, accompanied by a decrease in rainfall [6,7]. Undoubtedly, the magnitude, duration, and nature of stress events during the reproductive phase have been shown to affect TGW and its morphological traits (i.e., grain phenotypic indices), known as yield subcomponents [8]. Hence, it is vital to examine TGW and its development from anthesis to maturity in investigating post-anthesis abiotic stresses. This is due to the potential presence of genetic variability associated with this characteristic, which could serve as a valuable source of tolerance to extreme climatic events that are expected to become more frequent in the future [9].
Cytokinins (CKs) are interesting plant hormones that play a significant role in various plant functions like regulation of cell division, tissue patterning, and organ size, which are crucial in plant growth and development [10]. Recent research has focused on the effect of CKs on improving the negative impact of environmental stresses on crop productivity and physiological functions [11,12,13,14]. Yang et al. (2016) reported that exogenous CK improved winter wheat yield under heat stress by maintaining the active photosynthetic period during the grain filling and the transfer of more assimilates to the grain, and as a result, it had profound effects on grain yield [11]. Zarea and Karimi (2023) also found that water stress tolerance was enhanced in wheat due to CK application. This enhancement was reported to be associated with an increase in antioxidant activity and decreased lipid peroxidation [15]. In the context of grain development studies, it has been shown that the exogenous application of CK during the early filling stage can affect the sink size of the grain by mediating cell division in the endosperm [13,16]. However, currently, little is known about the effects of CK application on grain morphometric properties and responses under terminal water stress (TWS) conditions.
For a better understanding of the sources of variation in potential GW determination and related aspects to improve yield capacity [5,17,18], numerous imaging approaches, from straightforward 2D indices to sophisticated 3D reconstruction methods, have been used in the study of wheat grain during the past few decades [19,20,21,22,23,24,25,26]. Although 3D images can offer detailed geometric information on wheat grain, the process is laborious, costly, and requires specialized equipment. In contrast, 2D grain analysis using an ordinary digital image is a quick and low-cost procedure that can be performed with various equipment, including consumer-grade cameras, scanners, and automated imaging systems. Using this method, a massive number of grains can be evaluated in real-time or almost real-time for scientific and industrial purposes [23]. Grain image analysis is an aspect of high-throughput phenotyping (HTP), which has grown as a powerful tool for analyzing extensive breeding programs. Due to its effectiveness, affordability, and widespread accessibility, HTP commonly employs RGB cameras, which are imaging devices capable of capturing images using three primary colors: red, green, and blue. By utilizing appropriate phenotypic indices, it becomes feasible to rapidly and precisely measure the phenotype of grain samples through the simple processing of RGB images of the grains. This approach allows for an efficient and accurate analysis of grain characteristics.
Although the effectiveness of HTP has been based on numerous studies, few studies have evaluated its effectiveness when combined with terminal water stress and plant growth-promoting hormones like cytokinin. Therefore, we attempted to (i) explore how TWS and exogenous 6-Benzylaminopurine (6-BA) may affect TGW and grain dimensions in three wheat cultivars using HTP digital imaging phenotyping and (ii) evaluate the primary morphological or phenotypic grain traits that involve grain weight measurements. This current study investigated TGW and subcomponents of yield, including grain morphological traits (i.e., 13 grain phenotypic indices) and responses in winter wheat to TWS and foliar application of 6-BA using the HTP approach.

2. Materials and Methods

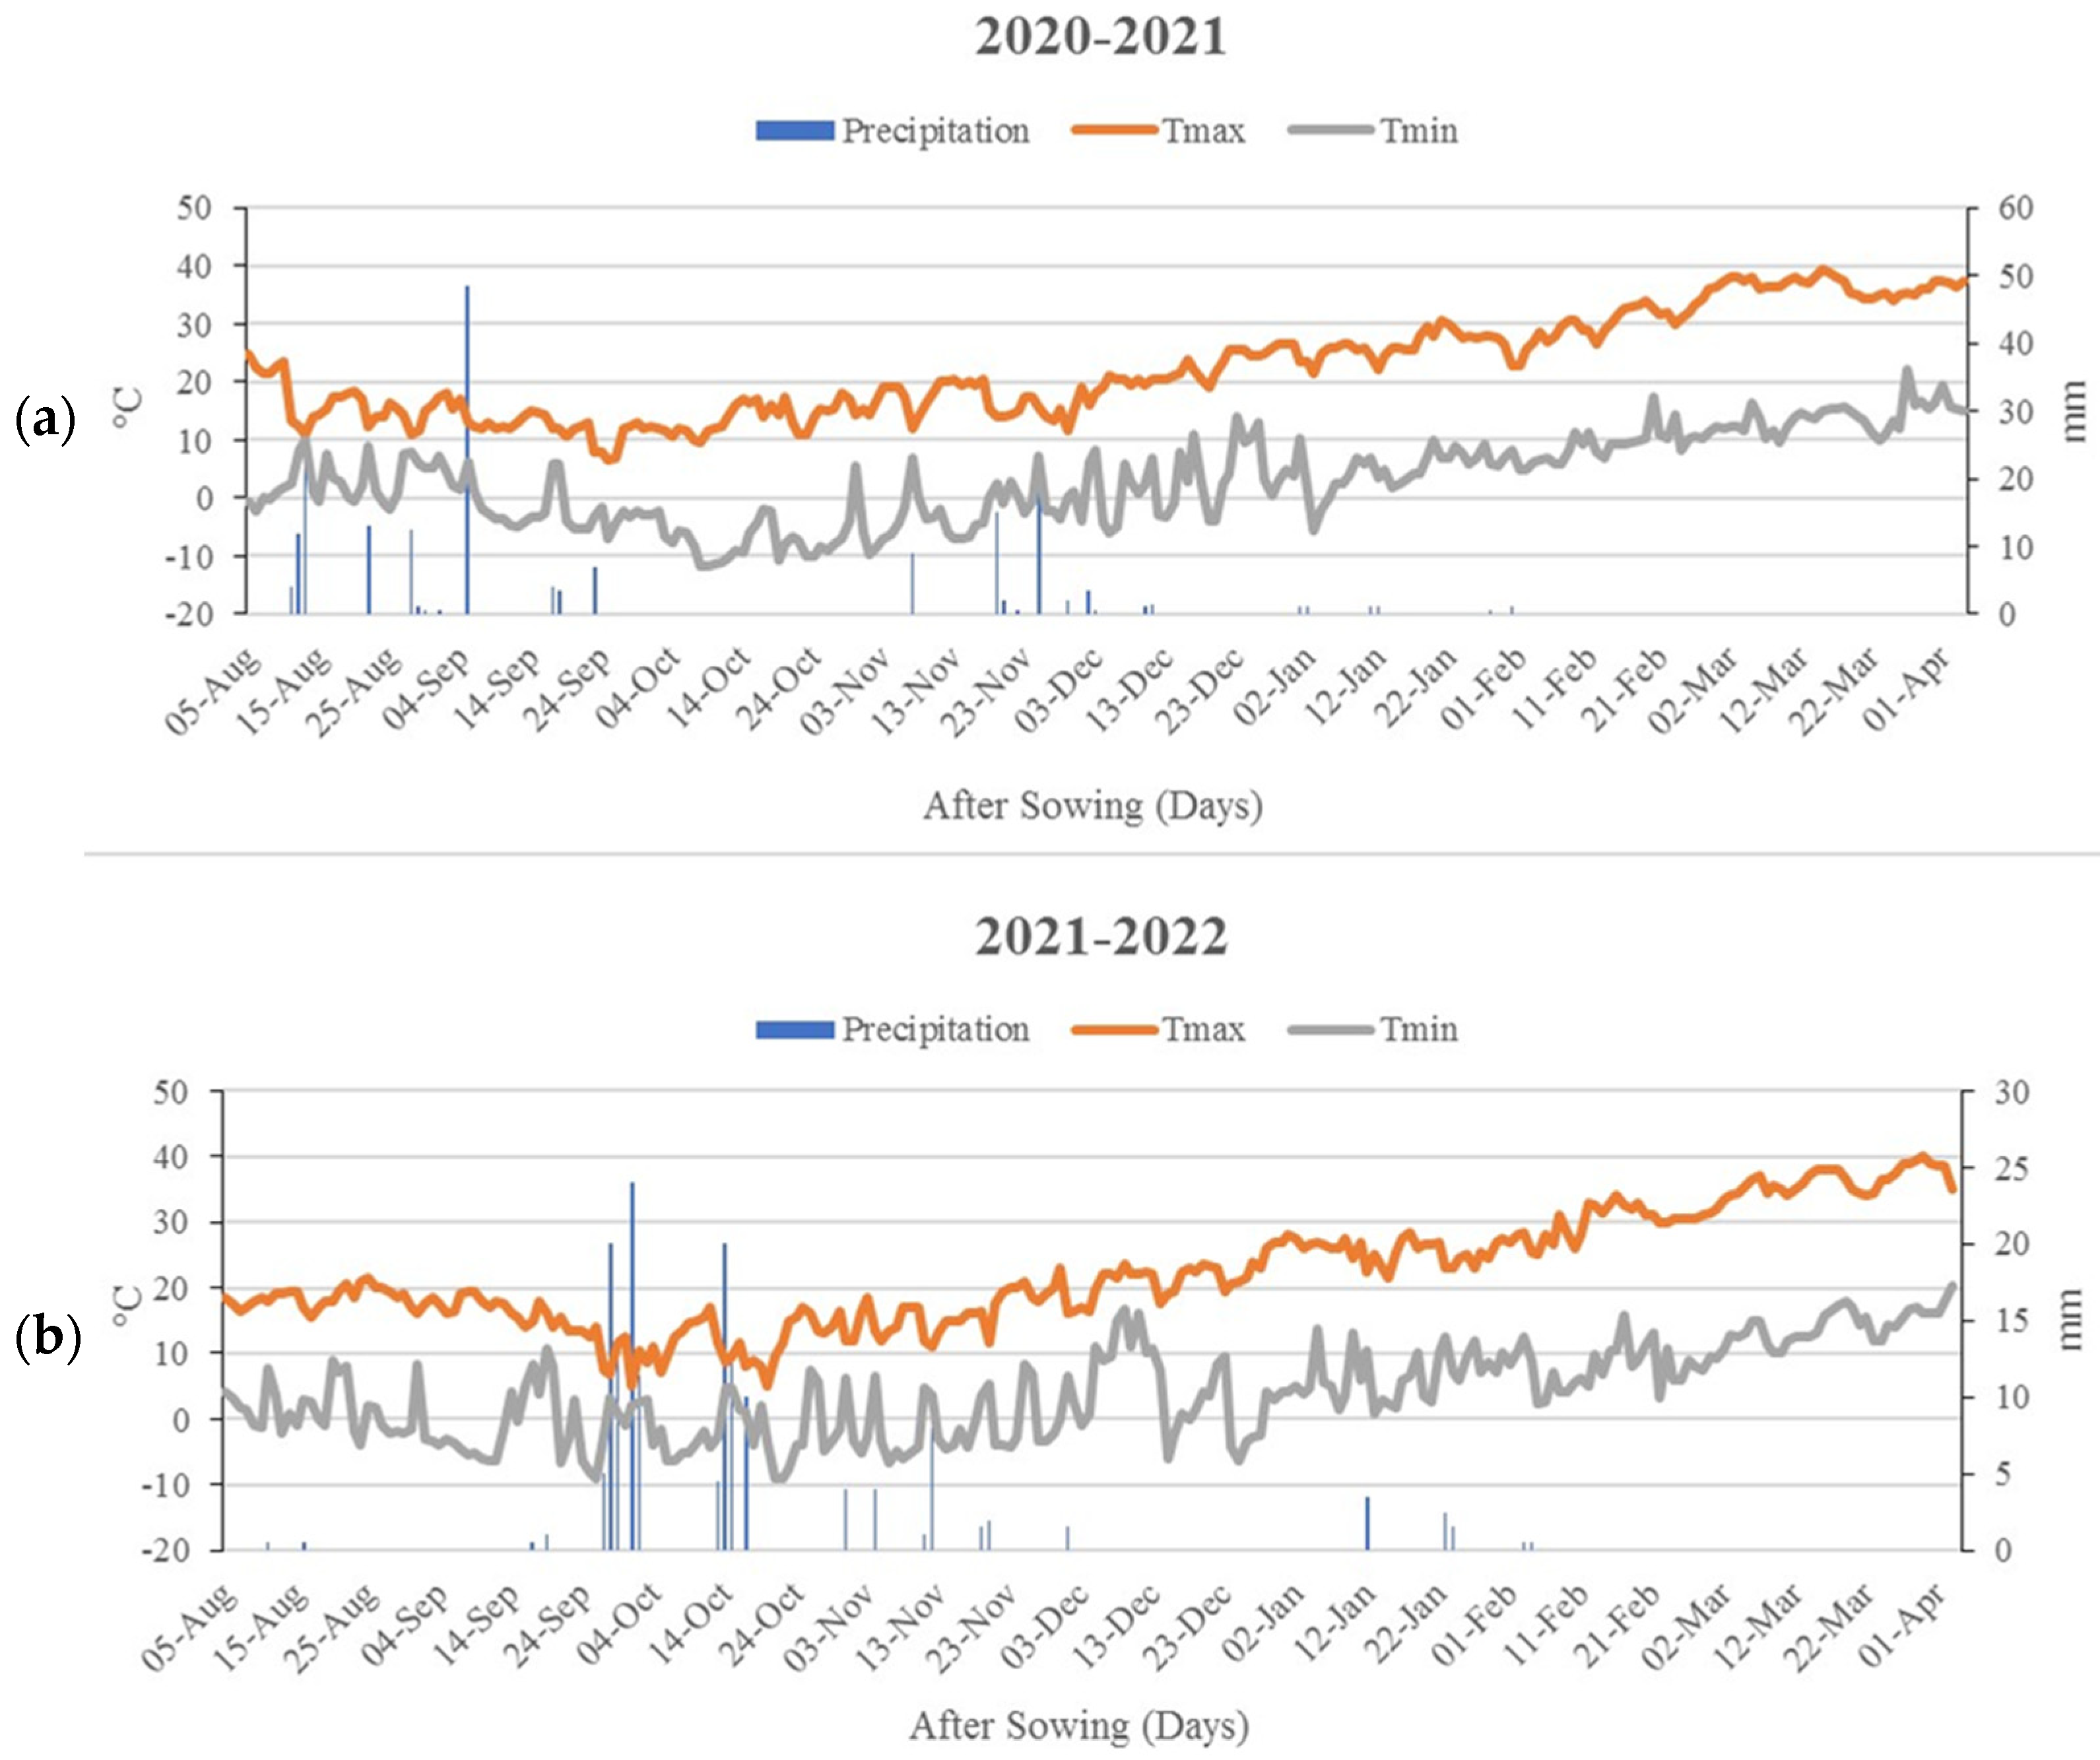
2.1. Plant Materials and Growth Conditions

A two-year field experiment was carried out at the School of Agriculture, Shiraz University, Iran, over two consecutive seasons (2020–2021 and 2021–2022). The experimental site was located at 29°73′ N latitude and 52°59′ E longitude and had an elevation of 1810 m above sea level. Plants of three winter wheat cultivars, Pishgam, Sirvan, and Torabi, were grown in experimental plots. There were 10 rows 4.5 m long in each plot. Rows were 0.25 m apart in both growing seasons. Seeds were hand-sown on 5 November 2021, and 6 November 2022, at 300 seeds m−2 density. The drip irrigation method was used with one tape for each row. A preventative program of disease, weed, and pest management was implemented to ensure uninterrupted, healthy crop growth. Weather conditions were recorded during the cropping seasons (Figure 1).

2.2. Treatments and Experimental Design

The experiment was arranged as a split-plot based on a randomized complete block design with three replicated blocks. Treatments consisted of two irrigation regimes (well-watered and terminal water stress) assigned to the main plots, two levels of exogenous cytokinin application (control and 6-Benzylaminopurine, 6-BA) as the subplots, and three winter wheat cultivars, Pishgam, Sirvan, and Torabi, as the sub-plots. These cultivars are known for their adaptability and tolerance to terminal drought stress in semi-arid regions. In well-watered treatment (WW), plots were irrigated from sowing to maturity. Irrigation was cut-off at anthesis in terminal water stress treatment (TWS). Indeed, TWS occurs naturally in wide regions of the Persian plateau [5,6].
Plants were sprayed with 0.01 g L−1 6-BA (Sigma, St. Louis, MI, USA) at a rate of 100 L ha−1 starting one to three days after anthesis at 17:00 h, according to Yang et al. 2016 [11]. In the control treatment, distilled water was applied. Tween-20 was used as a surfactant in all of the solutions at a final concentration of 0.5% (v/v).
A laboratory thresher was used to thresh the spikes and measure the grain yield harvested from the center of each plot (1 m2).

2.3. Imaging

Images were taken using an exclusively designed laboratory system (Visual Grain Analyzer, VGA; see Haghshenas et al. (2022) [23], which was equipped with a glass table with a 60 × 60 cm flicker-free white LED panel light source from underneath. Images with dimensions of 6960 × 4640 pixels (about 33 MP) were captured in natural lighting conditions, from 50 cm above the samples (measured from the lens to the table). For each experimental plot, more than 400 grains were picked at random and positioned on the imaging table using a Vacuum Seed Counter, ensuring that the grains did not come into contact with each other (see Figure 2a). As a result, the entire archive (including 36 images for each year) had almost 26,400 individual grains. After imaging, the overall weights of the 400 grains of each image were measured immediately using an A&D EK-610i (d = 0.01 g) weighing balance and reported as TGW.

2.4. Image Processing

The image processing and calculations described in the present study were carried out using the Visual Grain Analyzer (VGA v. 1.0.1), an easy-to-use ImageJ macro developed by Haghshenas et al. (2022) [23]. The macro is available on GitHub at: https://github.com/haqueshenas/Visual-Grain-Analyzer (accessed on 23 October 2023).
Before running the function, the “Analyze Particles” option was selected, and the resolution of images was set by a factor of 1 (see Figure 2b). The output tables were saved as.csv files and used for the following analysis. The examples of basic indices (i.e., grain size and shape descriptors) included Area, the major and minor axes of the best-fit ellipses to the grains (Major and Minor), minimum (MinFeret) and maximum (Feret) caliper diameter, etc. In addition to the basic features, numerous synthesized indices were also evaluated, which were reported to be the best wheat grain weight predictors (Table 1; also see [23]; and find more detailed definitions and formulae at: https://imagej.nih.gov/ij/docs/guide/146-30.html accessed on 23 October 2023).

2.5. Statistical Analyses

Data were subjected to analysis of variance (ANOVA) using SAS v. 9.3 (SAS Institute, Cary, NC, USA) to assess statistical significance. Based on the ANOVA results of the combined experiment, we observed a significant effect of the year (growing season) along with other factors. Considering that responses to various factors may differ across different years, we opted to analyze the two years separately. Means values were differentiated using Tukey’s honest significant difference (HSD) test at the 0.01 probability level. Pearson correlation analyses were employed to determine the relationship between different traits.

3. Results

According to the results of the analysis of variance (ANOVA; see Table 2 and Table 3), the main effect of irrigation treatment and cultivars was significant in determining TGW and grain phenotypic indices (i.e., basic and synthesized indices) in the first and second growing seasons. However, the cytokinin effect was not significant in both growing seasons.

3.1. TGW Responses under TWS

The analysis of variance revealed significant variability (p < 0.001) in TGW, both under WW and TWS, in each growing season (Table 4). Notably, as anticipated, the WW led to higher means of TGW both in the first and second growing seasons, with recorded values of 31.13 g and 37.85 g, respectively. In contrast, TWS consistently yielded a lower mean TGW, with values of 23.46 g and 32.34 g, respectively, throughout both growing seasons. This represents a significant reduction of more than 24% and 14% in the respective seasons compared to the WW condition.

3.2. Different TGW and Phenotyping Indices Responses across Cultivars

The evaluation of different cultivars revealed significant variations in TGW during both growing seasons (p < 0.05). In the first growing season, Torabi had the highest TGW of 29.60 g, followed by Pishgam with 27.11 g, and Sirvan with 25.70 g. Interestingly, the rankings shifted in the second growing season, with the Sirvan and Torabi cultivars displaying higher TGW values of 37.50 g and 35.47 g, respectively, surpassing Pishgam’s TGW of 32.27 g. Notably, there was no significant difference in TGW between Torabi and Sirvan (Table 5). These findings highlight the influence of cultivar selection and different growing conditions on TGW, as different cultivars exhibited variations in growth performance across the two growing seasons. Torabi consistently displayed higher TGW, while Sirvan showed a noteworthy increase in TGW from the first to the second season.
The cultivars exhibited significant (p < 0.05) variations in grain size and shape (Table 5). In the first growing season, Torabihad had the largest grain dimensions, closely followed by Pishgam, with Sirvan lagging behind. While Sirvan displayed significantly lower dimensions than Torabi, Pishgam was placed between these maximum and minimum grain dimensions. In contrast, the cultivars shifted their characteristics from the first growing season to another. In the second growing season, Sirvan and Torabi displayed higher grain size and shape compared to Pishgam (Table 5). It is important to highlight that the observed changes in the grain phenotypic indices among the cultivars closely mirrored the fluctuations in TGW discussed in Section 3.3.

3.3. Relationship between Grain Phenotyping Indices and TWS

Moving on to the grain phenotyping indices, the results showed that TWS significantly (p < 0.001) affected grain phenotyping indices in both growing seasons, except for Feret and Major, indices of grain length (Table 4). The observed trends were consistent across both years. Overall, TWS led to a significant decrease in various indices. This included basic indices such as Area (13.30% and 7.64%), Minor (10.91% and 6.65%), and MinFeret (10.70% and 6.44%); Additionally, synthesized indices such as Area/Perim. (9.01% and 5.42%), Area × Circ. (17.30% and 10.17%), Minor/Solid. (10.26% and 6.32%), MinFeret/Solid. (10.01% and 6.11%), Area×Solid (13.94% and 7.96%), Perim. × Circ. (9.07% and 5.42%), A1 (29.99% and 17.09%), and A2 (30.20% and 17.27%) also significantly declined due to TWS in the first and second growing seasons, respectively (Table 4). Specifically, the WW condition resulted in grains characterized by their larger size and rounder shape. In contrast, the TWS condition led to smaller and longer grains.

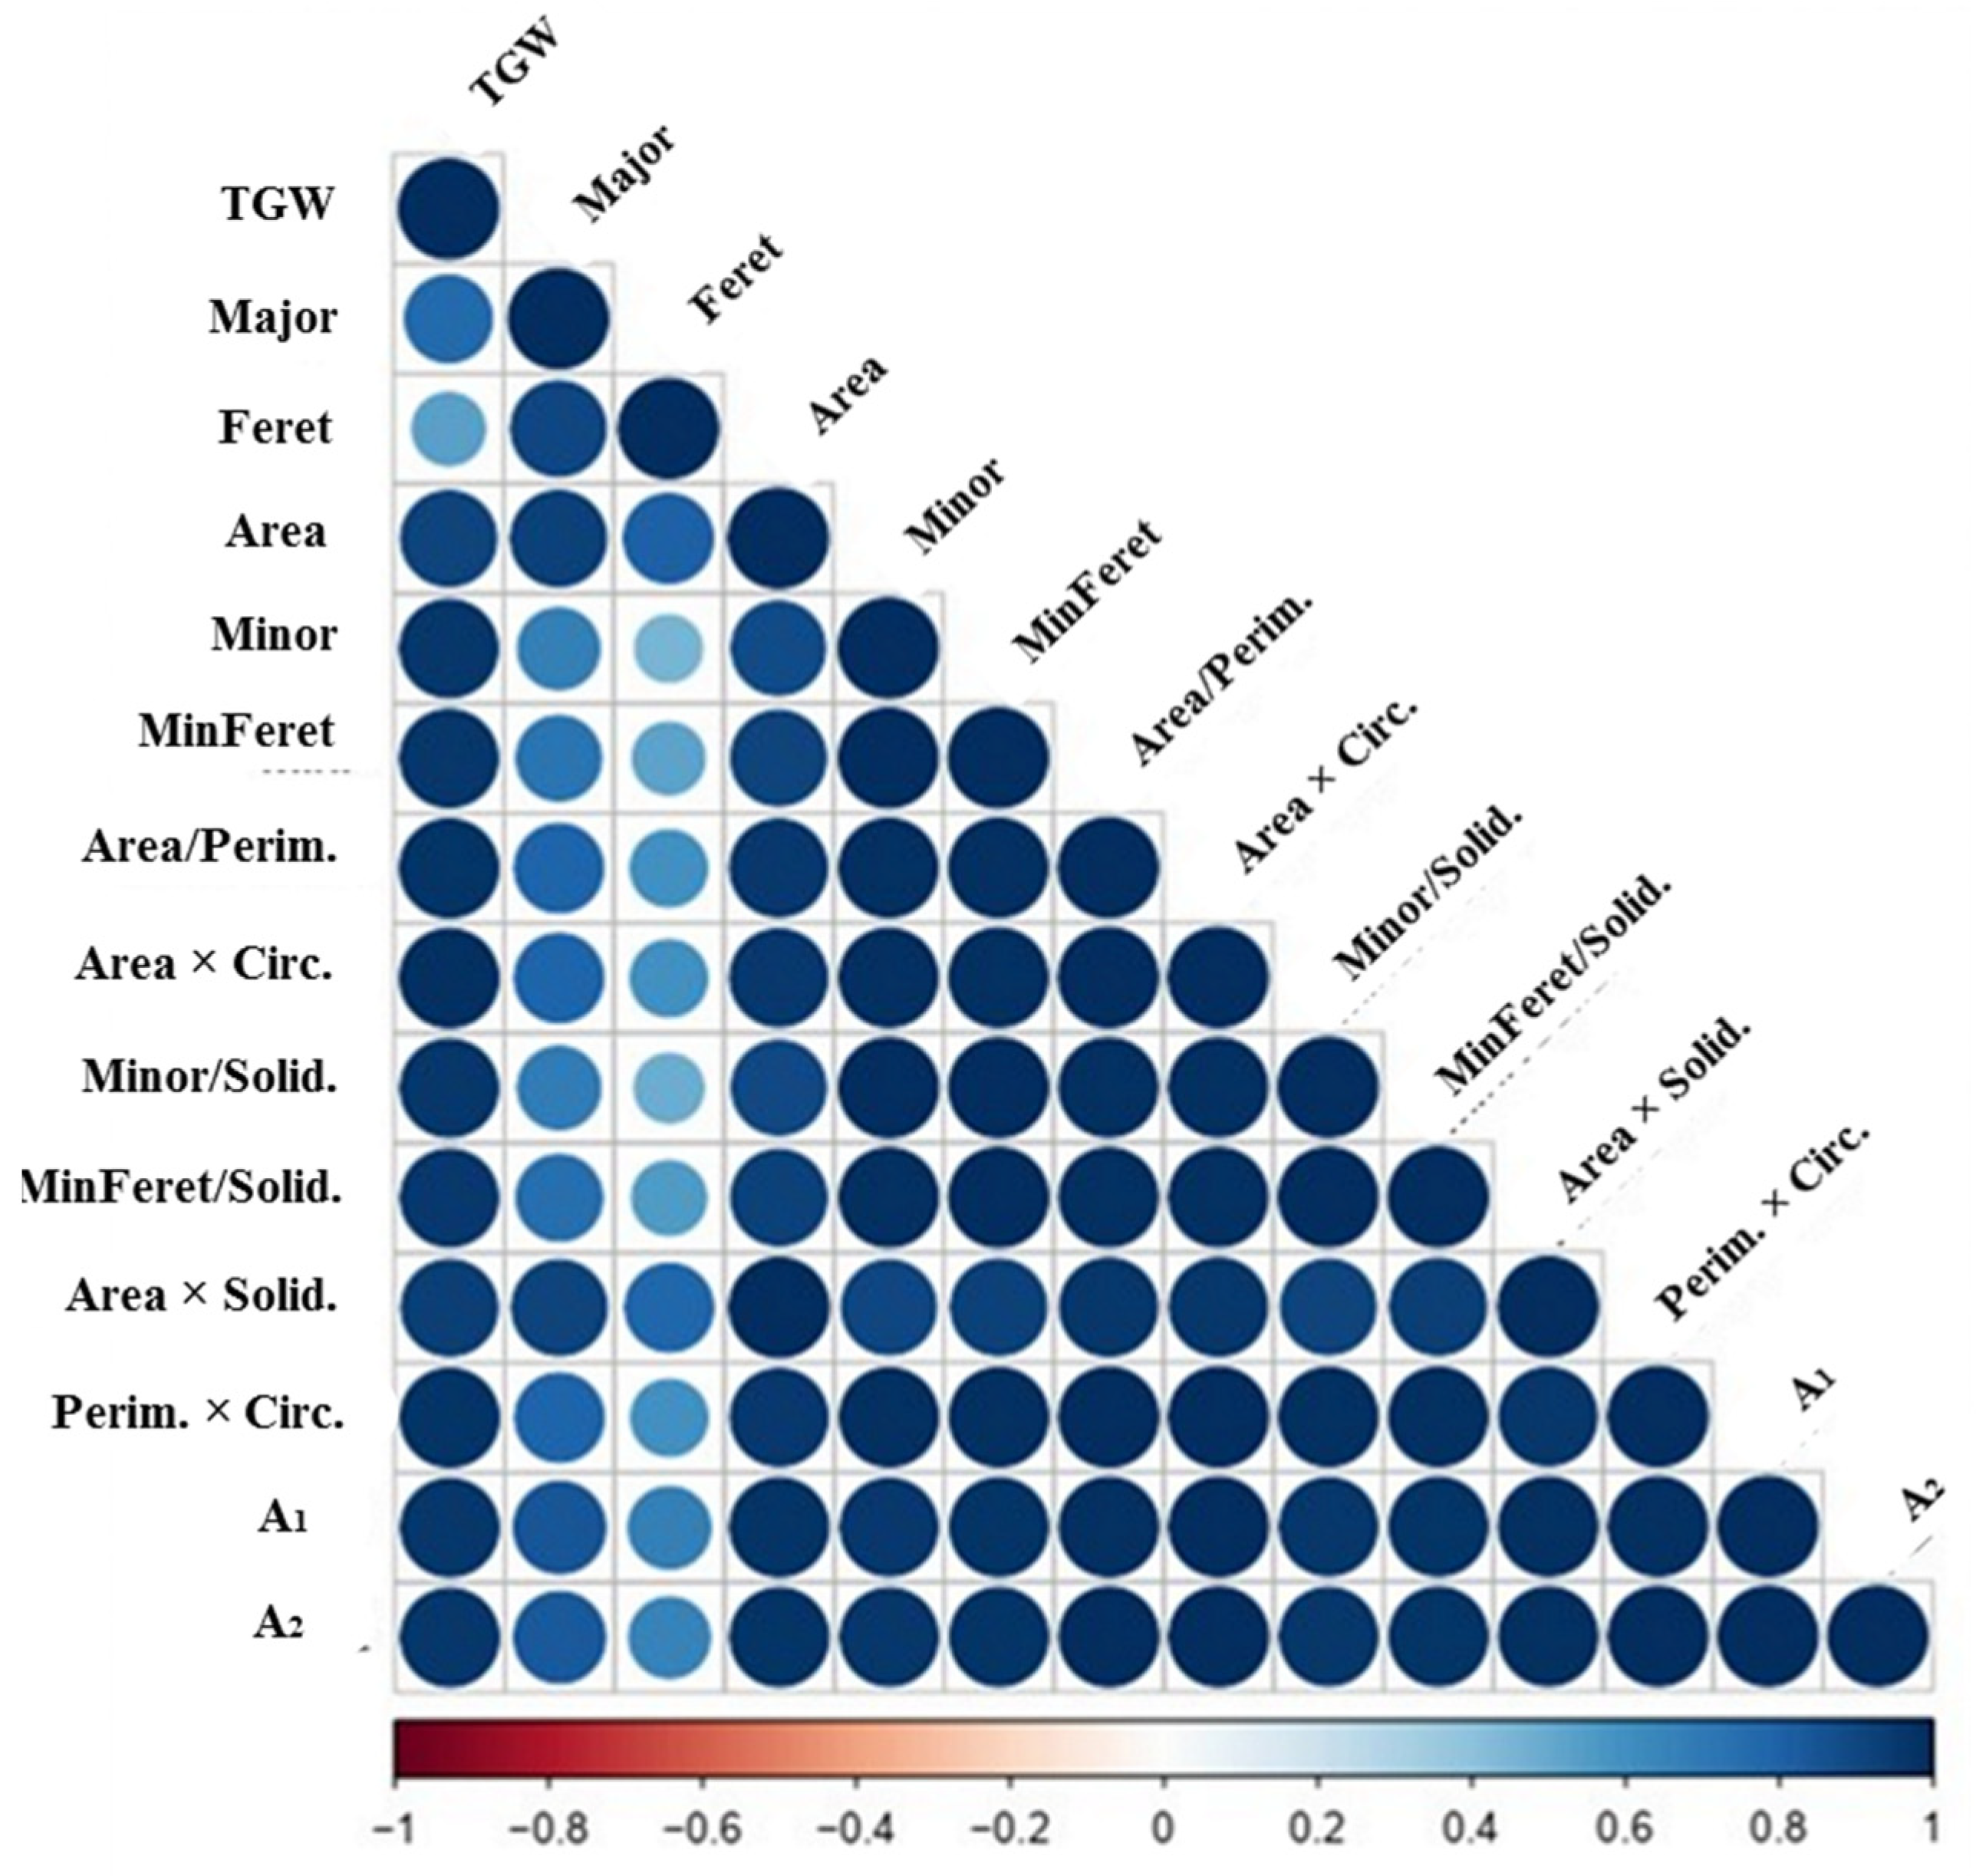
3.4. Dissecting Grain Phenotyping Indices Relationships through Correlations

Figure 3 presents the fluctuations apparent in the correlation coefficients (r) across different environmental situations. It is evident that across various conditions, the mentioned indices exhibited a significantly stronger correlation with TGW compared to the indices of grain length, namely the Major and Feret. Furthermore, irrespective of the grain length indices (Major and Feret), all other indices consistently exhibit the highest r values across almost all conditions.
Based on Figure 3, it was determined that: (i) Among the basic grain dimensions, Area had the highest correlation with grain width indices, including Minor (r = 0.941) and MinFeret (r = 0.953), as compared to grain length indices, Major (r = 0.598) and Feret (r = 0.575). (ii) The correlation between the two main grain axes, Major and Minor, was relatively low (r = 0.565), suggesting a certain level of independence between the grain growth and/or filling along the length and width orientations. (iii) The synthesized indices exhibited the strongest correlations with both Minor and MinFeret, which are grain width indices, surpassing the correlations with their individual mathematical components. For instance, consider the correlation between Area/Perim and Minor (r = 0.990) or MinFeret (r = 0.997), compared to the correlation between Area/Perim and the corresponding parameter, Area (r = 0.975). Figure 3 provides further insight into the comparative correlations of Major and Minor with other basic and synthesized indices, thereby confirming the earlier findings. Additionally, Table 6 offers a more detailed analysis of the correlations between TGW and its related traits, taking into account diverse conditions and cultivars. Notably, the trends observed earlier remained remarkably consistent, irrespective of variations in irrigation conditions and cultivars. Furthermore, significant correlations were observed among the remaining grain-related traits, emphasizing their relevance in relation to TGW. To promote a better understanding, our focus was directed towards discussing the notable relationships that offer unique insights into the intricate composition of grain size and shape components. We also presented the correlations for each factor level separately, rather than providing an overall correlation coefficient for all observations. These detailed results are included in the Supplementary Materials File.

4. Discussion

In this study, we employed a HTP approach to examine the impact of TWS and 6-BA on post-anthesis traits, with a specific focus on TGW and its associated basic and synthesized indices, in wheat cultivars over the course of two consecutive growing seasons.

4.1. TWS and Changes in TGW as a Function of Water Availability

Regarding the results, a significant reduction in the TGW has been observed due to the TWS in each growing season. It is evident that TWS accelerates the rate at which grains are filled but also reduces the duration of this process [27,28]. In this study, TWS was imposed following anthesis, which had the potential to shorten the crop life span by disrupting carbon assimilation and its transport in grains, thereby impacting grain filling and the final size of the grains [29]. Several studies have found that inhibition of cell division and assimilate synthesis in developing grains could play a critical role in size reduction and yield depression via leaf sucrose supply downregulation [30,31,32].
Wheat grain development typically occurs in three distinct phases: the lag phase, the filling phase, and the maturation phase. The lag phase, lasting approximately 15 days, or 250 °C is characterized by a constant number of endosperm cells [33]. During the first two weeks following anthesis, the number of cells is primarily determined by the availability of assimilates in the grain. Once the number of cells is established, it influences the rate of dry matter accumulation during the filling phase [34]. Samarah (2005) reported that plants subjected to severe or mild water stress treatments produced grains with lower TGW and experienced faster loss of grain moisture content compared to plants with an adequate water supply [35]. Optimal grain filling requires a balanced supply of assimilates and adequate moisture content. Additionally, proper moisture content ensures that the grains can expand and accumulate dry matter appropriately. Water plays a crucial role in the transportation of photosynthetic products and nutrients into developing grains, providing an optimal environment for metabolic reactions, and participating in the synthesis of storage products. Several studies have demonstrated a significant correlation between the water content of wheat grains and their final weight [18,29,36,37]. This effect is observed through the decrease in TGW, which is influenced by morphological traits in our research. The idea that specific developmental constraints during fruit or grain growth can lead to morphological changes receives additional support from recent studies examining grain size and shape in crops such as wheat [23,38] and other agricultural species.

4.2. Relationship between TGW and Grain Phenotyping Indices

The stronger relationship between TGW and both Minor and MinFeret (i.e., indices of grain width) and Area rather than Major and Feret (grain length indices) suggests essential implications for grain development and filling processes, especially regarding the fact that (i) The process of grain filling predominantly develops along the longitudinal length of the grain and conforms to an acropetal pattern, and (ii) The two-dimensional grain Area is expected to contribute more significantly to weight compared to one-dimensional features like grain width because it provides information about two out of the three dimensions. There has been a suggestion that grain width indices could serve as a valuable avenue for further investigation into visual indicators of TGW [23].
In addition to the aforementioned findings, the synthesized indices selected in this study displayed stronger correlations with grain width-related indices (Minor and MinFeret) compared to their mathematical components. This observation emphasizes the fundamental importance of grain width in grain physiology and weight evaluations, as it has consistently emerged as a significant characteristic in the current research. The results align with the research conducted by Gegas et al. (2010), which provided genetic evidence supporting the transformation of wheat during domestication, resulting in the evolution of broader and shorter modern grains from their original long and thin forms [39]. Exploring the contributions of the two primary axes, grain width and length, to TGW can provide valuable insights into grain growth and yield physiology [40,41]. These findings are consistent with the results reported by Haghshenas et al. (2022) [23]. Grain width and length can be considered weight components or subcomponents of wheat yield in general. Conducting comprehensive research in this area has the potential to reveal new insights into the process of grain development or filling, particularly under different conditions. For instance, the current investigation demonstrated a significant impact of TWS on grain dimensions. Specifically, the Feret and MinFeret indices were reduced by 3.08% and 10.70%, respectively, under first-year conditions and by 1.43% and 6.44% under second-year conditions. Consequently, these reductions in grain dimensions led to an overall decrease of 24.62% and 14.55% in TGW, respectively. These findings highlight the substantial influence of TWS on grain extension, which encompasses both development and filling, in the width directions (Minor and MinFeret) rather than grain length (Major and Feret). Conversely, the effect of the growing season on grain length indices was more pronounced.
Therefore, in contrast to the prevailing concept that the TGW of wheat is determined exclusively during grain filling, our findings indicate that the earlier developmental grain phases, which determine the potential final length, were primarily influenced by the season and/or pre-anthesis conditions. On the other hand, the later phenological stages and filling period, which contribute more to the grain width axis, were significantly influenced by the TWS. This supports the conclusion of Slafer et al. (2021), who emphasized the importance of the period preceding anthesis in establishing grain weight potential [5]. Therefore, investigating TGW within the context of both pre- and post-anthesis phases can provide a more comprehensive understanding of the underlying features. Subcomponent-level grain yield could also be employed to investigate different physiological aspects related to genetic or environmental influences on wheat grain. Interestingly, the higher-yielding conditions (first growing season) had lower values of TGW, and vice versa. This is primarily attributed to the negative relationship between grains m−2 and TGW. This is because (i) when there are more grains per unit area, the grain-filling capacity of each grain may be reduced; (ii) each grain has to compete with neighboring grains for essential resources such as water, nutrients, and light. This competition further limits the availability of resources for individual grains, leading to a reduction in grain size and weight.
This study’s results showed that the variations in grain indices were closely aligned with the variations in TGW, regardless of the factors causing these variations, such as growing seasons, TWS, or cultivars. This suggests that the changes in grain indices, such as grain width and Area, reflect the overall changes in TGW. Therefore, analyzing grain indices can serve as a reliable indicator of TGW, providing valuable insights into the factors influencing grain development and yield in different conditions.

4.3. Responsiveness of Cultivars to Growth Conditions

According to the results, a significant variation was observed in the performance of distinct cultivars and their grain indices across contrasting growing season conditions. This indicates that the cultivars responded differently to various environmental factors. This finding aligns with that of Gaspar et al. (2002), who claimed that plants can activate diverse acclimation mechanisms driven by distinct genetic factors when they endure prolonged stress [42]. We must emphasize that the three employed cultivars were specifically developed to tolerate terminal drought conditions. However, these cultivars were not explicitly bred for other extreme environmental events, like spring freezing temperatures. Therefore, by gaining a comprehensive understanding of the relationships between TGW and grain morphological traits, which can serve as selection indices, breeding programs can be enhanced in fluctuating environmental conditions [43]. Notably, the Torabi cultivar demonstrated stable performance in terms of TGW and grain phenotypic indices throughout various growing seasons. This stability further highlights the potential of the Torabi cultivar as a valuable breeding resource, particularly in the formulation of breeding programs tailored to multivariate environments.

4.4. Effects of the 6-BA Application

The lack of a significant effect observed from the application of 6-BA reinforces the belief that the interplay between environmental factors and genotypes plays a crucial role in the response to treatments. Numerous studies have utilized varying concentrations of 6-BA to enhance yield-related traits and improve the tolerance of different plant species to abiotic stresses [44,45,46]. Although the concentration employed in this study was inspired by the study of Yang et al. (2016), who concluded that this specific concentration led to an increase in wheat grain yield by improving stay-green characteristics under heat stress conditions [11], furthermore, it is worth considering that the cultivars utilized in our study may not have exhibited a significant response in terms of TGW when subjected to 6-BA treatment. However, it is important to acknowledge that the absence of an impact on TGW does not diminish the potential benefits of 6-BA in other aspects of plant growth and development. In general, further research is necessary to completely comprehend the potential benefits and constraints of 6-BA application in reducing the adverse effects of stresses on wheat production. Exploring alternative features, parameters, and genotype interactions can offer a more comprehensive understanding of 6-BA effects in similar conditions.

5. Conclusions

We conducted a comprehensive analysis to explore the relationship between TGW and grain phenotypic indices, specifically across diverse growing conditions. To achieve this, we employed a High-Throughput digital imaging technique, which offers several advantages, including reducing experimental errors and enhancing physiological evaluations. Results showed that both irrigation level and cultivars significantly affected TGW and its phenotypic indices. In this study, a sustained relationship was found between grain weight and its phenotypic indices. Grain extension, the combination of development and filling, was significantly impacted by the TWS in the width directions (Minor and MinFeret) compared to the grain length (Major and Feret). In contrast, the effect of the growing season on both grain length indices (Feret and Major) was higher. Our findings indicate that the earlier developmental grain phases, which determine the potential final length, were primarily influenced by the season and/or pre-anthesis conditions. In this study, the Torabi cultivar was better than Sirvan and Pishgam.
In addition, the technical advantages of developing phenotyping approaches, the mentioned information about TGW and its related traits is essential for linking physiological processes and characteristics with their molecular bases to enhance wheat grain weight potential. This research continues to analyze grain characteristics along the spike and at different positions under contrasting growing seasons.

Supplementary Materials

The following supporting information can be downloaded at: https://www.mdpi.com/article/10.3390/agronomy14010182/s1. Table S1(a). The correlation among thousand grain weight and different grain related traits under well-watered (below the diagonal) and terminal water stress (above the diagonal) for first growing season (2020–2021). Table S1(b). The correlation among thousand grain weight and different grain related traits under well-watered (below the diagonal) and terminal water stress (above the diagonal) for second growing season (2021–2022). Table S1(c). The correlation among thousand grain weight and different grain related traits in first (below the diagonal) and second growing season (above the diagonal) (2020–2021, 2021–2022).

Author Contributions

Methodology, A.Z.; Software, A.Z.; Validation, A.Z.; Formal analysis, A.Z.; Investigation, A.Z. and M.E.; Data curation, A.Z. and M.E.; Writing—original draft, A.Z.; Writing—review & editing, A.Z., Y.E. and M.E.; Visualization, A.Z.; Supervision, Y.E.; Project administration, Y.E.; Funding acquisition, Y.E. All authors have read and agreed to the published version of the manuscript.

Funding

This research received no external funding.

Data Availability Statement

The authors confirm that the datasets analyzed during the current study are available from the corresponding author on request.

Conflicts of Interest

The authors declare no conflict of interest.

References

  1. Ray, D.K.; Gerber, J.S.; MacDonald, G.K.; West, P.C. Climate Variation Explains a Third of Global Crop Yield Variability. Nat. Commun. 2015, 6, 5989. [Google Scholar] [CrossRef] [PubMed]
  2. Helman, D.; Bonfil, D.J. Six Decades of Warming and Drought in the World’s Top Wheat-Producing Countries Offset the Benefits of Rising CO2 to Yield. Sci. Rep. 2022, 12, 7921. [Google Scholar] [CrossRef] [PubMed]
  3. Leng, G.; Hall, J. Crop Yield Sensitivity of Global Major Agricultural Countries to Droughts and the Projected Changes in the Future. Sci. Total Environ. 2019, 654, 811–821. [Google Scholar] [CrossRef]
  4. Vahamidis, P.; Karamanos, A.J.; Economou, G. Grain Number Determination in Durum Wheat as Affected by Drought Stress: An Analysis at Spike and Spikelet Level. Ann. Appl. Biol. 2019, 174, 190–208. [Google Scholar] [CrossRef]
  5. Slafer, G.A.; Savin, R.; Pinochet, D.; Calderini, D.F. Wheat. In Crop Physiology Case Histories for Major Crops; Victor, O.S., Daniel, F.C., Eds.; Academic Press: Cambridge, MA, USA, 2021; pp. 98–163. [Google Scholar]
  6. Tambussi, E.A.; Bort, J.; Araus, J.L. Water Use Efficiency in C3 Cereals under Mediterranean Conditions: A Review of Physiological Aspects. Ann. Appl. Biol. 2007, 150, 307–321. [Google Scholar] [CrossRef]
  7. Haghshenas, A.; Emam, Y. Image-Based Tracking of Ripening in Wheat Cultivar Mixtures: A Quantifying Approach Parallel to the Conventional Phenology. Comput. Electron. Agric. 2019, 156, 318–333. [Google Scholar] [CrossRef]
  8. Brinton, J.; Uauy, C. A Reductionist Approach to Dissecting Grain Weight and Yield in Wheat. J. Integr. Plant Biol. 2019, 61, 337–358. [Google Scholar] [CrossRef]
  9. Beral, A.; Rincent, R.; Le Gouis, J.; Girousse, C.; Allard, V. Wheat Individual Grain-Size Variance Originates from Crop Development and from Specific Genetic Determinism. PLoS ONE 2020, 15, e0230689. [Google Scholar] [CrossRef]
  10. Cortleven, A.; Leuendorf, J.E.; Frank, M.; Pezzetta, D.; Bolt, S.; Schmülling, T. Cytokinin Action in Response to Abiotic and Biotic Stresses in Plants. Plant. Cell Environ. 2019, 42, 998–1018. [Google Scholar] [CrossRef]
  11. Yang, D.; Li, Y.; Shi, Y.; Cui, Z.; Luo, Y.; Zheng, M.; Chen, J.; Li, Y.; Yin, Y.; Wang, Z. Exogenous Cytokinins Increase Grain Yield of Winter Wheat Cultivars by Improving Stay-Green Characteristics under Heat Stress. PLoS ONE 2016, 11, e0155437. [Google Scholar] [CrossRef]
  12. Hai, N.N.; Chuong, N.N.; Tu, N.H.C.; Kisiala, A.; Hoang, X.L.T.; Thao, N.P. Role and Regulation of Cytokinins in Plant Response to Drought Stress. Plants 2020, 9, 422. [Google Scholar] [CrossRef] [PubMed]
  13. Mandal, S.; Ghorai, M.; Anand, U.; Samanta, D.; Kant, N.; Mishra, T.; Rahman, M.H.; Jha, N.K.; Jha, S.K.; Lal, M.K.; et al. Cytokinin and Abiotic Stress Tolerance -What Has Been Accomplished and the Way Forward? Front. Genet. 2022, 13, 943025. [Google Scholar] [CrossRef] [PubMed]
  14. Hare, P.D.; Cress, W.A.; van Staden, J. The Involvement of Cytokinins in Plant Responses to Environmental Stress. Plant Growth Regul. 1997, 23, 79–103. [Google Scholar] [CrossRef]
  15. Zarea, M.J.; Karimi, N. Grain Yield and Quality of Wheat Are Improved through Post-Flowering Foliar Application of Zinc and 6-Benzylaminopurine under Water Deficit Condition. Front. Plant Sci. 2022, 13, 1068649. [Google Scholar] [CrossRef] [PubMed]
  16. Yang, J.; Peng, S.; Visperas, R.M.; Sanico, A.L.; Zhu, Q.; Gu, S. Grain Filling Pattern and Cytokinin Content in the Grains and Roots of Rice Plants. Plant Growth Regul. 2000, 30, 261–270. [Google Scholar] [CrossRef]
  17. Ramya, P.; Chaubal, A.; Kulkarni, K.; Gupta, L.; Kadoo, N.; Dhaliwal, H.S.; Chhuneja, P.; Lagu, M.; Gupt, V. QTL Mapping of 1000-Kernel Weight, Kernel Length, and Kernel Width in Bread Wheat (Triticum aestivum L.). J. Appl. Genet. 2010, 51, 421–429. [Google Scholar] [CrossRef]
  18. García, G.A.; Serrago, R.A.; González, F.G.; Slafer, G.A.; Reynolds, M.P.; Miralles, D.J. Wheat Grain Number: Identification of Favourable Physiological Traits in an Elite Doubled-Haploid Population. Field Crops Res. 2014, 168, 126–134. [Google Scholar] [CrossRef]
  19. Hughes, A.; Askew, K.; Scotson, C.P.; Williams, K.; Sauze, C.; Corke, F.; Doonan, J.H.; Nibau, C. Non-Destructive, High-Content Analysis of Wheat Grain Traits Using X-Ray Micro Computed Tomography. Plant Methods 2017, 13, 76. [Google Scholar] [CrossRef]
  20. Le, T.D.Q.; Alvarado, C.; Girousse, C.; Legland, D.; Chateigner-Boutin, A.-L. Use of X-Ray Micro Computed Tomography Imaging to Analyze the Morphology of Wheat Grain through Its Development. Plant Methods 2019, 15, 84. [Google Scholar] [CrossRef]
  21. Xiong, B.; Wang, B.; Xiong, S.; Lin, C.; Yuan, X. 3D Morphological Processing for Wheat Spike Phenotypes Using Computed Tomography Images. Remote Sens. 2019, 11, 1110. [Google Scholar] [CrossRef]
  22. Hu, W.; Zhang, C.; Jiang, Y.; Huang, C.; Liu, Q.; Xiong, L.; Yang, W.; Chen, F. Nondestructive 3D Image Analysis Pipeline to Extract Rice Grain Traits Using X-Ray Computed Tomography. Plant Phenomics 2020, 2020, 3414926. [Google Scholar] [CrossRef] [PubMed]
  23. Haghshenas, A.; Emam, Y.; Jafarizadeh, S. Wheat Grain Width: A Clue for Re-Exploring Visual Indicators of Grain Weight. Plant Methods 2022, 18, 58. [Google Scholar] [CrossRef] [PubMed]
  24. Ma, J.; Liu, Y.; Zhang, P.; Chen, T.; Tian, T.; Wang, P.; Che, Z.; Shahinnia, F.; Yang, D. Identification of Quantitative Trait Loci (QTL) and Meta-QTL Analysis for Kernel Size-Related Traits in Wheat (Triticum aestivum L.). BMC Plant Biol. 2022, 22, 607. [Google Scholar] [CrossRef] [PubMed]
  25. Rabieyan, E.; Bihamta, M.R.; Esmaeilzadeh Moghaddam, M.; Mohammadi, V.; Alipour, H. Imaging-Based Screening of Wheat Seed Characteristics towards Distinguishing Drought-Responsive Iranian Landraces and Cultivars. Crop Pasture Sci. 2022, 73, 337–355. [Google Scholar] [CrossRef]
  26. Halder, J.; Gill, H.S.; Zhang, J.; Altameemi, R.; Olson, E.; Turnipseed, B.; Sehgal, S.K. Genome-Wide Association Analysis of Spike and Kernel Traits in the U.S. Hard Winter Wheat. Plant Genome 2023, 16, e20300. [Google Scholar] [CrossRef] [PubMed]
  27. Dias, A.S.; Lidon, F.C. Evaluation of Grain Filling Rate and Duration in Bread and Durum Wheat, under Heat Stress after Anthesis. J. Agron. Crop Sci. 2009, 195, 137–147. [Google Scholar] [CrossRef]
  28. Farooq, M.; Hussain, M.; Siddique, K.H.M. Drought Stress in Wheat during Flowering and Grain-Filling Periods. Crit. Rev. Plant Sci. 2014, 33, 331–349. [Google Scholar] [CrossRef]
  29. Xie, Q.; Mayes, S.; Sparkes, D.L. Carpel Size, Grain Filling, and Morphology Determine Individual Grain Weight in Wheat. J. Exp. Bot. 2015, 66, 6715–6730. [Google Scholar] [CrossRef]
  30. Cohen, I.; Zandalinas, S.I.; Huck, C.; Fritschi, F.B.; Mittler, R. Meta-Analysis of Drought and Heat Stress Combination Impact on Crop Yield and Yield Components. Physiol. Plant. 2021, 171, 66–76. [Google Scholar] [CrossRef]
  31. Latif, S.; Wang, L.; Khan, J.; Ali, Z.; Sehgal, S.K.; Ali Babar, M.; Wang, J.; Quraishi, U.M. Deciphering the Role of Stay-Green Trait to Mitigate Terminal Heat Stress in Bread Wheat. Agronomy 2020, 10, 1001. [Google Scholar] [CrossRef]
  32. Sehgal, A.; Sita, K.; Siddique, K.H.M.; Kumar, R.; Bhogireddy, S.; Varshney, R.K.; HanumanthaRao, B.; Nair, R.M.; Prasad, P.V.V.; Nayyar, H. Drought or/and Heat-Stress Effects on Seed Filling in Food Crops: Impacts on Functional Biochemistry, Seed Yields, and Nutritional Quality. Front. Plant Sci. 2018, 9, 1705. [Google Scholar] [CrossRef] [PubMed]
  33. Brocklehurst, P.A. Factors Controlling Grain Weight in Wheat. Nature 1977, 266, 348–349. [Google Scholar] [CrossRef]
  34. Touzy, G.; Lafarge, S.; Redondo, E.; Lievin, V.; Decoopman, X.; Le Gouis, J.; Praud, S. Identification of QTLs Affecting Post-Anthesis Heat Stress Responses in European Bread Wheat. Theor. Appl. Genet. 2022, 135, 947–964. [Google Scholar] [CrossRef] [PubMed]
  35. Samarah, N.H. Effects of Drought Stress on Growth and Yield of Barley. Agron. Sustain. Dev. 2005, 25, 145–149. [Google Scholar] [CrossRef]
  36. Lizana, X.C.; Riegel, R.; Gomez, L.D.; Herrera, J.; Isla, A.; McQueen-Mason, S.J.; Calderini, D.F. Expansins Expression Is Associated with Grain Size Dynamics in Wheat (Triticum aestivum L.). J. Exp. Bot. 2010, 61, 1147–1157. [Google Scholar] [CrossRef] [PubMed]
  37. Hasan, A.K.; Herrera, J.; Lizana, C.; Calderini, D.F. Carpel Weight, Grain Length and Stabilized Grain Water Content Are Physiological Drivers of Grain Weight Determination of Wheat. Field Crops Res. 2011, 123, 241–247. [Google Scholar] [CrossRef]
  38. Zhao, J.; Sun, L.; Gao, H.; Hu, M.; Mu, L.; Cheng, X.; Wang, J.; Zhao, Y.; Li, Q.; Wang, P.; et al. Genome-Wide Association Study of Yield-Related Traits in Common Wheat (Triticum aestivum L.) under Normal and Drought Treatment Conditions. Front. Plant Sci. 2023, 13, 1098560. [Google Scholar] [CrossRef]
  39. Gegas, V.C.; Nazari, A.; Griffiths, S.; Simmonds, J.; Fish, L.; Orford, S.; Sayers, L.; Doonan, J.H.; Snape, J.W. A Genetic Framework for Grain Size and Shape Variation in Wheat. Plant Cell 2010, 22, 1046–1056. [Google Scholar] [CrossRef]
  40. Du, B.; Wang, Q.; Sun, G.; Ren, X.; Cheng, Y.; Wang, Y.; Gao, S.; Li, C.; Sun, D. Mapping Dynamic QTL Dissects the Genetic Architecture of Grain Size and Grain Filling Rate at Different Grain-Filling Stages in Barley. Sci. Rep. 2019, 9, 18823. [Google Scholar] [CrossRef]
  41. Ji, G.; Xu, Z.; Fan, X.; Zhou, Q.; Chen, L.; Yu, Q.; Liao, S.; Jiang, C.; Feng, B.; Wang, T. Identification and Validation of Major QTL for Grain Size and Weight in Bread Wheat (Triticum aestivum L.). Crop J. 2023, 11, 564–572. [Google Scholar] [CrossRef]
  42. Gaspar, T.; Franck, T.; Bisbis, B.; Kevers, C.; Jouve, L.; Hausman, J.F.; Dommes, J. Concepts in Plant Stress Physiology. Application to Plant Tissue Cultures. Plant Growth Regul. 2002, 37, 263–285. [Google Scholar] [CrossRef]
  43. Shah, S.M.; Shabbir, G.; Malik, S.I.; Raja, N.I.; Shah, Z.H.; Rauf, M.; Zahrani, Y.A.; Alghabari, F.; Alsamadany, H.; Shahzad, K.; et al. Delineation of Physiological, Agronomic and Genetic Responses of Different Wheat Genotypes under Drought Condition. Agronomy 2022, 12, 1056. [Google Scholar] [CrossRef]
  44. Maddah Hosseini, S.; Poustini, K.; Ahmadi, A. Effects of Foliar Application of BAP on Source and Sink Strength in Four Six-Rowed Barley (Hordeum vulgare L.) Cultivars. Plant Growth Regul. 2008, 54, 231–239. [Google Scholar] [CrossRef]
  45. Ren, B.; Zhu, Y.; Zhang, J.; Dong, S.; Liu, P.; Zhao, B. Effects of Spraying Exogenous Hormone 6-Benzyladenine (6-BA) after Waterlogging on Grain Yield and Growth of Summer Maize. Field Crops Res. 2016, 188, 96–104. [Google Scholar] [CrossRef]
  46. Ren, B.; Zhang, J.; Dong, S.; Liu, P.; Zhao, B. Regulations of 6-Benzyladenine (6-BA) on Leaf Ultrastructure and Photosynthetic Characteristics of Waterlogged Summer Maize. J. Plant Growth Regul. 2017, 36, 743–754. [Google Scholar] [CrossRef]
Figure 1. Monthly weather data during the two growing seasons ((a) 2020–2021; (b) 2021–2022).
Agronomy 14 00182 g001
Figure 2. Output of imaging for extracting grains and fitting the best ellipses. (a) More than 400 individual grains can be seen in this archive image. (b) graphical output of macros running.
Agronomy 14 00182 g002
Figure 3. Heatmap indicating the association among grain weight and different grain-related traits in the average over two years. The size of each circle indicates the correlation intensity between two features (Full names of abbreviations are introduced in Table 1).
Agronomy 14 00182 g003
Table 1. List of the selected empirical image-derived indices in this study.
Basic IndicesSynthesized Indices
AreaPerim. × Circ.
Minor (the minor axes of the best fitted ellipses to the grains)Area/Perim.
Major (the major axes of the best fitted ellipses to the grains)Area × Circ.
MinFeret (minimum caliper diameter)Minor/Solid.
Feret (maximum caliper diameter)MinFeret/Solid.
Area × Solid.
A1 (Area × Perim. × Circ. × Solidity × MinFeret)
A2 (Area × Perim. × Circ. × Solidity × Minor)
Circularity (a value between 0 and 1 for an infinitely elongated shape in a perfect circle), Solidity (the ratio of area to the convex hull area), Perimeter (the length of the outside boundary of the selection); for more information about indices, see Haghshenas et al. [23].
Table 2. Analysis of variance (ANOVA) for measured characteristics in tested wheat cultivars under TWS and cytokinin application in the first growing season (2020–2021).
SourceDFTGWMajorFeretAreaMinorMinFeretArea/PerimArea × Circ.Minor/Solid.MinFeret/Solid.Area × SolidPerim. × Circ.A1A2
rep20.3140.0430.04820.4040.0020.0020.00020.1250.0020.0020.3650.0371513.281363.63
Irrigation171.844 ***0.1710.26127.814 ***0.8217 ***0.845 ***0.052 ***26.179 ***0.798 ***0.813 ***27.830 ***8.396 ***183,973.5 ***173,902.7 ***
Irrigation × rep23.8620.0270.0231.2040.0220.0220.0020.8640.0230.0221.1450.2666791.906434.85
Cytokinin11.54770.00010.0010.3440.0180.0190.0010.4770.0180.0190.3390.1702453.312266.16
Irrigation × Cytokinin10.7870.00070.00030.1240.0030.0020.00010.1070.0020.0020.1320.031940.96890.60
Cytokin × rep (Irrigat)40.8210.0100.0060.3890.0090.010.00060.3130.0090.010.3760.1071920.381791.81
Cultivar26.965 *0.493 ***0.5823 ***5.69 ***0.046 *0.071 *0.004 *2.166 *0.047 *0.076 **5.148 ***0.659 *24,257.2 *20,392.73 ***
Irrigation × Cultivar24.9210.00150.00020.5350.0230.0220.00150.7470.0210.0200.5820.2364692.94603.90
Cytokinin × Cultivar20.0310.0120.0140.0760.00020.00020.000060.0260.00030.00020.0670.009159.72166.68
Irriga × Cytoki × Cultiv21.3360.0050.0120.4900.0150.0170.00080.4660.0160.0170.4710.1433615.43367.9
Error151.6200.0180.0160.6180.0120.0120.00090.4510.0120.0120.5970.1463189.33020.1
CV% 11.6112.2242.0325.8403.8913.7683.4976.9003.6683.5586.0443.48912.84012.975
* Significant at 0.05; ** significant at 0.001; *** significant at 0.0001. Full names of abbreviations are introduced in Table 1.
Table 3. Analysis of variance (ANOVA) for measured characteristics in tested wheat cultivars under TWS and cytokinin application in the second growing season (2021–2022).
SourceDFTGWMajorFeretAreaMinorMinFeretArea/Perim.Area × Circ.Minor/Solid.MinFeret/Solid.Area × SolidPerim. × Circ.A1A2
rep20.0930.0080.0090.1120.0060.0060.00030.1560.0060.0060.1120.0391702.341594.910
Irrigation143.670 ***0.0540.07312.360 ***0.393 ***0.395 ***0.024 ***12.745 ***0.387 ***0.387 ***12.296 ***3.848 ***96,923.93 ***92,400.13 ***
Irrigation × rep20.4870.0030.0070.0490.0040.0030.00020.1070.0030.0030.0560.034596.44602.82
Cytokinin12.8050.0150.0210.4020.0040.0060.00040.2340.0040.0050.4020.0662493.642165.76
Irrigation × Cytokinin10.8990.0170.0250.2600.0020.0020.00020.1020.0020.0030.2430.0301146.26988.48
Cytokin × rep (Irrigat)41.8430.0270.0290.6560.0100.0110.00080.4380.0100.0100.6290.1273917.283617.09
Cultivar213.276 ***0.851 ***0.680 ***8.955 ***0.036 *0.037 *0.007 ***3.51 8***0.036 *0.038 *8.294 ***1.101 ***29,504.88 ***27,244.93 ***
Irrigation × Cultivar20.0370.0070.0060.2050.0030.0030.00030.1650.0030.0020.2100.0541116.591101.68
Cytokinin × Cultivar21.0150.0080.0090.3330.0060.0070.00050.2450.0060.0070.3220.0781932.011760.01
Irriga × Cytoki × Cultiv20.0040.0110.0120.1440.00080.00080.00010.0550.00090.0010.1260.017573.25535.41
Error161.2360.0150.0170.4890.0090.0090.00060.3510.0090.0090.4770.1092839.392673.09
CV% 7.9212.0252.1144.7403.1233.0332.8145.3362.9492.8604.8962.8149.5979.642
* Significant at 0.05; *** significant at 0.0001. Full names of abbreviations are introduced in Table 1.
Table 4. Mean values for thousand grain weight and its related traits under well-watered and terminal water stress conditions in first and second growing seasons.
First Growing SeasonSecond Growing Season
Well-WateredTerminal Water StressRelative Change %Well-WateredTerminal Water StressRelative Change %
TGW (g)31.127 a23.462 b−24.6237.854 a32.340 b−14.55
Major (mm)6.115 a5.955 a−2.626.172 a6.094 a−1.26
Feret (mm)6.310 a6.115 a−3.086.298 a6.207 a−1.43
Area (mm2)14.396 a12.481 b−13.3015.335 a14.164 b−7.64
Minor (mm)2.974 a2.649 b−10.913.139 a2.930 b−6.65
MinFeret (mm)3.088 a2.757 b−10.703.250 a3.041 b−6.44
Area/Perim (mm)0.913 a0.831 b−9.010.959 a0.907 b−5.42
Area × Circ. (mm)10.621 a8.783 b−17.3011.705 a10.514 b−10.17
Minor/Solid. (mm)3.124 a2.807 b−10.263.278 a3.071 b−6.32
MinFeret/Solid. (mm)3.243 a2.918 b−10.013.394 a3.187 b−6.11
Area × Solid (mm)13.708 a11.797 b−13.9414.690 a13.521 b−7.96
Perim. × Circ. (mm)11.478 a10.436 b−9.0712.057 a11.403 b−5.42
A1 (mm)514.78 a360.41 b−29.99607.133 a503.357 b−17.09
A2 (mm)496.32 a346.44 b−30.20586.868 a485.543 b−17.27
Tukey test: different letters in each row show the significant differences between irrigation levels. Negative numbers indicate values lower than the control (i.e., well-watered). Full names of abbreviations are introduced in Table 1.
Table 5. Mean values for thousand grain weight and its related traits among cultivars in first and second growing seasons.
First Growing SeasonSecond Growing Season
SirvanPishgamTorabiSirvanPishgamTorabi
TGW (g)25.700 b27.110 ab29.600 a37.500 a32.275 b35.475 a
Major (mm)5.940 b5.901 b6.292 a6.291 a5.825 b6.282 a
Feret (mm)6.066 b6.110 b6.494 a6.346 a5.982 b6.429 a
Area (mm2)12.912 b13.249 b14.306 a15.371 a13.763 b15.114 a
Minor (mm)2.748 b2.834 ab2.871 a3.088 a2.979 b3.038 ab
MinFeret (mm)2.845 b2.938 ab3.004 a3.187 a3.083 b3.167 ab
Area/Perim (mm)0.855 b0.872 ab0.893 a0.954 a0.907 b0.938 a
Area × Circ. (mm)9.305 b9.728 ab10.191 a11.585 a10.520 b11.223 a
Minor/Solid. (mm)2.900 b2.982 ab3.028 a3.226 a3.117 b3.181 ab
MinFeret/Solid. (mm)3.004 b3.092 ab3.168 a3.330 a3.226 b3.316 ab
Area × Solid (mm)12.597 b12.597 b13.573 a14.716 a13.160 b14.443 a
Perim. × Circ. (mm)10.744 b10.963 ab11.231 a11.996 a11.400 b11.793 a
A1 (mm)396.140 b436.980 b490.490 a592.800 a499.040 b573.890 a
A2 (mm)382.820 b422.170 ab469.390 a574.720 a482.920 b550.970 a
Tukey test: different letters in each row show the significant differences among cultivars. Full names of abbreviations are introduced in Table 1.
Table 6. The correlation coefficients (r) of thousand grain weight (TGW) and image-derived indices.
IndicesOverall1st Year2nd YearWW (2 Years)TWS (2 Years)1st Year WW1st Year TWS2nd Year WW2nd Year TWS
Major0.6540.7100.7100.6260.6520.6710.7340.8460.769
Feret0.5900.7040.7040.5310.5400.7080.6160.8300.714
Area0.9550.9480.9480.9170.9510.9530.9230.9270.943
Minor0.9650.9430.9430.9640.9690.9480.9250.9460.901
MinFeret0.9640.9440.9440.9620.9660.9650.9090.9270.908
Area/Perim0.9810.9730.9730.9790.9820.9850.9540.9610.959
Area × Circ.0.9830.9730.9730.9800.9820.9880.9540.9590.956
Minor/Solid.0.9620.9430.9430.9610.9670.9510.9240.9440.902
MinFeret/Solid0.9590.9420.9420.9570.9610.9600.9040.9220.904
Area × Solid0.9620.9530.9530.9310.9590.9630.9290.9310.949
Perim. × Circ.0.9810.9730.9730.9790.9820.9850.9550.9610.959
A10.9780.9660.9660.9650.9760.9840.9330.9390.947
A20.9790.9690.9690.9690.9780.9870.9400.9450.948
All the correlations were very significant (p < 0.001). WW and TWS: well-watered and terminal water stress treatments, respectively. Full names of abbreviations are introduced in Table 1.
Disclaimer/Publisher’s Note: The statements, opinions and data contained in all publications are solely those of the individual author(s) and contributor(s) and not of MDPI and/or the editor(s). MDPI and/or the editor(s) disclaim responsibility for any injury to people or property resulting from any ideas, methods, instructions or products referred to in the content.

