Article

Response of Matching Degree between Precipitation and Maize Water Requirement to Climate Change in China

1
School of Civil and Hydraulic Engineering, Ningxia University, Yinchuan 750021, China
2
Key Laboratory of the Internet of Water and Digital Water Governance of the Yellow River, Ningxia University, Yinchuan 750021, China
3
State Key Laboratory of Hydroscience and Engineering, Tsinghua University, Beijing 100084, China
*
Author to whom correspondence should be addressed.
Agronomy 2024, 14(1), 181; https://doi.org/10.3390/agronomy14010181
Submission received: 13 November 2023 / Revised: 9 January 2024 / Accepted: 10 January 2024 / Published: 15 January 2024
(This article belongs to the Section Agroecology Innovation: Achieving System Resilience)

Abstract

:
The synchronicity of rain and heat in the summer of China’s monsoon region provides sufficient water and heat resources for maize growth. However, the intra-annual distribution of precipitation and the probability of extreme precipitation have been inevitably altered by the ongoing climate change, thus affecting the matching degree between precipitation and crop water requirements (MDPCWR). Evaluating the extent to which the MDPCWR will change in the future is of great importance for food security and the sustainable management of water resources. In this study, considering that different growth stages of crops have different sensitivities to water stress, the AquaCrop model was used to calculate the MDPCWR more accurately. In addition, a cumulative distribution function-transform (CDF-t) method was used to remove the bias of 11 global climate models (GCMs) under two typical emission scenarios (SSP2-4.5 and SSP5-8.5) from phase six of the Coupled Model Intercomparison Project (CMIP6). A comprehensive investigation was conducted on how maize growth, water consumption, and the MDPCWR will respond to future climate change with CO2 concentration enrichment in the Huang–Huai–Hai (3H) region in China by driving a well-tested AquaCrop model with the bias-corrected GCMs outputs. The results indicate the following: (1) The CDF-t method can effectively remove seasonal bias, and it also performs well in eliminating the bias of extreme climate events. (2) Under the SSP2-4.5 scenario, the average maximum temperature will increase by 1.31 °C and 2.44 °C in 2021–2050 and 2051–2080, respectively. The average annual precipitation will increase up to 96.8 mm/year, but it will mainly occur in the form of heavy rain. (3) The increased maize evapotranspiration rate does not compensate for the decreased crop water requirement (up to −32 mm/year), due to a shorter growth cycle. (4) The farmland cultivation layer is not able to hold a significant amount of precipitation, due to the increased frequency of heavy rains, resulting in increased irrigation water requirements for maize over the next two periods, with the maximum value of 12 mm/year. (5) Under different scenarios, the projected future MDPCWR will decrease by 9.3–11.6% due to changes in precipitation patterns and crop water requirements, indicating that it will be more difficult for precipitation to meet the water demand of maize growing in the 3H region. The results can provide comprehensive information to understand the impact of climate change on the agricultural water balance and improve the regional strategy for water resource utilization in the 3H region.

1. Introduction

Affected by the western Pacific monsoon, the major crop production areas of China are characterized by high temperature, humidity, and rainy summers [1,2]. This synchronous phenomenon of rainfall and heat provides an appropriate environment for growing crops, which is essential to China’s food security [3]. However, the ongoing greenhouse gas emissions have significantly modified the original monsoon system [4]. According to the IPCC’s Sixth Assessment Report, the global change in the climate system has been unprecedented in centuries or even thousands of years [5]. More importantly, the Asian monsoon area is one of the regions where climate change is the greatest [6]. In this context, precipitation, the principal source of water to meet crop water requirements, has undergone major changes in the intra-annual distribution and the frequency of rainfall storms [7,8]. Surface runoff and soil deep percolation are more likely to occur when there is more precipitation occurring in the form of storms, causing a substantial amount of rainfall to be unusable for crop growth [9]. At the same time, a delayed or advanced rainy season may cause a mismatch between rainfall and the main stages of crop growth. The increased temperature has also changed the rate of field transpiration and evaporation, affecting the process of water demand for crops [10,11]. Along with the changes in precipitation patterns and evapotranspiration rates, regional food and water security will inevitably be affected. It is thus of great significance to study whether the matching degree of precipitation and crop water requirements (MDPCWR) will change in the next several decades.
The MDPCWR refers to the extent to which precipitation can meet the water demand of crops during their growing period [12]. Extensive studies have focused their attention on the impacts of climate change on crop yield or water consumption [9,10,13,14,15,16,17]. However, most of them have neglected the influence of changes in precipitation patterns on the farmland water cycle. In recent years, with the frequent occurrence of extreme precipitation, drought, and flood events, the question of whether the MDPCRW has been modified has received a lot of attention [12,18,19]. The formula recommended by the United States Department of Agriculture was employed to estimate effective precipitation, which refers to the portion of precipitation that remains in the soil cultivation layer and can be utilized by crops [20]. Meanwhile, the crop water requirement was calculated by the FAO Penman–Monteith equation with a crop coefficient [21,22]. The ratio of effective precipitation to crop water demand during the crop growing period is MDPCWR [19]. Considering that precipitation does not occur even during the crop growth period, excessive precipitation in a single growth stage does not alleviate a water deficit in other stages. Some studies thus divide the crop growth process into several sub-stages according to crop growth characteristics, and then calculate the MDPCWR in each stage. The weighted average of each stage is the matching degree of the whole growth cycle [12,23].
Despite this, there are two shortcomings in previous studies. First, the sensitivity of crops to water stress is inconsistent in different growth stages. Precipitation occurring in the heading and jointing stages contributes much more to crop yield than that occurring in the milking stage [24,25]. Second, due to the spatial heterogeneity of soil and differences in precipitation characteristics [26,27], it is difficult to accurately estimate the effective precipitation of farmland in different regions by using empirical formulas. Ecophysiological- and hydrological-process-based crop models, such as DASST, SWAP, ORYZA v3, APSIM, and AquaCrop, have been widely demonstrated to be highly accurate in simulating the farmland water cycle and crop development process [28,29,30,31,32,33]. Thus, it is necessary to use the crop model to more accurately evaluate the change in the matching degree. Among all the models, AquaCrop is a water productivity driving model developed by the FAO and has the advantages of high precision and fewer parameters [32]. It has been broadly used in simulating the response of crop growth and water consumption to different water conditions and climate conditions [34,35,36,37]
The progress in global climate models (GCMs) at different resolutions and the bias correction methods have opened pathways for numerous studies that aim to simulate the effects of future climate change [38,39,40,41]. Coupled Model Inter-comparison Project Phase 6 (CMIP6) is a global climate model comparison program jointly supported by the World Meteorological Organization (WMO) and the United Nations Environment Program (UNEP) [42]. CMIP6 brings together GCMs from various climate centers around the world, aiming to simulate global climate change over the next few decades until the end of this century, including indicators such as temperature, precipitation, and sea level rise [43,44]. Compared to those in the previous generation, GCMs in CMIP6 have improved the ability to simulate the current regional temperature and precipitation, among which the precipitation index has improved significantly [45,46]. Driving crop models with future climate data from GCMs is the most prevalent method to evaluate the response of crop growth and water utilization. Unfortunately, the future projection of a single GCM is always subject to large uncertainties. Merging multiple GCMs is widely used to mitigate uncertainties in a single model and has proven to be better than any individual model [47,48,49].
As the world’s most important crop, maize plays a key role in food security [50]. This is especially the case in China, where maize accounts for 45% of the national cereal cultivation area and provides 44% of the whole cereal output [51]. Unfortunately, suffering from ongoing extreme climate change and the shortage of irrigation water, maize production will face a significant challenge in the coming decades [52,53]. Therefore, there is a growing need to evaluate and understand the impacts of climate change on maize production and whether the matching degree between the precipitation process and maize water requirement will change. Hence, in this study, taking the Huang–Huai–Hai (3H) region, one of the most important maize production regions in China, as an example, we comprehensively investigated the changes in precipitation patterns, maize yield, water requirements, as well as the MDPCWR. For this, the AquaCrop model as well as 11 climate models and two pathways (SSP2-4.5 and SSP5-8.5) from the CMIP6 were employed.

2. Materials and Methods
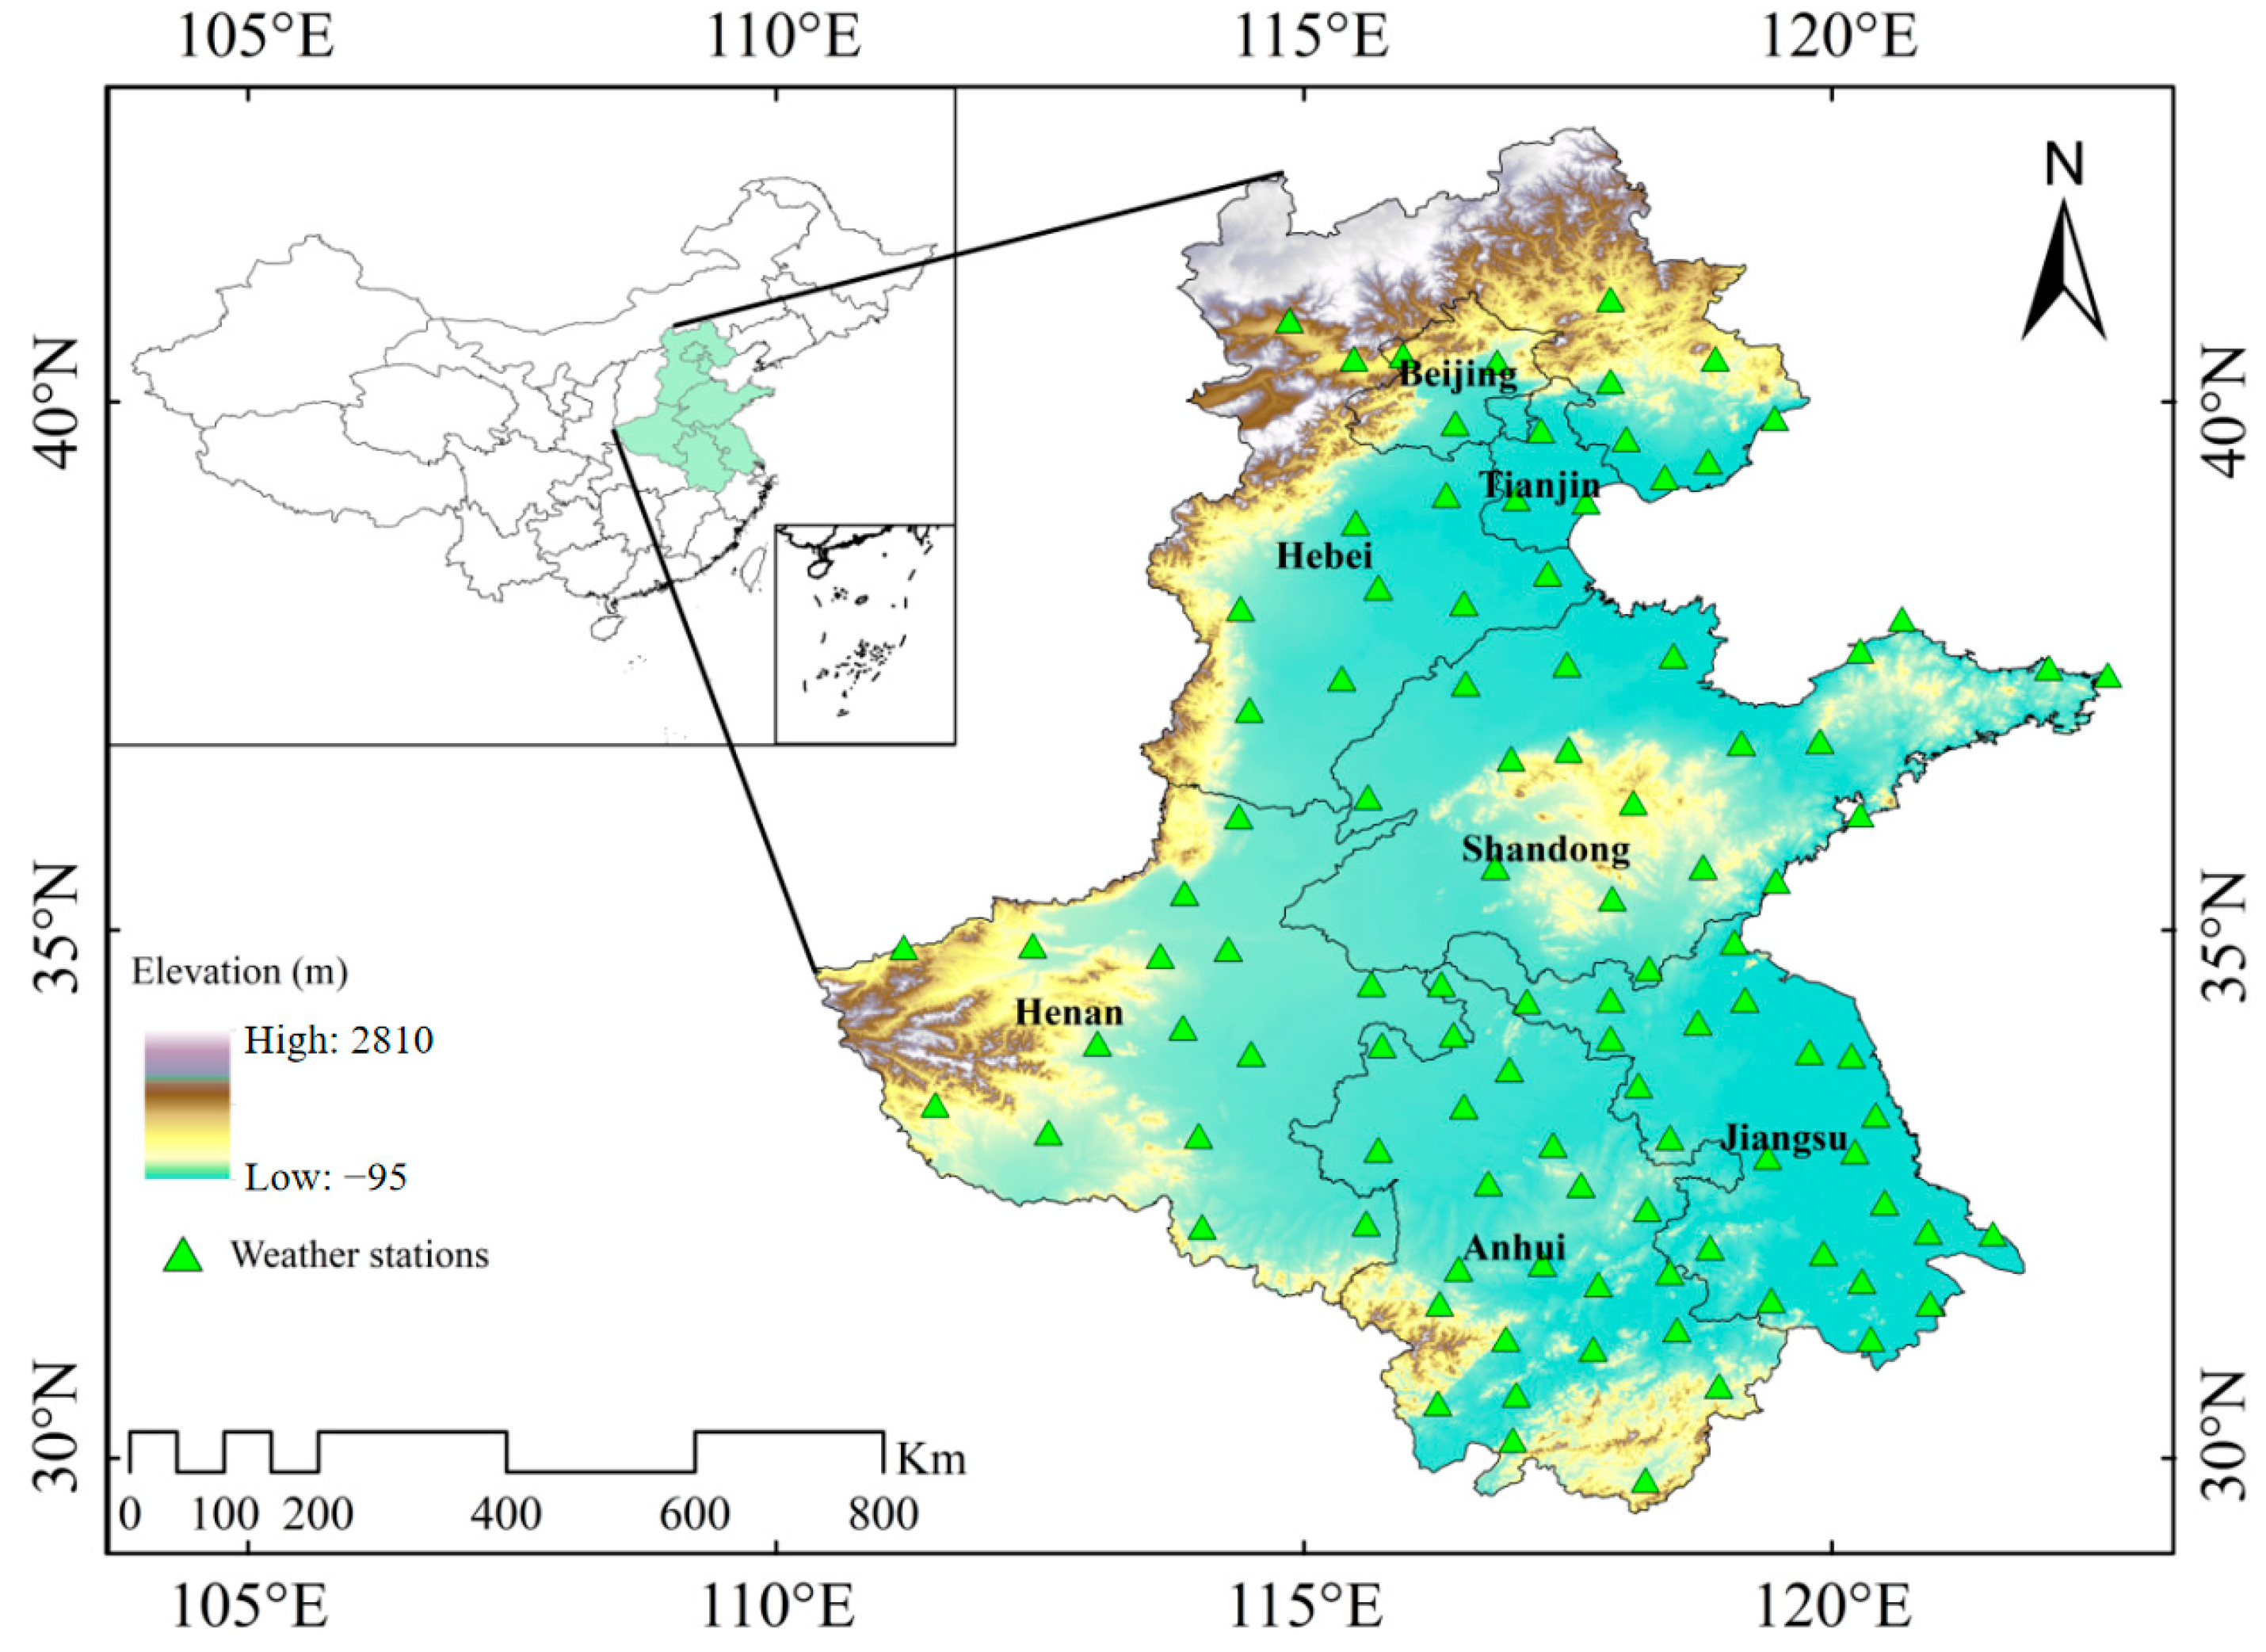
2.1. Study Area

The Huang–Huai–Hai (3H) region is located between 110.23° and 122.71° E and between 29.68° and 42.67° N (Figure 1), including five provinces (Hebei, Henan, Shandong, Anhui, and Jiangsu) and two municipalities (Beijing and Tianjin). The northern area of the plain has a temperate monsoon climate, while the southern part is dominated by a subtropical monsoon climate. Under the influence of the monsoon, the 3H region is characterized by hot and rainy summers and cold and dry winters. The annual mean temperature ranges from 14 to 20 °C. The average annual precipitation is approximately 500–1200 mm, and 50–70% of the precipitation is concentrated between June and September. The flat terrain and rainy season coincides with high temperature and adequate sunshine, making the 3H region a key crop-producing area in the world. Maize (Zea mays L.) is one of the main crops in this area, with an annual planting area of about 6 million hm2, accounting for 32% of the national total planting area, and a total output of about 22 million tons, accounting for about 34% of the national total output [54].

2.2. Historical and Future Climate Data

Historical daily climate data at 103 National Meteorological Observatory stations for the period of 1981–2020 were sourced from the meteorological information center of the China Meteorological Administration (CMA, http://cdc.cma.gov.cn/, accessed on 12 November 2023). The data were collected based on uniform observation standards and guidelines, and it has been proven to be close to 100% correct. Climate variables, including maximum temperature (Tx), minimum temperature (Tn), wind speed, precipitation sunshine duration, and relative humidity, were selected to drive the crop model. To calculate reference evapotranspiration, sunshine hours is converted to net radiation by using the method provided by Allen et al. [21].
To estimate the impacts of future climate change, 11 sets of GCMs under SSP2-4.5 and SSP5-8.5 scenarios were applied in this study, and the basic information of these GCMs is shown in Table 1. SSP2-4.5 is the updated RCP4.5 scenario, representing a combination of moderate social vulnerability and moderate radiative forcing (4.5 W/m2), where the CO2 concentration in the atmosphere will increase to 538 ppm by the end of this century. SSP5-8.5 is the updated RCP8.5 scenario, which is the only shared socioeconomic pathway that can achieve an anthropogenic radiative forcing of 8.5 W/m2 by 2100. By 2100, the atmospheric CO2 concentration of SSP5-8.5 will increase to 936 ppm [55]. These selected GCMs have been widely used in climate change studies in China and they can fully meet the requirements of the AquaCrop model (e.g., [45,46]). Aggregating these GCMs may shift the intra-annual distribution of climate variables, for example, removing the extreme characteristics of daily precipitation and temperature. We thus drove the AquaCrop model with the individual bias-corrected GCM and then merged the simulation results of the 11 GCMs.

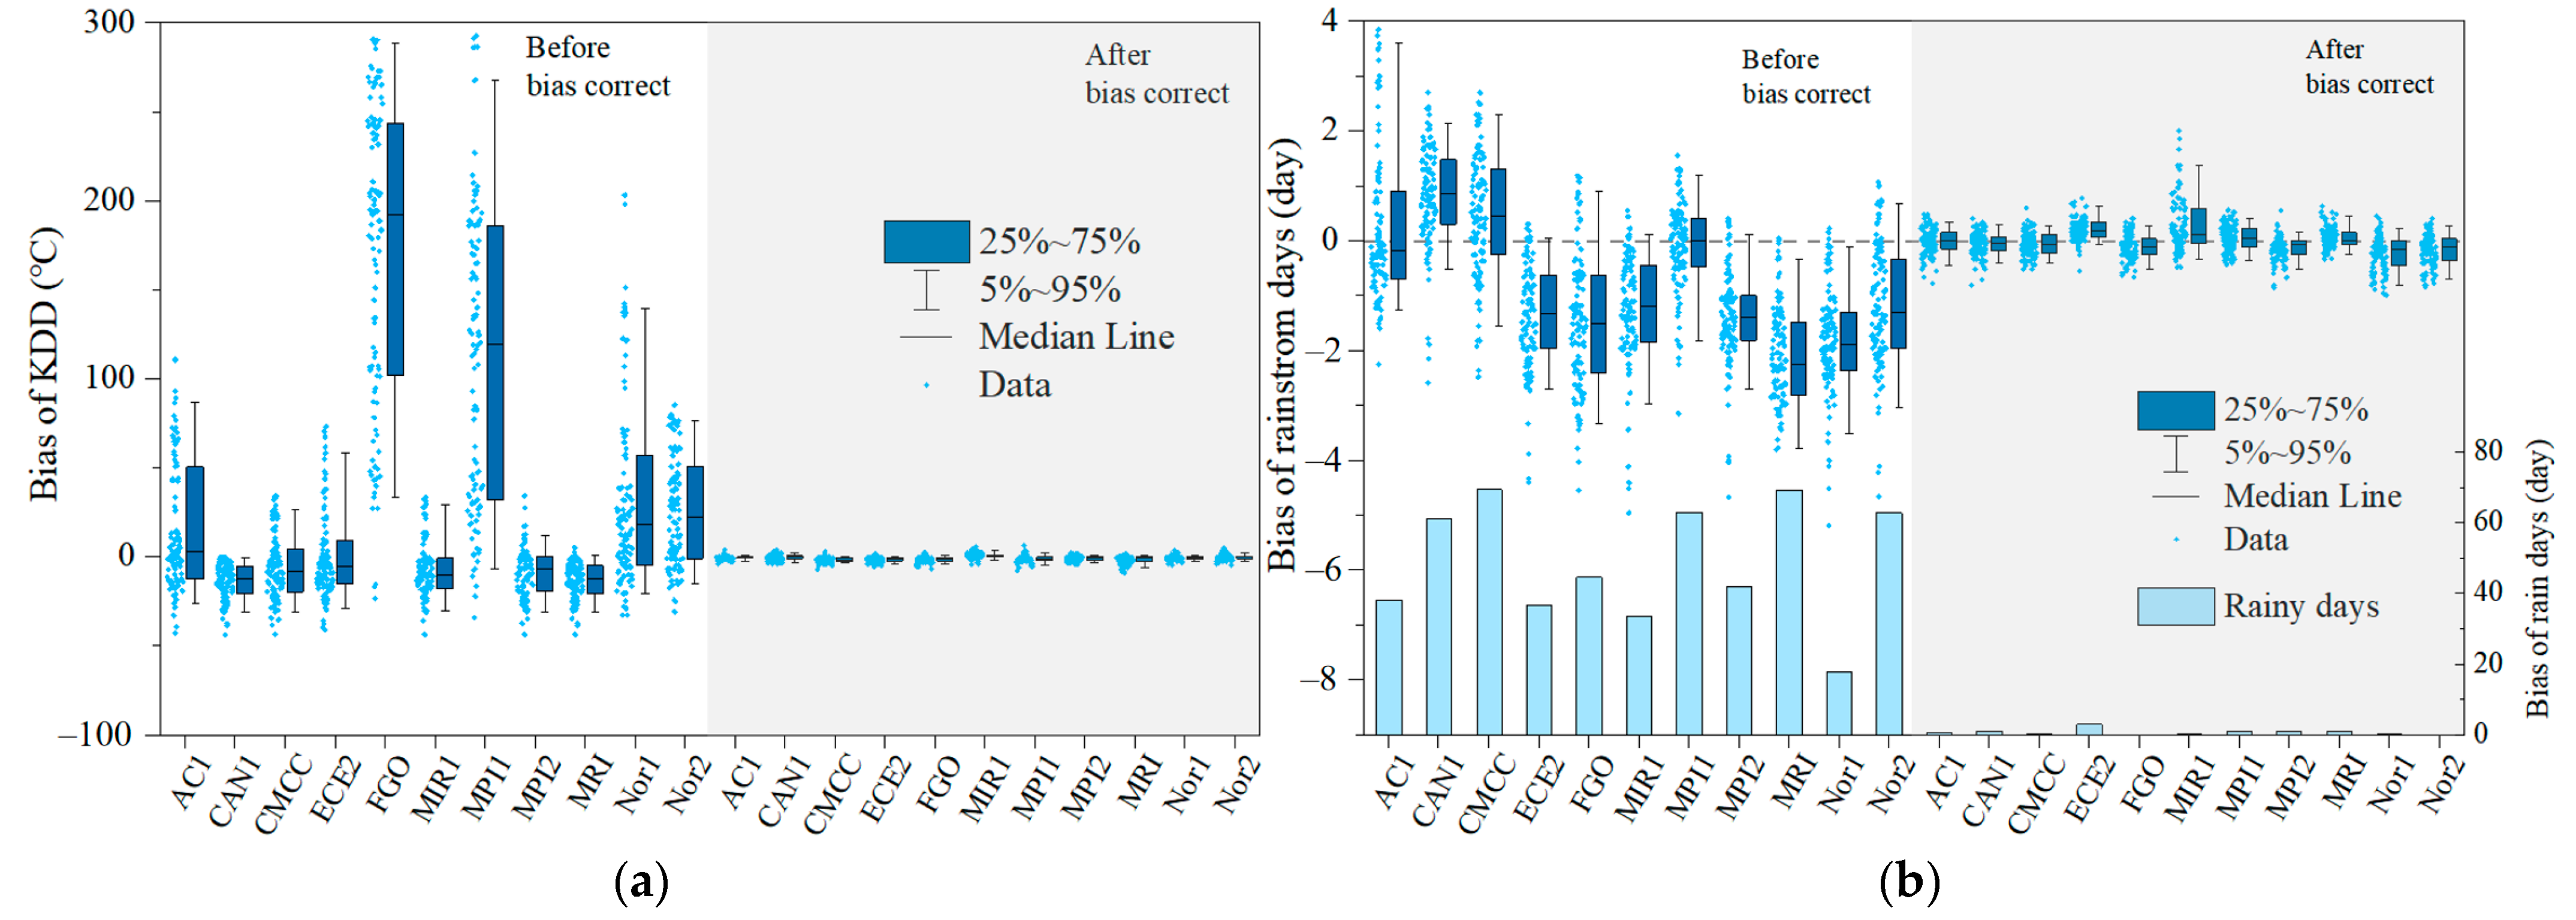
2.3. Bias Correction of Future Climate Data

Accurate simulation of the impacts of future changes requires the accuracy of daily climate projection. However, the direct output climate data of GCMs tend to have a coarser spatial resolution and systematic bias. It is thus essential to remove the bias and transform the coarse grid to a point scale of local interest to drive the model [56]. In this study, a method named cumulative distribution function-transform (CDF-t) was employed to correct the distribution of GCM outputs. This method has been widely employed in evaluating the changes in precipitation and temperature under future climate scenarios [57,58,59]. The basic principle of this method is to establish a conversion function between historical GCM output and observation data, and then use this conversion function to correct future climate data. For a given meteorological variable x, the correction method is as follows:
x ˜ m p . adjst . = F o c 1 ( F m c ( x m p ) )
where F is the probability cumulative function (CDF) of either the observed value (o) or climate model value (m) in a historic training period or current climate (c) or future period (p). However, Equation (1) assumes that the climate distribution will not change in the future period, which may not hold [60]. Thus, to consider the distribution of future climate series, Equation (1) was updated as follows:
x ˜ m p . adjst . = x m p ( F o c 1 ( F m p ( x m p ) ) F m c 1 ( F m p ( x m p ) ) )
The above equation is suitable to correct temperature, relative humidity, wind speed, and net radiation. Given that there are a lot of dry days in precipitation series, the following equation was established to correct the bias in daily precipitation:
x ˜ m p . adjst . = x m p ( F o c 1 ( F m p ( x m p ) ) / F m c 1 ( F m p ( x m p ) ) )
To evaluate the performance of this method, we divided historical data into two stages (i.e., 1981–2005 and 2006–2014). The first stage was used for training, while the other period was used to test the method.

2.4. AquaCrop Model and Input Data

The AquaCrop model was developed by the Food and Agriculture Organization (FAO) of the United Nations, which mainly focuses on the relationship between crop yield and water. Compared with other models, AquaCrop has fewer input parameters and strong applicability, and it achieved an effective balance between crop simplicity, accuracy, and robustness [32]. In recent years, the model has been widely tested based on field experiments around the world, and the results show that it can accurately simulate the growth and water utilization process of corn, wheat, cotton, rice, and other herbaceous crops [35,61,62,63]. In the AquaCrop model, the response of crop yield to water can be described as follows:
( 1 Y a Y x ) = K y ( 1 E T a E T p )
where Yx and Yo represent the actual yield and potential yield, respectively, t/hm2; Ky is the crop coefficient; ETp and ETa are the actual evapotranspiration (mm/day) and potential evapotranspiration (mm/day) of the crop, respectively. To differentiate soil evaporation from crop transpiration, the AquaCrop model uses the more easily measured canopy cover (CC) rather than the leaf area index (LAI). Then, the normalized biomass water productivity (WP*, g/m2) is used to convert crop transpiration into biomass (B):
B = K s × W P * × ( T r E T 0 )
where Ks is the stress coefficient of temperature and fertilizer on biomass; Tr is crop transpiration (mm/day); ETo is reference evapotranspiration (mm/day). Yield (Y) is then calculated based on harvest index (HI):
Y = H I B
Daily climate, soil texture, crop parameters, and management practices are essential data to drive the model. Maximum temperature (Tx, °C), minimum temperature (Tn, °C), precipitation (P, mm/day), and ETo are the main climate variables, among which Tx, Tn, and P can be obtained directly from climate stations or GCMs. ETo is calculated using the FAO Penman–Monteith method [21]:
E T o = 0.408 Δ ( R n G ) + γ 900 ( T + 273 ) U 2 ( e s e a ) Δ + γ ( 1 + 0.34 U 2 )
where Rn is net radiation (MJ/m2/d); G is soil heat flux density (MJ/m2/d); T is mean daily air temperature at 2 m height (°C); U2 is wind speed at 2 m height (m/s); es and ea are the saturated vapor pressure and actual vapor pressure, respectively (kPa); Δ is slope vapor pressure curve (kPa/°C); and γ is psychrometric constant (kPa/°C).
Soil texture data including layers, thickness, the percentage of sand, clay, and organic carbon were sourced from the Harmonized World Soil Database (HWSD, http://www.fao.org/soils-portal, accessed on 12 November 2023), which contains approximately 16,000 types of soil around the world and has a resolution of 30 arcseconds [64].
Crop parameters that characterize drought tolerance, water productivity, and harvest index were provided by Liu et al. [65] from field experiments carried out in the 3H region. However, the developing rate of maize is sensitive to the temperature. Given the differences in climate conditions in the 3H region, the actual accumulated temperature required for maize maturity makes a big difference. As a result, different planting dates and growing degree days were provided to each province rather than consistent values. The phenological data observed for maize, including seedling emergence, three leaves, flow, milky maturity, and harvest dates from 1992 to 2013, were used to calibrate and validate the accumulated temperature parameters. Consistent with meteorological data, these phenological data are also sourced from the CMA.

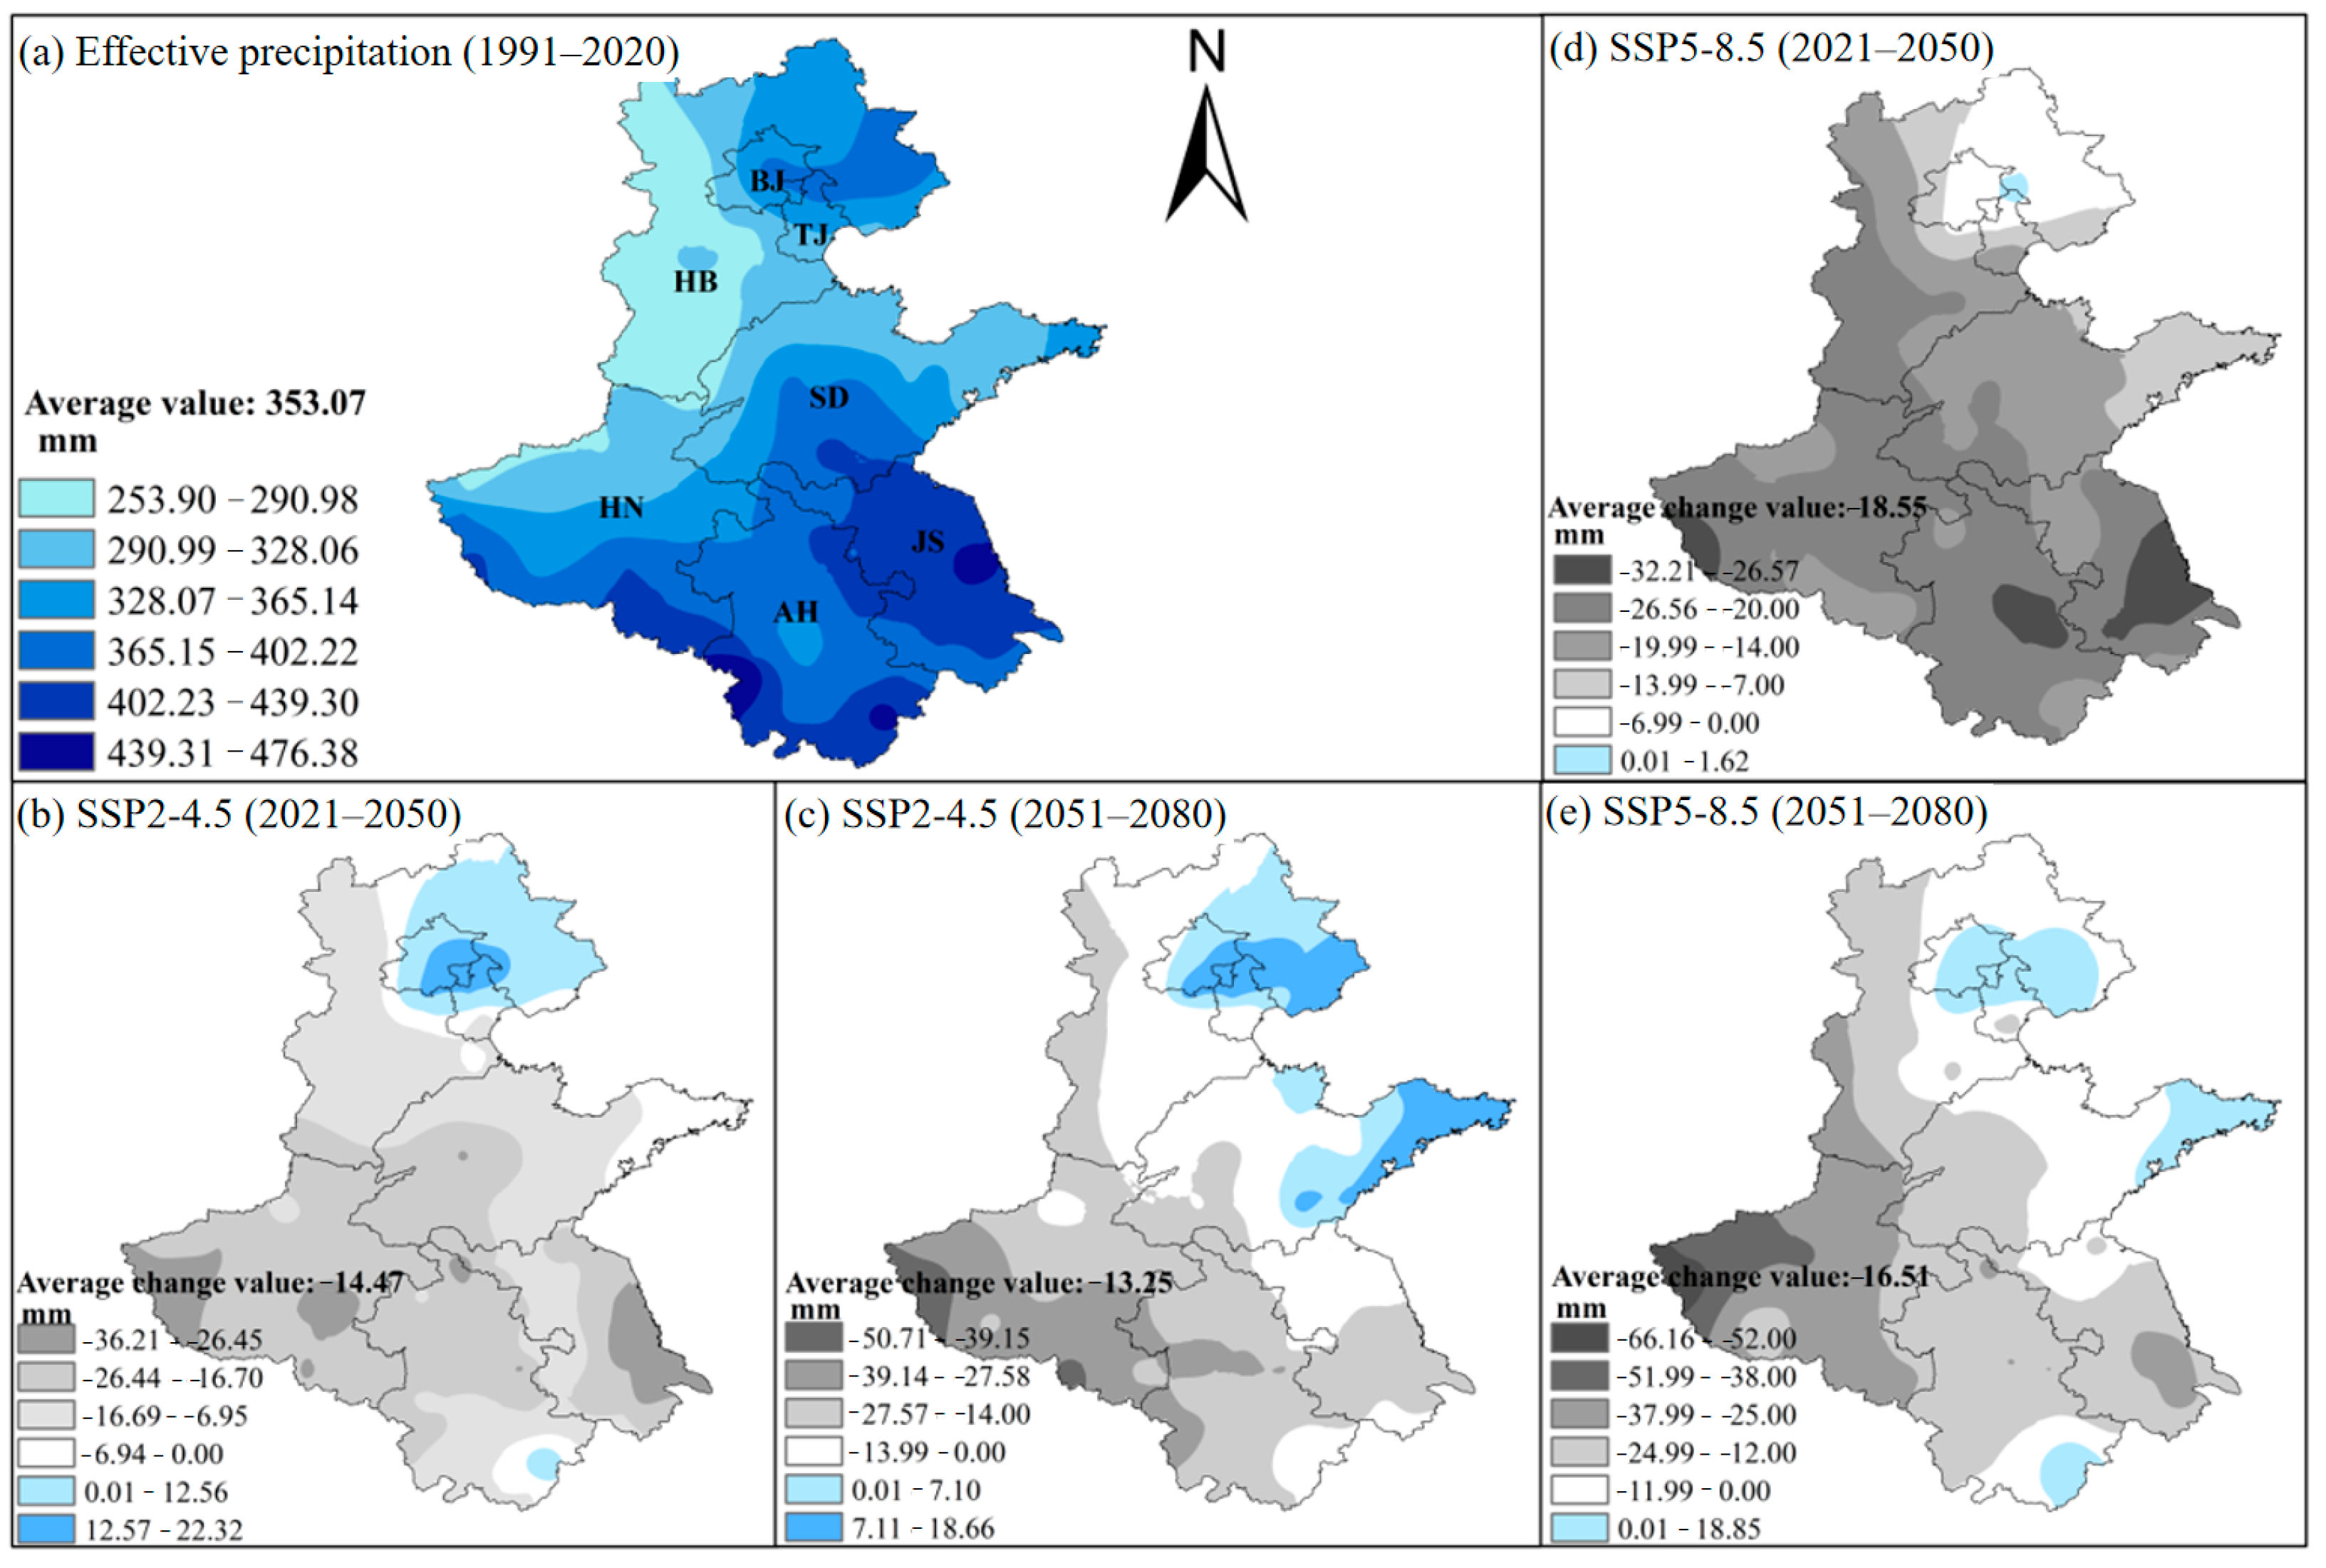
2.5. Effective Precipitation, Crop Water Requirement, and MDPCWR

To assess the extent to which precipitation can meet the water requirement of crop growth, effective precipitation (Pe) was first calculated from the simulated AquaCrop results, and the equation can be described as follows:
P e = P R o D p
where P is the total rainfall during the crop growth period; Ro is the surface runoff of farmland; Dp is the soil deep percolation. The crop water requirement (WR) is the sum of soil evaporation and crop transpiration of the simulated model simulated results under the full irrigation condition. Given that the AquaCrop model can effectively characterize the sensitivity of crops to water in different growth stages, the ratio of the yield simulated under rain-fed and fully irrigated conditions is used to more accurately represent the MDPCWR.

3. Results

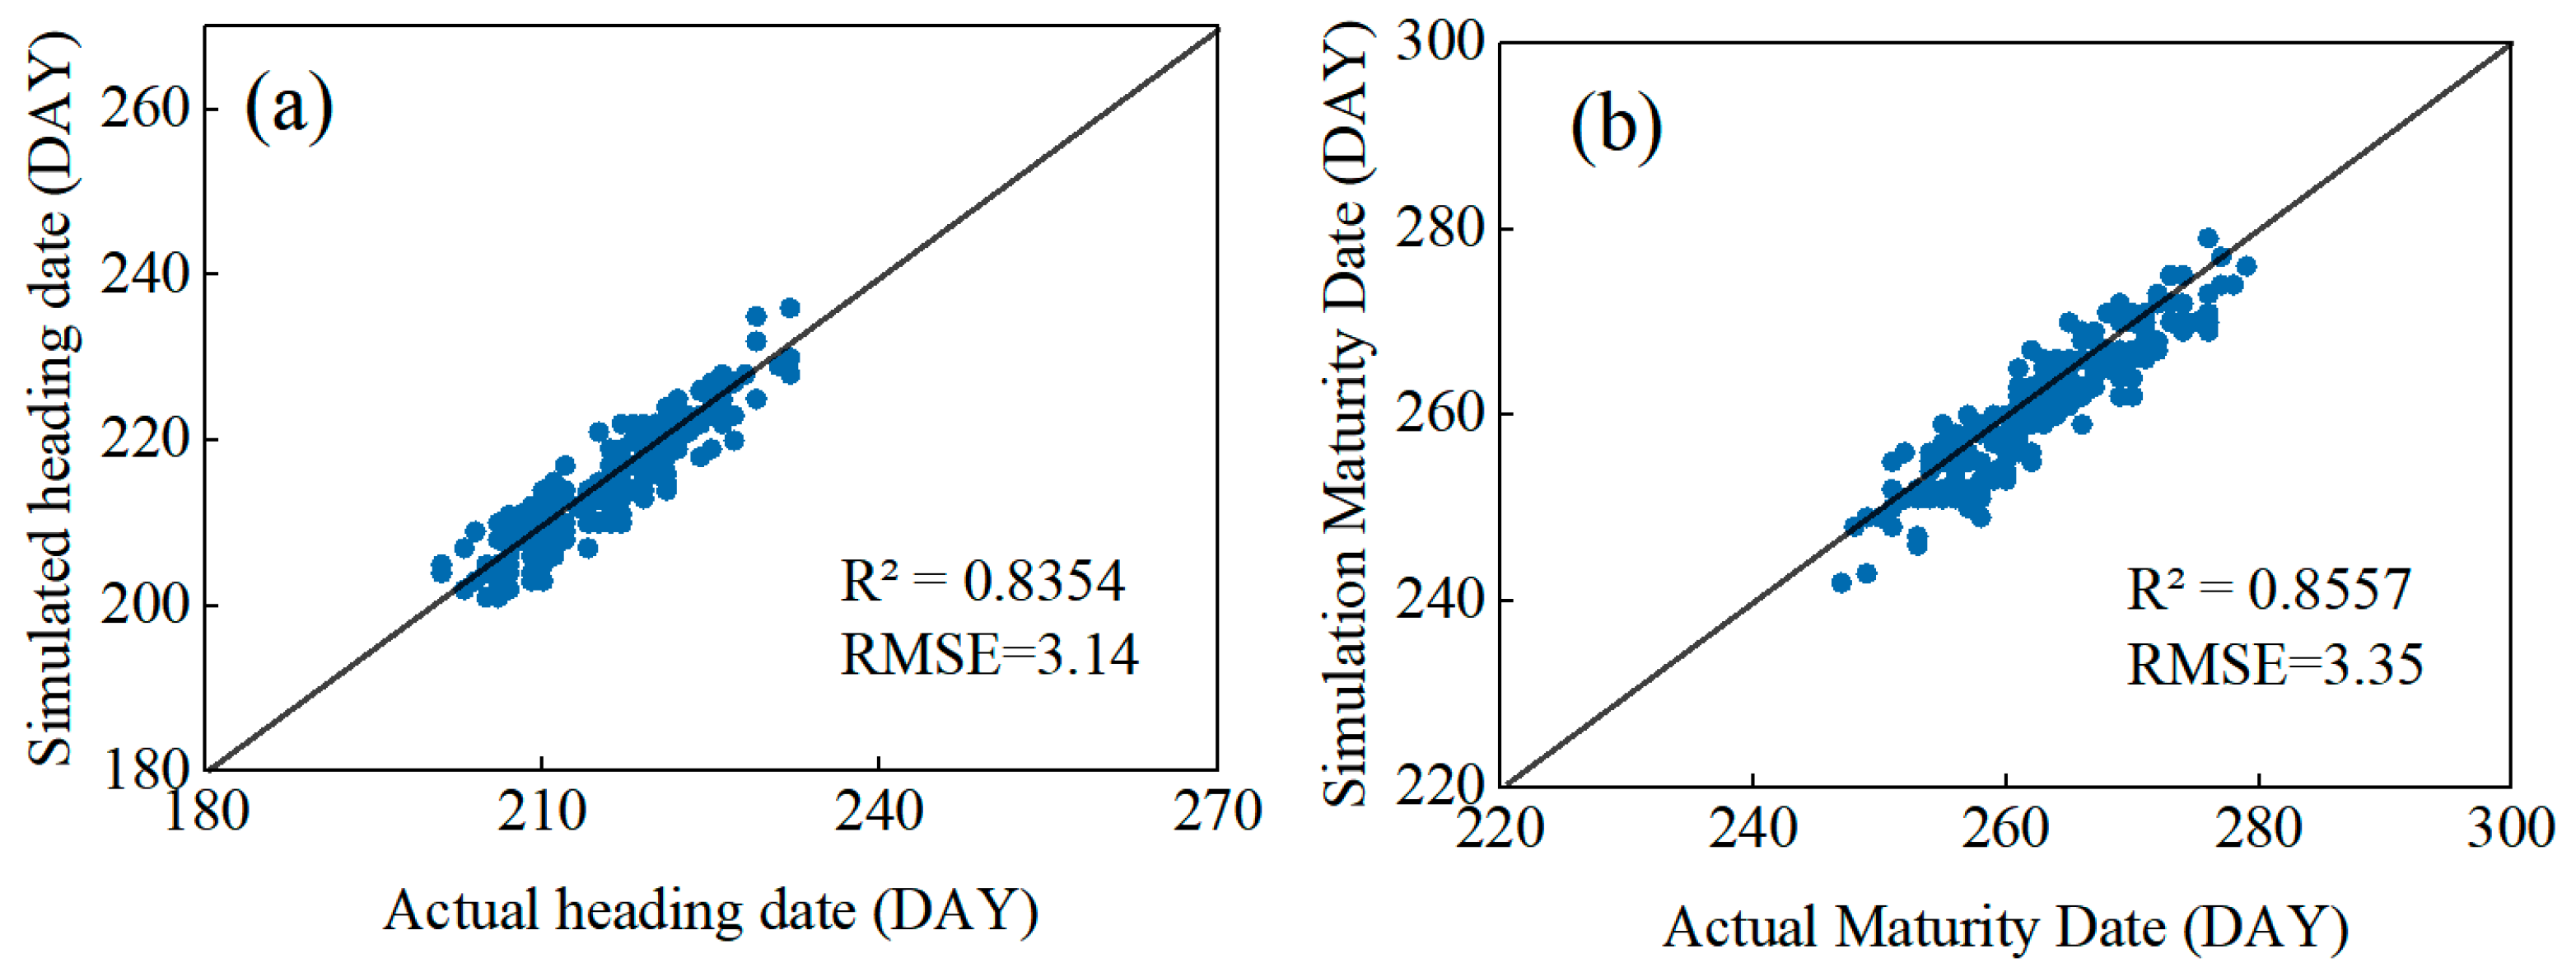
3.1. AquaCrop Performance in Simulating Maize Phenology

In view of the growth period being one of the most important factors affecting the process of crop water requirements, 60% of the observed phenological data were used to calibrate the phenology module, and the rest of the data were used for validation. The phenological parameters of each province are shown in Table 2. It is apparent that the values vary significantly between different regions. In the northern area, such as Hebei and Beijing, due to the relatively cold climate, the accumulated effective temperatures for maize maturity are less than 1600 °C·day, while in the southern area, the values can be higher than 1800 °C·day. The root-mean-square error (RMSE) between the simulated and observed growth length was used to test the performance of the calibrated model. The results show that simulated heading and maturity dates are within reasonable agreement with the measurement, with the spread being close to the 1:1 line (Figure 2). The simulated heading and maturity dates have an RMSE of 3.14 to 3.35 days, respectively, suggesting that the model can be used to simulate the maize growth cycle under different climate change conditions.

3.2. The Performance of CDF-t

Table 3 shows the RMSE of the bias-corrected monthly cumulative precipitation and monthly average Tx of different GCMs during the validation period (2006–2014). It can be found that the CDF-t method is capable of effectively removing the deviations from the monthly mean value of the GCMs. The RMSE of monthly precipitation and monthly mean Tx are 2.17–21.26 mm and 0.16–0.43 °C, respectively. The deviation in the bias correction results of different GCMs is relatively small. Among all the GCMs, CanESM5 and CMCC-CM2-SR5 performed better in the precipitation simulation, while MRI-ESM2-0 and NorESM2-LM performed better in the temperature simulation.
Figure 3 shows the deviations in killing degree days (KDDs, accumulated temperature higher than 35 °C), rainstorm days, and rainy days of different GCMs before and after the bias correction. Before correction, there is a noticeable deviation in KDD values from all GCMs. The multi-year average KDDs at some sites are even higher than the measured values by more than 200 °C·day. After adjusting, the KDD deviation values for most GCMs are within ±1.5 °C·day. Similar to KDDs, the original GCM precipitation sequences also have significant deviations. As can be seen from Figure 3b, except AC1, CAN 1, and CMCC, the frequency of heavy rain is significantly underestimated by all GCMs, with some sites even underestimating it by more than 3 days. Moreover, it is evident that the annual mean rainy days of all GCMs are higher than the actual values (up to 50 days). After correction, the deviations in annual average rainstorm days are generally within ±0.2 days, and the deviations in annual mean rainy days are within ±1 days. The above results show that the bias correction method employed in this study can effectively eliminate the systematic bias existing in GCMs.

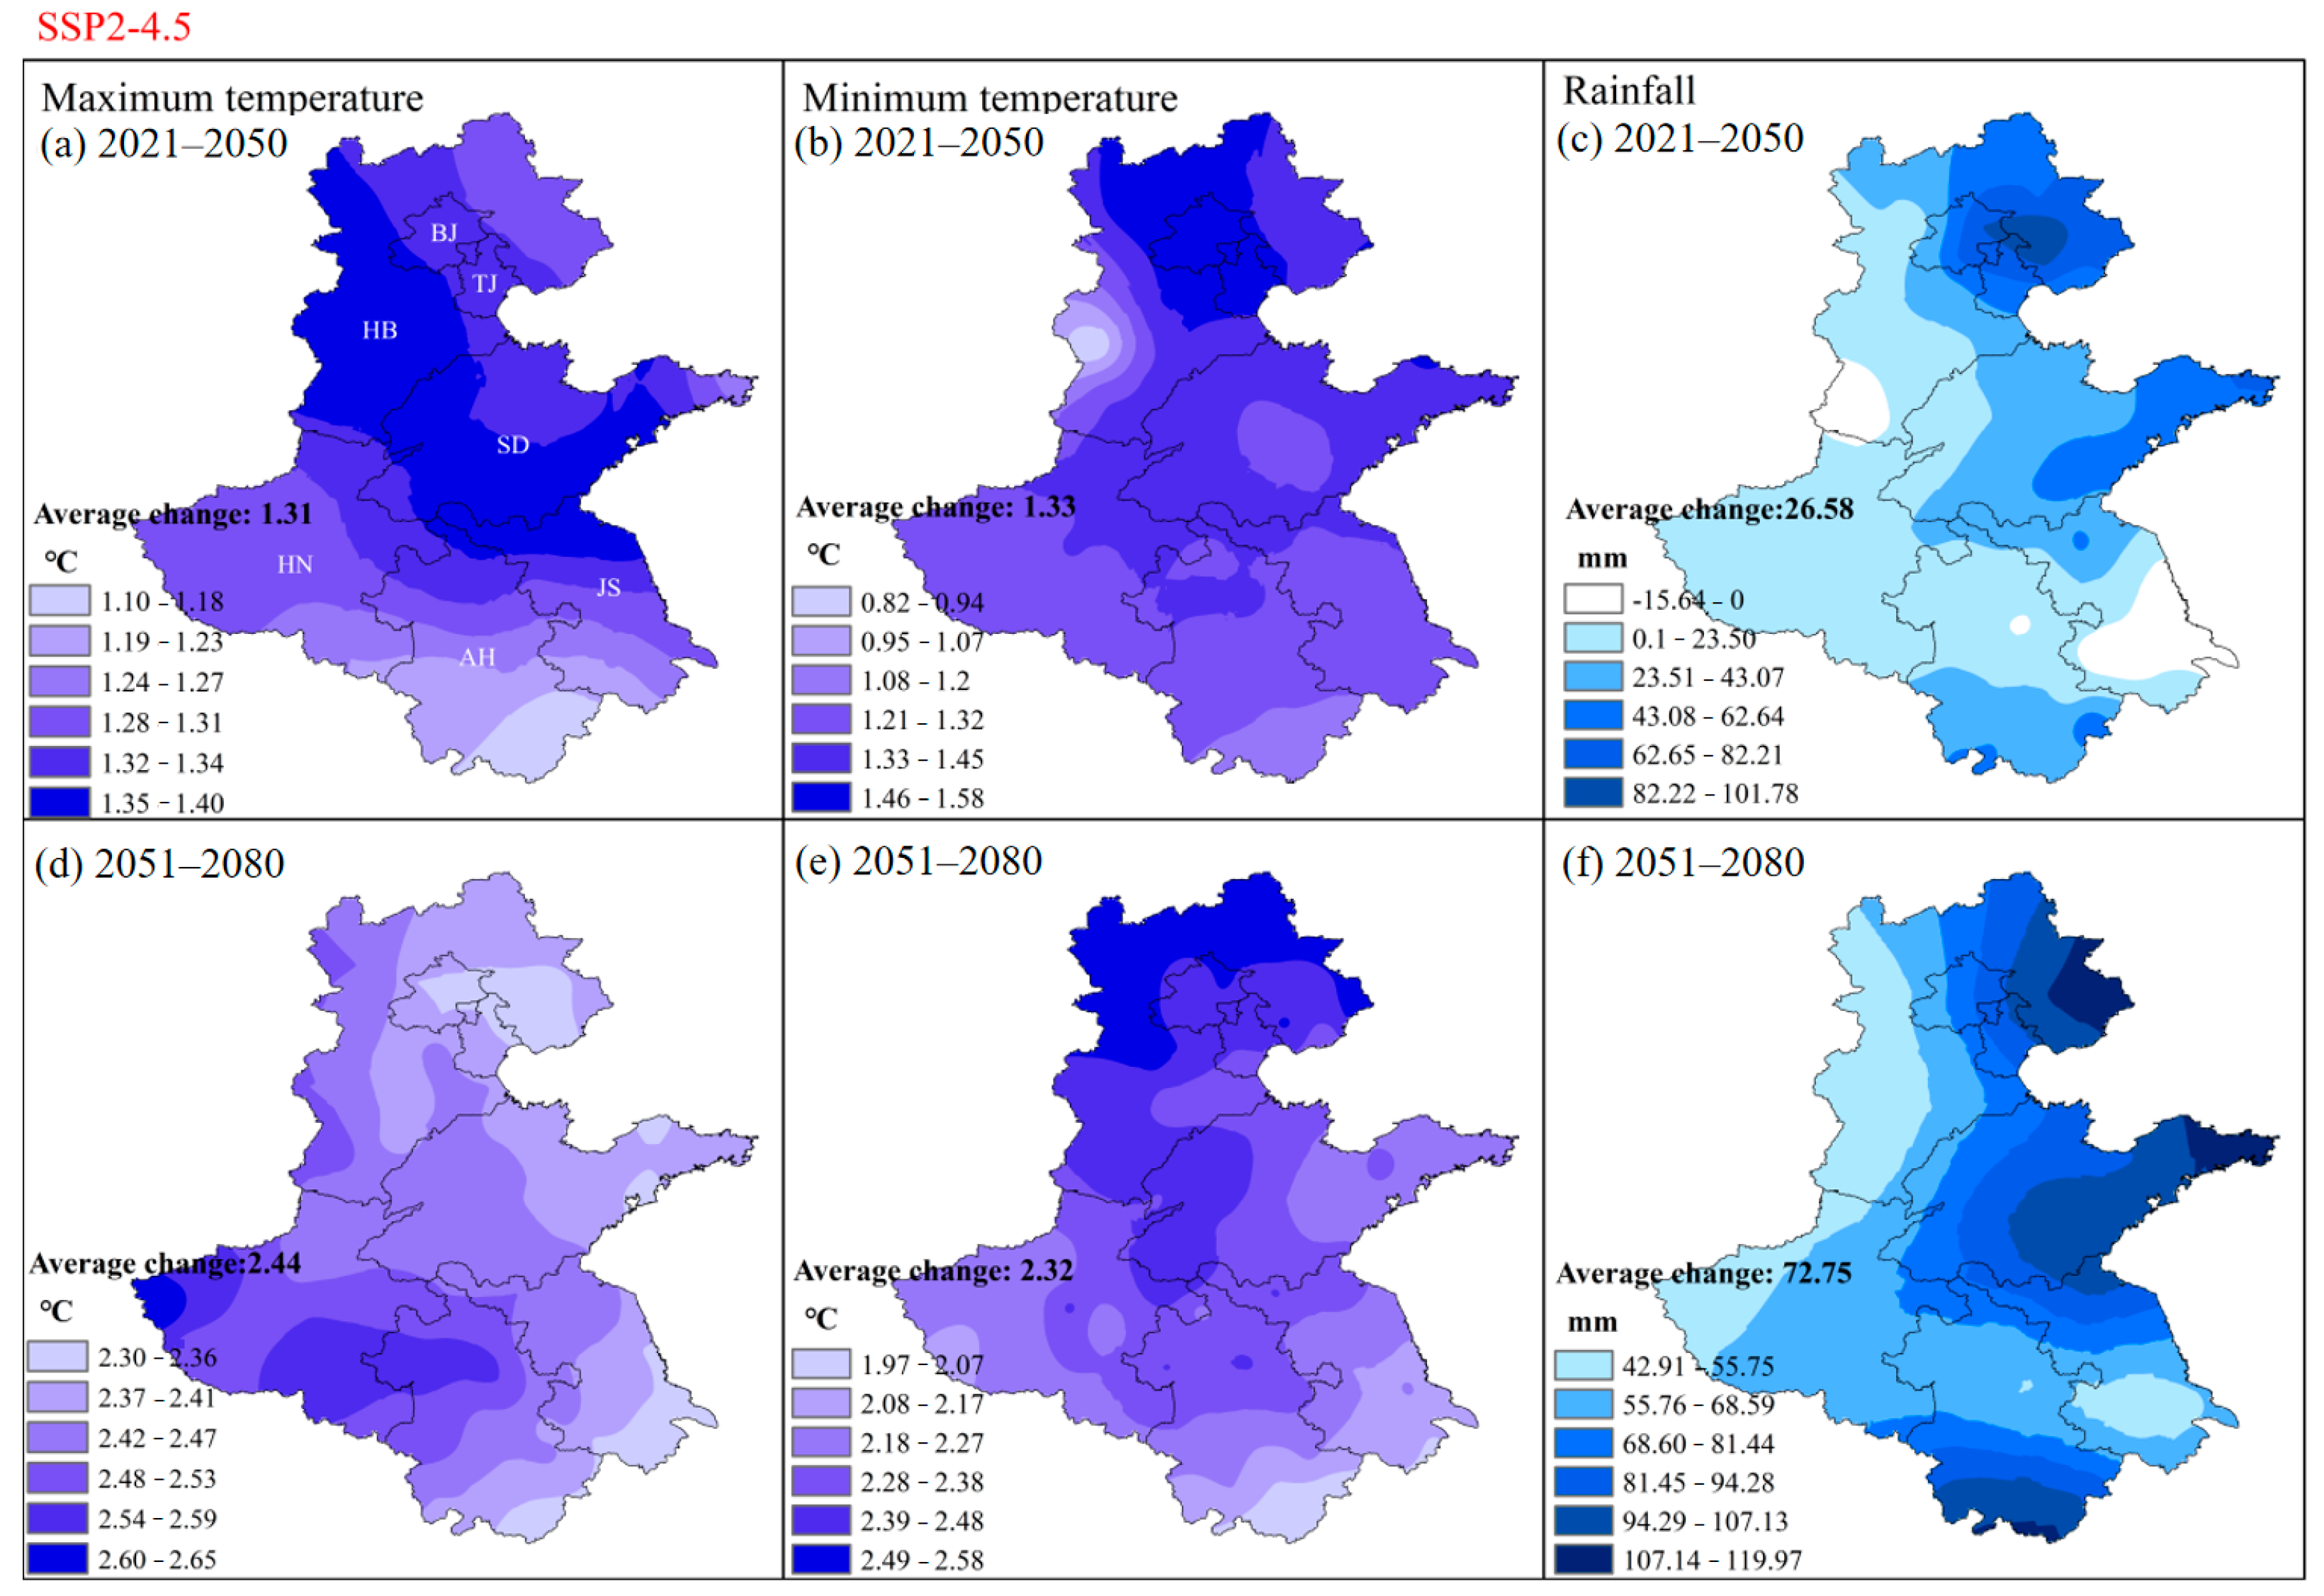
3.3. Spatial–Temporal Changes in Climate under Two Future Scenarios

By using 1991–2020 as a reference period, the changes in main climate factors in the two future stages (2021–2050 and 2051–2080) under SSP2-4.5 and SSP5-8.5 scenarios were projected. Figure 4 shows the average projection results of the 11 bias-corrected GCMs under the SSP2-4.5 scenario. It can be found that most of the 3H region will experience a significant warming process, and among the whole region, from high to low values, a clear north–south gradient can be found in their spatial patterns of the changes in both Tx and Tn. Compared to that in the baseline period (1991–2020), the average Tx will increase by 1.31 °C and 2.44 °C in 2021–2050 and 2051–2080 under the SSP2-4.5 scenario, respectively. And the increasing magnitude of Tn is almost the same as that of the Tx, with values of 1.33 °C and 2.32 °C for the two future stages, respectively. Apart from southern Jiangsu and southwest Hebei in the 2021–2050 stage, annual mean rainfall will also increase obviously in the next two stages (Figure 4c,f). However, inconsistent with the spatial variation characteristics of temperature, the changes in precipitation in 2021–2050 vary greatly in different regions, among which Beijing, Tianjin, and the northern part of Hebei have the largest increase, with the value ranging from 60 to 100 mm/year, while in other regions, the increase is usually less than 40 mm/year. For the 2051–2080 period, the precipitation continues to rise, and in most areas, it exceeds 60 mm.
The spatial patterns of changes in Tx, Tn, and P for two future stages under SSP5-8.5 are similar to that under SSP2-4.5, but the magnitudes differ considerably (Figure 5). For the 2021–2050 stage, the average Tx and Tn are expected to increase by 1.66 °C and 1.64 °C, respectively, while in the 2051–2080 stage, the values will go up to 3.63 °C and 3.56 °C, respectively. Compared with that in the SSP2-4.5 scenario, precipitation in the 2051–2080 stage under the SSP5-8.5 scenario is significantly increased, with the value being higher than 80 mm in most areas. Overall, regional mean precipitation would increase by 33.3 and 96.8 mm, respectively.
Apart from Tx, Tn, and P, the changes in wind speed, radiation, rainfall days, moderate rain days, and rainstorm days were also evaluated (Table 4). The results show that the radiation will continue to rise over the next two periods under both SSP2-4.5 and SSP5-8.5 scenarios, but not more than 11%. The change in wind speed is relatively slight, and the maximum change occurs in the period of 2051–2080 under the SSP2-4.5 scenario, with a value of 3.85%. At the same time, precipitation indicators also undergo significant changes, among which the number of rainfall days will continue to increase in the future, but the maximum increase will not exceed 11.7%. However, it should be noted that the increases in moderate and heavy rain days are most pronounced.

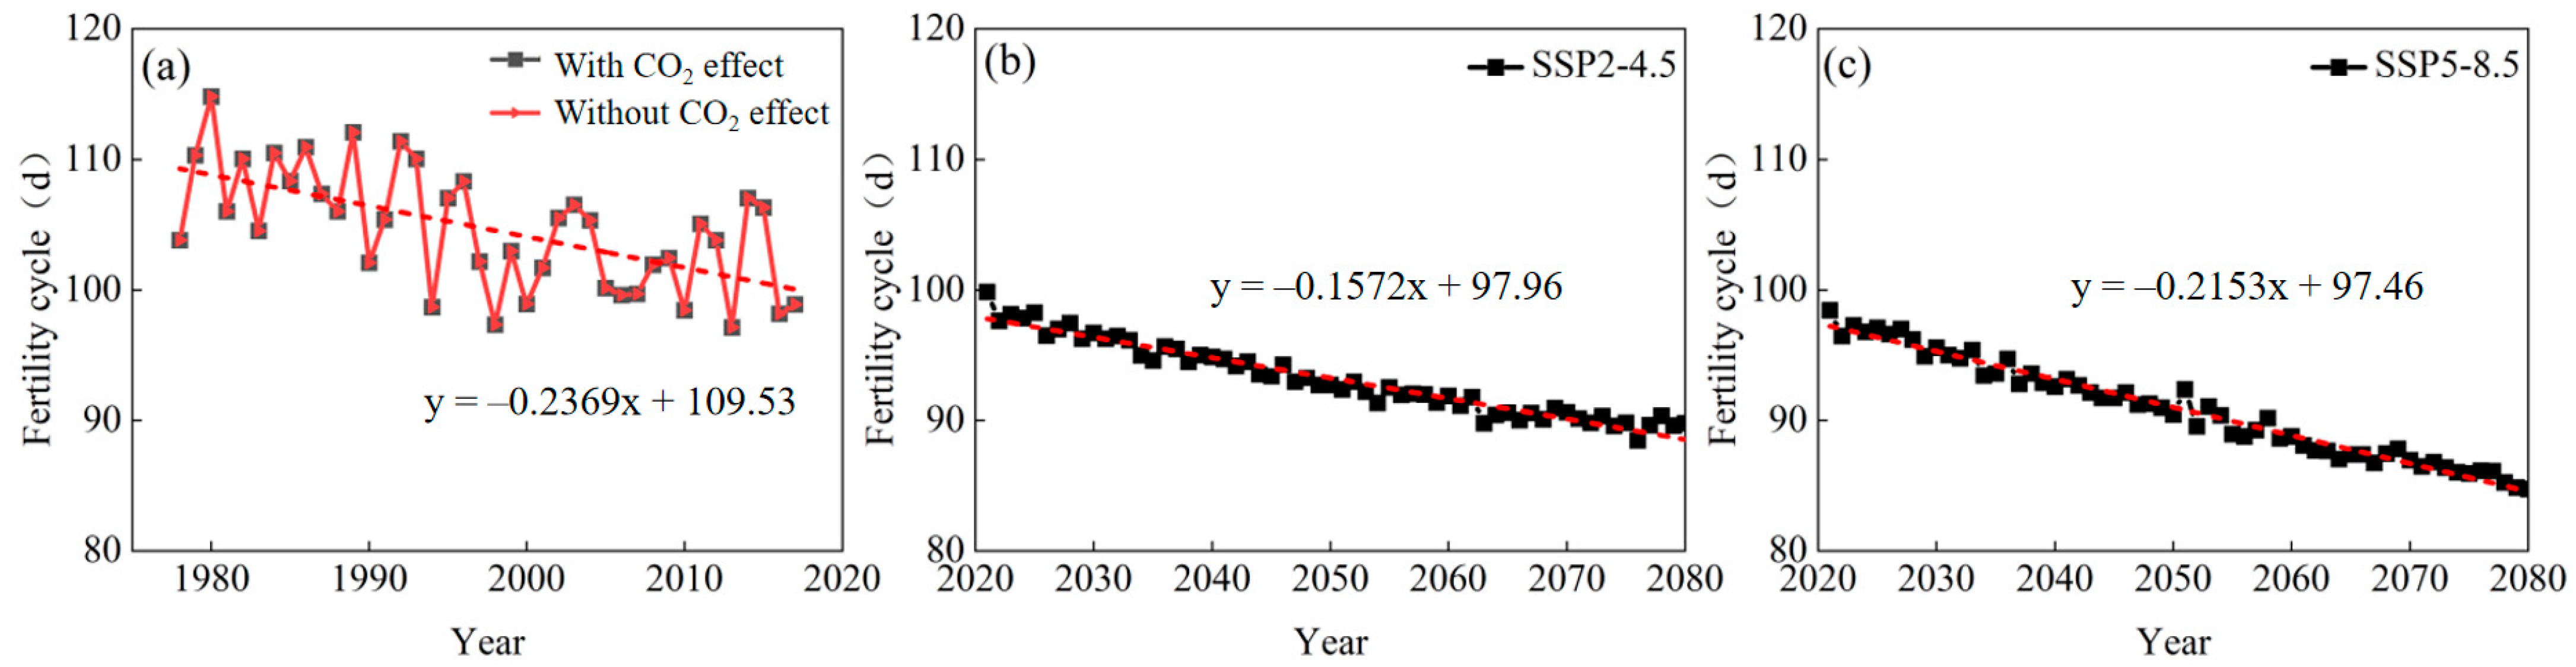
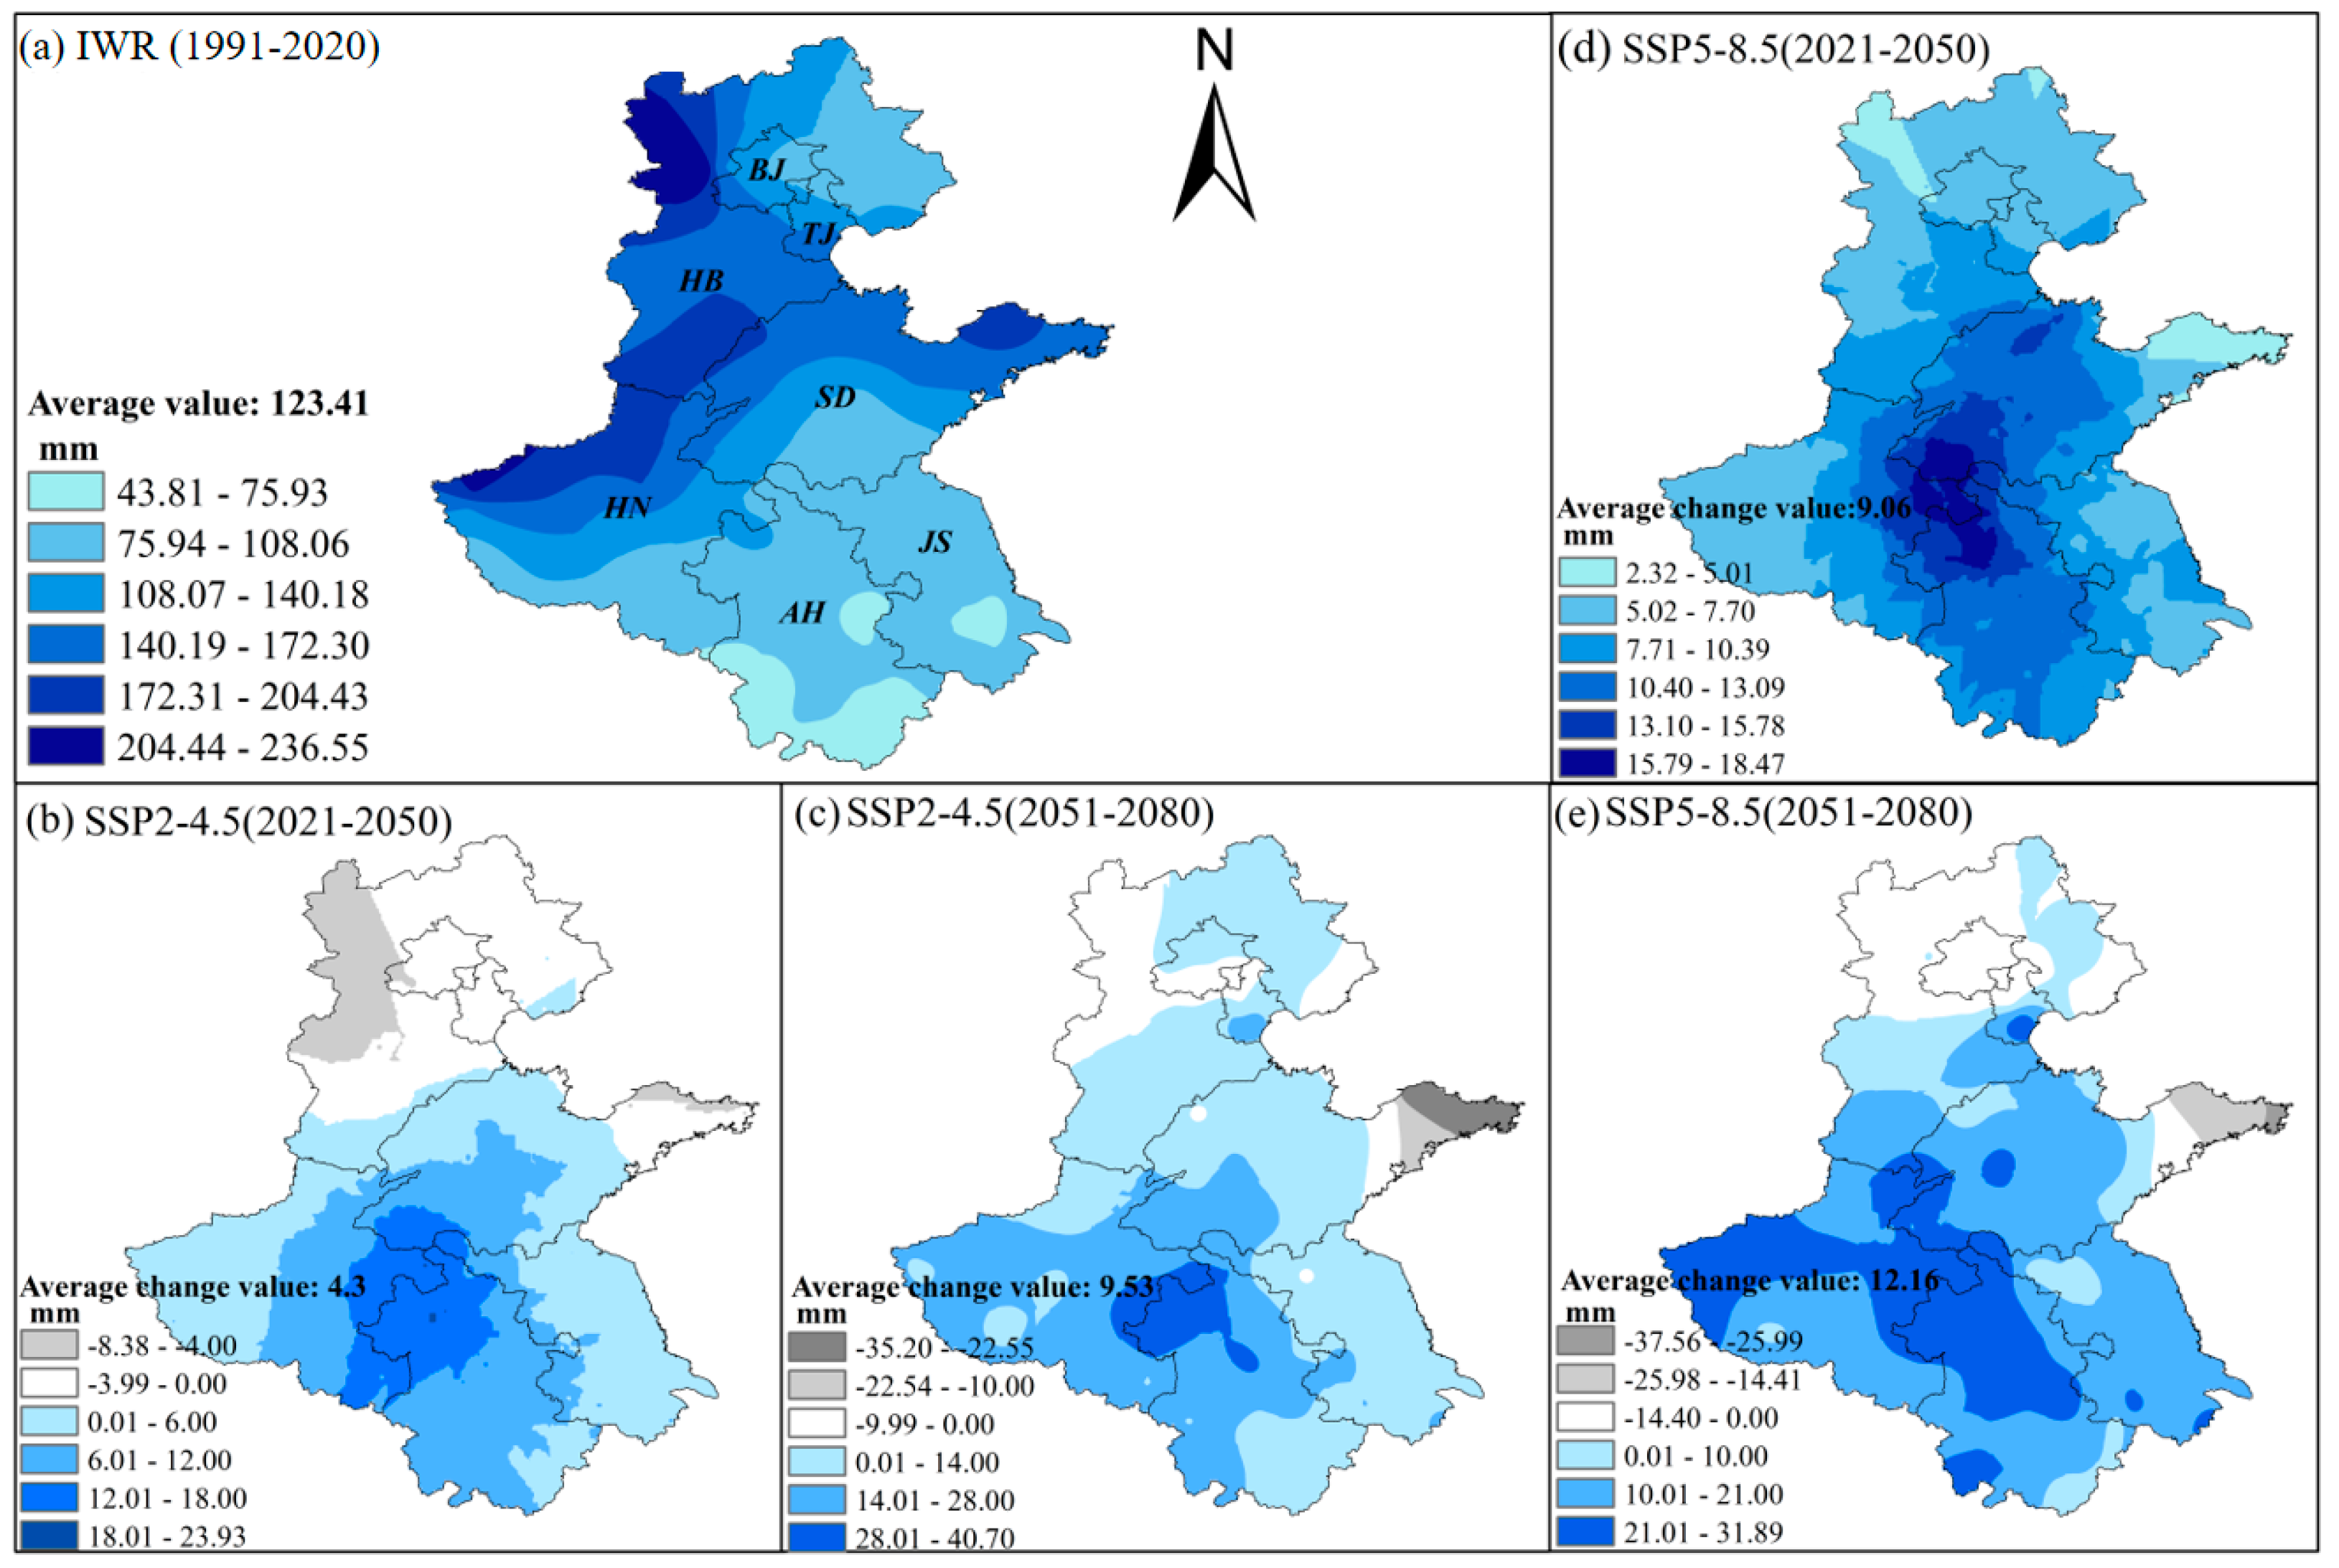
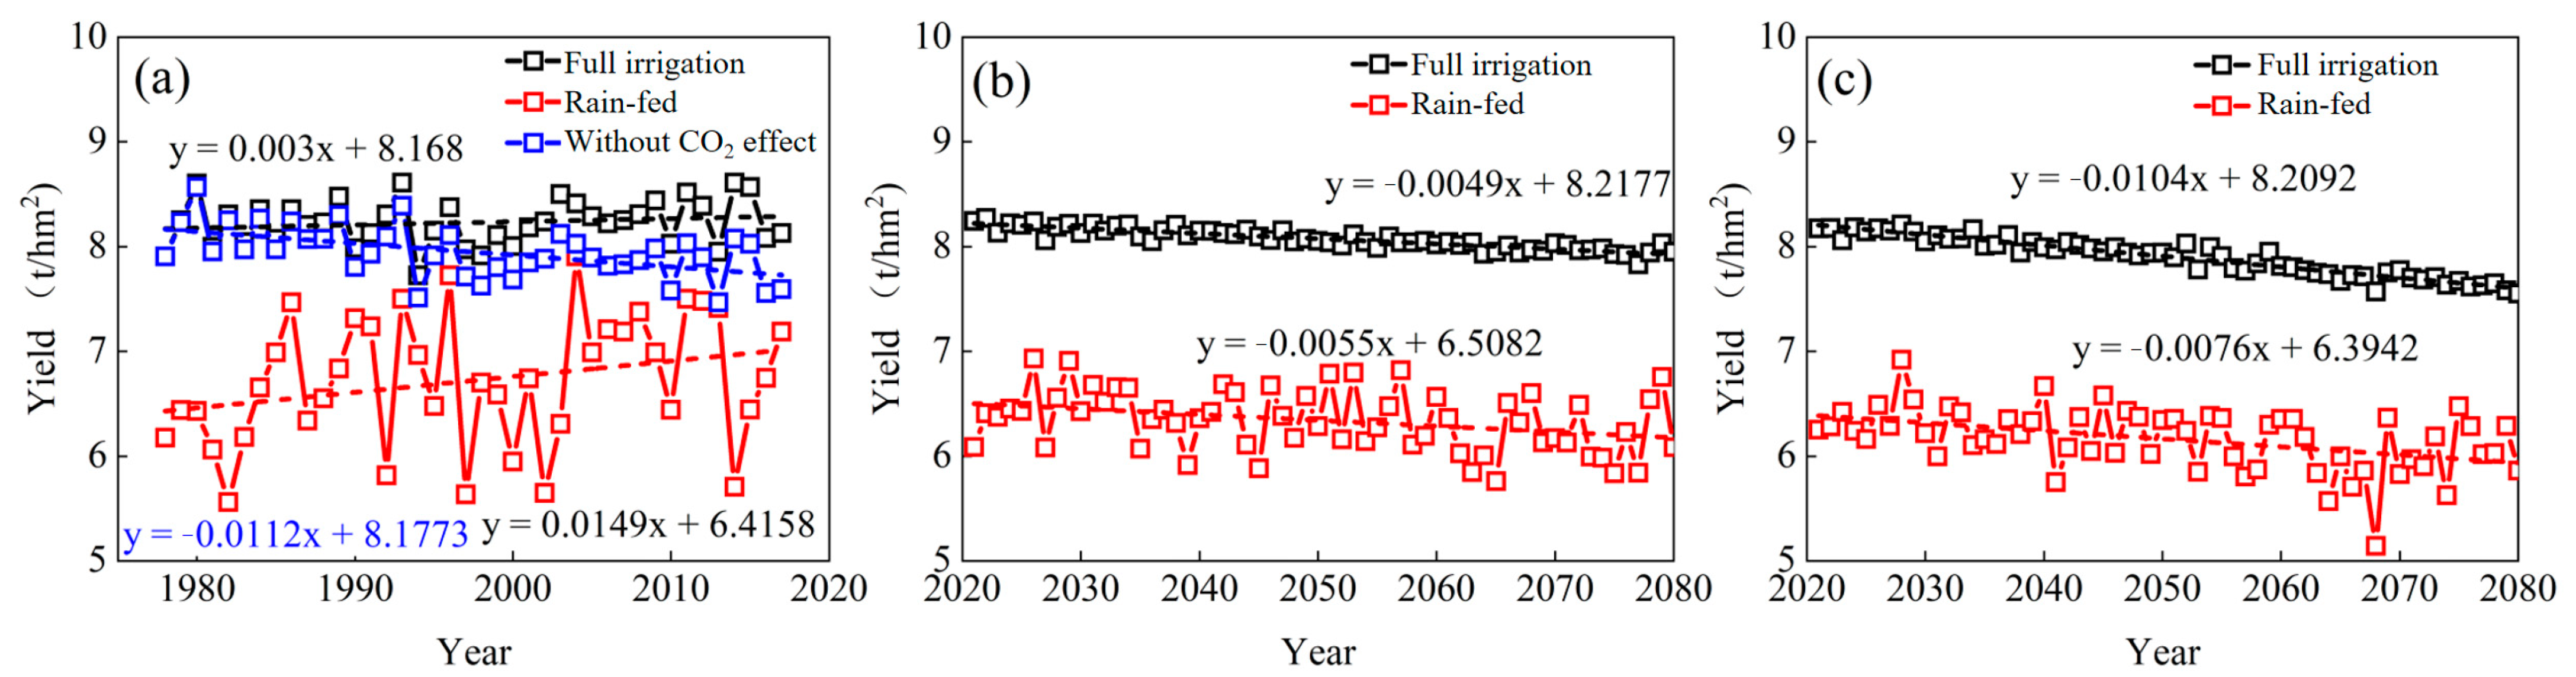
3.4. Impacts of Climate Change on Maize FC, WR, and IWR

By driving the AquaCrop model with the bias-corrected GCMs under the full irrigation condition, the maize fertility cycle (FC), WR, and irrigation water requirement (IWR) in the past decades and two future stages were estimated. As shown in Figure 6, with the increase in temperature, the maize fertility cycle decreased dramatically in the historical period, with a value of −0.24 days/year, while in the future (2021–2080), it will decrease by 0.16 and 0.22 days/year under SSP2-4.5 and SSP5-8.5, respectively.
The spatial distribution patterns of the maize water requirement (WR) are shown in Figure 7. The results show that during the historical period, the mean WR was lower in the southern regions (varied from 343 to 377 mm/year) but higher in the northern areas (varied from 377 to 447 mm/year). For 2021–2050 under the SSP2-4.5 scenario, the WR in the whole area is lower than that in the historical benchmark period, with the maximum decreasing value (up to −45 mm/year) occurring at Shandong Peninsula and Northeastern Hebei Province, while the reduction in other areas usually does not exceed 32 mm/year. The spatial patterns of changes in WR in the 2051–2080 period is similar to that in 2021–2050, but the reduction magnitude is relatively small. For 2021–2050 under the SSP5-8.5 scenario, maize WR does not decrease significantly, despite the obviously shortened FC, and some areas even show a slight increase in WR (varied from 0 to 5 mm). For the 2051–2080 period, the area where the amount of irrigation increases is obviously enlarged, but the maximum increase is no more than 12 mm.
Figure 7a shows the multi-year average of the IWR during the historical period. It can be found that with the increase in latitude, the IWR gradually increases from 44 mm to 236 mm, while in the future period, unlike the spatial patterns of the changes in WR, IWR shows an overall increasing trend for all scenarios in all periods (Figure 8). Under the SSP2-4.5 scenario, except for the slight decline in the IWR of Hebei, Beijing, Tianjin, and the Shandong Peninsula, the IWR of other regions will increase significantly, with the maximum increase (up to 40 mm) occurring in the southwest region of 3H. For the SSP5-8.5 scenario, the changes in IWR show similar spatial patterns to that under the SSP254 scenario, but the increase is relatively small (less than 32 mm).

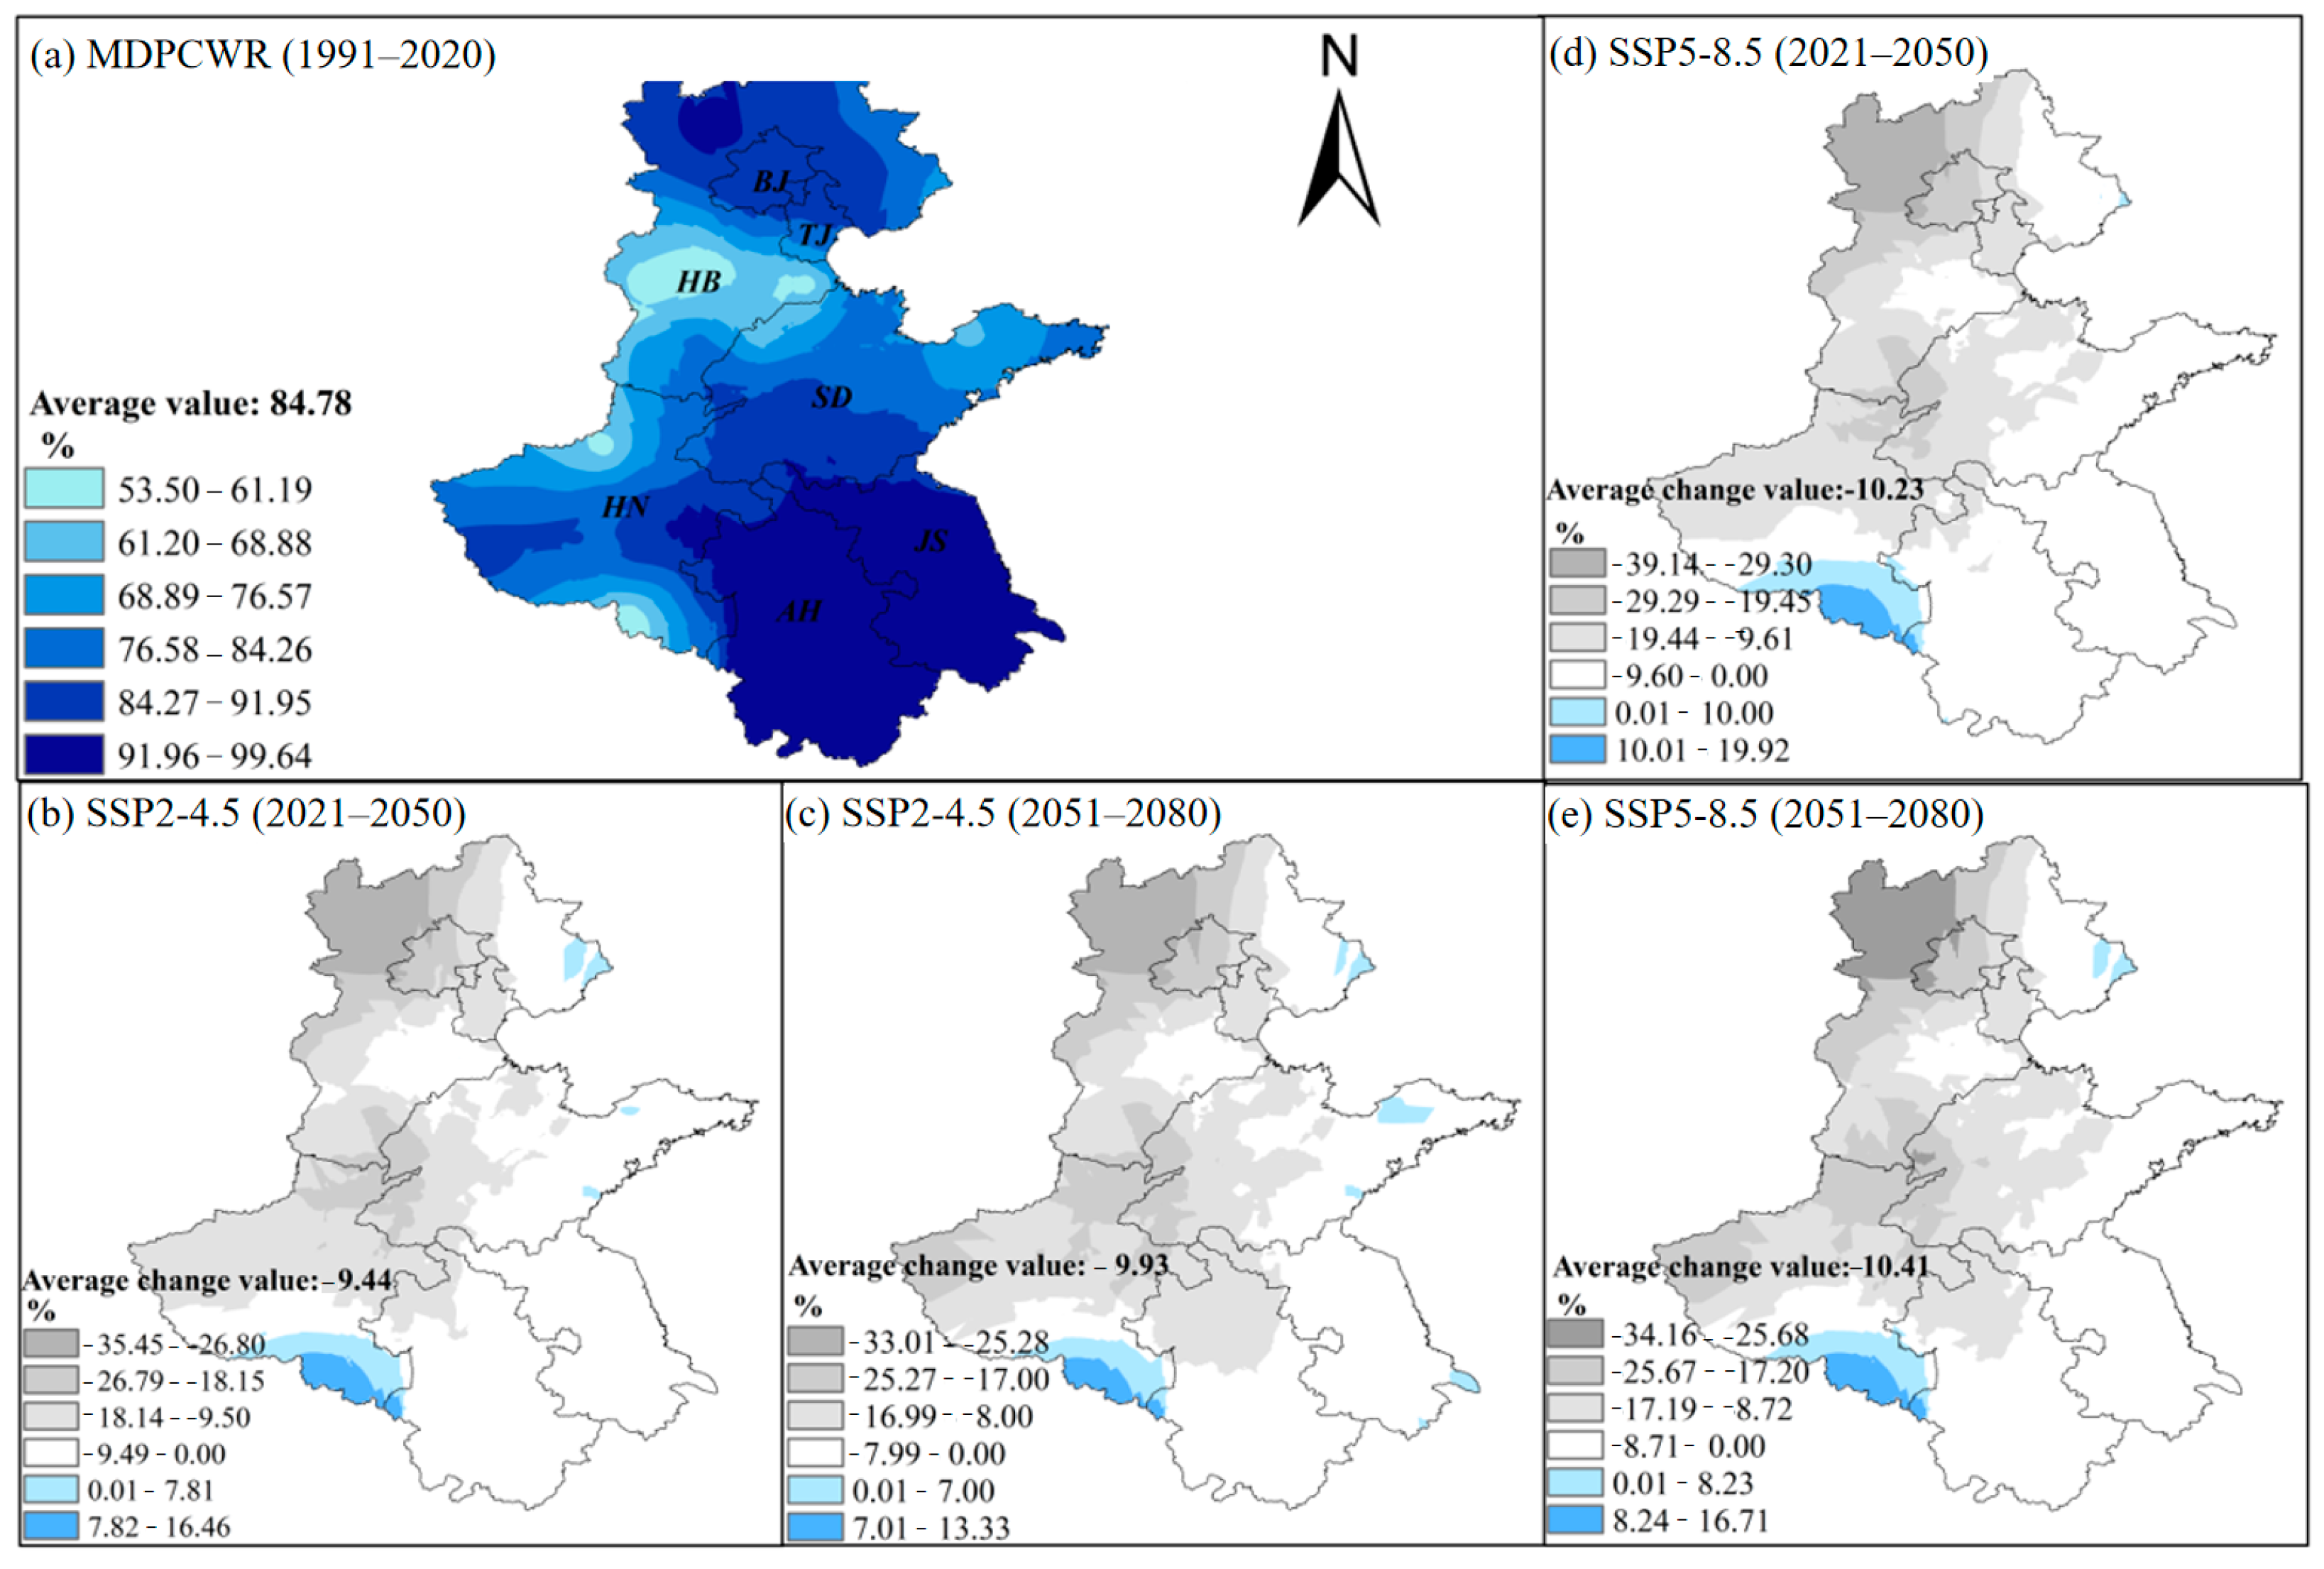
3.5. Impacts of Climate Change on the MDPCWR

Based on the simulation results of the AquaCrop model, effective rainfall during the historical and future two stages were calculated (Figure 9). It can be clearly found that although the precipitation will increase significantly in the future (Figure 4 and Figure 5), the effective precipitation will decrease significantly. During the 2021–2050 and 2051–2080 periods under the SSP2-4.5 scenario, the regional average effective precipitation will decrease by 14.5 mm and 13.2 mm, respectively. Under the SSP5-8.5 scenario, the effective precipitation in the two future stages will further decrease, reaching 18.6 and 16.5 mm, respectively. This can be explained by the fact that more precipitation occurs in the form of torrential rains in future periods (Table 4), resulting in increased precipitation that cannot be retained by cropland.
With the obvious changes in the crop growth environment, maize yields also undergo non-negligible changes (Figure 10). Unlike the general perception, under either rain-fed or fully irrigation conditions, climate change has not caused a decline in maize yield over the historical period. For the rain-fed condition, it can be explained by the increased precipitation, which mitigates the negative impact of water stress on yield, while for the fully irrigated condition, the effects of the increase in CO2 concentration offset the yield loss by global warming. However, it should be noted that under the two future scenarios, maize yields will inevitably decrease under both rain-fed and fully irrigated conditions in the next two scenarios. The yield decline is more obvious under the SSP5-8.5 scenario, with the value reaching 0.076 and −0.10 (t/hm2)/10 year for rain-fed and fully irrigated, respectively. Along with the decrease in the effective precipitation, the MDPCWR also shows an obvious reduction process (Figure 11). In the 2021–2050 and 2051–2080 periods under the SSP2-4.5 scenario, the regional average MDPCWR will decrease by 9.4 and 9.9%, respectively, while under the SSP5-8.5 scenario, the values of the two future stages are 10.2 and 10.4%, respectively.

4. Discussion

Precipitation is the key source for maintaining crop growth [3], which is especially the case for maize production in the 3H region, where the rainy and warm summers provide the necessary water and heat resources for crop growth [1,2]. However, under the influence of climate change, mainly characterized by increased temperature and shifted precipitation patterns, the climatic environment of crop growth is inevitably altered, thus affecting the matching of water demand and precipitation [6,7,8]. Studying the extent to which precipitation can meet the water demands of crops is of great significance for regional food security and the efficient utilization of water resources. In this study, the AquaCrop model was used to simulate the yield of maize under rain-fed and fully irrigated conditions, and the ratio of the two simulations was used as an index of the matching degree between precipitation and crop water demand (MDPCWR). This index fully considered the difference in crop water sensitivity in different growth stages of maize so that it can more accurately evaluate the change characteristics of the matching degree of water demand and precipitation of maize.
Based on the output of 11 bias-corrected GCMs, the 3H region will experience a significant warming process. Under the SSP2-4.5 scenario, compared to the historical baseline period (1991–2020), warming in the next two periods (2021–2050 and 2051–2080) will reach 1.3 and 2.4 °C, respectively, which is about the same as the global average level [66]. Similar to the changes in temperature, precipitation also shows a significant increase trend in the two future stages. However, there are marked differences in the rate of increase across regions, with the value ranging from −16 mm to 120 mm. This spatial heterogeneity has also been found by other previous studies [67,68]. In addition, it should be noted that precipitation will occur more in the form of torrential rain in the future. This is because as temperatures continue to rise, the air is able to hold more water vapor, making it more prone to heavy rain [69].
Along with the changed climate, maize water utilization and growth processes have also altered dramatically. Among all the crop growth indicators, FC is a key factor affecting the length of water demand and yield formation [70,71]. The results showed that with the growing temperature, the development rate of maize continues to accelerate, resulting in a significant shortening of the FC. The maximum shortening (17 days) occurs in the 2051–2080 stage under the SSP5-8.5 scenario. However, it should be noted that the rate of shortening FC shows signs of slowing by the end of the century (Figure 6). This can be attributed to the growth rate of maize already being close to the maximum, and even if the temperature continues to increase, the growth rate of maize will not be accelerated [10,72]. Although the reference evapotranspiration rate will increase significantly in the future, the shortened growth period length offsets the effect of the increased evapotranspiration rate on crop water demand (Figure 7). Generally, with increasing precipitation and decreasing water demand, the irrigation water requirement will not decrease. However, the results of our study show exactly the opposite phenomenon (Figure 8). This can be attributed to the fact that in the future, most of the increased precipitation occurs in the form of torrential rain. This part of precipitation will be lost as surface runoff and deep percolation, resulting in a decrease in the effective precipitation. Therefore, the MDPCWR will inevitably decline, indicating that it will become increasingly difficult to meet the water needs of corn in future periods, which will present more difficult challenges for irrigation systems.
Several limitations and uncertainties of this study should be pointed out here. First, the simulation was carried out based on the assumption that maize varieties will remain unchanged in the future. In fact, statistical data indicate that maize varieties with long growth cycles have been gradually implemented over the past few decades to adjust to climate change and take advantage of increased heat resources [73,74]. Therefore, assuming that the variety of maize remains unchanged may not be consistent with the actual practice in the future. However, our assumption does not affect the reliability of the conclusions of this study, because the MDPCWR of maize is more closely linked to changes in precipitation patterns. Second, due to the limited maize variety information, we employed the same drought tolerance parameters in all simulations, which may cause the simulation results to differ from the actual values. In addition, with the continuous updating of maize varieties, maize in the future may be more drought-tolerant [67], causing the estimated results of this study to be higher than the actual values. Third, the change in CO2 concentration has a non-negligible impact on the growth process and water consumption process of crops, which is especially the case for C4 crops such as maize [75]. In this study, we used the default parameters in the AquaCrop model to assess the impact of CO2, which may lead to some uncertainty in the simulation results. Some studies have already explored the response of maize growth to the elevated CO2 concentration based on open-top chamber experiments [76,77]. More efforts are still needed to utilize experiments to improve the accuracy of the model simulation.

5. Conclusions

The responses of maize growth, the field water cycle, and the matching degree between maize water requirements and precipitation (MDPCWR) to climate change in the Huang–Huai–Hai (3H) region were simulated by driving the AquaCrop model with 11 bias-corrected GCM outputs. Compared with previous studies, to more accurately evaluate the matching degree between crop water demand and precipitation, this study employed a process-based crop model to fully consider the differences in water sensitivity in different growth stages of maize. Simulated and observed maize growing lengths in each province matched well, indicating that the AquaCrop model is capable of simulating the maize growth rate under different climate conditions. Using the CDF-t bias correction method, the bias of extreme climate events in GCMs can be effectively eliminated, thereby providing more reliable climate data for future climate change impact assessments. Obviously, under all future schemes, temperature, precipitation, and radiation will all increase, but the increase in precipitation has a strong spatial heterogeneity. Along with the increased temperature and radiation, the daily evapotranspiration rate will increase significantly. However, the shortening of the maize growth cycle may result in a slight decrease in maize’s water requirement in the future. Despite the decrease in water requirements and increase in precipitation, irrigation will not decrease but rather increase. The reason for this is that there will be more precipitation in the form of torrential rain in the future. Therefore, the MDPCWR in the future period will obviously be smaller than that in the historical period, indicating that future precipitation patterns will be more unfavorable for the stable production of maize in the 3H region.

Author Contributions

Conceptualization, Y.X. and Y.D.; methodology, Y.D.; software, Y.X.; validation, R.C. and M.W.; formal analysis, Y.X.; resources, Y.D.; data curation, Y.X.; writing—original draft preparation, Y.X.; writing—review and editing, Y.D.; visualization, Y.X.; supervision, Y.X.; project administration, Y.D.; funding acquisition, Y.D. All authors have read and agreed to the published version of the manuscript.

Funding

This research was funded by the Ningxia Talent Introduction Project (2022BSB03060), the Open Research Fund Program of State key Laboratory of Hydroscience and Engineering (sklhse-2022-A-03), and the National Natural Science Foundation of China (52209059).

Data Availability Statement

The data presented in this study are available on request from the corresponding author.

Acknowledgments

Thanks goes to the National Meteorological Information Center, China Meteorological Administration (http://data.cma.gov.cn/, accessed on 12 November 2023) for offering the meteorological data and also to the Working Group of the World Climate Research Program on Coupled Modeling, which is responsible for CMIP6.

Conflicts of Interest

The authors declare no conflicts of interest.

Abbreviations

MDPCWRMatching degree between precipitation and crop water requirement
CDF-tCumulative distribution function-transform
CMIP6Phase six of the Coupled Model Intercomparison Project
GCMsGlobal Climate models
3HHuang–Huai–Hai
CMAChina Meteorological Administration
TxMaximum temperature
TnMinimum temperature
PPrecipitation
PeEffective precipitation
KDDkilling degree days, accumulated temperature higher than 35 °C
ETpActual evapotranspiration
ETaPotential evapotranspiration
EToReference evapotranspiration
FCCrop fertility cycle
WRCrop water requirement
IWRCrop irrigation water requirement

References

  1. Yang, S.; Ding, Z.; Li, Y.; Wang, X.; Jiang, W.; Huang, X. Warming-induced northwestward migration of the East Asian monsoon rain belt from the Last Glacial Maximum to the mid-Holocene. Proc. Natl. Acad. Sci. USA 2015, 112, 13178–13183. [Google Scholar] [CrossRef] [PubMed]
  2. He, J.; Ju, J.; Wen, Z.; Lu, J.; Jin, Q. A Review of Recent Advances in Research on Asian Monsoon in China. Adv. Atmos. Sci. 2007, 24, 972–992. [Google Scholar] [CrossRef]
  3. Zhang, Q.; Wang, Y. Distribution of hazard and risk caused by agricultural drought and flood and their correlations in summer monsoon–affected areas of China. Theor. Appl. Climatol. 2022, 149, 965–981. [Google Scholar] [CrossRef]
  4. Chen, X.; Wang, L.; Niu, Z. The effects of projected climate change and extreme climate on maize and rice in the Yangtze River Basin, China. Agric. For. Meteorol. 2020, 282–283, 107867. [Google Scholar] [CrossRef]
  5. IPCC. Climate Change 2022: Impacts, Adaptation, and Vulnerability. In Contribution of Working Group II to the Sixth Assessment Report of the Intergovernmental Panel on Climate Change; Pörtner, H.-O., Roberts, D.C., Tignor, M., Poloczanska, E.S., Mintenbeck, K., Alegría, A., Craig, M., Langsdorf, S., Löschke, S., Möller, V., et al., Eds.; Cambridge University Press: Cambridge, UK; New York, NY, USA, 2022; 3056p. [Google Scholar]
  6. Chen, F.; Chen, J.; Huang, W.; Chen, S.; Huang, X.; Jin, L.; Jia, J.; Zhang, X.; An, C.; Zhang, J.; et al. Westerlies Asia and monsoonal Asia: Spatiotemporal differences in climate change and possible mechanisms on decadal to sub-orbital timescales. Earth-Sci. Rev. 2019, 192, 337–354. [Google Scholar] [CrossRef]
  7. Zhang, Q.; Sun, P.; Singh, V.P.; Chen, X. Spatial-temporal precipitation changes (1956–2000) and their implications for agriculture in China. Glob. Planet. Chang. 2012, 82, 86–95. [Google Scholar] [CrossRef]
  8. Tian, J.; Zhang, Z.; Ahmed, Z.; Zhang, L.; Su, B.; Tao, H.; Jiang, T. Projections of precipitation over China based on CMIP6 models. Stoch. Environ. Res. Risk Assess. 2021, 35, 831–848. [Google Scholar] [CrossRef]
  9. Ding, Y.; Wan, W.; Song, R.; Shao, Q.; Jiao, X.; Xing, W. Modeling spatial and temporal variability of the impact of climate change on rice irrigation water requirements in the middle and lower reaches of the Yangtze River, China. Agric. Water Manag. 2017, 193, 89–101. [Google Scholar] [CrossRef]
  10. Ding, Y.; Wang, W.; Zhuang, Q.; Luo, Y. Adaptation of paddy rice in China to climate change: The effects of shifting sowing date on yield and irrigation water requirement. Agric. Water Manag. 2020, 228, 105890. [Google Scholar] [CrossRef]
  11. Wang, W.; Ding, Y.; Shao, Q.; Xu, J.; Jiao, X.; Luo, Y.; Yu, Z. Bayesian multi-model projection of irrigation requirement and water use efficiency in three typical rice plantation region of China based on CMIP5. Agric. For. Meteorol. 2017, 232, 89–105. [Google Scholar] [CrossRef]
  12. Zhang, F.; Chi, D.; Chen, T. Assessment of Coupling Degree between Water Requirement of Main Cereal Crops and Precipitation in Growing Season in Liaoning Province. China J. Agrometeorol. 2021, 42, 746–760. [Google Scholar]
  13. Tao, F.; Zhang, Z.; Shi, W.; Liu, Y.; Xiao, D.; Zhang, S.; Zhu, Z.; Wang, M.; Liu, F. Single rice growth period was prolonged by cultivars shifts, but yield was damaged by climate change during 1981–2009 in China, and late rice was just opposite. Glob. Chang. Biol. 2013, 19, 3200–3209. [Google Scholar] [CrossRef] [PubMed]
  14. White, J.; Hoogenboom, G.; Kimball, B.; Wall, G. Methodologies for simulating impacts of climate change on crop production. Field Crop. Res. 2011, 124, 357–368. [Google Scholar] [CrossRef]
  15. Sultan, B.; Defrance, D.; Iizumi, T. Evidence of crop production losses in West Africa due to historical global warming in two crop models. Sci. Rep. 2019, 9, 12834. [Google Scholar] [CrossRef] [PubMed]
  16. Rocha, J.; Carvalho-Santos, C.; Diogo, P.; Beca, P.; Keizer, J.; Nunes, J. Impacts of climate change on reservoir water availability, quality and irrigation needs in a water scarce Mediterranean region (southern Portugal). Sci. Total Environ. 2020, 736, 139477. [Google Scholar] [CrossRef] [PubMed]
  17. Stenzel, F.; Greve, P.; Lucht, W.; Tramberend, S.; Wada, Y.; Gerten, D. Irrigation of biomass plantations may globally increase water stress more than climate change. Nat. Commun. 2021, 12, 1512. [Google Scholar] [CrossRef] [PubMed]
  18. Luo, W.; Chen, M.; Kang, Y.; Li, D.; Cui, Y.; Khan, S.; Luo, Y. Analysis of crop water requirements and irrigation demands for rice: Implications for increasing effective rainfall. Agric. Water Manag. 2022, 260, 107285. [Google Scholar] [CrossRef]
  19. Lu, J.; Zhu, W.; Gao, Z. Analysis of coupling degree between water demand of main crops and rainfall in Loess Hilly region of Northern Shaanxi. Water Sav. Irrig. 2019, 12, 72–76. [Google Scholar]
  20. Zhang, Q.; Dong, W.; Wen, C. Study on factors affecting corn yield based on the Cobb-Douglas production function. Agric. Water Manag. 2019, 228, 105869. [Google Scholar] [CrossRef]
  21. Allen, R.; Pereira, L.; Raes, D.; Smith, M. Crop Evapotranspiration Guidelines for Computing Crop Water Requirements-Irrigation and Drainage Paper 56; Food and Agriculture Organization of the United Station: Rome, Italy, 1998. [Google Scholar]
  22. Paredes, P.; Pereira, L.; Almorox, J.; Darouich, H. Reference grass evapotranspiration with reduced data sets: Parameterization of the FAO Penman-Monteith temperature approach and the Hargeaves-Samani equation using local climatic variables. Agric. Water Manag. 2020, 240, 106210. [Google Scholar] [CrossRef]
  23. Zhang, Z.; Hao, W.; Li, H.; Mao, L.; Xiang, G. Analysis on the Drought Characteristics in Different Growth Stages of Spring Maize in Shanxi Province. China J. Agrometeorol. 2015, 36, 754–761. [Google Scholar]
  24. Panda, R.; Behera, S.; Kashyap, P. Effective management of irrigation water for maize under stressed conditions. Agric. Water Manag. 2004, 66, 181–203. [Google Scholar] [CrossRef]
  25. Song, X.; Zhou, G.; He, Q.; Zhou, H. Stomatal limitations to photosynthesis and their critical Water conditions in different growth stages of maize under water stress. Agric. Water Manag. 2020, 241, 106330. [Google Scholar] [CrossRef]
  26. Brejda, J.; Moorman, T.; Smith, J.; Karlen, D.; Allan, D.; Dao, T. Distribution and Variability of Surface Soil Properties at a Regional Scale. Soil Sci. Soc. Am. J. 2000, 64, 974–982. [Google Scholar] [CrossRef]
  27. Koutnik, V.; Leonard, J.; Alkidim, S.; Deprima, F.; Ravi, S.; Hoek, E.; Mohanty, S. Distribution of microplastics in soil and freshwater environments: Global analysis and framework for transport modeling. Environ. Pollut. 2021, 274, 116552. [Google Scholar] [CrossRef]
  28. Asseng, S.; Keulen, H.; Stol, W. Performance and application of the APSIM Nwheat model in the Netherlands. Eur. J. Agron. 2000, 12, 37–54. [Google Scholar] [CrossRef]
  29. de Wit, A.; Boogaard, H.; Fumagalli, D.; Janssen, S.; Knapen, R.; Kraalingen, D.; Supit, I.; Wijngaart, R.; Diepen, K. 25 years of the WOFOST cropping systems model. Agric. Syst. 2018, 168, S0308521X17310107. [Google Scholar] [CrossRef]
  30. Li, T.; Angeles, O.; Marcaida, M.; Manalo, E.; Manalili, M.; Radanielson, A.; Mohanty, S. From ORYZA2000 to ORYZA (v3): An improved simulation model for rice in drought and nitrogen-deficient environments. Agric. For. Meteorol. 2017, 237–238, 246–256. [Google Scholar] [CrossRef]
  31. Yu, Q.; Cui, Y.; Han, H.; Liao, B. Modelling water consumption and nitrogen loss in paddy fields with an improved ORYZA model. Field Crop. Res. 2023, 292, 108828. [Google Scholar] [CrossRef]
  32. Vanuytrecht, E.; Raes, D.; Steduto, P.; Hsiao, T.; Fereres, E.; Heng, L.; Vila, M.; Moreno, P. AquaCrop: FAO’s crop water productivity and yield response model. Environ. Model. Softw. 2014, 62, 351–360. [Google Scholar] [CrossRef]
  33. Jones, J.; Hoogenboom, G.; Poter, C.; Boote, K.; Batchelor, W.; Hunt, L.; Wilkens, P.; Singh, U.; Gijsman, A.; Ritchie, J. The DSSAT cropping system model. Eur. J. Agron. 2003, 18, 235–265. [Google Scholar] [CrossRef]
  34. Foster, T.; Brozovi, N.; Butler, A.; Neale, C.; Raes, D.; Steduto, P.; Fereres, E.; Hsiao, T. AquaCrop-OS: An open source version of FAO's crop water productivity model. Agric. Water Manag. 2017, 181, 18–22. [Google Scholar] [CrossRef]
  35. Umesh, B.; Reddy, K.; Polisgowdar, B.; Maruthi, V.; Satishkumar, U.; Ayyanagoudar, M.; Rao, S.; Veeresh, H. Assessment of climate change impact on maize (Zea mays L.) through aquacrop model in semi-arid alfisol of southern Telangana. Agric. Water Manag. 2022, 274, 107950. [Google Scholar] [CrossRef]
  36. Zhang, C.; Xie, Z.; Wang, Q.; Tang, M.; Feng, S.; Cai, H. AquaCrop modeling to explore optimal irrigation of winter wheat for improving grain yield and water productivity. Agric. Water Manag. 2022, 266, 107580. [Google Scholar] [CrossRef]
  37. Raes, D.; Fereres, E.; Curnel, Y.; Vlia, M.; Knoded, D.; Celik, S.; Ucar, Y.; Turk, M.; Wellens, J. Simulation of alfalfa yield with AquaCrop. Agric. Water Manag. 2023, 284, 108341. [Google Scholar] [CrossRef]
  38. Xiao, D.; Liu, D.; Wang, B.; Feng, P.; Bai, H.; Tang, J. Climate change impact on yields and water use of wheat and maize in the North China Plain under future climate change scenarios. Agric. Water Manag. 2020, 238, 106238. [Google Scholar] [CrossRef]
  39. Ahmadi, M.; Etedali, H.; Elbeltagi, A. Evaluation of the effect of climate change on maize water footprint under RCPs scenarios in Qazvin plain, Iran. Agric. Water Manag. 2021, 254, 106969. [Google Scholar] [CrossRef]
  40. Falconnier, G.; Corbeels, M.; Boote, K.; Affholder, F.; Adam, M.; MacCarthy, D.; Ruane, A.; Nendel, C.; Whitbread, A.; Justes, E.; et al. Modelling climate change impacts on maize yields under low nitrogen input conditions in sub-Saharan Africa. Glob. Chang. Biol. 2020, 26, 5942–5964. [Google Scholar] [CrossRef]
  41. Chen, Z.; Zhou, T.; Zhang, L.; Chen, X.; Zhang, W.; Jiang, J. Global land monsoon precipitation changes in CMIP6 projection. Geophys. Res. Lett. 2020, 47, e2019GL086902. [Google Scholar] [CrossRef]
  42. Zelinka, M.; Myers, T.; Mccoy, D.; Po-Chedley, S.; Caldwell, P.; Ceppi, P.; Klein, S.; Taylor, K. Causes of Higher Climate Sensitivity in CMIP6 Models. Geophys. Res. Lett. 2020, 47, e2019GL085782. [Google Scholar] [CrossRef]
  43. Tokarska, K.; Stolpe, M.; Sippel, S.; Fischer, E.; Smith, C.; Lehner, F.; Knutti, R. Past warming trend constrains future warming in CMIP6 models. Sci. Adv. 2020, 6, 2375–2548. [Google Scholar] [CrossRef] [PubMed]
  44. Meehl, G.; Senior, C.; Eyring, V.; Flato, G.; Lamarque, J.; Stouffer, R.; Taylor, K.; Schlund, M. Context for interpreting equilibrium climate sensitivity and transient climate response from the CMIP6 Earth system models. Sci. Adv. 2020, 6, eaba1981. [Google Scholar] [CrossRef] [PubMed]
  45. Niu, J.; Qin, W.; Wang, L.; Zhang, M.; Wu, J.; Zhang, Y. Climate change impact on photovoltaic power potential in China based on CMIP6 models. Sci. Total Environ. 2023, 858, 159776. [Google Scholar] [CrossRef]
  46. Zhu, H.; Jiang, Z.; Juan, L.; Li, W.; Sun, C.; Li, L. Does CMIP6 Inspire More Confidence in Simulating Climate Extremes over China? Adv. Atmos. Sci. 2020, 37, 1119–1132. [Google Scholar] [CrossRef]
  47. Kim, Y.; Min, S.; Zhang, X.; Sillmann, J.; Sandstad, M. Evaluation of the CMIP6 multi-model ensemble for climate extreme indices. Weather. Clim. Extrem. 2020, 29, 100269. [Google Scholar] [CrossRef]
  48. Cook, B.; Mankin, J.; Marvel, K.; Williams, A.; Smerdon, J.; Anchukaitis, K. Twenty-first Century Drought Projections in the CMIP6 Forcing Scenarios. Earth's Future 2020, 8, e2019EF001461. [Google Scholar] [CrossRef]
  49. Wang, T.; Tu, X.; Singh, V.; Chen, X.; Lin, K. Global data assessment and analysis of drought characteristics based on CMIP6. J. Hydrol. 2021, 596, 126091. [Google Scholar] [CrossRef]
  50. Erenstein, O.; Jaleta, M.; Sonder, K.; Mottaleb, K.; Prasanna, B. Global maize production, consumption and trade: Trends and R&D implications. Food Secur. 2022, 14, 1295–1319. [Google Scholar]
  51. National Bureau of Statistics of China. China Statistical Yearbook 2021; China Statistics Press: Beijing, China, 2022. [Google Scholar]
  52. Tao, F.; Zhang, Z. Adaptation of maize production to climate change in North China Plain: Quantify the relative contributions of adaptation options. Eur. J. Agron. 2010, 33, 103–116. [Google Scholar] [CrossRef]
  53. Yu, Y.; Jiang, Z.; Wang, G.; Kattel, G.; Chuai, X.; Shang, Y.; Zou, Y.; Miao, L. Disintegrating the impact of climate change on maize yield from human management practices in China. Agric. For. Meteorol. 2022, 327, 109235. [Google Scholar] [CrossRef]
  54. Yan, X.; Chen, X.; Ma, C.; Cai, Y.; Cui, Z.; Chen, X.; Wu, L.; Zhang, F. What are the key factors affecting maize yield response to and agronomic efficiency of phosphorus fertilizer in China? Field Crops Res. 2021, 270, 108221. [Google Scholar] [CrossRef]
  55. Su, B.; Huang, J.; Mondal, S.; Zhai, J.; Wang, Y.; Wen, S.; Gao, M.; Lv, Y.; Jiang, S.; Jiang, T.; et al. Insight from CMIP6 SSP-RCP scenarios for future drought characteristics in China. Atmos. Res. 2020, 250, 105375. [Google Scholar] [CrossRef]
  56. Rocheta, E.; Evans, J.; Sharma, A. Assessing atmospheric bias correction for dynamical consistency using potential vorticity. Environ. Res. Lett. 2014, 9, 124010–124016. [Google Scholar] [CrossRef]
  57. Lavaysse, C.; Vrac, M.; Drobinski, P.; Lengaigne, M.; Vischel, T. Statistical downscaling of the French Mediterranean climate: Assessment for present and projection in an anthropogenic scenario. Nat. Hazards Earth Syst. Sci. 2012, 12, 651–670. [Google Scholar] [CrossRef]
  58. Lafon, T.; Dadson, S.; Buys, G.; Prudhomme, C. Bias correction of daily precipitation simulated by a regional climate model: A comparison of methods. Int. J. Clim. 2012, 33, 1367–1381. [Google Scholar] [CrossRef]
  59. Vrac, M.; Drobinski, P.; Merlo, A.; Heremann, M.; Lavaysse, C.; Li, L.; Somot, S. Dynamical and statistical downscaling of the French Mediterranean climate: Uncertainty assessment. Nat. Hazards Earth Syst. Sci. 2012, 12, 2769–2784. [Google Scholar] [CrossRef]
  60. Milly, P.; Betancourt, J.; Falkenmark, M.; Hirsch, R.; Kundzewicz, Z.; Lettenmaier, D.; Stouffer, R. Stationarity Is Dead: Whither Water Management? Science 2008, 319, 573–574. [Google Scholar] [CrossRef]
  61. Er-Raki, S.; Bouras, E.; Rodriguez, J.C.; Watts, C.J.; Lizarraga-Celaya, C.; Chehbouni, A. Parameterization of the AquaCrop model for simulating table grapes growth and water productivity in an arid region of Mexico. Agric. Water Manag. 2021, 245, 106585. [Google Scholar] [CrossRef]
  62. Aziz, M.; Rizvi, S.; Sultan, M.; Bazmi, M.; Shamshiri, R.; Ibrahim, S.; Imran, M. Simulating Cotton Growth and Productivity Using AquaCrop Model under Deficit Irrigation in a Semi-Arid Climate. Agriculture 2022, 12, 242. [Google Scholar] [CrossRef]
  63. Tang, P.; Li, N.; Li, M.; Zhang, F.; Fu, Q.; Xu, Y.; Liu, D. Rice irrigation water efficiency improvement: An AquaCrop-based optimization modeling approach. Eur. J. Agron. 2023, 148, 126867. [Google Scholar] [CrossRef]
  64. Shen, S.; Yang, S.; Zhao, Y.; Xu, Y.; Zhao, X.; Wang, Z.; Liu, J.; Zhang, W. Simulating the rice yield change in the middle and lower reaches of the Yangtze River under SRES B2 scenario. Acta Ecol. Sin. 2011, 31, 40–48. [Google Scholar] [CrossRef]
  65. Liu, X.; Shen, Y. Application of AquaCrop Model for simulating the Summer Maize Water Use in North China Plain. Res. Agric. Mod. 2014, 35, 372–375. [Google Scholar]
  66. Fan, X.; Duan, Q.; Shen, C.; Wu, Y.; Xing, C. Global surface air temperatures in CMIP6: Historical performance and future changes. Environ. Res. Lett. 2020, 15, 104056. [Google Scholar] [CrossRef]
  67. Li, B.; Fan, R.; Sun, G.; Sun, T.; Fan, Y.; Bai, S.; Guo, S.; Huang, S.; Liu, J.; Zhang, H.; et al. Flavonoids improve drought tolerance of maize seedlings by regulating the homeostasis of reactive oxygen species. Plant Soil 2021, 461, 389–405. [Google Scholar] [CrossRef]
  68. Dong, T.; Dong, W. Evaluation of extreme precipitation over Asia in CMIP6 models. Clim. Dyn. 2021, 57, 1751–1769. [Google Scholar] [CrossRef]
  69. Srivastava, A.; Grotjahn, R.; Ullrich, P. Evaluation of historical CMIP6 model simulations of extreme precipitation over contiguous US regions. Weather Clim. Extrem. 2020, 29, 100268. [Google Scholar] [CrossRef]
  70. Lv, Z.; Li, F.; Lu, G. Adjusting sowing date and cultivar shift improve maize adaption to climate change in China. Mitig. Adapt. Strat. Glob. Chang. 2019, 25, 87–106. [Google Scholar] [CrossRef]
  71. Rurinda, J.; Mark, T.; Wijk, V.; Mapfumo, P.; Decheemaeker, K.; Supit, I.; Giller, K. Climate change and maize yield in southern Africa: What can farm management do? Glob. Chang. Biol. 2016, 21, 4588–4601. [Google Scholar] [CrossRef]
  72. Cairns, J.; Hellin, J.; Sonder, K.; Araus, J.; MacRobert, J.; Thierfelder, C.; Prasanna, B. Adapting maize production to climate change in sub-Saharan Africa. Food Secur. 2013, 5, 345–360. [Google Scholar] [CrossRef]
  73. Li, Z.; Yang, P.; Tang, H.; Wu, W.; Yin, H.; Liu, Z.; Zhang, L. Response of maize phenology to climate warming in Northeast China between 1990 and 2012. Reg. Environ. Chang. 2014, 14, 39–48. [Google Scholar] [CrossRef]
  74. Gao, Z.; Feng, H.; Liang, X.; Lin, S.; Zhao, X.; Shen, S.; Du, X.; Cui, Y.; Zhou, S. Adjusting the sowing date of spring maize did not mitigate against heat stress in the North China Plain. Agric. For. Meteorol. 2021, 298–299, 108274. [Google Scholar] [CrossRef]
  75. Manderscheid, R.; Erbs, M.; Weigel, H. Interactive effects of free-air CO2 enrichment and drought stress on maize growth. Eur. J. Agron. 2014, 52, 11–21. [Google Scholar] [CrossRef]
  76. Qiao, Y.; Miao, S.; Li, Q.; Jin, J.; Luo, X.; Tang, C. Elevated CO2 and temperature increase grain oil concentration but their impacts on grain yield differ between soybean and maize grown in a temperate region. Sci. Total Environ. 2019, 666, 405–413. [Google Scholar] [CrossRef] [PubMed]
  77. Ainsworth, E.; Long, S. 30 years of free-air carbon dioxide enrichment (FACE): What have we learned about future crop productivity and its potential for adaptation? Glob. Chang. Biol. 2021, 27, 27–49. [Google Scholar] [CrossRef]
Figure 1. Maps of the 3H region and locations of the meteorological stations.
Agronomy 14 00181 g001
Figure 2. The performance of the phenology module of AquaCrop in simulating heading date (a) and maturity date (b).
Agronomy 14 00181 g002
Figure 3. Bias of KDD (a), and rainstorm days and rainy days (b) before and after bias correction during the validation period (boxplot indicates the bias of different weather stations).
Agronomy 14 00181 g003
Figure 4. The changes in temperature (a,b,d,e) and rainfall (c,f) during two future stages (2021–2050 and 2051–2080) under SSP2-4.5 scenario relative to baseline period (1991–2020).
Agronomy 14 00181 g004
Figure 5. The changes in temperature (a,b,d,e) and precipitation (c,f) during two future stages (2021–2050 and 2051–2080) under SSP5-8.5 scenario relative to baseline period (1991–2020).
Agronomy 14 00181 g005
Figure 6. The changes in maize fertility cycle in the historical (a) and future period under SSP2-4.5 (b) and SSP5-8.5 (c) scenarios.
Agronomy 14 00181 g006
Figure 7. The mean value of maize water requirement during the historical period (a), and its changes in the two future stages (2021–2050 and 2051–2080) under SSP2-4.5 (b,c) and SSP5-8.5 (d,e) scenarios relative to baseline period (1991–2020).
Agronomy 14 00181 g007
Figure 8. The mean value of maize irrigation water requirement (IWR) in the historical period (a), and its changes in the two future stages (2021–2050 and 2051–2080) under SSP2-4.5 (b,c) and SSP5-8.5 (d,e) scenarios relative to baseline period (1991–2020).
Agronomy 14 00181 g008
Figure 9. The mean value of effective precipitation during the historical period (a), and its changes in the two future stages (2021–2050 and 2051–2080) under SSP2-4.5 (b,c) and SSP5-8.5 (d,e) scenarios relative to baseline period (1991–2020).
Agronomy 14 00181 g009
Figure 10. Trends of maize yield during the historical period (a) and the future period (c) under SSP2-4.5 (b) and SSP5-8.5 (c) scenarios.
Agronomy 14 00181 g010
Figure 11. The mean value of the matching degree between maize water requirement and precipitation (MDPCWR) during the historical period (a), and its changes in two future stages (2021–2050 and 2051–2080) under SSP2-4.5 (b,c) and SSP5-8.5 (d,e) scenarios relative to baseline period (1991–2020).
Agronomy 14 00181 g011
Table 1. Detailed information of the 11 CMIP6 GCMs.
No.GCM NameAbbreviationInstitutionResolution
1ACCESS-CM2AC1CSIRO-BOM1.875° × 1.25°
2CanESM5CAN1CCCMA2.8° × 2.8°
3CMCC-CM2-SR5CMCCCMCC1.0° × 1.0°
4EC-Earth3ECE2EC-EARTH1.0° × 1.0°
5FGOALS-g3FGOFGOALS2.5° × 2.5°
6MIROC6MIR1MIROC1.4° × 1.4°
7MPI-ESM1-2HRMPI1MPI-M1.0° × 1.0°
8MPI-ESM1-2LRMPI2MPI-M2.0° × 2.0°
9MRI-ESM2-0MRIMRI1.0° × 1.0°
10NorESM2-LMNor1NCC1.0° × 1.0°
11NorESM2-MMNor2NCC1.0° × 1.0°
Table 2. Growing degree days of maize in each province.
ParametersHebeiTianjinBeijingHenanShandongJiangsuAnhui
Planting Date (dd/mm)19/0617/0620/0626/0616/0616/0621/06
Growing degree days from sowing to emergence (°C·day)1221141238911783134
Growing degree days from sowing to maximum rooting (°C·day)9619789591015924909909
Growing degree days from sowing to senescence (°C·day)1351142214451481140513981398
Growing degree days from sowing to maturity (°C·day)1638173416461761169318511829
Growing degree days from sowing to start of yield formation (°C·day)656660666735697649715
Duration of flowering in growing degree days (°C·day)167182175192188207196
Duration of yield formation in growing degree days (°C·day)585596628641632686657
Table 3. RMSE of bias-corrected precipitation and maximum temperature during validation period (2006–2014).
GCMJuneJulyAugustSeptemberOctober
P (mm)Tx (°C)P (mm)Tx (°C)P (mm)Tx (°C)P (mm)Tx (°C)P (mm)Tx (°C)
ACCESS-CM210.280.3012.920.2116.170.328.810.266.440.43
CanESM510.340.3214.110.228.340.4210.530.222.170.40
CMCC-CM2-SR512.150.1714.080.2810.500.236.990.232.420.23
EC-Earth317.150.2120.090.3415.250.297.980.435.630.38
FGOALS-g314.370.2114.760.2621.260.316.330.282.540.25
MIROC611.940.2813.470.2415.540.2811.130.206.260.22
MPI-ESM1-2HR9.840.2016.850.3511.630.216.440.214.640.46
MPI-ESM1-2LR8.030.2613.180.1814.090.398.190.284.810.27
MRI-ESM2-013.900.2712.630.208.800.2211.200.216.630.39
NorESM2-LM11.790.1613.060.3412.690.248.980.215.470.36
NorESM2-MM9.540.2016.440.2518.590.197.320.301.880.30
Table 4. Changes in radiation, wind speed, rainfall days, moderate rain days, and storm rain days during two future stages (2021–2050 and 2051–2080) relative to baseline period (1991–2020).
Meteorological FactorsSSP2-4.5 ScenarioSSP5-8.5 Scenario
2021–2050 Year2051–2080 Year2021–2050 Year2051–2080 Year
Absolute ChangeRate of Change (%)Absolute ChangeRate of Change (%)Absolute ChangeRate of Change (%)Absolute ChangeRate of Change (%)
Radiation/(MJ/m2/d)0.323.9%0.678.17%0.475.73%0.8510.37%
Wind speed/(m/s)0.041.71%0.093.85%0.010.04%−0.01−0.04%
Rainfall days/(day)22.47%3.314.08%3.444.25%8.9711.07%
Moderate rain days/(day)1.6515%1.6515%0.777%1.4913.55%
Rainstorm days/(day)0.7832.5%0.7732.08%0.3414.17%0.8133.75%
Disclaimer/Publisher’s Note: The statements, opinions and data contained in all publications are solely those of the individual author(s) and contributor(s) and not of MDPI and/or the editor(s). MDPI and/or the editor(s) disclaim responsibility for any injury to people or property resulting from any ideas, methods, instructions or products referred to in the content.

