Abstract
Red pears are appreciated for their abundant nutritional benefits and visually striking red hue, rendering them a favored option among consumers and stimulating substantial market demand. The present study employs the flesh of a red pear as the explant, subjecting the flesh callus to varying sugar sources, MS concentrations, light qualities, and temperatures to investigate the alterations in secondary metabolites, including anthocyanins, within the callus. It was found that sucrose can induce more anthocyanins, and its related metabolites and genes also increase as the sucrose and MS concentrations increase. Under the conditions of red-blue light and a temperature of 15 °C, it can further induce the production of more anthocyanins and secondary metabolites and can also upregulate the synthesis of anthocyanin-related genes. As such, this investigation serves to elucidate the factors that contribute to anthocyanin accumulation in red pears, thereby providing a theoretical foundation for understanding the mechanisms underlying color change.
1. Introduction
The process of coloration in most fruits involves the degradation of chlorophyll and the accumulation of anthocyanins, which are naturally occurring water-soluble pigments that are found in various plant tissues and organs [1,2]. Anthocyanins contribute to the red, purple, and blue colors that are observed in plants [3]. The specific coloration of a plant is influenced by various factors, including the type of anthocyanin present, the plant species, and environmental conditions such as light exposure [4]. Anthocyanins can play a crucial role in promoting fruit coloration, enhancing fruit quality, providing resistance to UV damage and pathogens, and improving resistance to adverse environmental conditions and challenges [5]. Furthermore, anthocyanins exhibit antioxidant properties and are capable of scavenging free radicals, thus slowing down the aging process [6]. Available evidence suggests that anthocyanins may also decrease the incidence of several chronic diseases, such as cardiovascular disease and type 2 diabetes, while enhancing visual function, memory, and preventing Alzheimer’s disease [7,8,9,10]. Consequently, increasing the anthocyanin content in fruits can effectively enhance their commercial value.
Researchers have demonstrated that the concentration and type of anthocyanins significantly influence the red coloration of pears [11]. There is a relatively limited number of red-skinned pear varieties in China, with even fewer cultivars exhibiting bright coloring, superior quality, and large fruit sizes [12]. Due to their vibrant coloration and diverse nutritional benefits, red pears have gained immense popularity and tremendous demand among consumers, thereby boosting the market value of this fruit [13]. According to the available literature on fruit germplasm resources, there are records of 652 pear varieties, only 10% of which comprise red-skinned cultivars, accounting for a total of 89 varieties [14]. However, abiotic and biotic stresses pose significant threats to the synthesis and stability of anthocyanins in pears, leading to their degradation at any point during plant growth and development even before harvest. In red pears, high temperatures can substantially contribute to anthocyanin degradation, which often results in the loss of pre-harvest reddening [15]. Thus, it is crucial to explore and investigate various factors that impact the synthesis and degradation of anthocyanins to better understand the underlying mechanisms and implications for improving the commercial value of red pears.
Anthocyanins possess superior antioxidant activity in comparison to other flavonoids, owing to the presence of oxygen atoms carrying a positive charge [16]. Wang et al. conducted a comparative analysis of the active components and antioxidant activity in the juices of four small berries including raspberry, blueberry, lingonberry, and Lonicera cerulea. The study revealed a positive correlation between the levels of polyphenols, anthocyanins, SOD (superoxide dismutase), total flavonoids, and the corresponding clearance rates [17]. The biosynthesis of floral pigments initiates from phenylalanine in the cytoplasm and undergoes sequential hydroxylation, glycosylation, methylation, and acylation modifications, ultimately leading to their accumulation in vacuoles [18]. This intricate process is tightly regulated by a combination of structural and regulatory genes. The biosynthesis of flavonoid glycosides, on the other hand, is controlled by several key structural genes encoding specific enzymes, including CHI (Chalcone Isomerase), CHS (Chalcone Synthase), F3H (Flavanone 3-Hydroxylase), PAL (Phenylalanine Ammonia Lyase), DFR (Dihydroflavonol-4-Reductase), ANS (Anthocyanidin Synthase), and UFGT (UDP-glucose: flavonoid 3-O-glucosyltransferase) [19,20].
To improve the biosynthesis and accumulation of anthocyanins, it is crucial to develop biotechnologies that are capable of regulating experimental environmental conditions effectively [21]. In this study, we utilize callus material to investigate the changes in anthocyanin content in red pear. Notably, tissue culture can be initiated under controlled conditions, irrespective of seasonal variations [22]. Therefore, we conducted an experiment with the aim of exploring how different conditions, including varied sugar sources, light sources, and temperatures, influence anthocyanin synthesis. Our findings can serve as a theoretical foundation for enhancing the anthocyanin accumulation in red pears, and hold potential for applications in agricultural production, such as the promotion of fruit coloration and the genetic variations of fruit color.
2. Materials and Methods
2.1. Different Treatments of Induced Callus Anthocyanins
Mature 90 d ‘Red Zao Su’ red pear, sourced from Chongzhou base of Sichuan Agricultural University, were thoroughly rinsed with running water for two hours. Subsequently, they were disinfected with 75% ethanol on a culture bench for 30 s, followed by a 20 min treatment with 2% sodium hypochlorite solution. Finally, the fruits were rinsed three times with sterile water. Subsequently, the mature ‘Red Zao Su’ red pear pulp was placed in MS (Murashige and Skoog, 1962) medium containing 1.0 mg·L−1 BA (6-Benzyladenine), 1.0 mg·L−1 2,4-D (2,4-Dichlorophenoxyacetic acid), agar 7.0 g·L−1, pH = 6.0. After 30 d, the grown callus was cut off and transferred to 1.0 mg·L−1 BA and 0.5 mg·L−1 NAA (Naphthaleneacetic acid) medium for 3 weeks in dark culture. An amount of 1.0 g of callus was transferred to MS medium with the same hormone ratios. In the context of callus culture, the following five treatments were performed, with all treatments using MS medium supplemented with 7 g·L−1, pH = 6.0, and a light cycle of 16/8 h:
1. Treatment with different sugars (sucrose, glucose, fructose, maltose, mannitol) at a concentration of 3% in MS medium, under white light conditions at 25 °C;
2. Treatment with different concentrations of sucrose (1%, 3%, 5%, 7%, 9%) in MS medium, under white light conditions at 25 °C;
3. Treatment with different concentrations of MS medium (MS, 1/2MS, 1/3MS, 1/5MS, 0MS) in the presence of 3% sucrose, under white light conditions at 25 °C;
4. Treatment with MS medium supplemented with 3% sucrose, under different light qualities (white, blue at 461 nm, red at 620 nm, and 50% red + 50% blue) at 25 °C;
5. Treatment with MS medium supplemented with 3% sucrose, under white light conditions at different temperatures and lighting conditions (15 °C light, 25 °C light, 15 °C dark, 25 °C dark).
The control treatment consisted of MS medium supplemented with 3% sucrose, exposed to white light at 25 °C with a light cycle of 16/8 h and an intensity of 2500 Lux. All callus tissues were sampled on the 15th day of treatment for subsequent analysis of secondary metabolites and RNA extraction. Each treatment had three biological repetitions and three technical repetitions. For each repetition, 1g of callus tissue was placed in a single Petri dish, resulting in a total of nine Petri dishes used for each treatment.
2.2. Determination of the Anthocyanin Content
To prepare the sample for analysis, the fresh red pear callus was pulverized using liquid nitrogen and a mortar and pestle. Subsequently, 0.1 g of the sample was transferred to a 1.5 mL centrifuge tube and blended with 1 mL of 0.1 mol·L−1 hydrochloric ethanol solution. The mixture was incubated in a water bath at 65 °C for 30 min, centrifuged at 12,000× g for 10 min at 4 °C, and the supernatant was collected for further use. The experiment was conducted with three replicates.
The absorbance values of anthocyanin extracts at 530 nm, 620 nm, and 650 nm were measured, with 0.1 mol ethanolic hydrochloric acid solution used as a blank control. To accurately calculate the anthocyanin absorbance values, Greey’s formula OD = (OD530 − OD620) − 0.1 × (OD650 − OD620) was used. The anthocyanin content was then determined using the following formula: anthocyanin content [μg·g−1(FW)] = OD/ε*V/m*M*103. Here, OD represents the anthocyanin absorbance value, whereas ε denotes the molar extinction coefficient of anthocyanin, measured as 4.62 × 10⁴. V represents the total volume of the extract (mL), m denotes the sample mass (g), and M represents the molar molecular weight of anthocyanin, measured as 287.24. Lastly, 103 signifies the conversion of the calculated result into μg [23].
2.3. Determination of Total Phenol and Total Flavonoids
The method by Singleton et al. [24] was used to determine the total phenols. A total of 200 μL of sample extract was combined with 1.8 mL of distilled water and 0.5 mL of Folin (Solarbio, Chengdu, China). After allowing the mixture to stand for 5 min at room temperature, 4 mL of a 15% sodium carbonate solution was added, and the absorbance of the extract was measured at a wavelength of 765 nm after standing for 1.5 h. The method by Kim et al. [25] was employed to determine the total flavonoids. An amount of 2 mL of sample extract was blended into 3.8 mL of distilled water, 0.6 mL of 5% NaNO2 solution, and 0.6 mL of 10% AlCl3 solution after standing for 5 min at ambient temperature. After another rest period of 6 min, 3 mL of 1 mol·L−1 NaOH solution was added. After a 15 min stand at ambient temperature, the absorbance was measured at 510 nm.
2.4. Determination of Antioxidant Activity
This analysis was based on the method by Barreca et al. [26]. To prepare the sample mixture, 0.1 mL of each extract was combined with 63 μmol·L−1 DPPH and 80% methanol, and the final volume was adjusted to 4.0 mL. The absorbance was determined at a wavelength of 517 nm following a 30 min incubation period. By following the method by Almeida et al. [27], the ABTS solution was prepared by combining 25 mL of 7 mol·L−1 ABTS solution with 440 μL of 140 mol·L−1 potassium persulfate solution. The solution was allowed to react for 12–16 h. The ABTS solution was subsequently diluted with ethanol to an absorbency value of 0.7 ± 0.02. A sample volume of 0.1 mol·L−1 was collected, and 4.9 m·L−1 ABTS was mixed with it for 10 min prior to detection at 734 nm. The method by Jang et al. [28] was used to conduct the FRAP assay. Specifically, 0.1 mL of callus extract was mixed with the FRAP reagent and deionized water. After a 30 min incubation period, the absorbance was measured at 593 nm. Results were compared to a standard curve generated using a Trolox standard solution.
2.5. RNA Extraction
The RNA extraction was carried out using the modified CTAB method by Chen et al. [29]. The extracted RNA solution was taken, its concentration and OD value were determined via protein-nucleic acid assay, and the purity of RNA was judged based on the ratio of OD260/280 as well as OD260/230. The integrity of RNA was detected via 1.0% agarose gel electrophoresis.
2.6. Design and Synthesis of the Primers
Based on the cloned gene sequences, a pair of specific quantitative primers (Table 1) was designed using SnapGene® 1.3.2 software while using the Pyrus bretschneideri Rehd Actin gene as the internal reference gene, and the primer sequences were sent to Sangong Biotech (Shanghai, China). ‘Red Zao Su’ is a red bud sport variety derived from ‘Zao Su’ and belongs to the white pear (Pyrus bretschneideri Rehd). Therefore, the genetic sequence of white pear was utilized.

Table 1.
Design of primers for gene quantification.
2.7. cDNA Compose
The synthesis of the first strand of cDNA was performed according to the TakaRa PrimeScxipeTM (China, Shanghai) reagent kit with gDNA Erasex (PRT) for PCR instruction manual. The PCR procedure was as follows: 42 °C for 2 min (or 5–30 min at ambient temperature); lower the temperature to 40 °C and remove for reverse transcription (operated on ice).
2.8. Related Gene Expression Determination
In a 0.5 mL thin-walled PCR reaction tube, qPCR reaction solution was added sequentially, gently mixed, transiently centrifuged and then placed in a fluorescence quantification instrument for amplification. The reaction procedure consisted of pre-denaturation at 94 °C for 5 min, followed by 35 cycles of denaturation at 94 °C for 40 s, annealing at 58 °C for 40 s, and extension at 72 °C for 1 min. The reaction was completed with a final extension at 72 °C for 10 min.
2.9. Statistics and Analysis
Proliferation rate = (final fresh weight-initial fresh weight)/initial fresh weight.
IBM SPSS Statistics 20.0 was used to identify significant differences between treatments (p < 0.05). Subsequently, the data were processed and graphed using Microsoft Excel software and Origin 2023.
3. Results
3.1. Effect of Different Sugar Sources on the Callus
The sucrose treatment resulted in the highest anthocyanin content of 52.97 μg·g−1, followed by glucose and fructose, which induced similar levels of anthocyanin content. The anthocyanin content induced by the mannitol treatment was the lowest at only 34.80 μg·g−1 (Figure 1a). The sucrose treatment had the most significant impact on the callus proliferation rate, which was observed to be lower under maltose and mannitol treatments (Figure A1). The highest total phenol and total flavonoid contents of the callus were recorded under the sucrose, glucose, and fructose treatments, with no significant differences observed among them. Conversely, the lowest total phenol and total flavonoid contents were observed under the maltose and mannitol treatments (Figure 1b,c). In terms of the antioxidant capacity, the DPPH, ABTS, and FRAP values were highest for the sucrose treatment, followed by fructose and glucose, and then the mannitol and maltose treatments (Figure 1d–f).
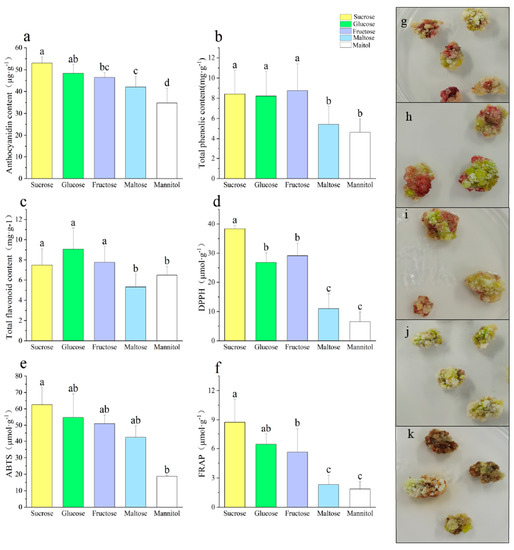
Figure 1.
Effects of different sugar sources on callus secondary metabolites ((a) anthocyanin content, (b) total phenolic content, (c) total flavonoid content, (d) DPPH, (e) ABTS, (f) FRAP, (g) sucrose, (h) glucose, (i) fructose, (j) maltose, (k) mannitol). Note: Normal letters in every column indicate significant differences at 0.05 level by Duncan’s multiple range test.
Carbohydrates are known to be the primary drivers of plant metabolism, growth, and development [30]. Sugar uptake is critical for plant growth and development in tissue culture [31]. The results of this study are consistent with those of previous findings [32], demonstrating a strong correlation between all phenolics and antioxidant activity. The hydroxyl groups of phenolics are known to combat free radicals, making it a valuable antioxidant [33]. Different sugars have varying roles in anthocyanin biosynthesis, with sucrose playing the most significant regulatory role [34]. In a study by Kumar et al. [35], cotton hypocotyls were cultured in different sugar sources, and it was found that the sucrose and fructose cultures had a high phenolic content in the callus, while maltose reduced the phenolic content of the callus. Similarly, radish sprouts were also treated with different types of sugars, and the results show that sucrose treatment resulted in the highest anthocyanin content, followed by fructose, mannitol, and glucose [36]. Some sugars, such as sucrose, glucose, or mannitol, were shown to promote anthocyanin accumulation [37].
Through an analysis of the genes involved in anthocyanin synthesis, it was observed that PAL expression was lower in sucrose, fructose, and glucose compared to mannitol and maltose. Notably, PAL expression was the highest in the mannitol treatment, being ten times greater than that observed in the fructose treatment, which showed an opposing trend to the anthocyanin content (Figure 2a). The expressions of both CHS and DFR were similar, exhibiting little difference in the sucrose, fructose, and glucose, but both were significantly higher than the maltose and mannitol treatments (Figure 2b,e). Among all treatments, fructose exhibited the highest expression of CHI (Figure 2b). Both F3H and ANS displayed similar trends, with the highest expression observed under sucrose treatment, followed by glucose and fructose, with the first three treatments being significantly higher than maltose and mannitol (Figure 2d,f). The expressions of UFGT and MYB10 were the highest under mannitol treatment, being roughly twice as high as those observed for other treatments (Figure 2g,h). These results suggest that saccharides may increase anthocyanin levels by upregulating the expression levels of CHS, F3H, DFR, and ANS. Sugars are known to regulate the majority of the structural and regulatory genes involved in flavonoid metabolic pathways, including PAL, CHS, DFR, and UFGT [38]. Dai et al. [39] found that saccharides, acting as a carbon source, can enhance the accumulation of anthocyanin in cultures by directly affecting both anthocyanin regulation and the expression of various structural genes (such as CHS, CHI, F3H, DFR, LAR, LDOX, and ANR), while simultaneously decreasing the phenylalanine content.
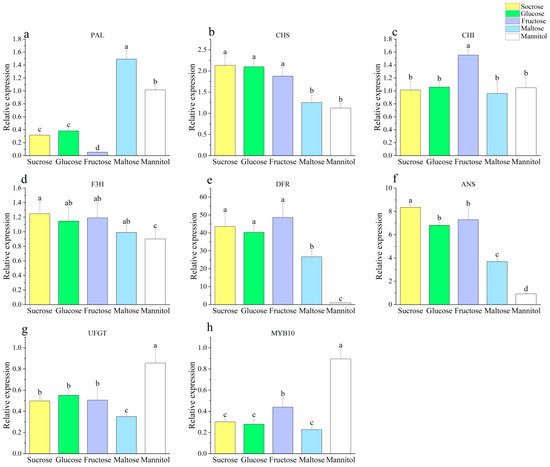
Figure 2.
Effect of different sugar sources on the callus anthocyanin gene ((a) PAL, (b) CHS, (c) CHI, (d) F3H, (e) DFR, (f) ANS, (g) UFGT, (h) MYB10). Note: Normal letters in every column indicate significant differences at 0.05 level by Duncan’s multiple range test.
3.2. Effect of Different Sucrose Concentrations on the Callus
We chose to use sucrose for our sugar concentration studies because it induced both anthocyanins and maximized the growth of the callus. An increase in the sucrose concentration led to an increase in anthocyanin content, with the highest anthocyanin content of 75.54 μg·g−1 being achieved with 9% sucrose treatment (Figure 3a). The callus proliferation rate increased initially and then decreased with the increase in the sucrose concentration, with the callus proliferation rate reaching its highest value under 5% sucrose treatment (Figure A2). Similar patterns were observed in the total phenol and total flavonoid contents as well as the antioxidant indicators, compared to the trends observed for the anthocyanin levels under different sucrose concentration treatments (Figure 3b–f). Specifically, an increase in the sucrose concentration resulted in a gradual rise in both the total phenol and total flavonoid contents, as well as in the antioxidant capacity. Sarmadi et al. [40] treated yew callus with different concentrations of glucose and found that the callus browning became more severe with an increasing glucose concentration, while the phenols and flavonoids also increased significantly. An increase in the sucrose concentration also resulted in an increased phenolic content in willow and camptotheca [41,42]. According to Ram et al. [43], rose callus was found to exhibit a rich reddish hue and a significant accumulation of anthocyanins when cultured with a sucrose content of 6–7% in the medium. It was also found that anthocyanins were induced in dandelion callus under 5.5% sucrose culture [22].
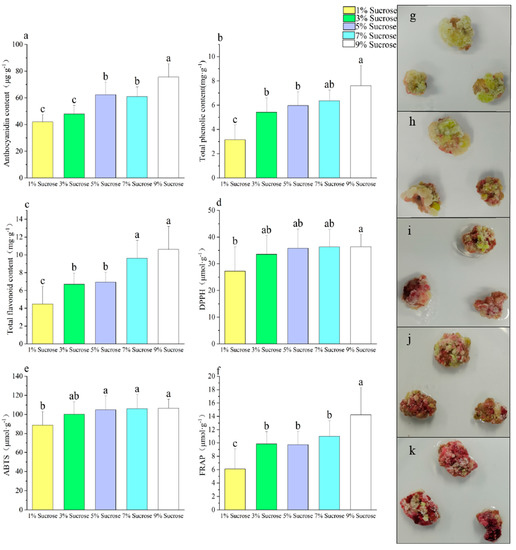
Figure 3.
Effect of different sucrose concentrations on callus secondary metabolites ((a) anthocyanin content, (b) total phenolic content, (c) total flavonoid content, (d) DPPH, (e) ABTS, (f) FRAP, (g) 1% sucrose, (h) 3% sucrose, (i) 5% sucrose, (j) 7% sucrose, (k) 9% sucrose). Note: Normal letters in every column indicate significant differences at 0.05 level by Duncan’s multiple range test.
A gradual upregulation in the expression of PAL, CHS, CHI, F3H, DFR, and ANS was observed with the increasing sucrose concentration (Figure 4a–f). Studies conducted on plant species such as petunia and chrysanthemum revealed that the expression of relevant genes was found to be positively correlated with increasing concentrations of sucrose in the medium [44,45]. It was proposed that sucrose plays a key role in regulating the expression of biosynthetic genes involved in anthocyanin production, thereby leading to an increase in the production of these pigments [46]. Studies have demonstrated that the addition of exogenous sucrose to the growth medium can lead to a marked increase in the transcript levels of DFR and LDOX genes [47,48].
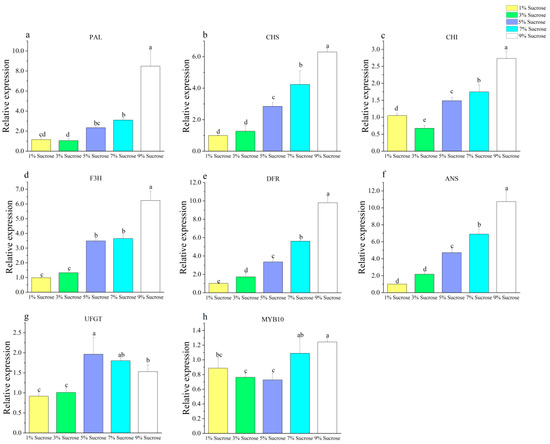
Figure 4.
Effect of different sucrose concentrations on callus anthocyanin genes ((a) PAL, (b) CHS, (c) CHI, (d) F3H, (e) DFR, (f) ANS, (g) UFGT, (h) MYB10). Note: Normal letters in every column indicate significant differences at 0.05 level by Duncan’s multiple range test.
3.3. Effect of Different MS Concentrations on the Callus
As depicted in Figure 5a, a decrease in the concentration of MS in the growth medium resulted in a gradual increase in the anthocyanin content, with the highest level of 86.42 μg·g−1 being achieved in the absence of MS supplementation. The total phenolic content was the lowest under MS and 1/2 MS treatment, and as the MS concentration decreased, the total phenolic content gradually increased, with the highest value of 13.79 mg·g−1 observed in the medium without the addition of MS (Figure 5b). The highest level of total flavonoids was observed under 0MS treatment, followed by 1/3MS and 1/5MS, and the lowest level was observed under MS treatment (Figure 5c). Similar trends were observed for the three indicators of antioxidant capacity (Figure 5d–f). The results indicate that the deficiency of certain nutrients can stimulate the production of secondary metabolites and enhance the antioxidant capacity in callus cultures, as evidenced by the data obtained in this study. Despite the increase in the anthocyanin content achieved through nutrient deficiency, it was observed that the growth of callus was negatively impacted, as depicted in Figure A3, indicating the need to find a relatively reasonable concentration to increase anthocyanin production when nutrient deficiency is used. According to previous studies [49], nutrient deficiencies, particularly in nitrogen, phosphorus, and sulfur, can cause an accumulation of anthocyanins as a mechanism to prevent physiological disorders that arise from the excessive accumulation of carbohydrates in tissues. Furthermore, Landi et al. [50] reported that anthocyanins play a pivotal role in preventing premature aging in plants that are subjected to mineral deficiencies like nitrogen or phosphorus deficit. Simões et al. [51] lowered the MS salt concentration to a quarter, which increased the anthocyanin content of rose calli. Studies conducted on various plant species, including Arabidopsis, tomato, tobacco, rose, and grape plants, have demonstrated that a nitrogen deficiency can trigger a substantial increase in the anthocyanin accumulation [43,52]. At lower concentrations of growth compounds (NH4NO3 and KNO3), inhibitory effects on anthocyanin production can be effectively reversed [53]. When there is a nitrogen deficiency, the amount of sugar used to form amino acids decreases, and more sugars are used to form more anthocyanins, resulting in a red coloration [54].
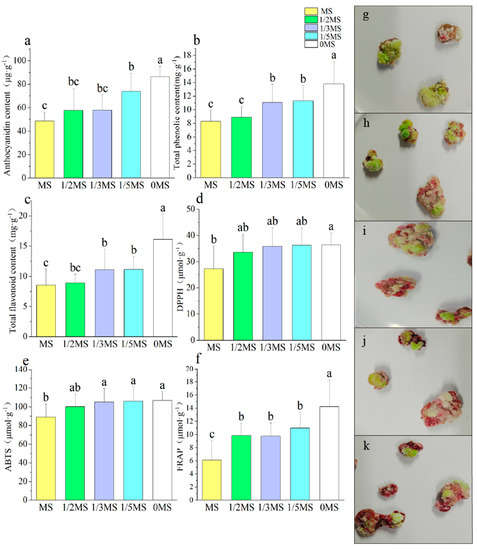
Figure 5.
Effect of different MS concentrations on callus secondary metabolites ((a) anthocyanin content, (b) total phenolic content, (c) total flavonoid content, (d) DPPH, (e) ABTS, (f) FRAP, (g) MS, (h) 1/2MS, (i) 1/3MS, (j) 1/5MS, (k) 0MS). Note: Normal letters in every column indicate significant differences at 0.05 level by Duncan’s multiple range test.
The expressions of PAL, CHS, CHI, and DFR all showed a progressive increase with the decreasing MS concentration (Figure 6a–c,e), while the expressions of F3H and ANS were the highest at 1/2MS and 0MS treatment (Figure 6d,f). The expression of UFGT was the highest at 0MS (Figure 6g), and the other treatments had little effect on UFGT. It was established that nutrient deficiency is a key factor that can induce significant anthocyanin accumulation in plants, with the concomitant upregulation of genes being responsible for anthocyanin synthesis, as reported by Li et al. [55]. In this experiment, the expressions of PAL, CHS, CHI, and DFR showed similar trends to the anthocyanin content. Huang et al. [56] suggested that PAL is critical in the synthesis of anthocyanins starting from deamination.
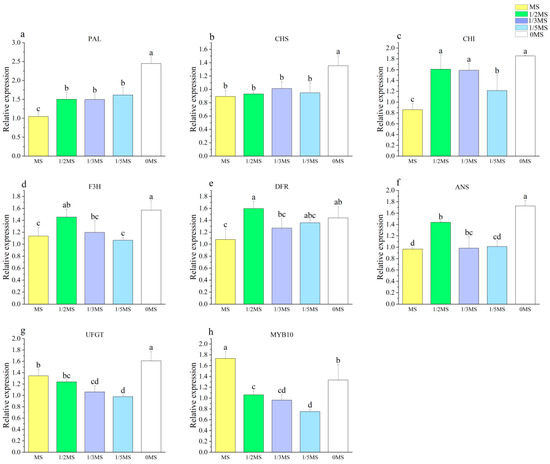
Figure 6.
Effect of different MS source concentrations on the callus anthocyanin gene ((a) PAL, (b) CHS, (c) CHI, (d) F3H, (e) DFR, (f) ANS, (g) UFGT, (h) MYB10). Note: Normal letters in every column indicate significant differences at 0.05 level by Duncan’s multiple range test.
3.4. Effect of Different Light Qualities on the Callus
Under red-blue light, the callus showed the highest content of anthocyanins at 83.21 μg·g−1, while the lowest content was 43.95 μg·g−1 under white light (Figure 7a). The callus growth was faster under white and red-blue lights, but slower under red and blue lights (Figure A4). The total phenolic content was also the highest under red-blue light and the lowest under white light (Figure 7b). The flavonoid content was the highest under red-blue light, while the remaining differences in the flavonoid content between red, white, and blue lights were not significant (Figure 7c). Similar trends were also found in the detection of antioxidant capacity, as with substances such as anthocyanins (Figure 7d–f). Overall, a correlation between anthocyanins and total phenols, total flavonoids, and antioxidant capacity was observed.
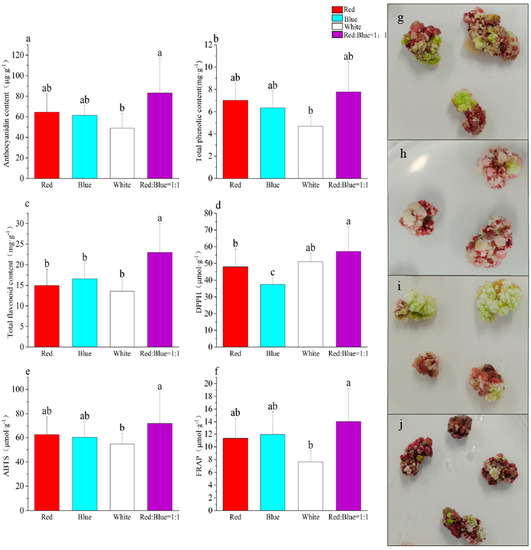
Figure 7.
Effect of different light qualities on callus secondary metabolites ((a) anthocyanin content, (b) total phenolic content, (c) total flavonoid content, (d) DPPH, (e) ABTS, (f) FRAP, (g) red, (h) blue, (i) white, (j) red/blue = 1:1). Note: Normal letters in every column indicate significant differences at 0.05 level by Duncan’s multiple range test.
Different wavelengths of light have varying effects on plant growth, and light is crucial for the formation of anthocyanins in most plants [57]. Several research studies have suggested that specific light sources have the capacity to directly stimulate the synthesis of critical secondary metabolites, such as flavonoids, caffeic acid derivatives, artemisinins, and anthocyanins [58,59,60]. Fazal et al. [61] reported that in prunella, while yellow light was found to be the optimal light source for maximum biomass accumulation in leaf explants, violet light was the most effective for promoting biomass accumulation in petiole explants. Additionally, blue light was found to be the ideal light condition for inducing the highest total phenolic content and total flavonoid content in callus growth. Stevia rebaudiana exhibited elevated levels of total phenolic content, total flavonoid content, and overall antioxidant capacity in callus cultures exposed to blue light, whereas green and red lights enhanced the reducing power (RPA) and DPPH free radical scavenging activity [62]. Blue and red lights increased the phenolic and flavonoid contents, respectively, in the callus of Ocimum; blue light increased rosemary acid and eugenol, while citric acid increased under continuous white light, and anthocyanins increased under red light [63]. Blueberry root callus exhibited the greatest concentration of anthocyanins when cultivated under red light, showing approximately a five-fold increase compared to conditions of darkness [64]. Purple basil demonstrated optimal growth, as well as increased levels of biomass, total phenolic content, total flavonoid content, and antioxidant activities (DPPH, FRAP, and ABTS) when exposed to blue light [65]. The application of red-blue light to Dendrobium callus led to an enhancement in both the dry weight and the levels of secondary metabolites, specifically phenolic and flavonoid compounds. Conversely, white light exposure stimulated the production of phenolphthalein [66]. Similarly to our findings, the use of red-blue light had a beneficial effect on callus growth and the accumulation of secondary metabolites [67].
The expressions of PAL and DFR were lower in the red light treatment than in the other treatments (Figure 8a,e). Under both red and blue light treatments, the expressions of ANS and CHI were comparatively lower than the other two treatments (Figure 8c,f). Nevertheless, the red light treatment resulted in an increased expression of MYB10 and CHS (Figure 8b,h). Conversely, both the blue and white light treatments notably decreased the expression of CHS and MYB10 compared to the other treatments (Figure 8b,h). On the other hand, the white light treatment led to the lowest expression of F3H, whereas the blue light treatment enhanced the expression of F3H. These findings suggest that the signaling pathways involved in anthocyanin regulation may vary between blue light and white light conditions (Figure 8d). Under the combined influence of red-blue light, PAL, CHS, CHI, ANS, UFGT, and MYB10 exhibited the highest levels of expression, confirming the positive effect of red-blue light on anthocyanin content promotion. In kiwifruit, it was observed that the presence of red light led to a reduction in the anthocyanin content, along with the inhibition of key genes involved in anthocyanin synthesis, including CHS, DFR, ANS, UFGT, and CRY. On the other hand, blue light effectively increased the accumulation of anthocyanin in callus cultures and resulted in enhanced expression levels of genes such as CHS, F3H, DFR, CHI, UFGT, CRY, and F3′H [68]. In eggplant, the exposure to white light containing UV light resulted in an increase in the anthocyanin levels, CHS, and DFR [69]. Similarly, blue light was observed to elevate the expression levels of MYB, DFR, ANS, and UFGT genes in purple pepper [70]. It is worth noting that different plant species exhibit varying pathways induced by different light qualities. For instance, in lettuce, the genes CHI, F3H, DFR, and ANS are also induced by red-blue light [67].
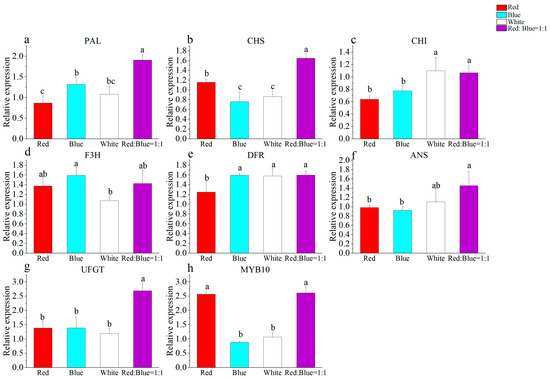
Figure 8.
Effect of different light matter on anthocyanin synthesis genes ((a) PAL, (b) CHS, (c) CHI, (d) F3H, (e) DFR, (f) ANS, (g) UFGT, (h) MYB10). Note: Normal letters in every column indicate significant differences at 0.05 level by Duncan’s multiple range test.
3.5. Effect of Different Temperatures on Callus under Light
The light treatment at 15 °C exhibited the highest anthocyanin content, while the differences in the dark treatments at 25 °C and 15 °C were not significant but significantly lower than the light treatment (Figure 9a). The dark treatment at 25 °C resulted in the highest rate of callus proliferation, which was significantly higher than the rate under the light treatment. However, the growth amount was inhibited by the low temperature (Figure A5). The 15 °C light treatment showed the highest total phenolic content, whereas the lowest content was observed in the dark 25 °C treatment (Figure 9b). There was no significant difference in the flavonoid content between the dark treatments at 25 °C and 15 °C, while the light treatment at 15 °C exhibited a higher flavonoid content than the light treatment at 25 °C (Figure 9c). The antioxidant capacity indicators demonstrated similar trends to that of anthocyanins, total phenols, and total flavonoids (Figure 9d–f). Based on these findings, it can be concluded that light effectively increases the content of secondary metabolites in callus, and a low temperature also contributes to the increase in the secondary metabolite content.
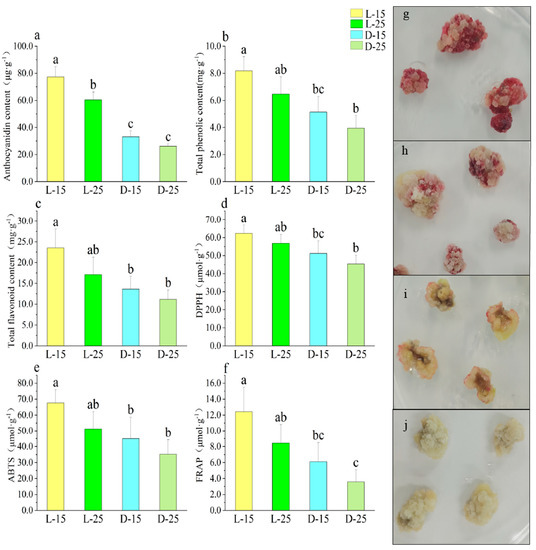
Figure 9.
Effect of different light temperatures on callus secondary metabolites ((a) anthocyanin content, (b) total phenolic content, (c) total flavonoid content, (d) DPPH, (e) ABTS, (f) FRAP, (g) light 15 °C, (h) light 25 °C, (i) dark 15 °C, (j) dark 25 °C). Note: Normal letters in every column indicate significant differences at 0.05 level by Duncan’s multiple range test.
According to Simões et al. [51], the optimal temperature for anthocyanin production in rose callus was found to be 24 ± 2 °C, as higher temperatures led to the browning of the callus. Grass coral callus demonstrated the fastest growth at temperatures within the range of 23–28 °C, while severe damage occurred at both 15 °C and 32 °C. The highest production of flavonoids was observed at 26 °C [71]. In potato callus culture, the anthocyanin content was lower at 4 °C compared to 25 °C, indicating that low temperatures negatively affected callus growth [72]. Optimal temperatures for anthocyanin biosynthesis in carrot callus cultures were determined to be 30 °C (in solid medium) and 25 °C (in liquid medium) [73]. Light exerts a crucial influence on primary and secondary metabolism, as well as various developmental processes in plants [74]. It is a pivotal physical factor, and the quality of light significantly impacts photosynthesis and morphogenesis, ultimately modulating plant growth and development [75]. Temperature also plays a vital role in influencing the secondary metabolism yield, and specific temperature requirements must be carefully regulated at different stages of plant tissue culture based on the specific needs of the cultivated tissues [76].
Light increased the expression of PAL and UFGT (Figure 10a,g), whereas the CHS, CHI, F3H, and DFR expression levels were all higher at 15 °C than at 25 °C under the treatment (Figure 10b–e). The expressions of ANS, UFGT, and MYB10 were highest in light at 15 °C, while in light at 25 °C and in the dark at 15 °C, the expressions of ANS and MYB10 did not differ much but were still higher than in the dark at 25 °C (Figure 10f–h). The synergistic effect of light and a low temperature may lead to the upregulation of these genes, which, in turn, regulates anthocyanin synthesis. Previous studies have demonstrated that higher temperatures lead to the downregulation of anthocyanin biosynthesis genes, including CHS, DFR, LDOX, UFGT, and MYB10. This downregulation is consistent with the increased expression of genes such as MYB15 [77]. In apple callus cultures, the interplay of light and temperature was observed. It was noted that under light conditions, low temperatures (16 °C) led to the upregulation of regulatory and structural genes, including CHI, F3H, CHS, DFR, UFGT, and MYB10. On the other hand, high temperatures (32 °C) induced the expression of MYB16, which had a detrimental impact on anthocyanin biosynthesis [76]. Previous studies have shown that the exposure to low temperatures can significantly stimulate the expression of CHS in Arabidopsis and in red orange [78,79]. Similarly, African chrysanthemums exhibited higher levels of CHS, F3H, and ANS expression at all developmental stages when subjected to a temperature of 6 °C compared to 22 °C [80]. These findings collectively emphasize the beneficial role of light and low temperature in regulating the production of anthocyanins.
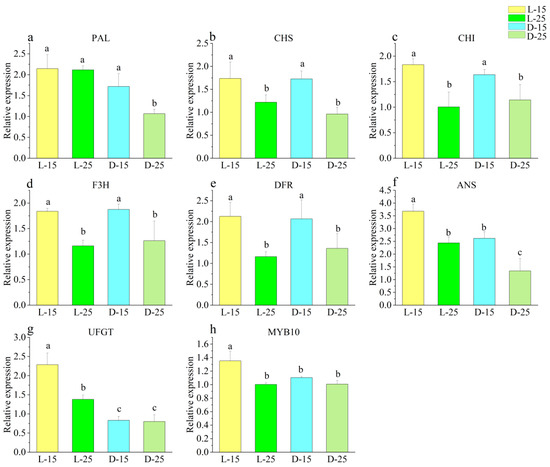
Figure 10.
Effect of different light temperatures on anthocyanin synthesis genes ((a) PAL, (b) CHS, (c) CHI, (d) F3H, (e) DFR, (f) ANS, (g) UFGT, (h) MYB10). Note: Normal letters in every column indicate significant differences at 0.05 level by Duncan’s multiple range test.
3.6. Correlation Analysis of Different Treatments
From Table 2, it can be observed that there is a positive correlation among anthocyanins, total phenols, total flavonoids, and antioxidant index in all treatments. In some treatments, the positive correlation is even statistically significant. This indicates that despite the variations in the experimental conditions, the regulatory mechanisms and interactions among these substances remain relatively consistent. Interestingly, the treatments with different sugar sources showed a strong positive correlation between the callus accumulation rate and anthocyanin production. However, most of the other treatments exhibited negative correlations. This suggests that, in most cases, as the anthocyanin content increases, the growth rate of the callus tissue decreases. Moreover, genes involved in anthocyanin synthesis exhibited different correlations under various conditions. In the treatments with different sugar sources, it was found that CHS, F3H, DFR, and ANS showed a significant positive correlation with the anthocyanin content. In the treatments with different sugar concentrations, PAL, CHS, CHI, F3H, DFR, and ANS were significantly correlated with the anthocyanin content. However, in the treatments with different MS medium concentrations, only PAL showed a significant positive correlation. Under different light qualities, only F3H exhibited a positive correlation with the anthocyanin content. Similarly, in the treatments with different temperature and lighting conditions, only UFGT showed a significant positive correlation. These results indicate that a wide range of genes or regulatory pathways are involved in influencing anthocyanin synthesis. Different factors may utilize different genes to regulate this process, which warrants further investigation.
Table 2.
Correlation analysis of different treatments.
4. Conclusions
Plants serve as a significant source of secondary metabolites, which possess diverse roles in human welfare, including therapeutic implications. However, the yield of secondary metabolites obtained from natural populations of plants is insufficient to meet commercial demands due to their limited accumulation [81]. Various in vitro culture techniques, including callus, hairy root, shoot, and suspension cultures, can be utilized to enhance the biosynthesis of specific metabolites in commercially important plants [82]. Among these techniques, callus culture is regarded as a promising approach for the biosynthesis of bioactive compounds in endangered species of most medicinal plants [83]. The secondary metabolites derived from Dendrobium officinale exhibit pharmacological efficacy in alleviating acute alcoholic liver injury [84]. The secondary metabolites of plants, such as terpenoids, lignans, polyphenols, phenolic acids, alkaloids, lactones, and flavonoids, exhibit anti-HBV activity. These natural anti-HBV products can be considered as potential lead compounds or candidate drugs [85]. Fruit trees typically have a prolonged growth cycle, which, combined with the arduous and time-intensive process of inducing their metabolites and validating their gene functions, can present a substantial challenge. Nonetheless, tissue culture presents a viable solution to address this problem, offering a more efficient and effective means of analysis. The present study aims to establish an efficient approach for boosting the production of anthocyanins in the callus of pear fruit by subjecting it to various treatments. The results demonstrate that the composition and concentration of sugar, MS content, light quality, and temperature have a significant impact on the synthesis of secondary metabolites, including anthocyanins in red pear callus. Importantly, these phenolics were found to be closely associated with antioxidant capacity. Further, the analysis of genes related to anthocyanin synthesis was carried out, unveiling the intrinsic factors influencing the process under varying conditions. Overall, these findings provide a roadmap for natural anthocyanin production in red pear fruit, along with their potential applications in agricultural production, such as the promotion of fruit color and genetic variation studies in fruit color.
Author Contributions
Visualization, W.Y., Y.W., Y.L. (Ya Luo) and X.W.; writing—original draf, W.Y.; Validation, D.L.; investigation, X.Z., H.W., Y.Z. (Yunting Zhang), M.L. and W.H.; methodology, X.Z. and J.L.; data curation, H.W.; formal analysis, Y.L. (Yuanxiu Lin); software, Q.C.; project administration, H.T.; writing—review and editing, Y.Z. (Yong Zhang); conceptualization, Y.Z. (Yong Zhang); funding acquisition, Y.Z. (Yong Zhang). All authors have read and agreed to the published version of the manuscript.
Funding
This work was supported by grants from the Science and Technology Plan Project of Sichuan Province (Grant No. 2021YFYZ0023-03) and the Double Support Project of Discipline Construction of Sichuan Agricultural University (03573134).
Data Availability Statement
Data is contained within the article. The data presented in this study are available in Appendix A.
Conflicts of Interest
All authors declare that they have no conflict of interest.
Appendix A

Figure A1.
Effect of different sugar sources on the proliferation rate of callus. Note: Normal letters in every column indicate significant differences at 0.05 level by Duncan’s multiple range test.

Figure A2.
Effect of different sucrose concentrations on the proliferation rate of the callus. Note: Normal letters in every column indicate significant differences at 0.05 level by Duncan’s multiple range test.

Figure A3.
Effect of different MS concentrations on the proliferation rate of the callus. Note: Normal letters in every column indicate significant differences at 0.05 level by Duncan’s multiple range test.

Figure A4.
Effect of different light quality on the proliferation rate of the callus. Note: Normal letters in every column indicate significant differences at 0.05 level by Duncan’s multiple range test.

Figure A5.
Effect of different temperature illumination on the proliferation rate of callus.Note: Normal letters in every column indicate significant differences at 0.05 level by Duncan’s multiple range test.
Table A1.
Reagent information.
Table A1.
Reagent information.
| Reagent | Catalog Number | Company | Country |
|---|---|---|---|
| NAA | N600 | Phyto Tech | United States |
| 2,4-D | D299 | Phyto Tech | United States |
| 6-BA | B800 | Phyto Tech | United States |
| MS Medium | M519 | Phyto Tech | United States |
References
- Kapoor, L.; Simkin, A.J.; George Priya Doss, C.; Siva, R. Fruit ripening: Dynamics and integrated analysis of carotenoids and anthocyanins. BMC Plant Biol. 2022, 22, 27. [Google Scholar] [CrossRef] [PubMed]
- Wang, L.; Yang, S.; Ni, J.; Teng, Y.; Bai, S. Advances of anthocyanin synthesis regulated by plant growth regulators in fruit trees. Sci. Hortic. 2023, 307, 111476. [Google Scholar] [CrossRef]
- Sun, L.P.; Huo, J.T.; Liu, J.Y.; Yu, J.Y.; Zhou, J.L.; Sun, C.D.; Wang, Y.; Leng, F. Anthocyanins distribution, transcriptional regulation, epigenetic and post-translational modification in fruits. Food Chem. 2023, 411, 135540. [Google Scholar] [CrossRef] [PubMed]
- Sheng, J.; Chen, X.; Song, B.; Liu, H.; Li, J.; Wang, R.; Wu, J. Genome-wide identification of the MATE gene family and functional characterization of PbrMATE9 related to anthocyanin in pear. Hortic. Plant J. 2023. [Google Scholar] [CrossRef]
- Qu, S.S.; Li, M.M.; Wang, G.; Yu, W.T.; Zhu, S.J. Transcriptomic, proteomic and LC-MS analyses reveal anthocyanin biosynthesis during litchi pericarp browning. Sci. Hortic. 2021, 289, 110443. [Google Scholar] [CrossRef]
- Jo, K.; Bae, G.Y.; Cho, K.; Park, S.S.; Suh, H.J.; Hong, K.B. An anthocyanin-enriched extract from Vaccinium uliginosum improves signs of skin aging in UVB-Induced photodamage. Antioxidants 2020, 9, 844. [Google Scholar] [CrossRef]
- Xu, L.; Tian, Z.; Chen, H.; Zhao, Y.; Yang, Y. Anthocyanins, Anthocyanin-Rich Berries, and Cardiovascular Risks: Systematic Review and Meta-Analysis of 44 Randomized Controlled Trials and 15 Prospective Cohort Studies. Frontiers in Nutrition, An Anthocyanin-Enriched Extract from Vaccinium Uliginosum Improves Signs of Skin Aging in UVB-Induced Photodamage. Antioxidants 2021, 8, 747884. Available online: https://www.frontiersin.org/articles/10.3389/fnut.2021.747884 (accessed on 1 January 2023).
- Li, B.; Wang, L.; Bai, W.; Chen, W.; Chen, F.; Shu, C. Biological Activity of Anthocyanins. In Anthocyanins; Springer: Singapore, 2021. [Google Scholar] [CrossRef]
- Nomi, Y.; Iwasaki-Kurashige, K.; Matsumoto, H. Therapeutic effects of anthocyanins for vision and eye health. Molecules 2019, 24, 3311. [Google Scholar] [CrossRef]
- Silva, S.; Costa, E.M.; Mendes, M.; Morais, R.; Calhau, C.; Pintado, M. Antimicrobial, antiadhesive and antibiofilm activity of an ethanolic, anthocyanin-rich blueberry extract purified by solid phase extraction. J. Appl. Microbiol. 2016, 121, 693–703. [Google Scholar] [CrossRef]
- Cao, X.Y.; Sun, H.L.; Wang, X.Y.; Li, W.X.; Wang, X.Q. ABA signaling mediates 5-aminolevulinic acid-induced anthocyanin biosynthesis in red pear fruits. Sci. Hortic. 2022, 304, 111290. [Google Scholar] [CrossRef]
- Du, Y.; Qu, B.; Li, R. Research progress on red pear resources and fruit coloring mechanism in China. J. Agric. Yanbian Univ. 2021, 43, 98–107. (In Chinese) [Google Scholar] [CrossRef]
- Tao, R.; Yu, W.; Gao, Y.; Ni, J.; Yin, L.; Zhang, X.; Li, H.; Wang, D.; Bai, S.; Teng, Y. Light-Induced Basic/Helix-Loop-Helix64 Enhances Anthocyanin Biosynthesis and Undergoes Constitutively Photomorphogenic1-Mediated Degradation in Pear. Plant Physiol. 2020, 4, 1684–1701. [Google Scholar] [CrossRef] [PubMed]
- Jia, J.X. Catalogue of Fruit Germplasm Resources (First 1); Agricultural Press: Beijing, China, 1993; pp. 22–49. (In Chinese) [Google Scholar]
- Steyn, W.J.; Holcroft, D.M.; Wand, J.E.S.; Jacobs, G. Anthocyanin degradation in detached pome fruit with reference to preharvest red color loss and pigmentation patterns of blushed and fully red pears. J. Am. Soc. Hortic. Sci. 2004, 129, 13–19. [Google Scholar] [CrossRef]
- Kong, J.M.; Chia, L.S.; Goh, N.K.; Chia, T.F.; Brouillard, R. Analysis and biological activities of anthocyanins. Phytochemistry 2003, 64, 923–993. [Google Scholar] [CrossRef]
- Wang, C.; Gan, Q.; Meng, F.; Yang, J.; Yan, H.; Jiang, X. Active Components and Antioxidant Activities of Four Kinds Small Berry Juices. Sci. Technol. Food Ind. 2019, 40, 71–76. [Google Scholar] [CrossRef]
- Quattrocchio, F.; Wing, J.F.; Leppen, H.; Mol, J.; Koes, R.E. Regulatory Genes Controlling Anthocyanin Pigmentation Are Functionally Conserved among Plant Species and Have Distinct Sets of Target Genes. Plant Cell 1993, 5, 1497–1512. [Google Scholar] [CrossRef]
- Winkelshirley, B. Flavonoid Biosynthesis. A Colorful Model for Genetics, Biochemistry, Cell Biology, and Biotechnology. Plant Physiol. 2001, 126, 485–493. [Google Scholar] [CrossRef] [PubMed]
- Wu, X.; Liu, Z.; Liu, Y.; Wang, E.; Zhang, D.; Huang, S.; Li, C.; Zhang, Y.; Chen, Z.; Zhang, Y. SlPHL1 is involved in low phosphate stress promoting anthocyanin biosynthesis by directly upregulation of genes SlF3H, SlF3′H, and SlLDOX in tomato. Plant Physiol. Biochem. 2023, 200, 107801. [Google Scholar] [CrossRef]
- Belwal, T.; Singh, G.; Jeandet, P.; Pandey, A.; Giri, L.; Ramola, S.; Bhatt, I.D.; Venskutonis, P.R.; Georgiev, M.I.; Clément, C.; et al. Anthocyanins, multi-functional natural products of industrial relevance: Recent biotechnological advances. Biotechnol. Adv. 2020, 43, 107600. [Google Scholar] [CrossRef]
- María, M.; Paola, P.; Dirk, P.; Christian, G.; Lorena, J.; Perla, F.; Katy, P.; Rolando, C. Kinetics and modeling of cell growth for potential anthocyanin induction in cultures of Taraxacum officinale G.H. Weber ex Wiggers (Dandelion) in vitro. Electron. J. Biotechnol. 2018, 36, 15–23. [Google Scholar] [CrossRef]
- Lai, C.; Fan, L.; He, X.; Xie, H. Callus induction and screening of high yield proanthocyanidin cell lines. J. Plant Physiol. 2014, 50, 1683–1691. (In Chinese) [Google Scholar] [CrossRef]
- Singleton, V.L.; Rossi, J.A.J. Colorimetry to Total Phenolics with Phosphomolybdic Acid Reagents. Am. J. Enol. Vitic. 1965, 16, 144–158. Available online: https://10.5344/ajev.1965.16.3.144 (accessed on 3 June 2023). [CrossRef]
- Kim, D.O.; Jeong, S.W.; Lee, C.Y. Antioxidant capacity of phenolic phytochemicals from various cultivars of plums. Food Chem. 2003, 81, 321–326. [Google Scholar] [CrossRef]
- Barreca, D.; Bellocco, E.; Caristi, C.; Leuzzi, U.; Gattuso, C. Elucidation of the flavonoid and furocoumarin composition and radical-scavenging activity of green and ripe chinotto (Citrus myrtifolia Raf.) fruit tissues, leaves and seeds. Food Chem. 2011, 129, 1504–1512. [Google Scholar] [CrossRef]
- Almeida, M.M.B.; Sousa, P.H.M.; Arriaga, Â.M.C.; Prado, G.M.; Magalhães, C.E.C.; Maia, G.A.; Lemos, T.L.G. Bioactive compounds and antioxidant activity of fresh exotic fruits from northeastern Brazil. Food Res. Int. 2011, 44, 2155–2159. [Google Scholar] [CrossRef]
- Jang, H.D.; Chang, K.S.; Chang, T.C.; Hsu, C.L. Antioxidant potentials of buntan pumelo (Citrus grandis Osbeck) and its ethanolic and acetified fermentation products. Food Chem. 2010, 118, 554–558. [Google Scholar] [CrossRef]
- Chen, Q.; Yu, H.W.; Wang, X.R.; Xie, X.L.; Yue, X.Y.; Tang, H.R. An alternative cetyltrimethylammonium bromide-based protocol for RNA isolation from blackberry (Rubus L.). Genet. Mol. Res. 2012, 11, 1773–1782. [Google Scholar] [CrossRef] [PubMed]
- Khan, T.; Abbasi, H.B.; Zeb, A.; Ali, G.S. Carbohydrate-induced biomass accumulation and elicitation of secondary metabolites in callus cultures of Fagonia indica. Ind. Crops Prod. 2018, 126, 168–176. [Google Scholar] [CrossRef]
- Wang, C. Factors affecting the production of secondary metabolites by plant tissue culture. Rural Econ. Sci. Technol. 2020, 31, 34+48. (In Chinese) [Google Scholar]
- Bong, F.J.; Chear, N.J.Y.; Ramanathan, S.; Mohana-Kumaran, N.; Subramaniam, S.; Chew, B.L. The development of callus and cell suspension cultures of Sabah Snake Grass (Clinacanthus nutans) for the production of flavonoids and phenolics. Biocatal. Agric. Biotechnol. 2021, 33, 101977. [Google Scholar] [CrossRef]
- Naczk, M.; Shahidi, F. Extraction and analysis of phenolics in food. J. Chromatogr. A 2004, 1054, 95–111. [Google Scholar] [CrossRef]
- Gu, K.D.; Wang, C.K.; Hu, D.G.; Hao, Y.J. How do anthocyanins paint our horticultural products? Sci. Hortic. 2019, 249, 257–262. [Google Scholar] [CrossRef]
- Kumar, G.P.; Sivakumar, S.; Govindarajan, S.; Sadasivam, V.; Manickam, V.; Mogilicherla, K.; Thiruppathi, S.K.; Narayanasamy, J. Evaluation of different carbon sources for high frequency callus culture with reduced phenolic secretion in cotton (Gossypium hirsutum L.) cv. SVPR-2. Biotechnol. Rep. 2015, 7, 72–80. [Google Scholar] [CrossRef] [PubMed]
- Chen, J.; Chen, H.; Wang, H.; Zhan, J.; Yuan, X.; Cui, J.; Su, N. Selenium treatment promotes anthocyanin accumulation in radish sprouts (Raphanus sativus L.) by its regulation of photosynthesis and sucrose transport. Food Res. Int. 2023, 165, 112551. [Google Scholar] [CrossRef]
- Durán-Soria, S.; Delphine, M.P.; Sonia, O.; José, G.V. Sugar Signaling During Fruit Ripening. Front. Plant Sci. 2020, 11, 564917. Available online: https://www.frontiersin.org/articles/10.3389/fpls.2020.564917 (accessed on 6 June 2023). [CrossRef] [PubMed]
- Teng, S.; Keurentjes, J.; Bentsink, L.; Koornneef, M.; Smeekens, S. Sucrose-specific induction of anthocyanin biosynthesis in Arabidopsis requires the MYB75/PAP1 gene. Plant Physiol. 2005, 139, 1840–1852. [Google Scholar] [CrossRef] [PubMed]
- Dai, Z.W.; Meddar, M.; Renaud, C.; Merlin, I.; Hilbert, G.; Delrot, S. Long-term in vitro culture of grape berries and its application to assess the effects of sugar supply on anthocyanin accumulation. J. Exp. Bot. 2014, 65, 4665–4677. [Google Scholar] [CrossRef]
- Sarmadi, M.; Karimi, N.; Palazón, J.; Ghassempour, A.; Mirjalili, M.H. The effects of salicylic acid and glucose on biochemical traits and taxane production in a Taxus baccata callus culture. Plant Physiol. Biochem. 2018, 132, 271–280. [Google Scholar] [CrossRef]
- Julkunen-Tiitto, R. Defensive efforts of Salix myrsinifolia plantlets I photomixotrophic culture conditions: The effect of sucrose, nitrogen and pH on the phytomass and secondary phenolic accumulation. Ecoscience 1996, 3, 297–303. [Google Scholar] [CrossRef]
- Pasqua, G.; Monacelli, B.; Mulinacci, N.; Rinaldi, S.; Giaccherini, C.; Innocenti, M.; Vinceri, F.F. The effect of growth regulators and sucrose on anthocyanin production in Camptotheca acuminata cell cultures. Plant Physiol. Biochem. 2005, 43, 293–298. [Google Scholar] [CrossRef]
- Ram, M.; Prasad, K.V.; Kaur, C.; Singh, S.K.; Arora, A.; Kumar, S. Induction of anthocyanin pigments in callus cultures of Rosa hybrida L. in response to sucrose and ammonical nitrogen levels. Plant Cell Tissue Organ Cult. 2011, 104, 171–179. [Google Scholar] [CrossRef]
- Kim, S.H.; Kim, Y.S.; Jo, Y.D.; Kang, S.Y.; Ahn, J.W.; Kang, B.C.; Kim, J.B. Sucrose and methyl jasmonate modulate the expression of anthocyanin biosynthesis genes and increase the frequency of flower-color mutants in chrysanthemum. Sci. Hortic. 2019, 256, 108602. [Google Scholar] [CrossRef]
- Ai, T.N.; Naing, A.H.; Arun, M.; Lim, S.H.; Kim, C.K. Sucrose-induced anthocyanin accumulation in vegetative tissue of Petunia plants requires anthocyanin regulatory transcription factors. Plant Sci. 2016, 252, 144–150. [Google Scholar] [CrossRef] [PubMed]
- Zheng, Y.; Tian, L.; Liu, H.; Pan, Q.; Zhan, J.; Huang, W. Sugars induce anthocyanin accumulation and flavanone 3-hydroxylase expression in grape berries. Plant Growth Regul. 2009, 58, 251–260. [Google Scholar] [CrossRef]
- Gollop, R.; Even, S.; Colova-Tsolova, V.; Peri, A. Expression of the grape dihydroflavonol reductase gene and analysis of its promoter region. J. Exp. Bot. 2002, 53, 13971409. [Google Scholar] [CrossRef]
- Gollop, R.; Farhi, S.; Peri, A. Regulation of the leucoanthocyanidin dioxygenase gene expression in Vitis vinifera. Plant Sci. 2001, 161, 579–588. [Google Scholar] [CrossRef]
- Schiozer, A.L.; Barata, L.E.S. Stability of Natural Pigments and Dyes. Rev. Fitos 2007, 3, 6–24. Available online: https://revistafitos.far.fiocruz.br/index.php/revista-fitos/article/view/71 (accessed on 9 June 2023). [CrossRef]
- Landi, M.; Tattini, M.; Gould, K.S. Multiple functional roles of anthocyanins in plant-environment interactions. Environ. Exp. Bot. 2015, 119, 4–17. [Google Scholar] [CrossRef]
- Simões, C.; Bizarri, C.H.B.; da Silva Cordeiro, L.; Castro, T.C.; Coutada, L.C.M.; da Silva, A.J.R.; Albarello, N.; Mansur, E. Anthocyanin production in callus cultures of Cleome rosea: Modulation by culture conditions and characterization of pigments by means of HPLC-DAD/ESIMS. Plant Physiol. Biochem. 2009, 47, 895–903. [Google Scholar] [CrossRef]
- Meng, J.X.; Gao, Y.; Han, M.L.; Liu, P.Y.; Yang, C.; Shen, T.; Li, H.H. In vitro Anthocyanin Induction and Metabolite Analysis in Malus spectabilis Leaves Under Low Nitrogen Conditions. Hortic. Plant J. 2020, 6, 284–292. [Google Scholar] [CrossRef]
- Ji, X.H.; Wang, Y.T.; Zhang, R.; Wu, S.J.; An, M.M.; Li, M.; Wang, C.Z.; Chen, X.L.; Zhang, Y.M.; Chen, X.S. Effect of auxin, cytokinin and nitrogen on anthocyanin biosynthesis in callus cultures of red-fleshed apple (Malus sieversii f. niedzwetzkyana). Plant Cell Tissue Organ Cult. 2015, 120, 325–337. [Google Scholar] [CrossRef]
- Li, H. Modern Plant Physiology, 3rd ed.; Life World: Beijing, China, 2012; p. 2. (In Chinese) [Google Scholar]
- Li, H.; He, K.; Zhang, Z.Q.; Hu, Y. Molecular mechanism of phosphorous signaling inducing anthocyanin accumulation in Arabidopsis. Plant Physiol. Biochem. 2023, 196, 121–129. [Google Scholar] [CrossRef] [PubMed]
- Huang, J.; Gu, M.; Lai, Z.; Fan, B.; Shi, K.; Zhou, Y.H.; Yu, J.Q.; Chen, Z. Functional analysis of the Arabidopsis PAL gene family in plant growth, development, and response to environmental stress. Plant Physiol. 2010, 153, 1526–1538. [Google Scholar] [CrossRef]
- Abbasi, B.H.; Tian, C.L.; Murch, S.J.; Saxena, P.K.; Liu, C.Z. Light-enhanced caffeic acid derivatives biosynthesis in hairy root cultures of Echinacea purpurea. Plant Cell Rep. 2007, 26, 1367–1372. [Google Scholar] [CrossRef]
- Kreuzaler, F.; Hahlbrock, K. Flavonoid glycosides from illuminated cell suspension cultures of Petroselinum hortense. Phytochemistry 1973, 12, 1149–1152. [Google Scholar] [CrossRef]
- Zhong, J.J.; Seki, T.; Kinoshita, S.I.; Yoshida, T. Effect of light irradiation on anthocyanin production by suspended culture of Perilla frutescens. Biotechnol. Bioeng. 1991, 38, 653–658. [Google Scholar] [CrossRef]
- Liu, C.Z.; Guo, C.; Wang, Y.C.; Ouyang, F. Effect of light irradiation on hairy root growth and artemisinin biosynthesis of Artemisia annua L. Process. Biochem. 2002, 38, 581–585. [Google Scholar] [CrossRef]
- Fazal, H.; Abbasi, B.H.; Ahmad, N.; Ali, S.S.; Akbar, F.; Kanwal, F. Correlation of different spectral lights with biomass accumulation and production of antioxidant secondary metabolites in callus cultures of medicinally important Prunella vulgaris L. J. Photochem. Photobiol. B Biol. 2016, 159, 1–7. [Google Scholar] [CrossRef] [PubMed]
- Ahmad, N.; Rab, A.; Ahmad, N. Light-induced biochemical variations in secondary metabolite production and antioxidant activity in callus cultures of Stevia rebaudiana (Bert). J. Photochem. Photobiol. B Biol. 2016, 154, 51–56. [Google Scholar] [CrossRef]
- Nadeem, M.; Abbasi, B.H.; Younas, M.; Ahmad, W.; Zahir, A.; Hano, C. LED-enhanced biosynthesis of biologically active ingredients in callus cultures of Ocimum basilicum. J. Photochem. Photobiol. B Biol. 2019, 190, 172–178. [Google Scholar] [CrossRef]
- Abou El-Dis, G.R.; Zavdetovna, K.L.; Nikolaevich, A.A.; Abdelazeez, W.M.A.; Arnoldovna, T.O. Influence of light on the accumulation of anthocyanins in callus culture of Vaccinium corymbosum L. cv. Sunt Blue Giant. J. Photochem. Photobiol. 2021, 8, 100058. [Google Scholar] [CrossRef]
- Nazir, M.; Ullah, M.A.; Younas, M.; Siddiquah, A.; Shah, M.; Guivarc’h, G.; Hano, C.; Abbasi, B.H. Light-mediated biosynthesis of phenylpropanoid metabolites and antioxidant potential in callus cultures of purple basil (Ocimum basilicum L. var purpurascens). Plant Cell Tissue Organ Cult. 2020, 142, 107–120. [Google Scholar] [CrossRef]
- Adil, M.; Ren, X.X.; Jeong, B.R. Light elicited growth, antioxidant enzymes activities and production of medicinal compounds in callus culture of Cnidium officinale Makino. J. Photochem. Photobiol. B Biol. 2019, 196, 111509. [Google Scholar] [CrossRef]
- Sng, B.J.R.; Mun, B.; Mohanty, B.; Kim, M.; Phua, Z.W.; Yang, H.; Lee, D.Y.; Jang, I.C. Combination of red and blue light induces anthocyanin and other secondary metabolite biosynthesis pathways in an age-dependent manner in Batavia lettuce. Plant Sci. 2021, 310, 110977. [Google Scholar] [CrossRef]
- Jie, X.; Liu, X.; Wang, W.; Bai, J.; Li, D.; Liu, Y. Effects of Light Quality on Callus Growth Rate and Anthocyanin Synthesis of Hongyang Kiwifruit. Shanxi Agric. Sci. 2021, 49, 1166–1172. (In Chinese) [Google Scholar]
- Toguri, T.; Umemoto, N.; Kobayashi, O.; Ohtani, T. Activation of anthocyanin synthesis genes by white light in eggplant hypocotyl tissues, and identification of an inducible P-450 cDNA. Plant Mol. Biol. 1993, 23, 933–946. [Google Scholar] [CrossRef] [PubMed]
- Liu, Y.; Schouten, R.E.; Tikunov, Y.; Liu, X.X.; Visser, R.G.F.; Tan, F.; Bovy, A.; Marcelis, L.F.M. Blue light increases anthocyanin content and delays fruit ripening in purple pepper fruit. Postharvest Biol. Technol. 2022, 192, 112024. [Google Scholar] [CrossRef]
- Tu, Y.; Wang, B.; Jiang, H.; Xi, X.; Ding, J. Culture effect of different color light, temperature, and pH on grass coral callus. Jiangxi Sci. 1994, 1994, 85–89. (In Chinese) [Google Scholar]
- Wei, C.; Niu, Z.; Dou, F.; Wang, Q. Effect of test tube microenvironment on anthocyanin content in potato ‘GSAP-H’ callus. J. Gansu Agric. Univ. 2016, 51, 47–53. (In Chinese) [Google Scholar] [CrossRef]
- Narayan, M.S.; Thimmaraju, R.; Bhagyalakshmi, N. Interplay of growth regulators during solid-state and liquid-state batch cultivation of anthocyanin producing cell line of Daucus carota. Process Biochem. 2005, 40, 351–358. [Google Scholar] [CrossRef]
- Liu, C.; Zhao, Y.; Wang, Y. Artemisinin: Current state and perspectives for biotechnological production of an antimalarial drug Appl. Microb. Biotechnol. 2006, 72, 11–20. [Google Scholar] [CrossRef] [PubMed]
- Kim, S.J.; Hahn, E.J.; Heo, J.W.; Paek, K.Y. Effects of LEDs on net photosynthetic rate, growth and leaf stomata of chrysanthemum plantlets in vitro. Sci. Hortic. 2004, 101, 143–151. [Google Scholar] [CrossRef]
- Wang, N.; Zhang, Z.; Jiang, S.; Xu, H.; Wang, Y.; Feng, S.; Chen, X. Synergistic effects of light and temperature on anthocyanin biosynthesis in callus cultures of red-fleshed apple (Malus sieversii f. niedzwetzkyana). Plant Cell Tissue Organ Cult. 2016, 127, 217–227. [Google Scholar] [CrossRef]
- Rehman, R.N.U.; You, Y.; Yang, C.; Khan, A.R.; Li, P.; Ma, F. Characterization of phenolic compounds and active anthocyanin degradation in crabapple (Malus orientalis) flowers. Hortic. Environ. Biotechnol. 2017, 58, 324–333. [Google Scholar] [CrossRef]
- Leyva, A.; Jarillo, J.A.; Salinas, J.; Martinez-Zapater, J.M. Low Temperature Induces the Accumulation of Phenylalanine Ammonia-Lyase and Chalcone Synthase mRNAs of Arabidopsis thaliana in a Light-Dependent Manner. Plant Physiol. 1995, 108, 39–46. [Google Scholar] [CrossRef] [PubMed]
- Lo Piero, A.R.; Puglisi, I.; Rapisarda, P.; Petrone, G. Anthocyanins accumulation and related gene expression in red orange fruit induced by low-temperature storage. J. Agric. Food Chem. 2005, 53, 9083–9088. [Google Scholar] [CrossRef]
- Naing, A.H.; Park, D.Y.; Park, K.I.; Kim, C.K. Differential expression of anthocyanin structural genes and transcription factors determines coloration patterns in gerbera flowers. 3 Biotech 2018, 8, 393. [Google Scholar] [CrossRef]
- Bagal, D.; Chowdhary, A.A.; Mehrotra, S.; Mishra, S.; Rathore, S.; Srivastava, V. Metabolic engineering in hairy roots: An outlook on production of plant secondary metabolites. Plant Physiol. Biochem. 2023, 201, 107847. [Google Scholar] [CrossRef] [PubMed]
- Selwal, N.; Rahayu, F.; Herwati, A.; Latifah, E.; Supriyono; Suhara, C.; Suastika, I.B.K.; Mahayu, W.M.; Wani, A.K. Enhancing secondary metabolite production in plants: Exploring traditional and modern strategies. J. Agric. Food Res. 2023, 14, 100702. [Google Scholar] [CrossRef]
- Koufan, M.; Belkoura, I.; Mazri, M.A.; Amarraque, A.; Essatte, A.; Elhorri, H.; Zaddoug, F.; Alaoui, T. Determination of antioxidant activity, total phenolics and fatty acids in essential oils and other extracts from callus culture, seeds and leaves of Argania spinosa (L.) Skeels. Plant Cell Tiss Organ Cult. 2020, 141, 217–227. [Google Scholar] [CrossRef]
- Yang, M.; Zhang, Q.; Lu, A.; Yang, Z.; Tan, D.; Lu, Y.; Qin, L.; He, Y. The preventive effect of secondary metabolites of Dendrobium officinale on acute alcoholic liver injury in mice. Arab. J. Chem. 2023, 16, 105138. [Google Scholar] [CrossRef]
- Liu, X.; Ma, C.; Liu, Z.; Kang, W. Natural Products: Review for Their Effects of Anti-HBV. BioMed Res. Int. 2020, 9, 3972390. [Google Scholar] [CrossRef]
Disclaimer/Publisher’s Note: The statements, opinions and data contained in all publications are solely those of the individual author(s) and contributor(s) and not of MDPI and/or the editor(s). MDPI and/or the editor(s) disclaim responsibility for any injury to people or property resulting from any ideas, methods, instructions or products referred to in the content. |
© 2023 by the authors. Licensee MDPI, Basel, Switzerland. This article is an open access article distributed under the terms and conditions of the Creative Commons Attribution (CC BY) license (https://creativecommons.org/licenses/by/4.0/).