
One-Time Mixed Nitrogen Fertilizers Application Enhances Yield and Eating Quality of Late-Maturing Medium Japonica Rice in the Yangtze River Delta

 ,
,  ,
,
Abstract
:1. Introduction
2. Materials and Methods
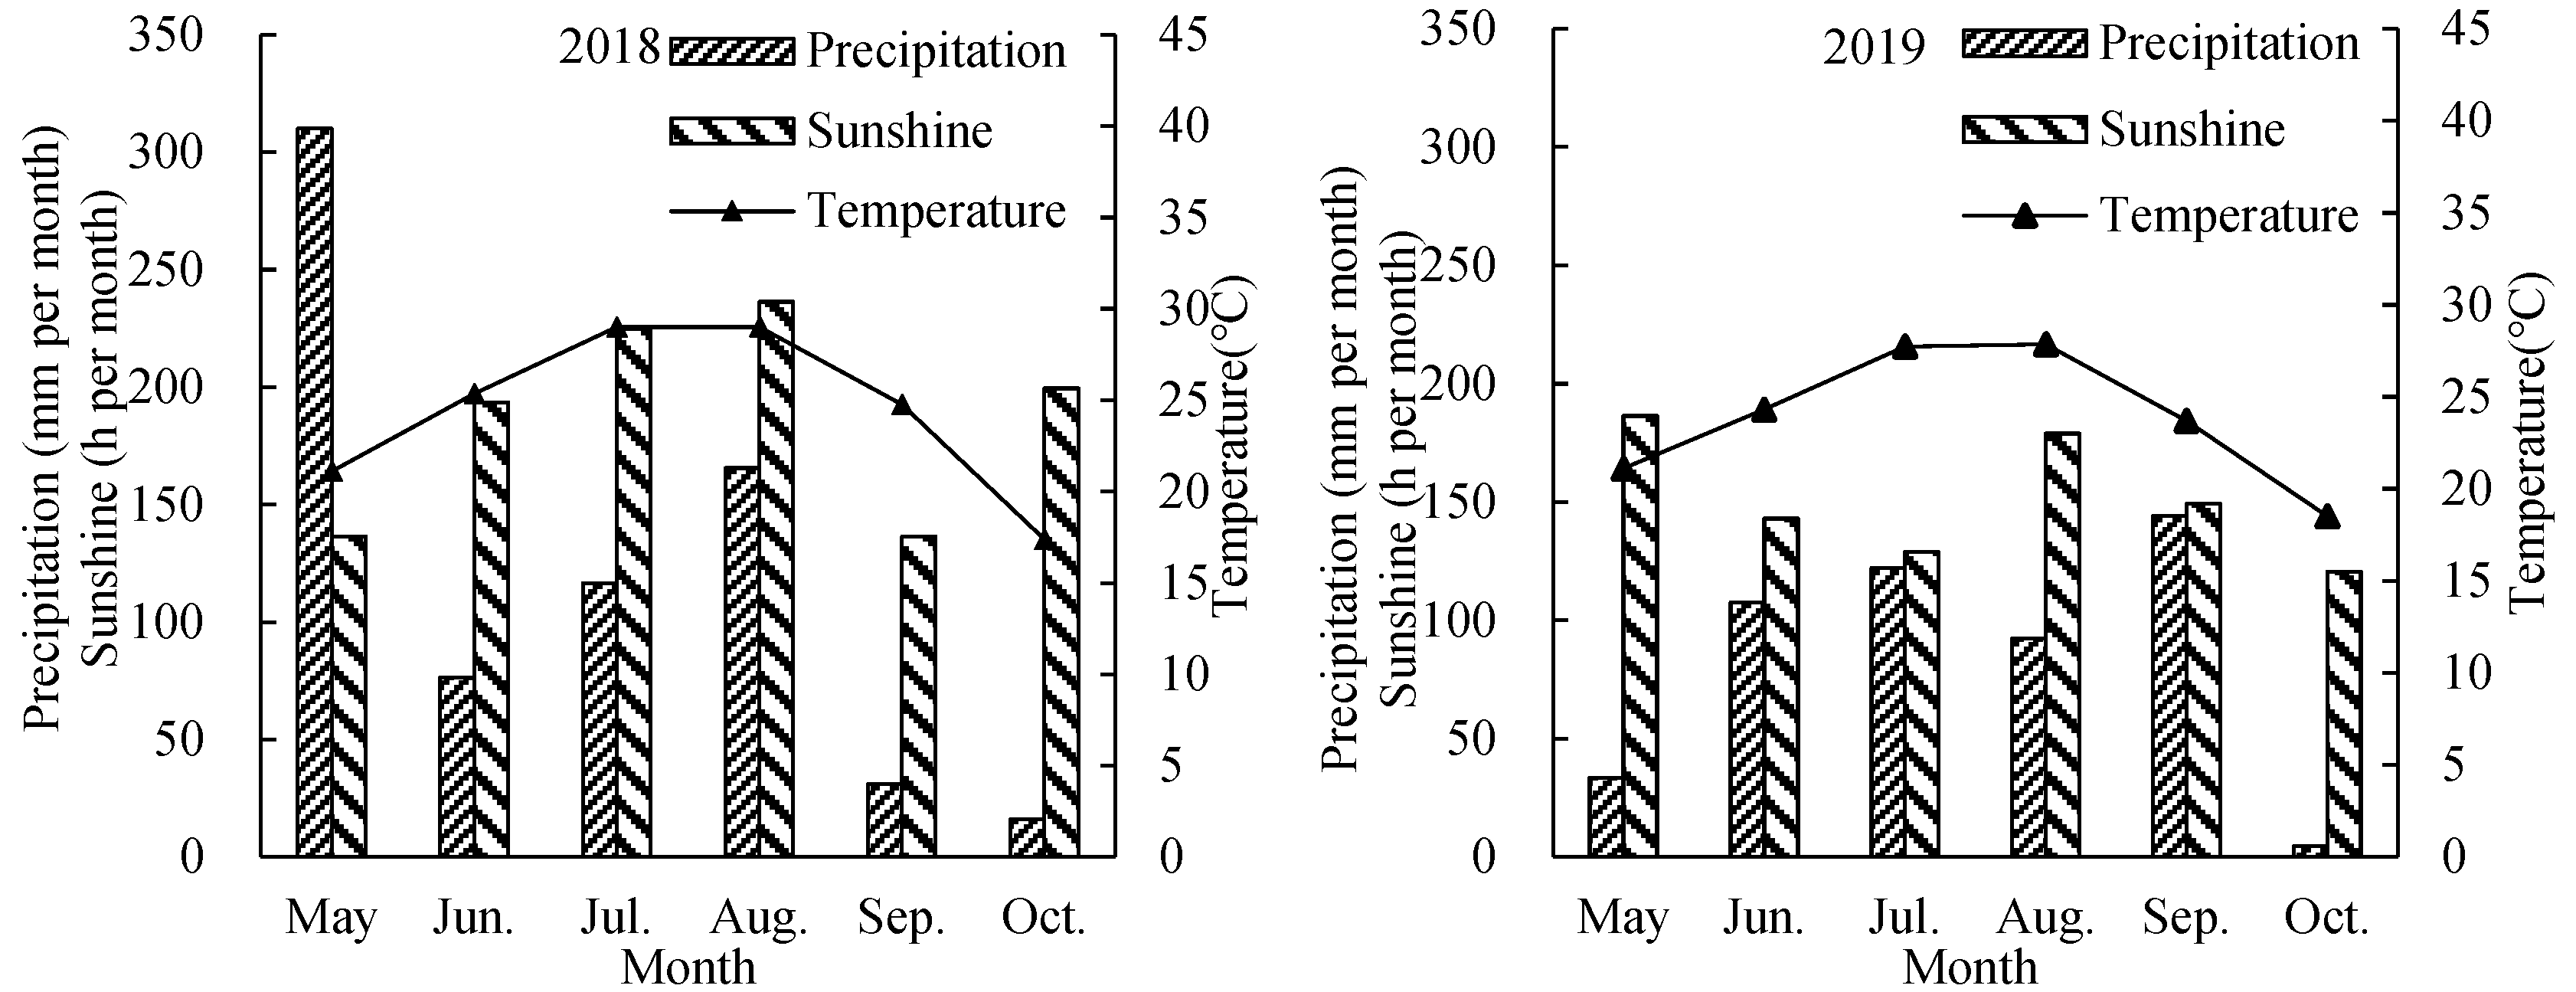
2.1. Experimental Conditions and Materials
2.2. Experimental Design and Treatments
2.3. Determination Procedures
2.3.1. Rice Yield Components and Grain Yield
2.3.2. N Content
2.3.3. Rice Quality
2.4. Statistical Analysis
3. Results
3.1. Grain Yield and Sink Capacity
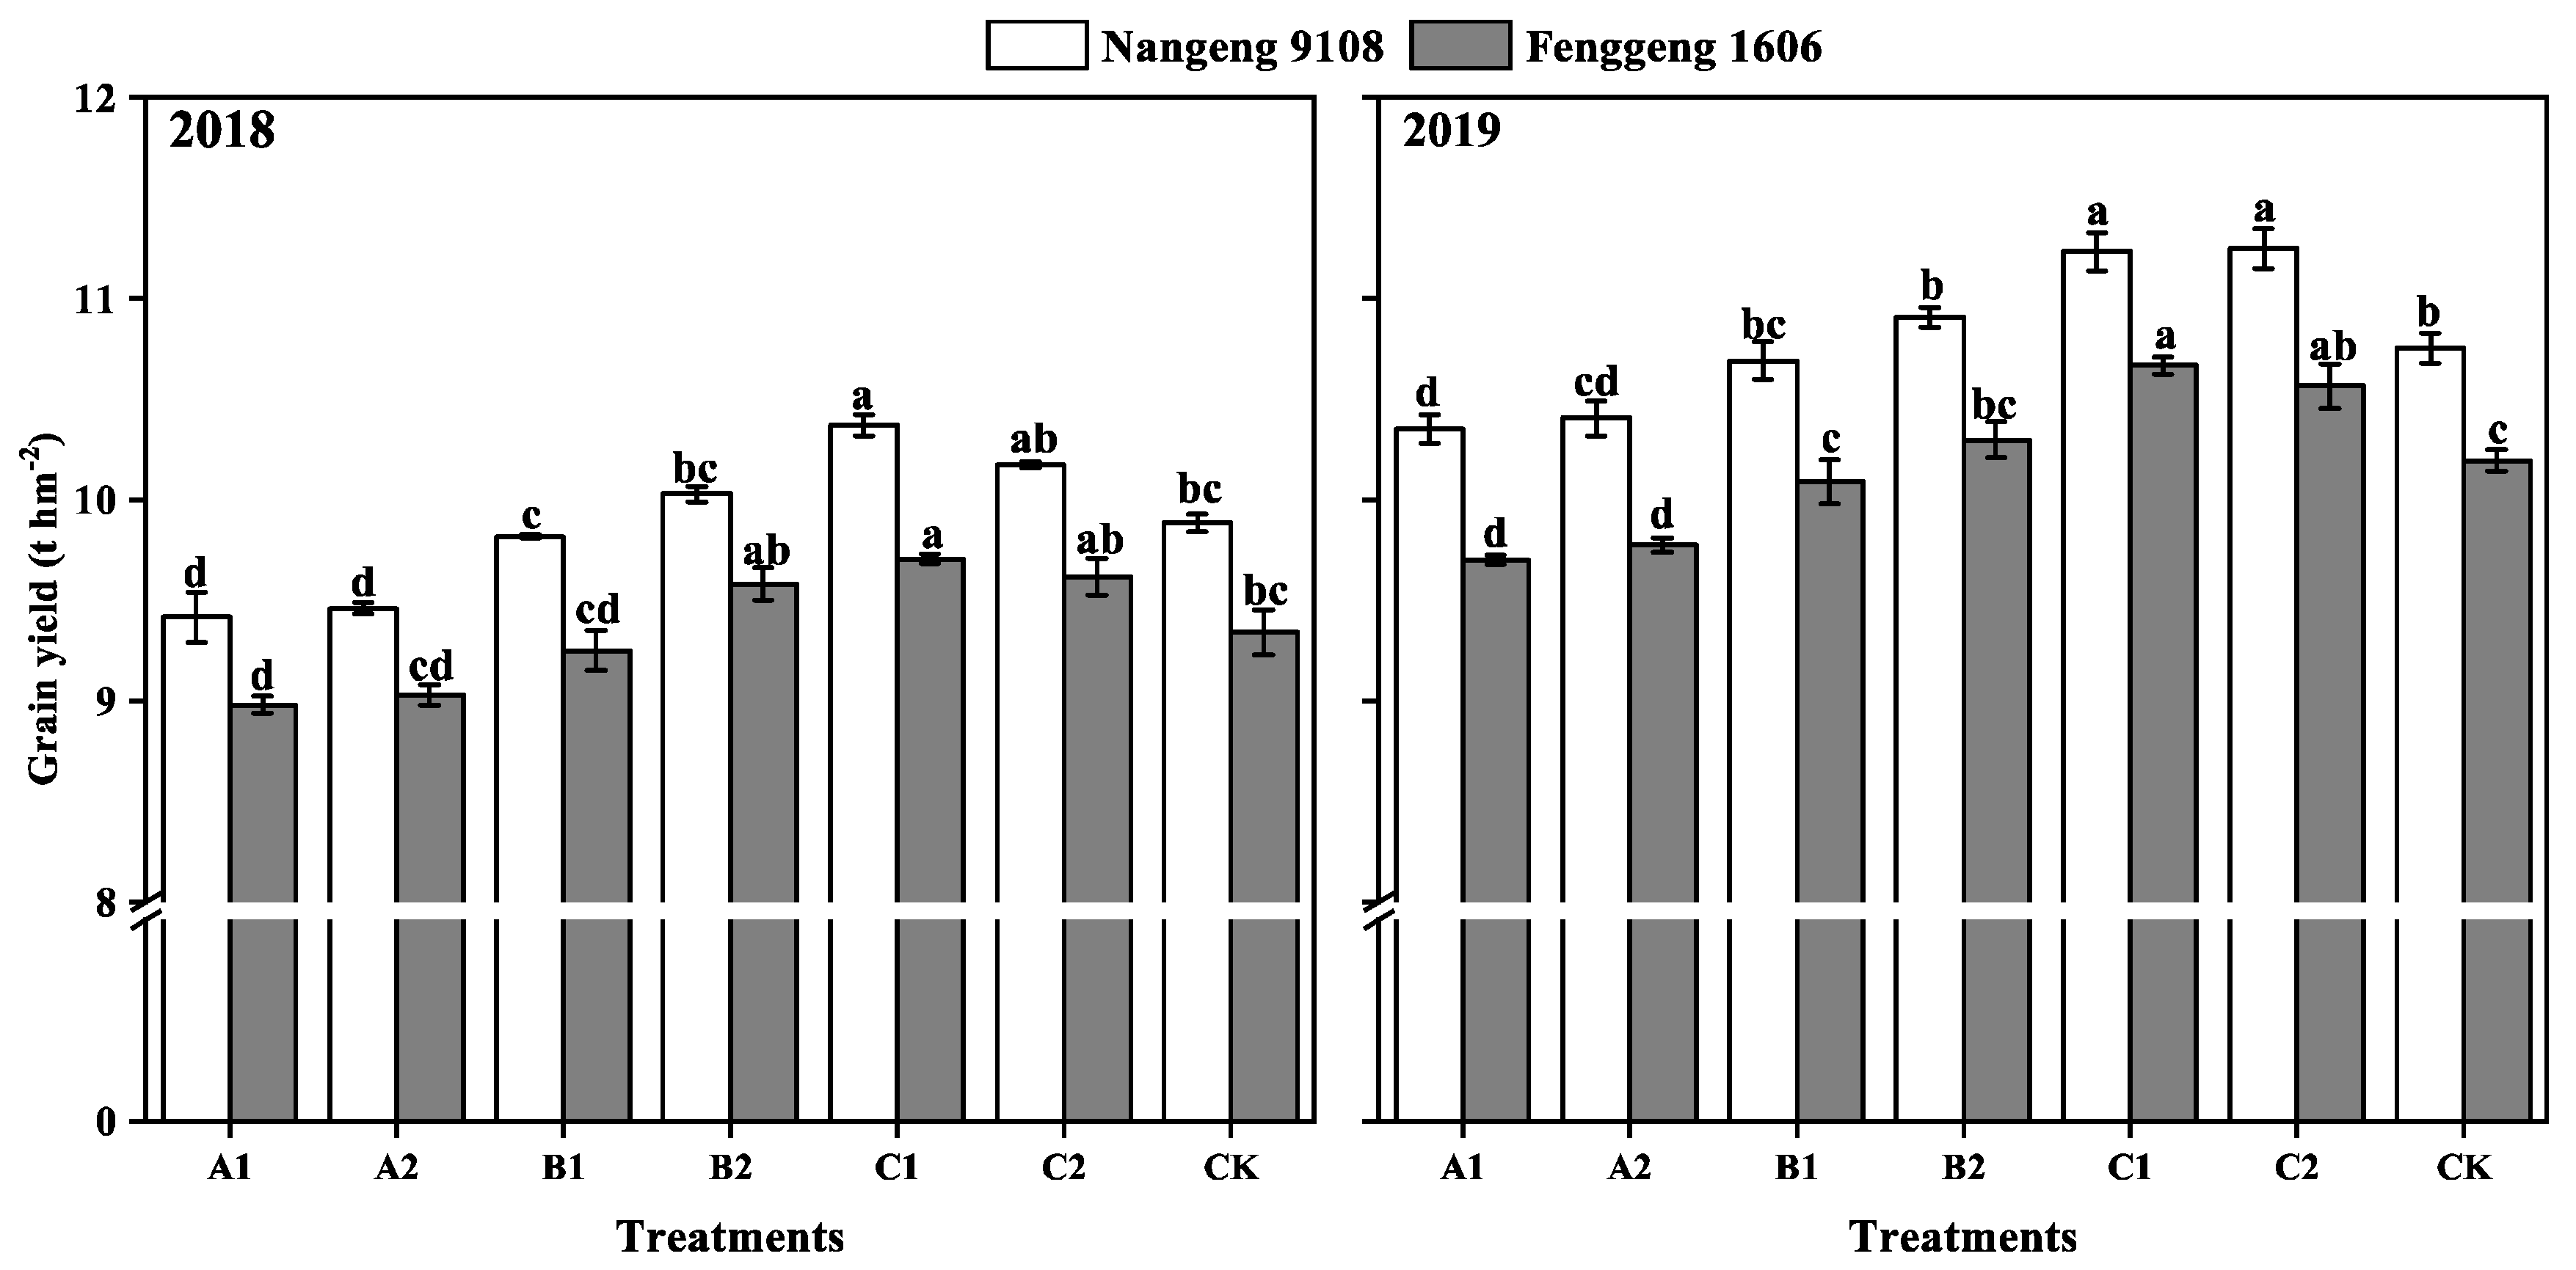
3.1.1. Yield Dynamics
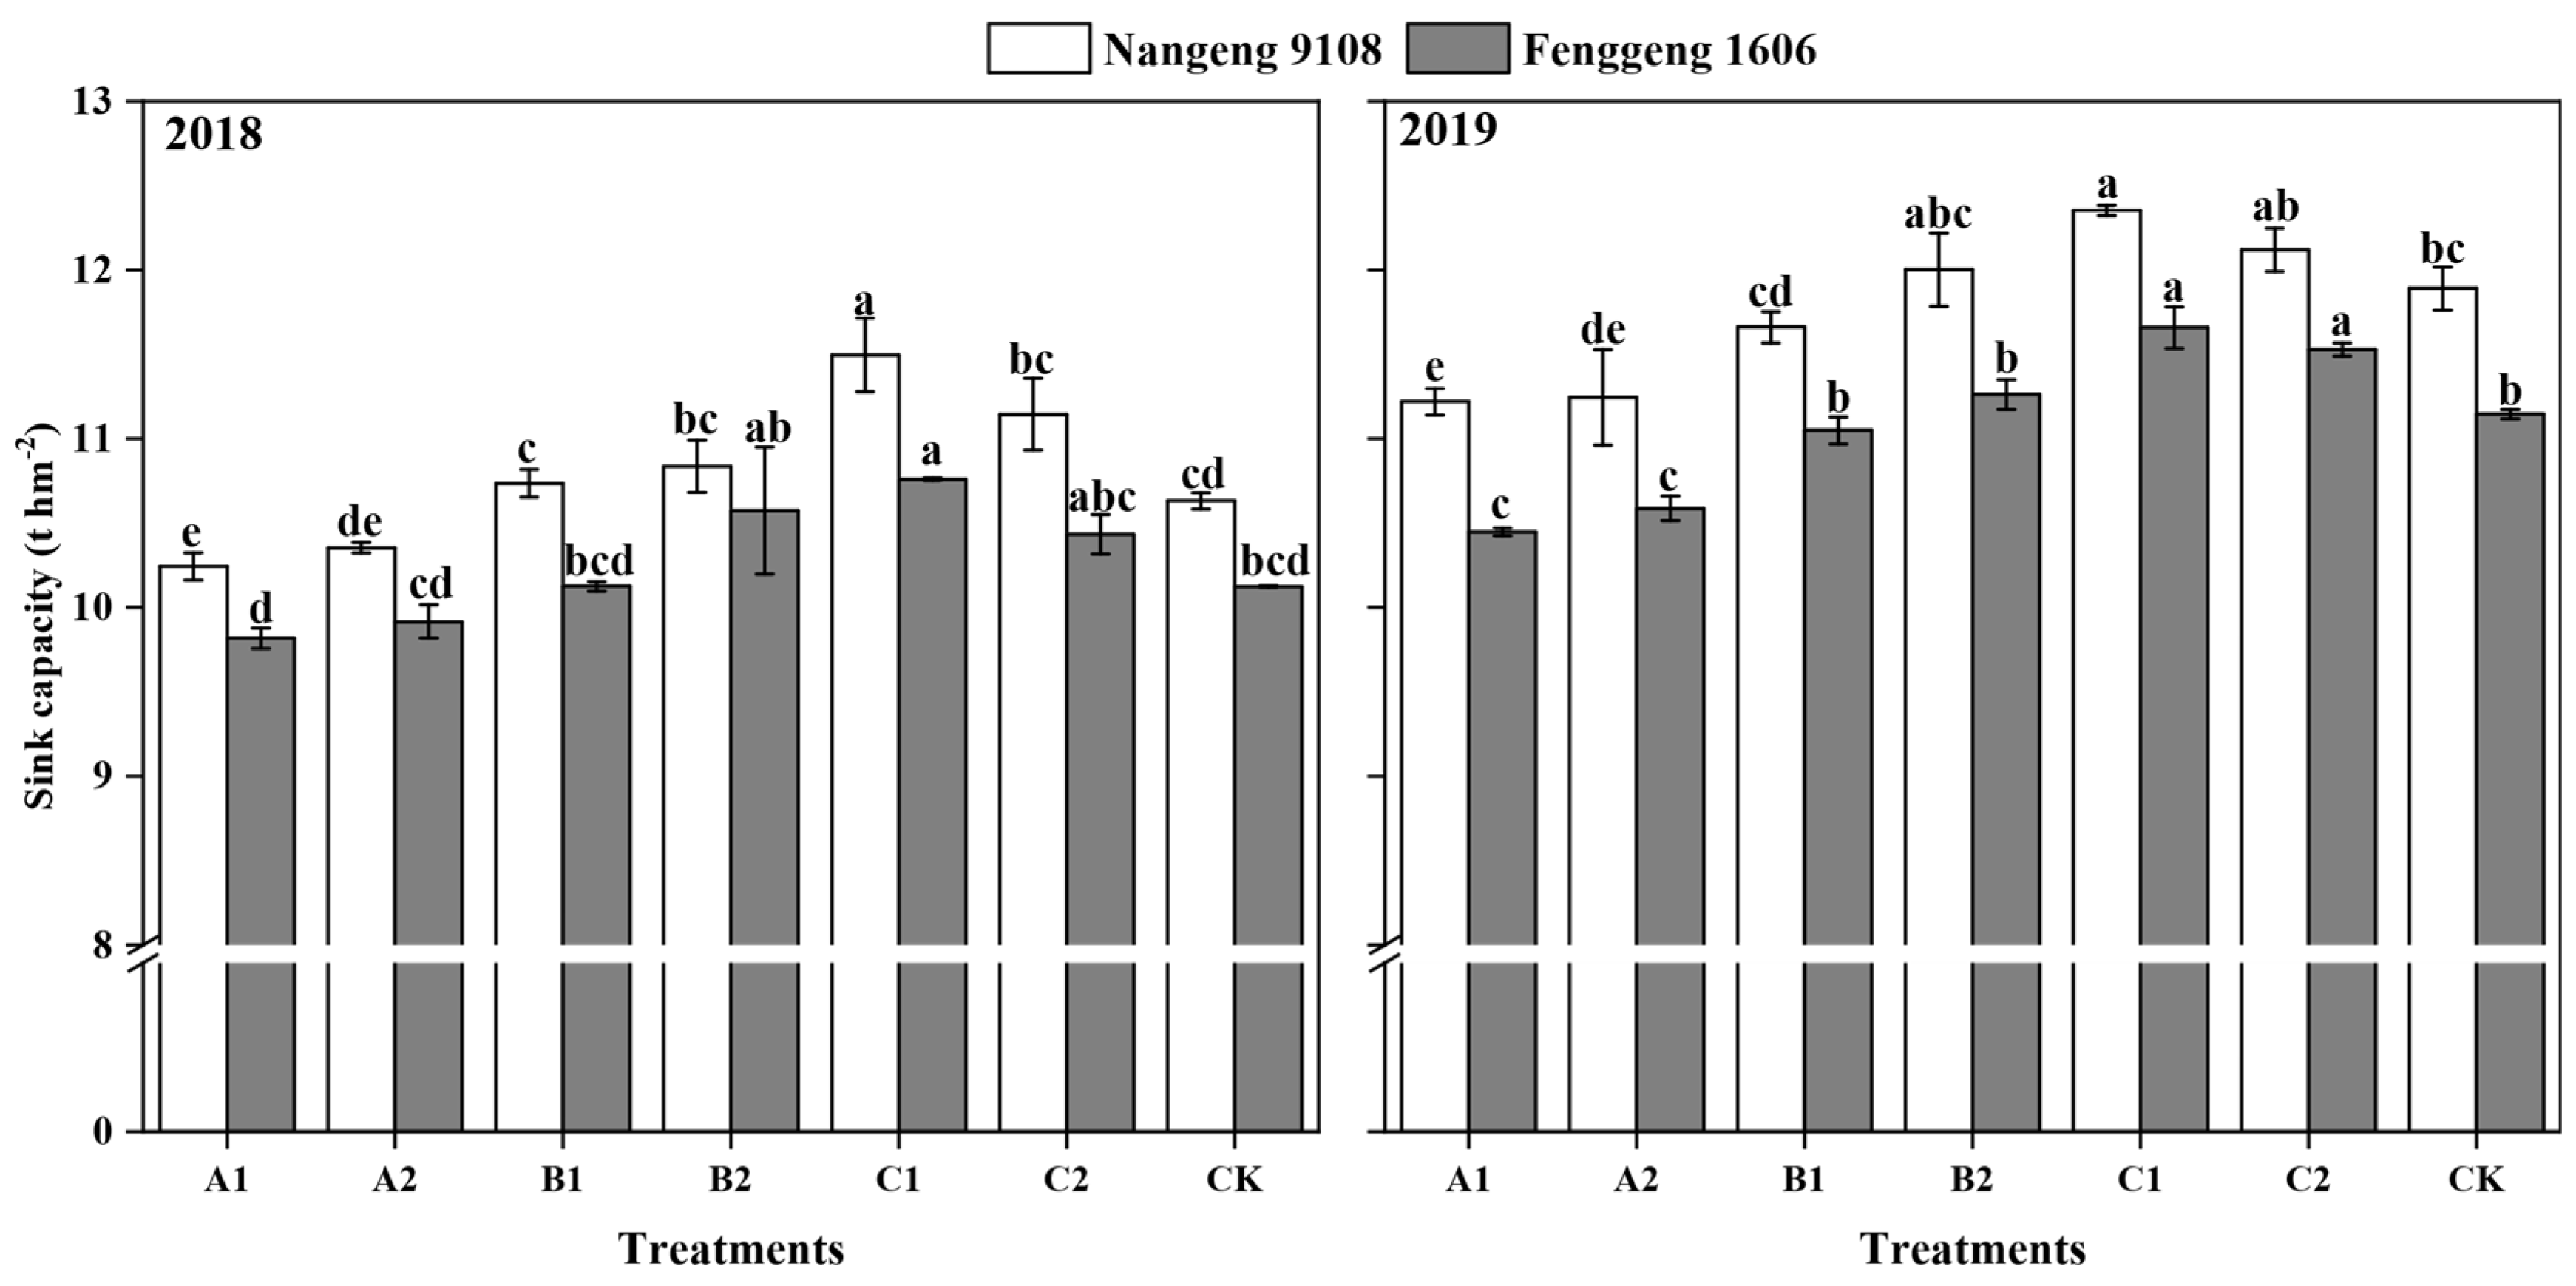
3.1.2. Sink Capacity
3.2. N Uptake and Utilization
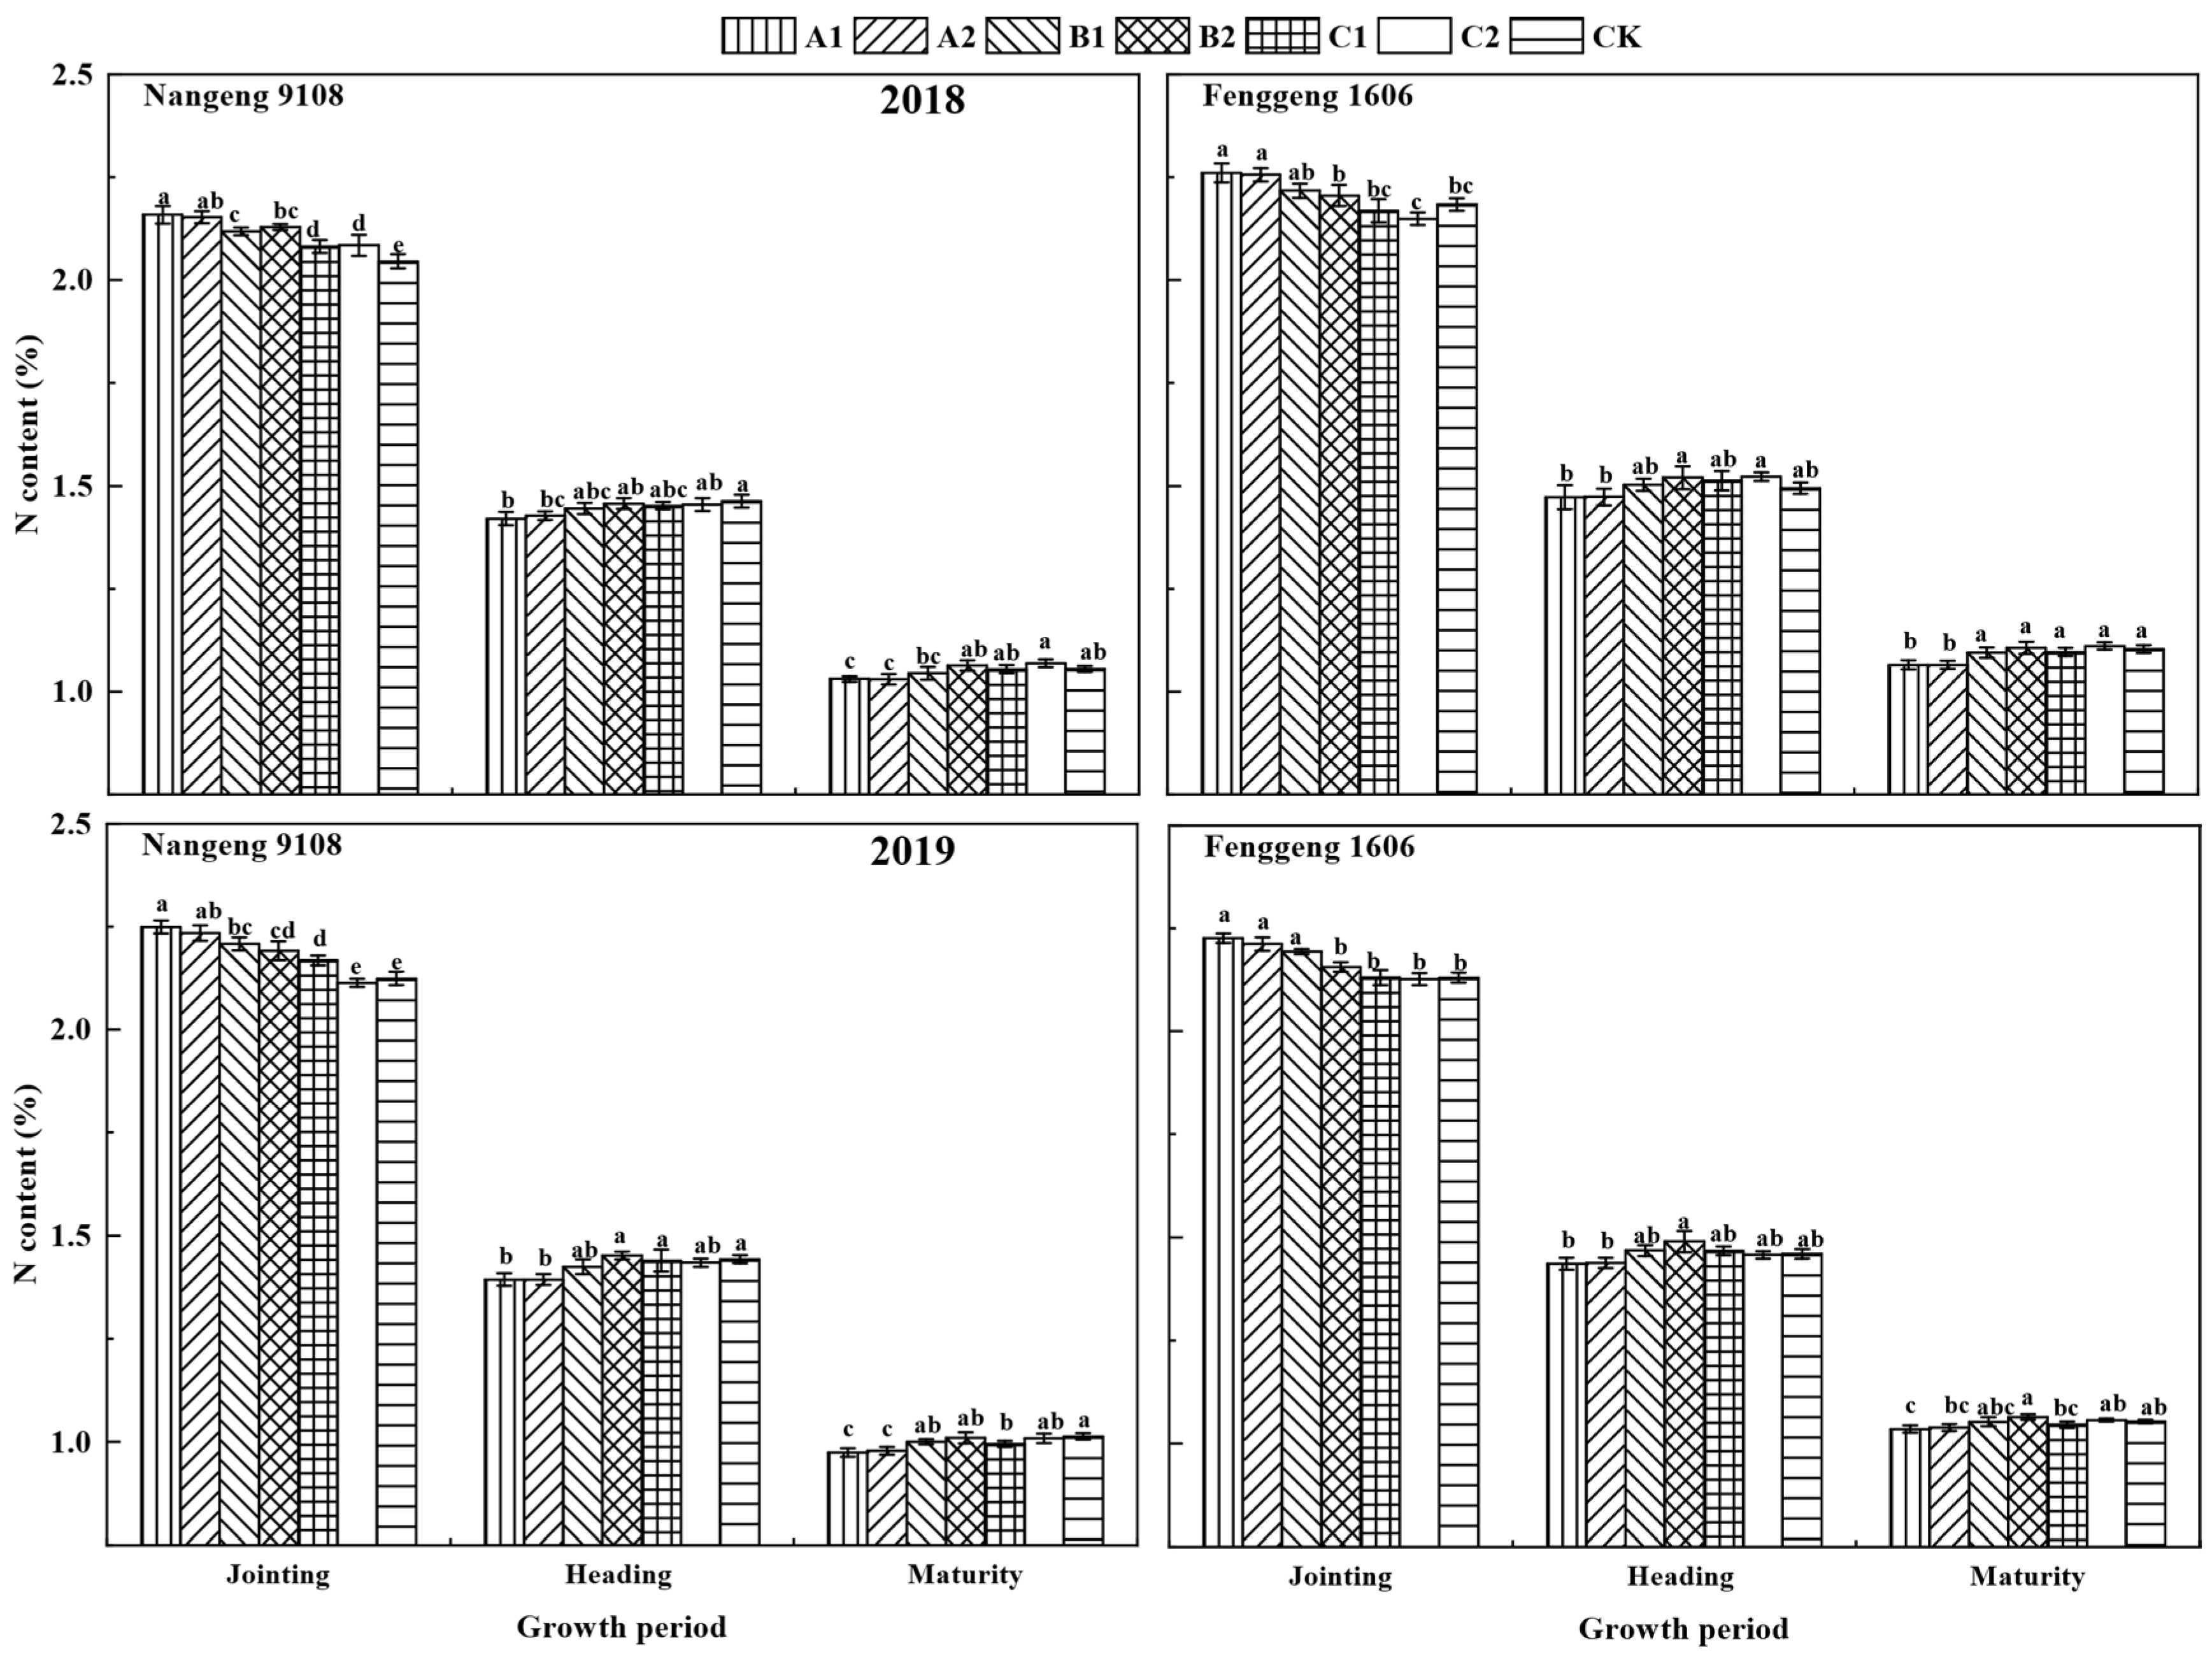
3.2.1. N Content in the Shoot (NCS) at the Main Growth Stage
3.2.2. N Accumulation at Maturity
3.2.3. N Translocation Characteristics
3.3. Rice Quality
3.3.1. Processing and Appearance Characteristics
3.3.2. Cooking/Eating and Nutrition Quality
3.3.3. Rice Viscosity Characteristics
3.4. Correlation Analysis among Indices
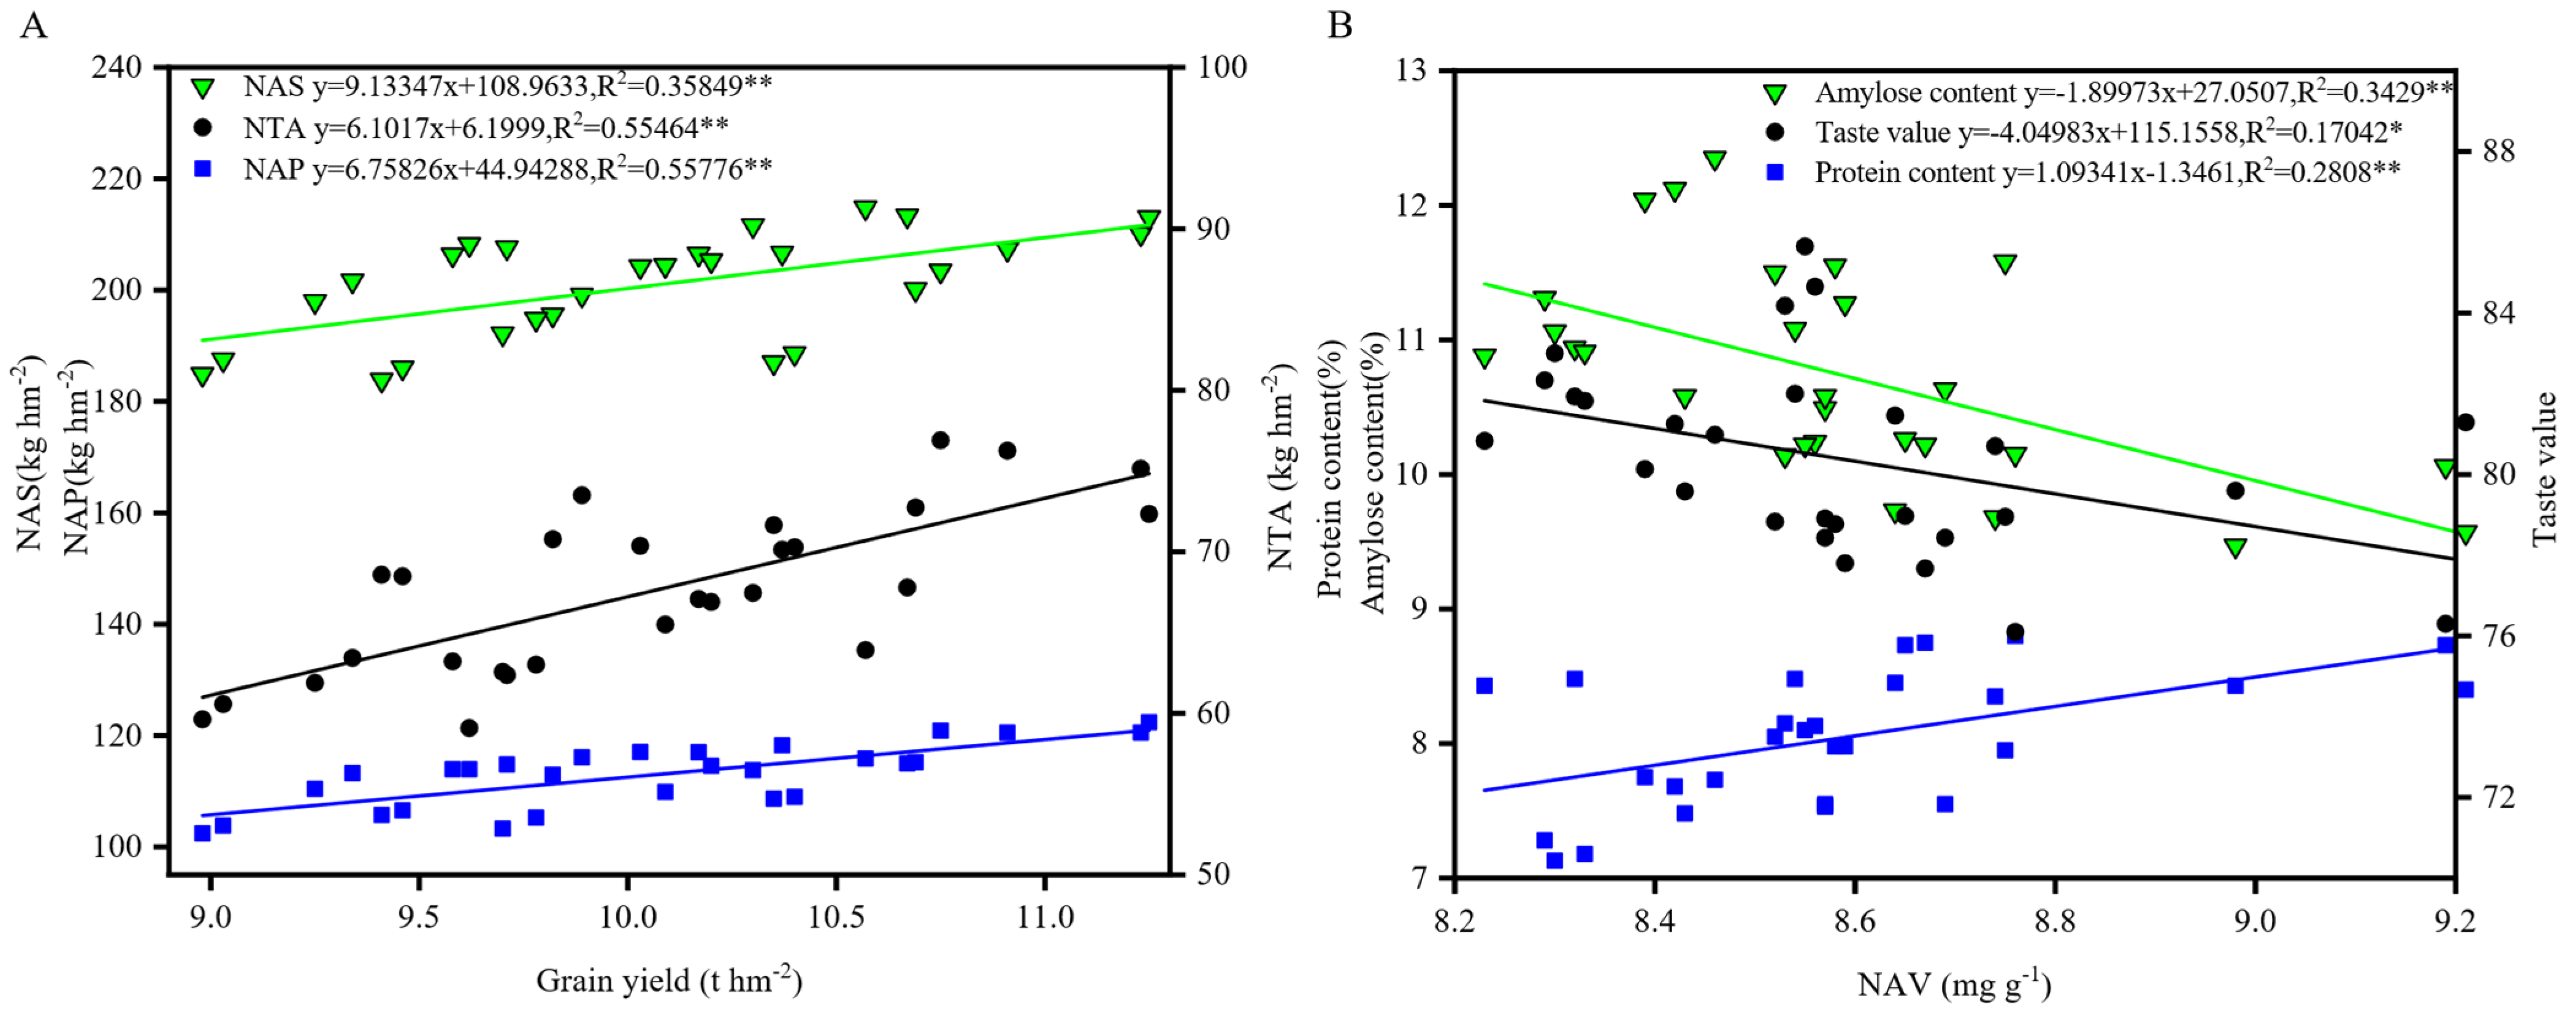
3.4.1. Correlation Analysis among Rice Yield and NAS, NAP, NTA; Taste Quality and NAV, PC, AC
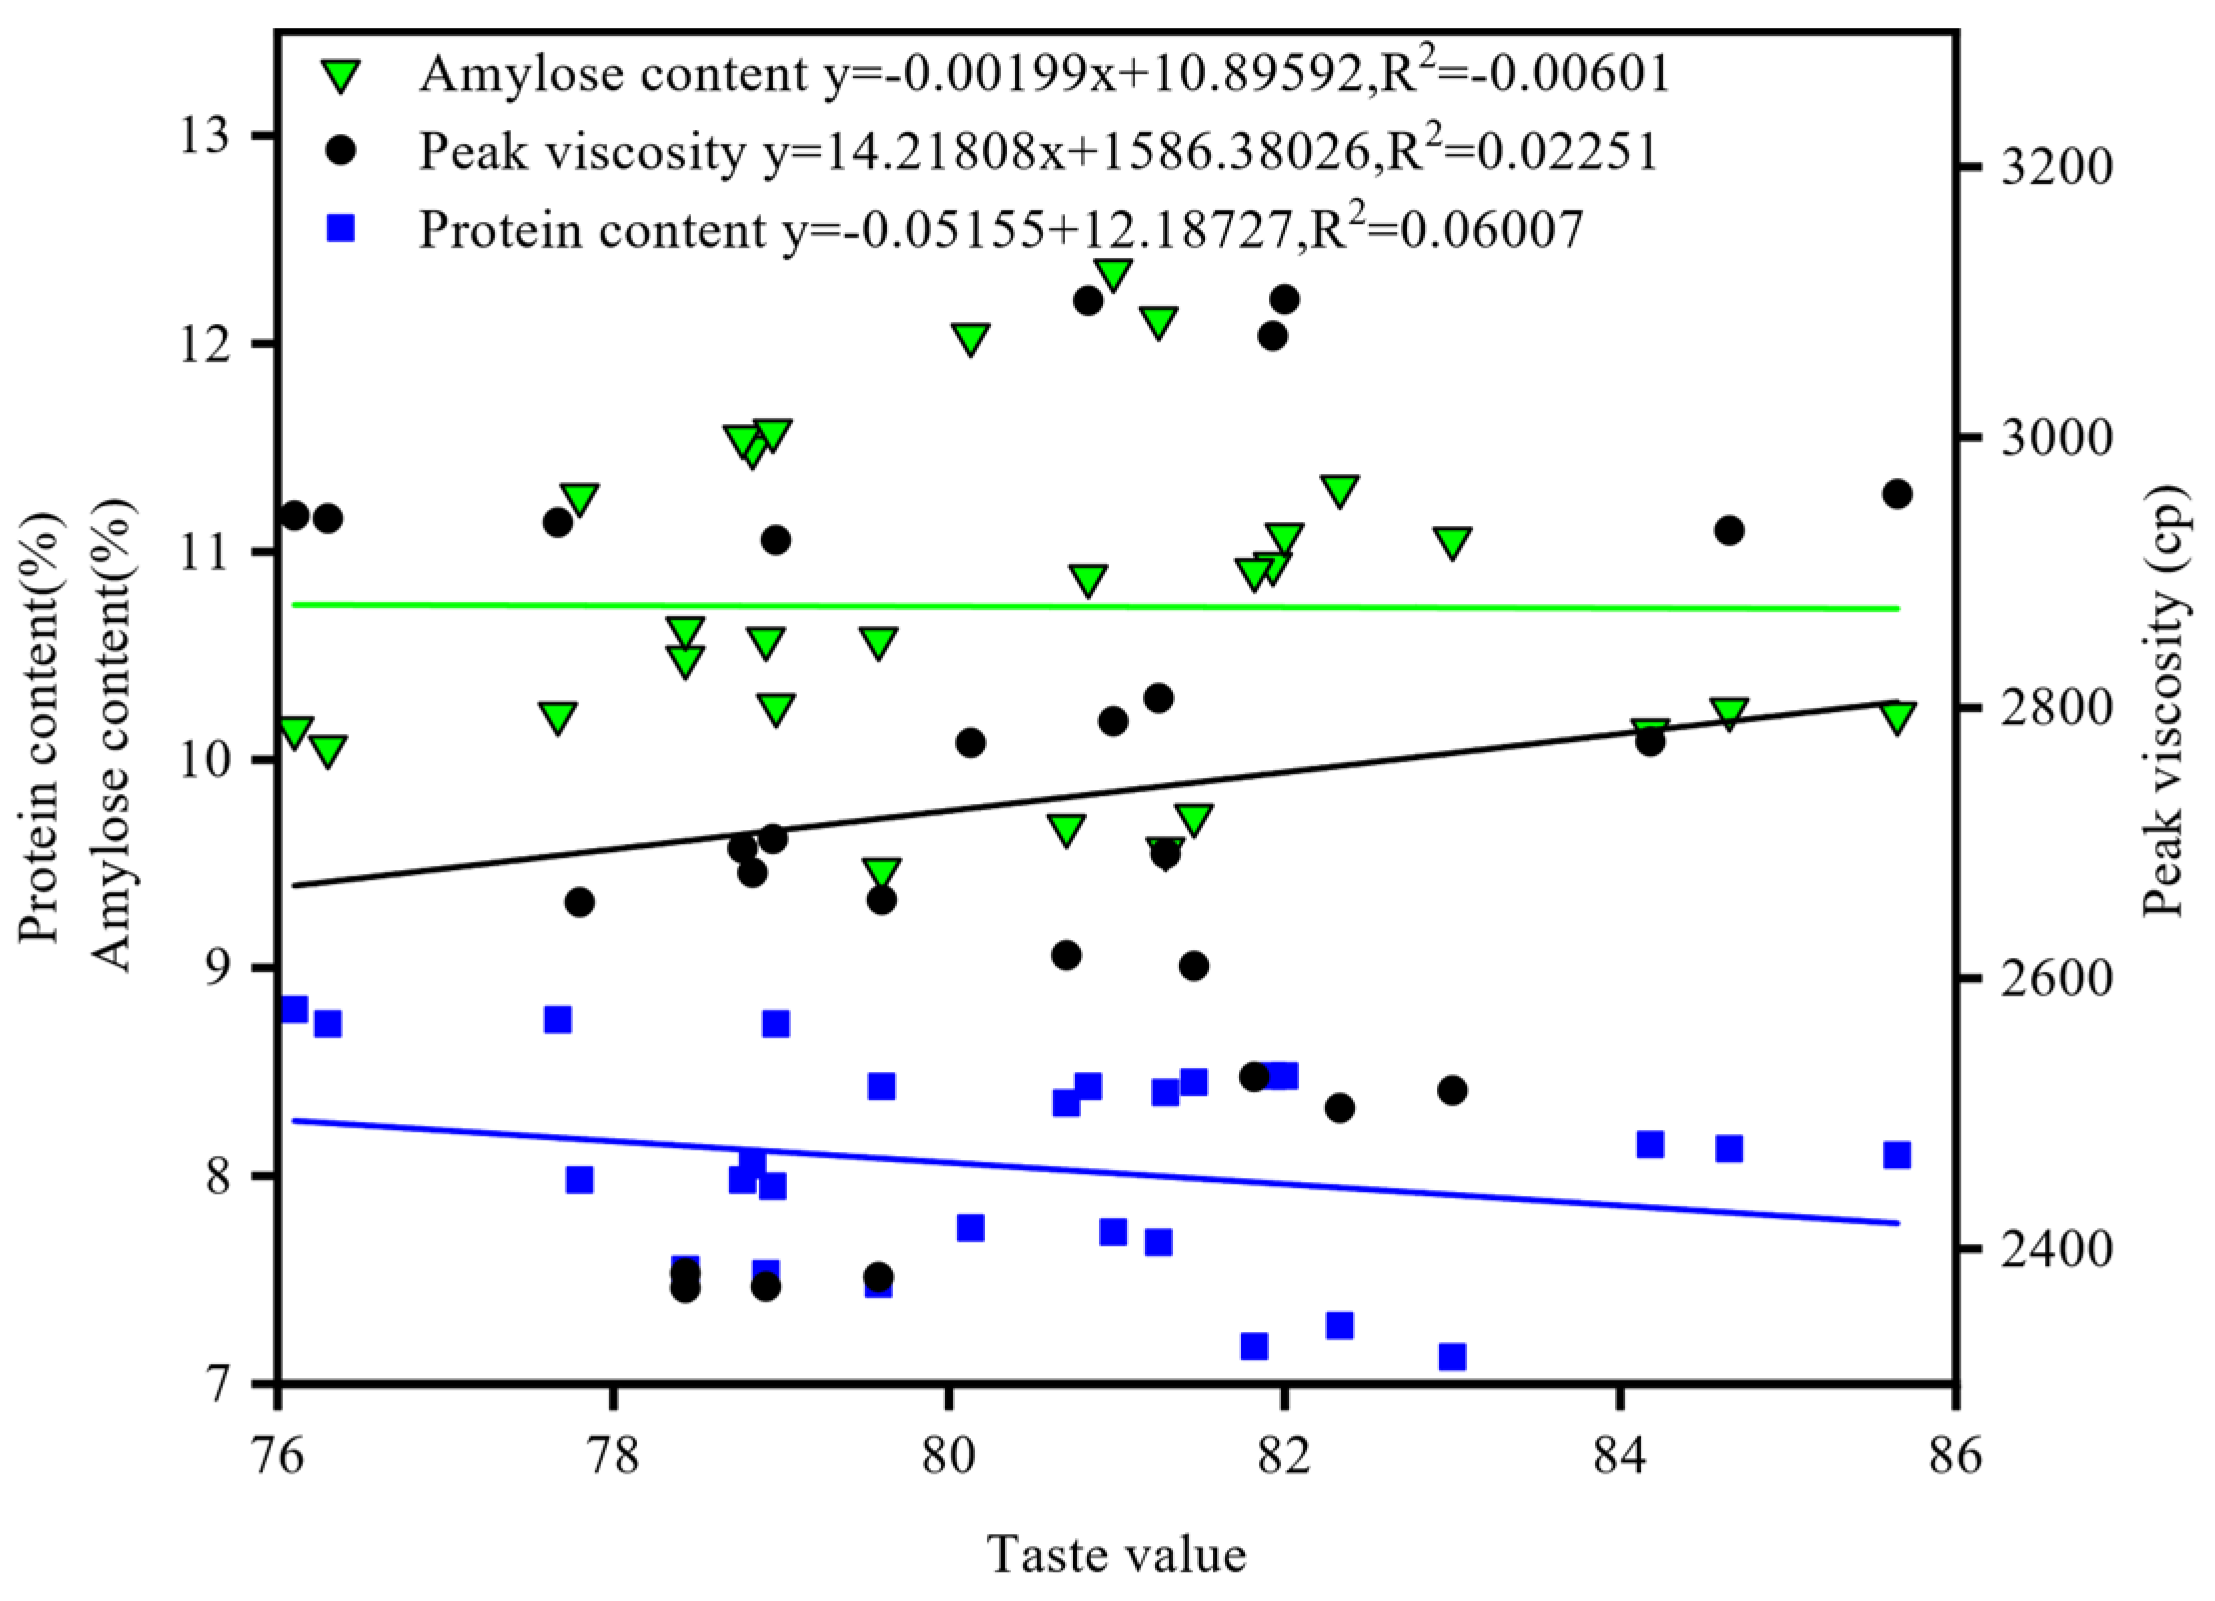
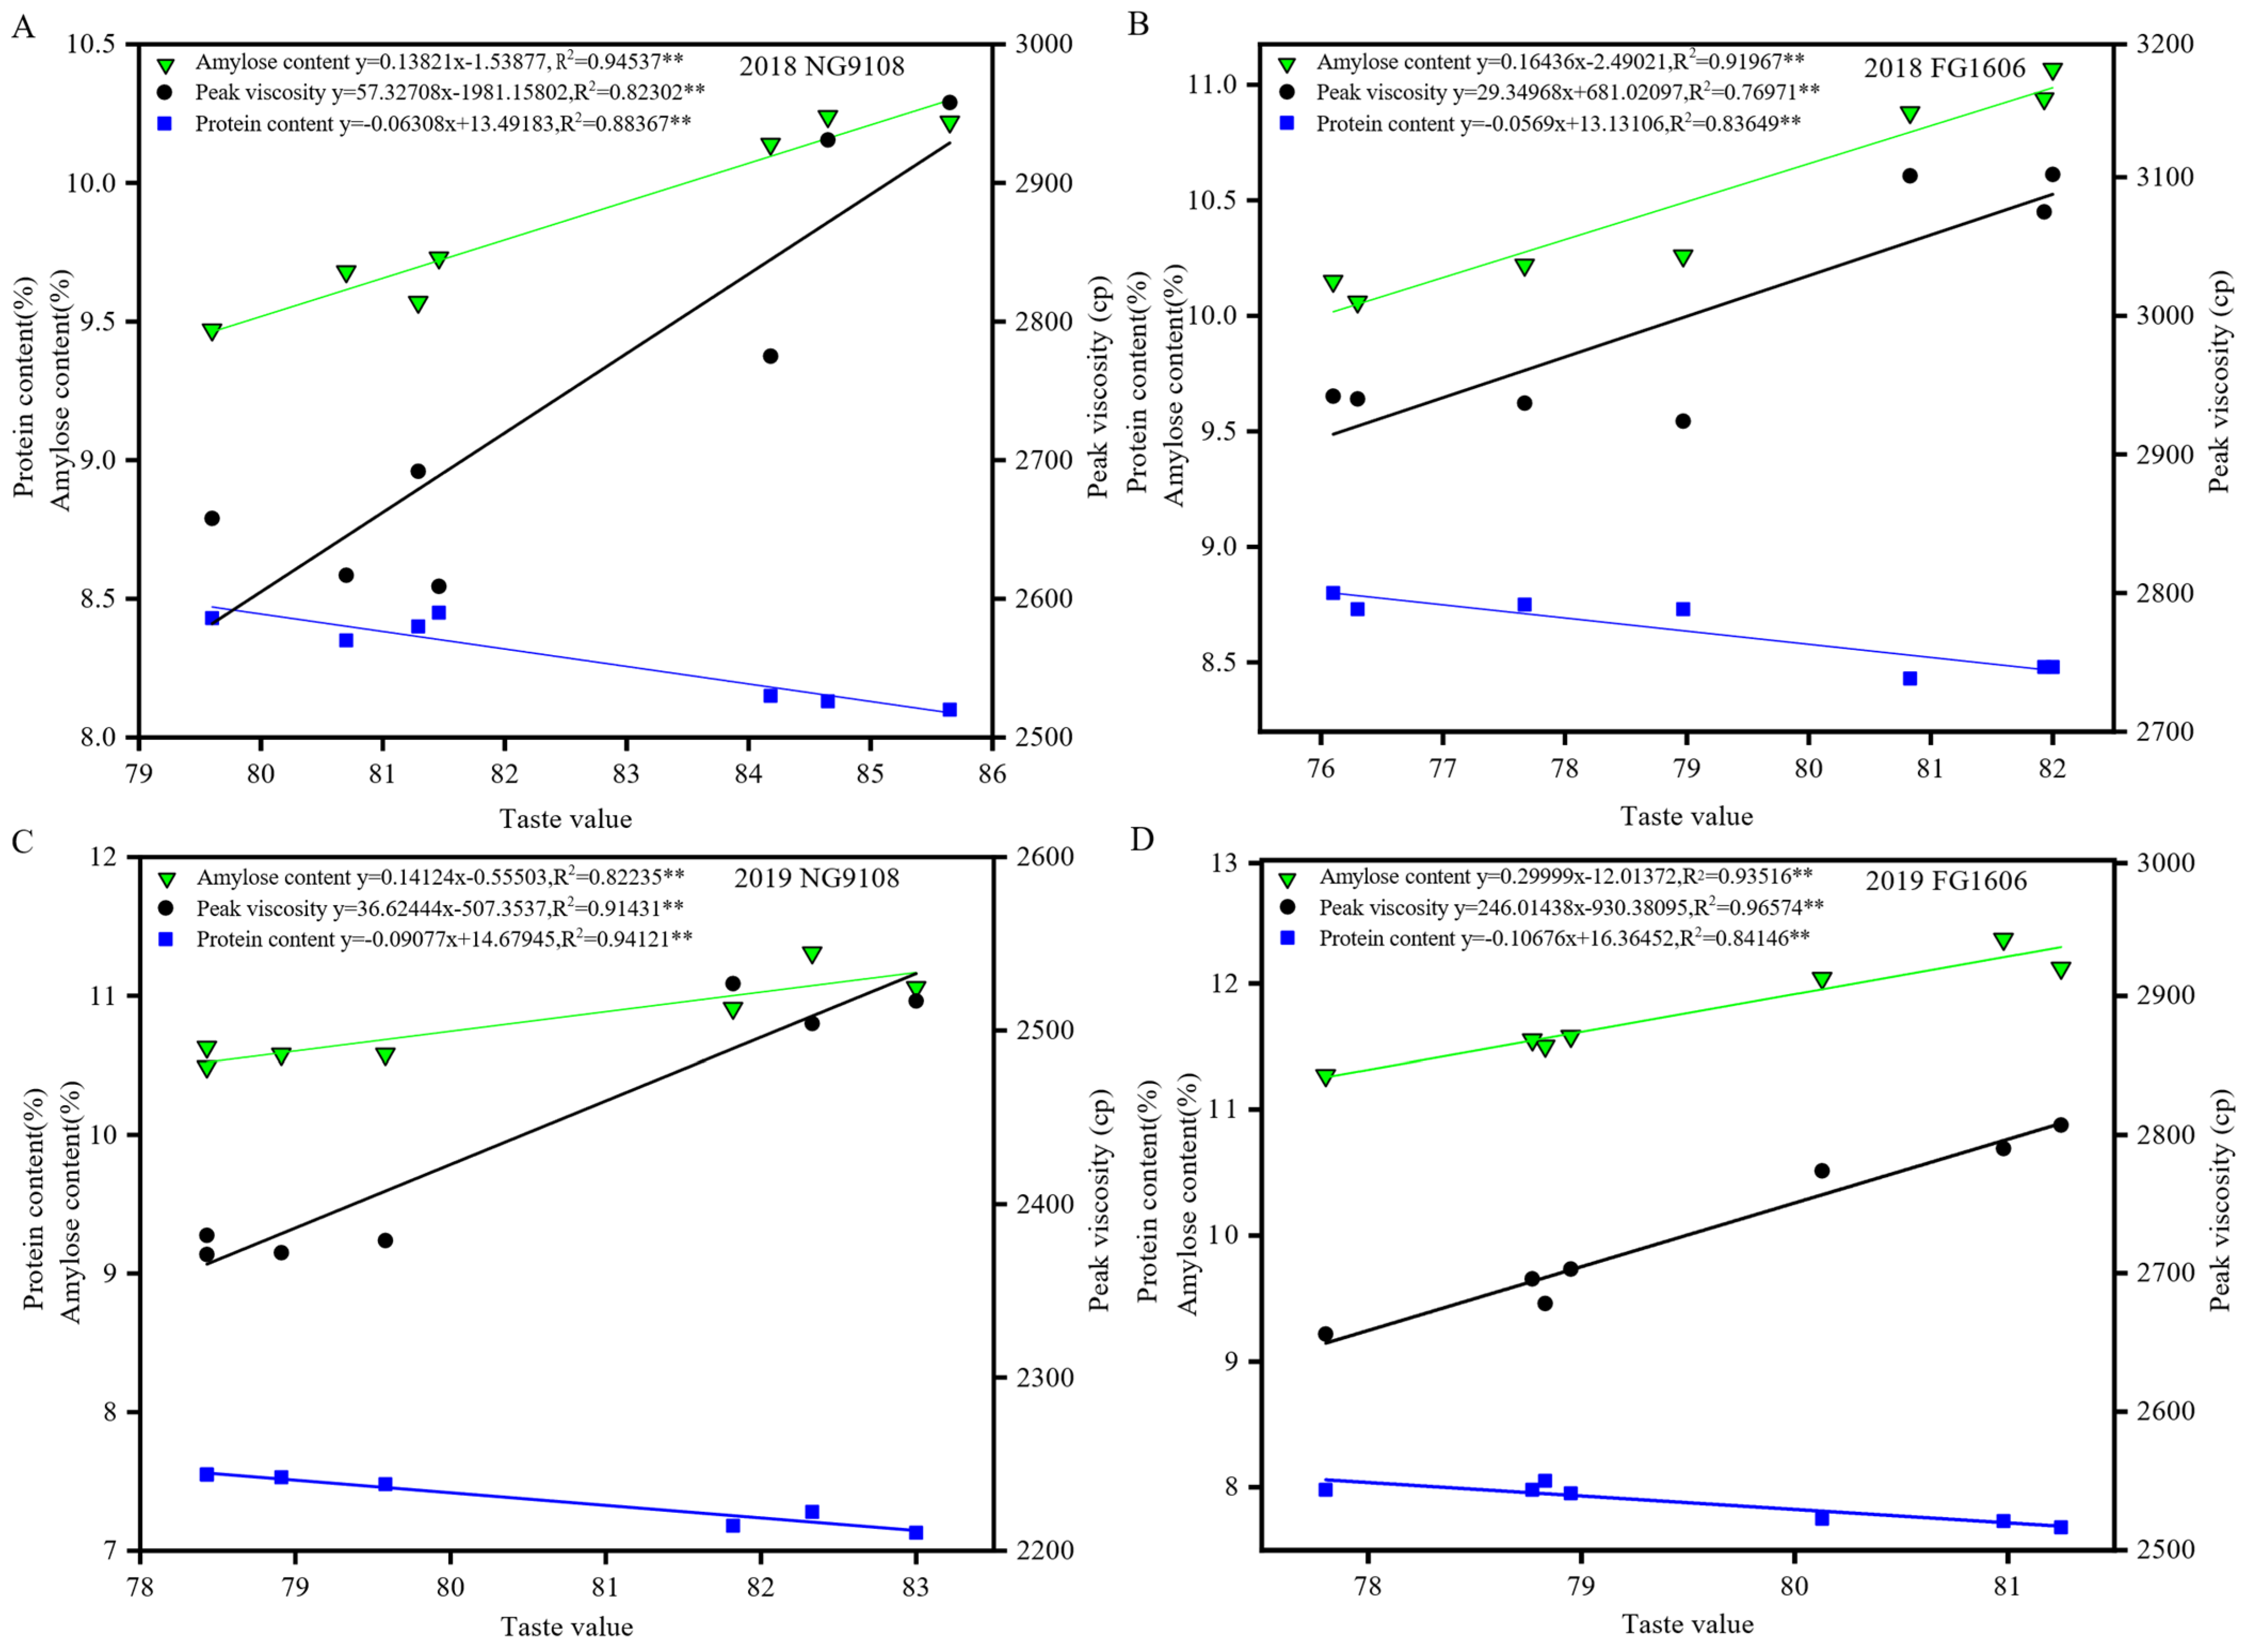
3.4.2. Correlation Analysis among NAV, Taste Quality, PC, AC, and Peak Viscosity
4. Discussion
4.1. Influence of CRNF Treatments on Rice Yield, Sink Capacity, and N Dynamics
4.2. Influence of CRNF Treatments on Rice Quality
4.3. Relationship between N-Related Characteristics and Rice Quality
5. Conclusions
Author Contributions
Funding
Data Availability Statement
Acknowledgments
Conflicts of Interest
References
- Ke, J.; Sun, J.; Chen, T.T.; Tao, S.B.; Zhu, T.Z.; Yin, C.J.; He, H.B.; You, C.C.; Wu, L.Q.; Guo, S.S. Effects of mixed fertilizers formed by the compounding of two targeted controlled-release nitrogen fertilizers on yield, nitrogen use efficiency, and ammonia volatilization in double-cropping rice. Crop J. 2023, 11, 628–637. [Google Scholar] [CrossRef]
- Zhu, C.H.; Ouyang, Y.Y.; Diao, Y.; Yu, J.Q.; Luo, X.; Zheng, J.G.; Li, X.Y. Effects of mechanized deep placement of nitrogen fertilizer rate and type on rice yield and nitrogen use efficiency in Chuanxi Plain, China. J. Integr. Agric. 2021, 20, 581–592. [Google Scholar] [CrossRef]
- Chen, Y.T.; Peng, J.; Wang, J.; Fu, P.H.; Hou, Y.; Zhang, C.D.; Fahad, S.; Peng, S.B.; Cui, K.H.; Nie, L.X.; et al. Crop management based on multi-split topdressing enhances grain yield and nitrogen use efficiency in irrigated rice in China. Field Crops Res. 2015, 184, 50–57. [Google Scholar] [CrossRef]
- Cheng, B.; Jiang, Y.; Cao, C.G. Balance rice yield and eating quality by changing the traditional nitrogen management for sustainable production in China. J. Clean. Prod. 2021, 312, 127793. [Google Scholar] [CrossRef]
- Tan, D.; Liu, Z. One-off fertilization technology realized light-simplified and green production for the three major grain crops. Sci. Agric. Sin. 2018, 51, 3823–3826. [Google Scholar] [CrossRef]
- Naz, M.Y.; Sulaiman, S.A. Slow release coating remedy for nitrogen loss from conventional urea: A review. J. Control. Release 2016, 225, 109–120. [Google Scholar] [CrossRef] [PubMed]
- Liu, Z.H.; Wu, X.B.; Tan, D.S.; Li, Y.; Jiang, L.H. Application and environmental effects of one-off fertilization technique in major cereal crops in China. Sci. Agric. Sin. 2018, 51, 3827–3839. [Google Scholar] [CrossRef]
- Lu, H.; Dun, C.P.; Jariwala, H.; Wang, R.; Cui, P.Y.; Zhang, H.P.; Dai, Q.G.; Yang, S.; Zhang, H.C. Improvement of bio-based polyurethane and its optimal application in controlled release fertilizer. J. Control. Release 2022, 350, 748–760. [Google Scholar] [CrossRef]
- Zhang, Z.J.; Chu, G.; Liu, L.J.; Wang, Z.Q.; Wang, X.M.; Zhang, H.; Yang, J.C.; Zhang, J.H. Mid-season nitrogen application strategies for rice varieties differing in panicle size. Field Crops Res. 2013, 150, 9–18. [Google Scholar] [CrossRef]
- Ke, J.; Xing, X.M.; Li, G.H.; Ding, Y.F.; Dou, F.G.; Wang, S.H.; Liu, Z.H.; Tang, S.; Ding, C.Q.; Chen, L. Effects of different controlled-release nitrogen fertilisers on ammonia volatilisation, nitrogen use efficiency and yield of blanket-seedling machine-transplanted rice. Field Crops Res. 2017, 205, 147–156. [Google Scholar] [CrossRef]
- Wu, Q.; Wang, Y.H.; Ding, Y.F.; Tao, W.K.; Gao, S.; Li, Q.X.; Li, W.W.; Liu, Z.H.; Li, G.H. Effects of different types of slow- and controlled-release fertilizers on rice yield. J. Integr. Agric. 2021, 20, 1503–1514. [Google Scholar] [CrossRef]
- Zhang, M.; Tang, S.H.; Zhang, F.B.; Huang, Q.Y.; Huang, X. Slow-release urea of 60-day-release period is suitable for one basal application in early and late rice. J. Plant Nutr. Fertil. 2017, 23, 119–127. [Google Scholar] [CrossRef]
- Ye, Y.S.; Liang, X.Q.; Chen, Y.X.; Liu, J.; Gu, J.T.; Guo, R.; Li, L. Alternate wetting and drying irrigation and controlled-release nitrogen fertilizer in late-season rice. Effects on dry matter accumulation, yield, water and nitrogen use. Field Crops Res. 2013, 144, 212–224. [Google Scholar] [CrossRef]
- Liu, Y.D.; Ma, C.; Li, G.H.; Jiang, Y.; Hou, P.F.; Xue, L.H.; Yang, L.Z.; Ding, Y.F. Lower dose of controlled/slow release fertilizer with higher rice yield and N utilization in paddies: Evidence from a meta-analysis. Field Crops Res. 2023, 294, 108879. [Google Scholar] [CrossRef]
- Hou, P.F.; Xue, L.X.; Zhou, Y.L.; Li, G.H.; Yang, L.Z.; Xue, L.H. Yield and N Utilization of Transplanted and Direct-Seeded Rice with Controlled or Slow-Release Fertilizer. Agron. J. 2019, 111, 1208–1217. [Google Scholar] [CrossRef]
- Geng, J.B.; Sun, Y.B.; Zhang, M.; Li, C.L.; Yang, Y.C.; Liu, Z.G.; Li, S.L. Long-term effects of controlled release urea application on crop yields and soil fertility under rice-oilseed rape rotation system. Field Crops Res. 2015, 184, 65–73. [Google Scholar] [CrossRef]
- Zhu, Y.; Xu, D.; Ma, Z.T.; Chen, X.Y.; Zhang, M.Y.; Zhang, C.; Liu, G.D.; Wei, H.Y.; Zhang, H.C. Differences in Eating Quality Attributes between Japonica Rice from the Northeast Region and Semiglutinous Japonica Rice from the Yangtze River Delta of China. Foods 2021, 10, 2770. [Google Scholar] [CrossRef]
- Wang, C.L.; Zhang, Y.D.; Zhu, Z.; Chen, T.; Zhao, Q.Y.; Zhong, W.G.; Yang, J.; Yao, S.; Zhou, L.H.; Zhao, L.; et al. Research progress on the breeding of japonica super rice varieties in Jiangsu Province, China. J. Integr. Agric. 2017, 16, 992–999. [Google Scholar] [CrossRef]
- Zhao, H.T.; Li, T.P.; Zhang, Y.; Hu, J.; Bai, Y.C.; Shan, Y.H.; Ke, F. Effects of vermicompost amendment as a basal fertilizer on soil properties and cucumber yield and quality under continuous cropping conditions in a greenhouse. J. Soils Sediments 2017, 17, 2718–2730. [Google Scholar] [CrossRef]
- Jiang, B.; Tsao, R.; Li, T.; Miao, M. Food safety: Food Analysis Technologies/Techniques. In Encyclopedia of Agriculture and Food Systems; Van Alfen, N.K., Ed.; Academic Press: New York, NY, USA, 2014; pp. 273–288. [Google Scholar] [CrossRef]
- GB/T17891-2017; High Quality Paddy. General Administration of Quality Supervision, Inspection and Quarantine of the People’s Republic of China. Standardization Administration of the People’s Republic of China: Beijing, China, 2017.
- NYT83-2017; Determination of Rice Quality. Ministry of Agriculture and Rural Affairs of the People’s Republic of China: Beijing, China, 2017.
- Zhang, Y.H.; Fan, J.B.; Zhang, Y.L.; Wang, D.S.; Huang, Q.W.; Shen, Q.R. N Accumulation and Translocation in Four Japonica Rice Cultivars at Different N Rates. Pedosphere 2007, 17, 792–800. [Google Scholar] [CrossRef]
- Ida, M.; Ohsugi, R.; Sasaki, H.; Aoki, N.; Yamagishi, T. Contribution of Nitrogen Absorbed during Ripening Period to Grain Filling in a High-Yielding Rice Variety, Takanari. Plant Prod. Sci. 2009, 12, 176–184. [Google Scholar] [CrossRef]
- Mi, W.H.; Zheng, S.Y.; Yang, X.; Wu, L.H.; Liu, Y.L.; Chen, J.Q. Comparison of yield and nitrogen use efficiency of different types of nitrogen fertilizers for different rice cropping systems under subtropical monsoon climate in China. Eur. J. Agron. 2017, 90, 78–86. [Google Scholar] [CrossRef]
- Wada, S.; Hayashida, Y.; Izumi, M.; Kurusu, T.; Hanamata, S.; Kanno, K.; Kojima, S.; Yamaya, T.; Kuchitsu, K.; Makino, A.; et al. Autophagy Supports Biomass Production and Nitrogen Use Efficiency at the Vegetative Stage in Rice. Plant Physiol. 2015, 168, 60–73. [Google Scholar] [CrossRef] [PubMed]
- Xing, Y.Y.; Jiang, W.T.; He, X.L.; Fiaz, S.; Ahmad, S.; Lei, X.; Wang, W.Q.; Wang, Y.F.; Wang, X.K. A review of nitrogen translocation and nitrogen-use efficiency. J. Plant Nutr. 2019, 42, 2624–2641. [Google Scholar] [CrossRef]
- Sun, Y.J.; Sun, Y.Y.; Yan, F.J.; Yang, Z.Y.; Xu, H.; Li, Y.; Wang, H.Y.; Ma, J. Effects of postponing nitrogen topdressing on post-anthesis carbon and nitrogen metabolism in rice cultivars with different nitrogen use efficiencies. Acta Agron. Sin. 2017, 43, 407–419. [Google Scholar] [CrossRef]
- Jiang, W.Q.; Hu, Q.; Yu, H.; Ma, H.Z.; Ren, G.L.; Ma, Z.T.; Zhu, Y.; Wei, H.Y.; Zhang, H.C.; Liu, G.D.; et al. Effect of one-time basal application of the mixed controlled-release nitrogen fertilizer in Japonica rice with good taste quality. Sci. Agric. Sin. 2021, 54, 1382–1396. [Google Scholar] [CrossRef]
- Mestres, C.; Ribeyre, F.; Pons, B.; Fallet, V.; Matencio, F. Sensory texture of cooked rice is rather linked to chemical than to physical characteristics of raw grain. J. Cereal Sci. 2011, 53, 81–89. [Google Scholar] [CrossRef]
- Li, H.Y.; Prakash, S.; Nicholson, T.M.; Fitzgerald, M.A.; Gilbert, R.G. Instrumental measurement of cooked rice texture by dynamic rheological testing and its relation to the fine structure of rice starch. Carbohydr. Polym. 2016, 146, 253–263. [Google Scholar] [CrossRef]
- Huang, S.J.; Zhao, C.F.; Zhu, Z.; Zhou, L.H.; Zheng, Q.H.; Wang, C.L. Characterization of eating quality and starch properties of two Wx alleles japonica rice cultivars under different nitrogen treatments. J. Integr. Agric. 2020, 19, 988–998. [Google Scholar] [CrossRef]
- Zeng, Y.H.; Tan, X.M.; Zeng, Y.J.; Xie, X.B.; Pan, X.H.; Shi, Q.H.; Zhang, J. Changes in the rice grain quality of different high-quality rice varieties released in southern China from 2007 to 2017. J. Cereal Sci. 2019, 87, 111–116. [Google Scholar] [CrossRef]
- Zhang, L.X.; Zhang, C.Q.; Yan, Y.; Hu, Z.J.; Wang, K.; Zhou, J.H.; Zhou, Y.; Cao, L.M.; Wu, S.J. Influence of starch fine structure and storage proteins on the eating quality of rice varieties with similar amylose contents. J. Sci. Food Agric. 2021, 101, 3811–3818. [Google Scholar] [CrossRef] [PubMed]
- Zhang, J.; Zhang, Y.Y.; Song, N.Y.; Chen, Q.L.; Sun, H.Z.; Peng, T.; Huang, S.; Zhao, Q.Z. Response of grain-filling rate and grain quality of mid-season indica rice to nitrogen application. J. Integr. Agric. 2021, 20, 1465–1473. [Google Scholar] [CrossRef]
- Martin, M.; Fitzgerald, M.A. Proteins in Rice Grains Influence Cooking Properties! J. Cereal Sci. 2002, 36, 285–294. [Google Scholar] [CrossRef]
- Derycke, V.; Veraverbeke, W.S.; Vandeputte, G.E.; De Man, W.; Hoseney, R.C.; Delcour, J.A. Impact of Proteins on Pasting and Cooking Properties of Nonparboiled and Parboiled Rice. Cereal Chem. 2005, 82, 468–474. [Google Scholar] [CrossRef]
- Qiao, J.F.; Liu, Z.H.; Deng, S.Y.; Ning, H.F.; Yang, X.Y.; Lin, Z.M.; Li, G.H.; Wang, Q.S.; Wang, S.H.; Ding, Y.F. Occurrence of perfect and imperfect grains of six japonica rice cultivars as affected by nitrogen fertilization. Plant Soil 2011, 349, 191–202. [Google Scholar] [CrossRef]
- Bao, J.S. Rice Milling Quality. In Rice, 4th ed.; Woodhead Publishing: Hangzhou, China, 2019; pp. 339–369. [Google Scholar] [CrossRef]
- Bian, J.L.; Xu, F.F.; Han, C.; Qiu, S.; Ge, J.L.; Xu, J.; Zhang, H.C.; Wei, H.Y. Effects of planting methods on yield and quality of different types of japonica rice in northern Jiangsu plain, China. J. Integr. Agric. 2018, 17, 2624–2635. [Google Scholar] [CrossRef]
- Simmonds, N.W. The relation between yield and protein in cereal grain. J. Sci. Food Agric. 1995, 67, 309–315. [Google Scholar] [CrossRef]
- Tsukaguchi, T.; Nitta, S.; Matsuno, Y. Cultivar differences in the grain protein accumulation ability in rice (Oryza sativa L.). Field Crops Res. 2016, 192, 110–117. [Google Scholar] [CrossRef]
- Cao, X.M.; Sun, H.Y.; Wang, C.G.; Ren, X.J.; Liu, H.F.; Zhang, Z.J. Effects of late-stage nitrogen fertilizer application on the starch structure and cooking quality of rice. J. Sci. Food Agric. 2018, 98, 2332–2340. [Google Scholar] [CrossRef]
- Kamiji, Y.; Yoshida, H.; Palta, J.A.; Sakuratani, T.; Shiraiwa, T. N applications that increase plant N during panicle development are highly effective in increasing spikelet number in rice. Field Crops Res. 2011, 122, 242–247. [Google Scholar] [CrossRef]
- Song, J.M.; Tian, J.C.; Zhao, S.J. Relationship between photosynthetic carbon and nitrogen metabolism in plants and its regulation. Plant Physiol. J. 1998, 34, 230–238. [Google Scholar] [CrossRef]
- Foyer, C.H.; Ferrario-Méry, S.; Noctor, G. Interactions between Carbon and Nitrogen Metabolism. In Plant Nitrogen; Lea, P., Morot-Gaudry, J., Eds.; Springer: Berlin/Heidelberg, Germany, 2001; pp. 237–254. [Google Scholar] [CrossRef]
- Zhao, Y.L. Effect of Nitrogen on Rice Yield and Quality and Its Physiological Mechanism. Ph.D. Thesis, Nanjing Agricultural University, Nanjing, China, 2014. [Google Scholar]
- Song, Z.; Lv, K.; Luo, F.; Lian, X.M. Effect of nitrogen application on nitrogen uptaking and utilization in ten different rice varieties. J. Huazhong Agric. Univ. 2012, 31, 165–170. [Google Scholar]

| Treatment | Basal Fertilizer | TF | SPF | SDF | ||||||
|---|---|---|---|---|---|---|---|---|---|---|
| The Release Days of CRNF | U | CF | U | U | U | |||||
| 40 d | 60 d | 80 d | 100 d | 120 d | ||||||
| A1 | 27 | 108 | 67.5 | 67.5 | ||||||
| A2 | 108 | 27 | 67.5 | 67.5 | ||||||
| B1 | 27 | 108 | 67.5 | 67.5 | ||||||
| B2 | 108 | 27 | 67.5 | 67.5 | ||||||
| C1 | 27 | 108 | 67.5 | 67.5 | ||||||
| C2 | 108 | 27 | 67.5 | 67.5 | ||||||
| CK | 47.25 | 47.25 | 94.5 | 40.5 | 40.5 | |||||
| Cultivar (2) | Treatment | NAP (kg ha−1) | NAS (kg ha−1) | NAV (mg g−1) | |||
|---|---|---|---|---|---|---|---|
| 2018 | 2019 | 2018 | 2019 | 2018 | 2019 | ||
| NG9108 | A1 | 105.74 c | 108.65 c | 183.86 d | 187.00 e | 8.56 b | 8.33 b |
| A2 | 106.58 c | 108.98 c | 186.05 d | 188.61 e | 8.53 b | 8.30 b | |
| B1 | 112.96 b | 115.22 b | 195.56 c | 200.16 d | 8.74 ab | 8.43 ab | |
| B2 | 117.05 a | 120.52 a | 204.24 a | 207.34 bc | 8.98 ab | 8.57 ab | |
| C1 | 118.26 a | 120.51 a | 206.67 a | 210.13 ab | 8.55 b | 8.29 b | |
| C2 | 117.02 a | 122.39 a | 206.50 a | 213.04 a | 8.64 b | 8.57 ab | |
| CK | 116.12 a | 120.89 a | 199.13 b | 203.46 cd | 9.21 a | 8.69 a | |
| FG1606 | A1 | 102.44 c | 103.28 c | 184.89 c | 192.18 c | 8.23 b | 8.39 c |
| A2 | 103.83 c | 105.27 c | 187.50 c | 194.80 c | 8.32 b | 8.46 bc | |
| B1 | 110.43 b | 109.87 b | 197.98 b | 204.43 b | 8.67 ab | 8.52 bc | |
| B2 | 113.94 a | 113.78 a | 206.34 a | 211.62 a | 8.65 ab | 8.59 b | |
| C1 | 114.81 a | 115.01 a | 207.64 a | 213.36 a | 8.54 b | 8.42 bc | |
| C2 | 113.95 a | 115.86 a | 208.21 a | 214.81 a | 8.76 ab | 8.58 b | |
| CK | 113.27 ab | 114.56 a | 201.69 b | 205.30 b | 9.19 a | 8.75 a | |
| Cultivar (2) | Treatment | NTA (kg ha−1) | NTE (%) | NCTR (%) | |||
|---|---|---|---|---|---|---|---|
| 2018 | 2019 | 2018 | 2019 | 2018 | 2019 | ||
| NG9108 | A1 | 68.59 cd | 71.65 cd | 55.90 a | 58.75 ab | 64.87 a | 65.96 a |
| A2 | 68.48 cd | 70.28 d | 55.06 ab | 57.20 abc | 64.26 a | 64.49 ab | |
| B1 | 70.78 b | 72.75 bcd | 53.87 b | 55.83 bcd | 62.66 a | 63.14 ab | |
| B2 | 70.37 bc | 76.26 ab | 52.01 c | 56.44 abc | 60.12 b | 63.27 ab | |
| C1 | 70.13 bc | 75.15 abc | 51.52 c | 54.90 cd | 59.30 bc | 62.36 b | |
| C2 | 67.08 d | 72.34 cd | 48.44 d | 52.91 d | 57.33 c | 59.10 c | |
| CK | 73.50 a | 76.91 a | 56.13 a | 59.03 a | 63.31 a | 63.63 ab | |
| FG1606 | A1 | 59.62 c | 62.56 c | 47.46 a | 48.68 ab | 58.21 a | 60.57 a |
| A2 | 60.57 c | 63.01 c | 47.55 a | 48.64 ab | 58.34 a | 59.86 a | |
| B1 | 61.88 ab | 65.49 ab | 46.56 ab | 47.81 b | 56.05 b | 59.62 a | |
| B2 | 63.21 a | 67.45 a | 45.45 b | 47.41 b | 55.50 b | 59.28 a | |
| C1 | 62.37 ab | 67.79 a | 44.83 b | 47.50 b | 54.32 b | 58.94 a | |
| C2 | 59.08 c | 63.91 bc | 42.48 c | 45.54 c | 51.85 c | 55.16 b | |
| CK | 63.43 a | 66.89 a | 48.31 a | 49.50 a | 56.01 b | 58.9 a | |
| Year | Cultivar (2) | Treatment | Processing Quality | Appearance Quality | |||
|---|---|---|---|---|---|---|---|
| BRR (%) | MRR (%) | HMRR (%) | CR (%) | CD (%) | |||
| 2018 | NG9108 | A1 | 84.90 a | 74.88 a | 65.60 a | 60.33 a | 23.39 a |
| A2 | 84.94 a | 75.18 a | 65.34 a | 58.71 ab | 21.96 ab | ||
| B1 | 85.15 a | 74.39 a | 65.27 a | 55.29 b | 20.22 b | ||
| B2 | 85.07 a | 75.93 a | 66.18 a | 56.54 b | 20.92 b | ||
| C1 | 84.93 a | 75.23 a | 65.64 a | 60.06 a | 22.24 ab | ||
| C2 | 84.82 a | 74.31 a | 65.19 a | 50.11 c | 16.36 c | ||
| CK | 85.10 a | 73.99 a | 64.42 a | 56.53 b | 20.56 b | ||
| FG1606 | A1 | 85.05 a | 74.92 a | 64.43 a | 31.44 ab | 9.54 a | |
| A2 | 85.25 a | 74.92 a | 64.81 a | 31.02 ab | 9.55 a | ||
| B1 | 85.26 a | 74.45 a | 65.36 a | 30.19 ab | 8.90 ab | ||
| B2 | 85.02 a | 74.14 a | 65.16 a | 29.21 ab | 8.86 ab | ||
| C1 | 85.15 a | 74.80 a | 64.98 a | 31.61 a | 9.18 ab | ||
| C2 | 85.03 a | 74.11 a | 64.01 a | 28.31 b | 7.72 b | ||
| CK | 84.93 a | 74.05 a | 64.05 a | 28.83 ab | 8.50 ab | ||
| 2019 | NG9108 | A1 | 85.16 a | 73.13 a | 59.66 a | 51.89 b | 17.08 ab |
| A2 | 85.15 a | 72.29 a | 59.57 a | 53.30 ab | 17.66 ab | ||
| B1 | 85.20 a | 73.81 a | 59.79 a | 51.15 b | 16.38 b | ||
| B2 | 85.23 a | 72.56 a | 60.13 a | 53.75 ab | 18.13 ab | ||
| C1 | 85.35 a | 72.37 a | 60.05 a | 55.90 a | 20.51 a | ||
| C2 | 85.16 a | 72.81 a | 59.91 a | 53.71 ab | 18.74 ab | ||
| CK | 85.25 a | 73.73 a | 59.86 a | 53.26 ab | 19.02 ab | ||
| FG1606 | A1 | 85.30 a | 73.45 a | 65.40 a | 23.35 a | 8.61 a | |
| A2 | 85.54 a | 74.38 a | 65.48 a | 22.89 ab | 8.40 a | ||
| B1 | 85.51 a | 74.07 a | 66.13 a | 18.68 c | 5.31 c | ||
| B2 | 85.60 a | 73.59 a | 65.93 a | 21.77 abc | 6.89 abc | ||
| C1 | 85.76 a | 74.39 a | 65.63 a | 23.44 a | 7.46 ab | ||
| C2 | 85.70 a | 73.86 a | 65.56 a | 19.51 bc | 5.92 bc | ||
| CK | 85.78 a | 74.47 a | 65.06 a | 20.29 abc | 6.74 abc | ||
| Year | Cultivar (2) | Treatment | PC (%) | AC (%) | Reference Value of Eating Quality | ||||
|---|---|---|---|---|---|---|---|---|---|
| Appearance | Hardness | Viscosity | Degree of Balance | Taste Value | |||||
| 2018 | NG9108 | A1 | 8.13 b | 10.24 a | 8.68 b | 5.60 b | 8.88 a | 8.75 ab | 84.65 b |
| A2 | 8.15 b | 10.14 a | 8.65 b | 5.63 b | 8.83 a | 8.59 bc | 84.18 b | ||
| B1 | 8.35 a | 9.68 b | 8.20 cd | 5.73 ab | 8.20 c | 8.20 de | 80.70 c | ||
| B2 | 8.43 a | 9.47 b | 8.13 d | 5.83 a | 8.30 c | 8.15 e | 79.60 d | ||
| C1 | 8.10 b | 10.22 a | 8.85 a | 5.40 c | 8.95 a | 8.85 a | 85.65 a | ||
| C2 | 8.45 a | 9.73 b | 8.34 c | 5.81 a | 8.61 b | 8.41 cd | 81.46 c | ||
| CK | 8.40 a | 9.57 c | 8.36 c | 5.82 a | 8.57 b | 8.38 cd | 81.29 c | ||
| FG1606 | A1 | 8.43 b | 10.88 a | 8.40 ab | 5.63 cd | 8.20 ab | 8.33 ab | 80.83 ab | |
| A2 | 8.48 b | 10.94 a | 8.60 a | 5.57 cd | 8.50 a | 8.53 a | 81.93 a | ||
| B1 | 8.75 a | 10.22 b | 8.00 bc | 5.80 abc | 7.60 c | 7.83 c | 77.67 c | ||
| B2 | 8.73 a | 10.26 b | 8.20 ab | 5.77 bcd | 7.93 bc | 8.03 bc | 78.97 bc | ||
| C1 | 8.48 b | 11.08 a | 8.57 a | 5.53 d | 8.37 ab | 8.50 a | 82.00 a | ||
| C2 | 8.80 a | 10.15 b | 7.73 c | 5.97 ab | 7.50 c | 7.57 c | 76.10 c | ||
| CK | 8.73 a | 10.06 b | 7.70 c | 6.03 a | 7.67 c | 7.60 c | 76.30 c | ||
| 2019 | NG9108 | A1 | 7.18 b | 10.91 abc | 8.39 a | 5.81 a | 8.68 ab | 8.47 a | 81.82 a |
| A2 | 7.13 b | 11.06 ab | 8.50 a | 5.78 a | 8.80 a | 8.58 a | 83.00 a | ||
| B1 | 7.48 a | 10.58 c | 8.00 b | 5.98 a | 8.48 bc | 8.13 b | 79.58 b | ||
| B2 | 7.55 a | 10.49 c | 7.90 b | 6.00 a | 8.20 cd | 7.95 b | 78.43 b | ||
| C1 | 7.28 b | 11.31 a | 8.36 a | 5.84 a | 8.79 a | 8.50 a | 82.33 a | ||
| C2 | 7.53 a | 10.58 c | 7.95 b | 5.92 a | 8.21 cd | 8.03 b | 78.91 b | ||
| CK | 7.55 a | 10.63 bc | 7.90 b | 5.94 a | 8.13 d | 7.95 b | 78.43 b | ||
| FG1606 | A1 | 7.75 b | 12.04 a | 8.28 a | 5.80 bc | 8.23 a | 8.20 ab | 80.13 ab | |
| A2 | 7.73 b | 12.35 a | 8.29 a | 5.75 c | 8.40 a | 8.33 a | 80.98 a | ||
| B1 | 8.05 a | 11.50 b | 8.03 b | 5.92 a | 8.13 ab | 8.02 b | 78.83 bc | ||
| B2 | 7.98 a | 11.27 b | 7.73 c | 5.97 a | 7.75 b | 7.71 c | 77.80 c | ||
| C1 | 7.68 b | 12.12 a | 8.37 a | 5.70 c | 8.47 a | 8.38 a | 81.25 a | ||
| C2 | 7.98 a | 11.55 b | 7.98 b | 5.93 a | 8.18 a | 8.02 b | 78.77 bc | ||
| CK | 7.95 a | 11.58 b | 8.00 b | 5.90 ab | 8.25 a | 8.00 b | 78.95 bc | ||
| Year | Cultivar (1) | Treatment | Peak Viscosity (cp) | Hot Viscosity (cp) | Cool Viscosity (cp) | Breakdown (cp) | Setback (cp) |
|---|---|---|---|---|---|---|---|
| 2018 | NG9108 | A1 | 2931 a | 1557 a | 2250 a | 1374 a | −681 c |
| A2 | 2775 b | 1500 ab | 2123 b | 1276 b | −652 bc | ||
| B1 | 2617 c | 1423 c | 2062 b | 1194 bc | −555 a | ||
| B2 | 2658 c | 1433 bc | 2068 b | 1225 bc | −590 ab | ||
| C1 | 2958 a | 1550 a | 2282 a | 1408 a | −677 c | ||
| C2 | 2609 c | 1466 bc | 2074 b | 1144 c | −536 a | ||
| CK | 2692 bc | 1469 bc | 2097 b | 1224 bc | −596 ab | ||
| FG1606 | A1 | 3101 a | 1545 a | 2175 a | 1557 a | −926 c | |
| A2 | 3075 a | 1545 a | 2164 a | 1530 ab | −911 bc | ||
| B1 | 2937 b | 1474 ab | 2073 b | 1464 cd | −864 ab | ||
| B2 | 2924 b | 1493 ab | 2068 b | 1431 d | −856 ab | ||
| C1 | 3102 a | 1530 ab | 2193 a | 1572 a | −909 abc | ||
| C2 | 2942 b | 1502 ab | 2092 b | 1441 d | −851 a | ||
| CK | 2940 b | 1452 b | 2075 b | 1488 bc | −866 ab | ||
| 2019 | NG9108 | A1 | 2527 a | 1396 a | 1983 a | 1131 ab | −544 bc |
| A2 | 2517 a | 1406 a | 1985 a | 1111 b | −532 bc | ||
| B1 | 2379 b | 1302 c | 1857 c | 1078 c | −522 abc | ||
| B2 | 2382 b | 1301 c | 1877 bc | 1081 c | −500 ab | ||
| C1 | 2504 a | 1344 b | 1922 b | 1160 a | −582 c | ||
| C2 | 2372 b | 1300 c | 1864 bc | 1072 c | −508 ab | ||
| CK | 2371 b | 1310 bc | 1906 bc | 1061 c | −465 a | ||
| FG1606 | A1 | 2774 b | 1540 a | 2127 ab | 1235 a | −647 abc | |
| A2 | 2790 ab | 1539 a | 2136 a | 1251 a | −654 bc | ||
| B1 | 2678 cd | 1496 b | 2064 c | 1182 b | −614 a | ||
| B2 | 2656 d | 1477 b | 2046 c | 1180 b | −611 a | ||
| C1 | 2807 a | 1569 a | 2129 ab | 1238 a | −678 c | ||
| C2 | 2696 c | 1498 b | 2074 bc | 1198 b | −622 ab | ||
| CK | 2703 c | 1504 b | 2083 abc | 1200 b | −621 ab |
Disclaimer/Publisher’s Note: The statements, opinions and data contained in all publications are solely those of the individual author(s) and contributor(s) and not of MDPI and/or the editor(s). MDPI and/or the editor(s) disclaim responsibility for any injury to people or property resulting from any ideas, methods, instructions or products referred to in the content. |
© 2023 by the authors. Licensee MDPI, Basel, Switzerland. This article is an open access article distributed under the terms and conditions of the Creative Commons Attribution (CC BY) license (https://creativecommons.org/licenses/by/4.0/).
Share and Cite
Hu, Q.; Jiang, W.; Ma, Z.; Cheng, S.; Liu, G.; Gu, D.; Zhang, H.; Wei, H. One-Time Mixed Nitrogen Fertilizers Application Enhances Yield and Eating Quality of Late-Maturing Medium Japonica Rice in the Yangtze River Delta. Agronomy 2023, 13, 3047. https://doi.org/10.3390/agronomy13123047
Hu Q, Jiang W, Ma Z, Cheng S, Liu G, Gu D, Zhang H, Wei H. One-Time Mixed Nitrogen Fertilizers Application Enhances Yield and Eating Quality of Late-Maturing Medium Japonica Rice in the Yangtze River Delta. Agronomy. 2023; 13(12):3047. https://doi.org/10.3390/agronomy13123047
Chicago/Turabian StyleHu, Qun, Weiqin Jiang, Zhongtao Ma, Shuang Cheng, Guodong Liu, Dalu Gu, Hongcheng Zhang, and Haiyan Wei. 2023. "One-Time Mixed Nitrogen Fertilizers Application Enhances Yield and Eating Quality of Late-Maturing Medium Japonica Rice in the Yangtze River Delta" Agronomy 13, no. 12: 3047. https://doi.org/10.3390/agronomy13123047
APA StyleHu, Q., Jiang, W., Ma, Z., Cheng, S., Liu, G., Gu, D., Zhang, H., & Wei, H. (2023). One-Time Mixed Nitrogen Fertilizers Application Enhances Yield and Eating Quality of Late-Maturing Medium Japonica Rice in the Yangtze River Delta. Agronomy, 13(12), 3047. https://doi.org/10.3390/agronomy13123047