1. Introduction
Wine, deeply rooted in history, has been a cornerstone in leisure, trade, politics, and culture. Its journey from ancient vineyards to modern tables mirrors changes in agricultural practices and social values, a narrative captured eloquently in both mainstream [
1] and academic works [
2,
3,
4]. These sources chronicle the enduring sociocultural and economic significance of wine. Today, the wine industry faces new challenges, primarily due to climate change. This phenomenon is reshaping viticulture, as increased temperatures, water deficits, and changing radiation patterns directly affect grape quality. To address these challenges, the industry is adopting sustainable practices, such as selecting resilient grape varieties, implementing efficient water management, and adapting canopy and soil management techniques [
5]. This ongoing evolution underscores the resilience and adaptability of viticulture and wine production, tracing a remarkable journey from its historical roots to the forefront of modern environmental adaptation and addressing the pressing challenge of climate [
6].
Broad EU-centric studies have revealed how regulatory changes affect wine production [
7], complemented by research on various legal oversight practices in the wine industries of large non-European countries [
8,
9,
10], with some countries having more stringent regulations than others [
11]. However, there is a scarcity of research specifically targeting legal frameworks of smaller countries. One such study outlines the regulations that govern the production, processing, quality control, and marketing of wine in Serbia [
12]. This diverse collection of articles uses techniques such as historical, economic and policy analysis, complemented by comparative studies, statistical data, case studies, legislative review, and discussions of political influences. In addition, it includes detailed examinations of sector standards and provides policy recommendations.
Through our systematic review, adhering to the PRISMA recommendations, we have identified a knowledge gap in the adaptability of smaller and evolving wine markets and their comparison in terms of regulations, trade, and production with other markets, regardless of size. Therefore, our review focuses on emerging European wine markets, which are often underrepresented in broader studies. Particular attention is given to the Romanian market and its legislative framework, chosen for its unique combination of traditional methods and contemporary adaptations, which serves to exemplify these trends. Furthermore, our exploratory data analysis, utilizing methods such as clustering and principal component analysis (PCA), examines the evolving production and trade patterns within the European wine industry.
Four research questions, emerging from our initial analyses, form a solid foundation for an in-depth examination in the subsequent sections of this paper:
RQ1: How have the different rules and regulations applied to wine changed over time and in different places, and what effect have they had on trade and production?
RQ2: How is the wine industry today dealing with the need to be more sustainable, and are there differences in how different regions are approaching this?
RQ3: What can the production data and value comparisons of European countries, especially Romania, tell us about the differentiating aspects and the variety of the wine industry in the region?
RQ4: How do government oversight and economic factors influence the production and trade profiles of European wine-producing countries, and how can clustering and PCA methodologies highlight and visualize these distinctions in the context of the broader European wine industry?
This methodical approach seeks to contribute meaningfully to the existing body of knowledge, paving the way for more detailed future research in these interconnected markets.
The article is organized as follows:
Section 2 outlines the ‘Materials and Methods’, describing the PRISMA-inspired systematic review process and analytical techniques employed.
Section 3, ‘The Administrative Significance of Wine in Roman Society’, examines ancient wine governance. ‘Medieval Oversight and Governance’ is discussed in
Section 4, which describes the evolution of wine-related institutions.
Section 5, ‘Modern Regulatory Frameworks’, analyzes contemporary wine laws. ‘The Legal Blueprint of Romania’s Wine Industry’ is presented in
Section 6, focusing on Romania’s legislation. ‘The Modern Challenges of Eco-Friendly Viticulture’ is explored in
Section 7, addressing sustainability in viticulture.
Section 8, ‘Wine Production in Europe’, analyzes current production data. The ‘Conclusions’ section ties the findings together, highlighting the study’s implications for policy, its limitations, and avenues for further research.
2. Materials and Methods
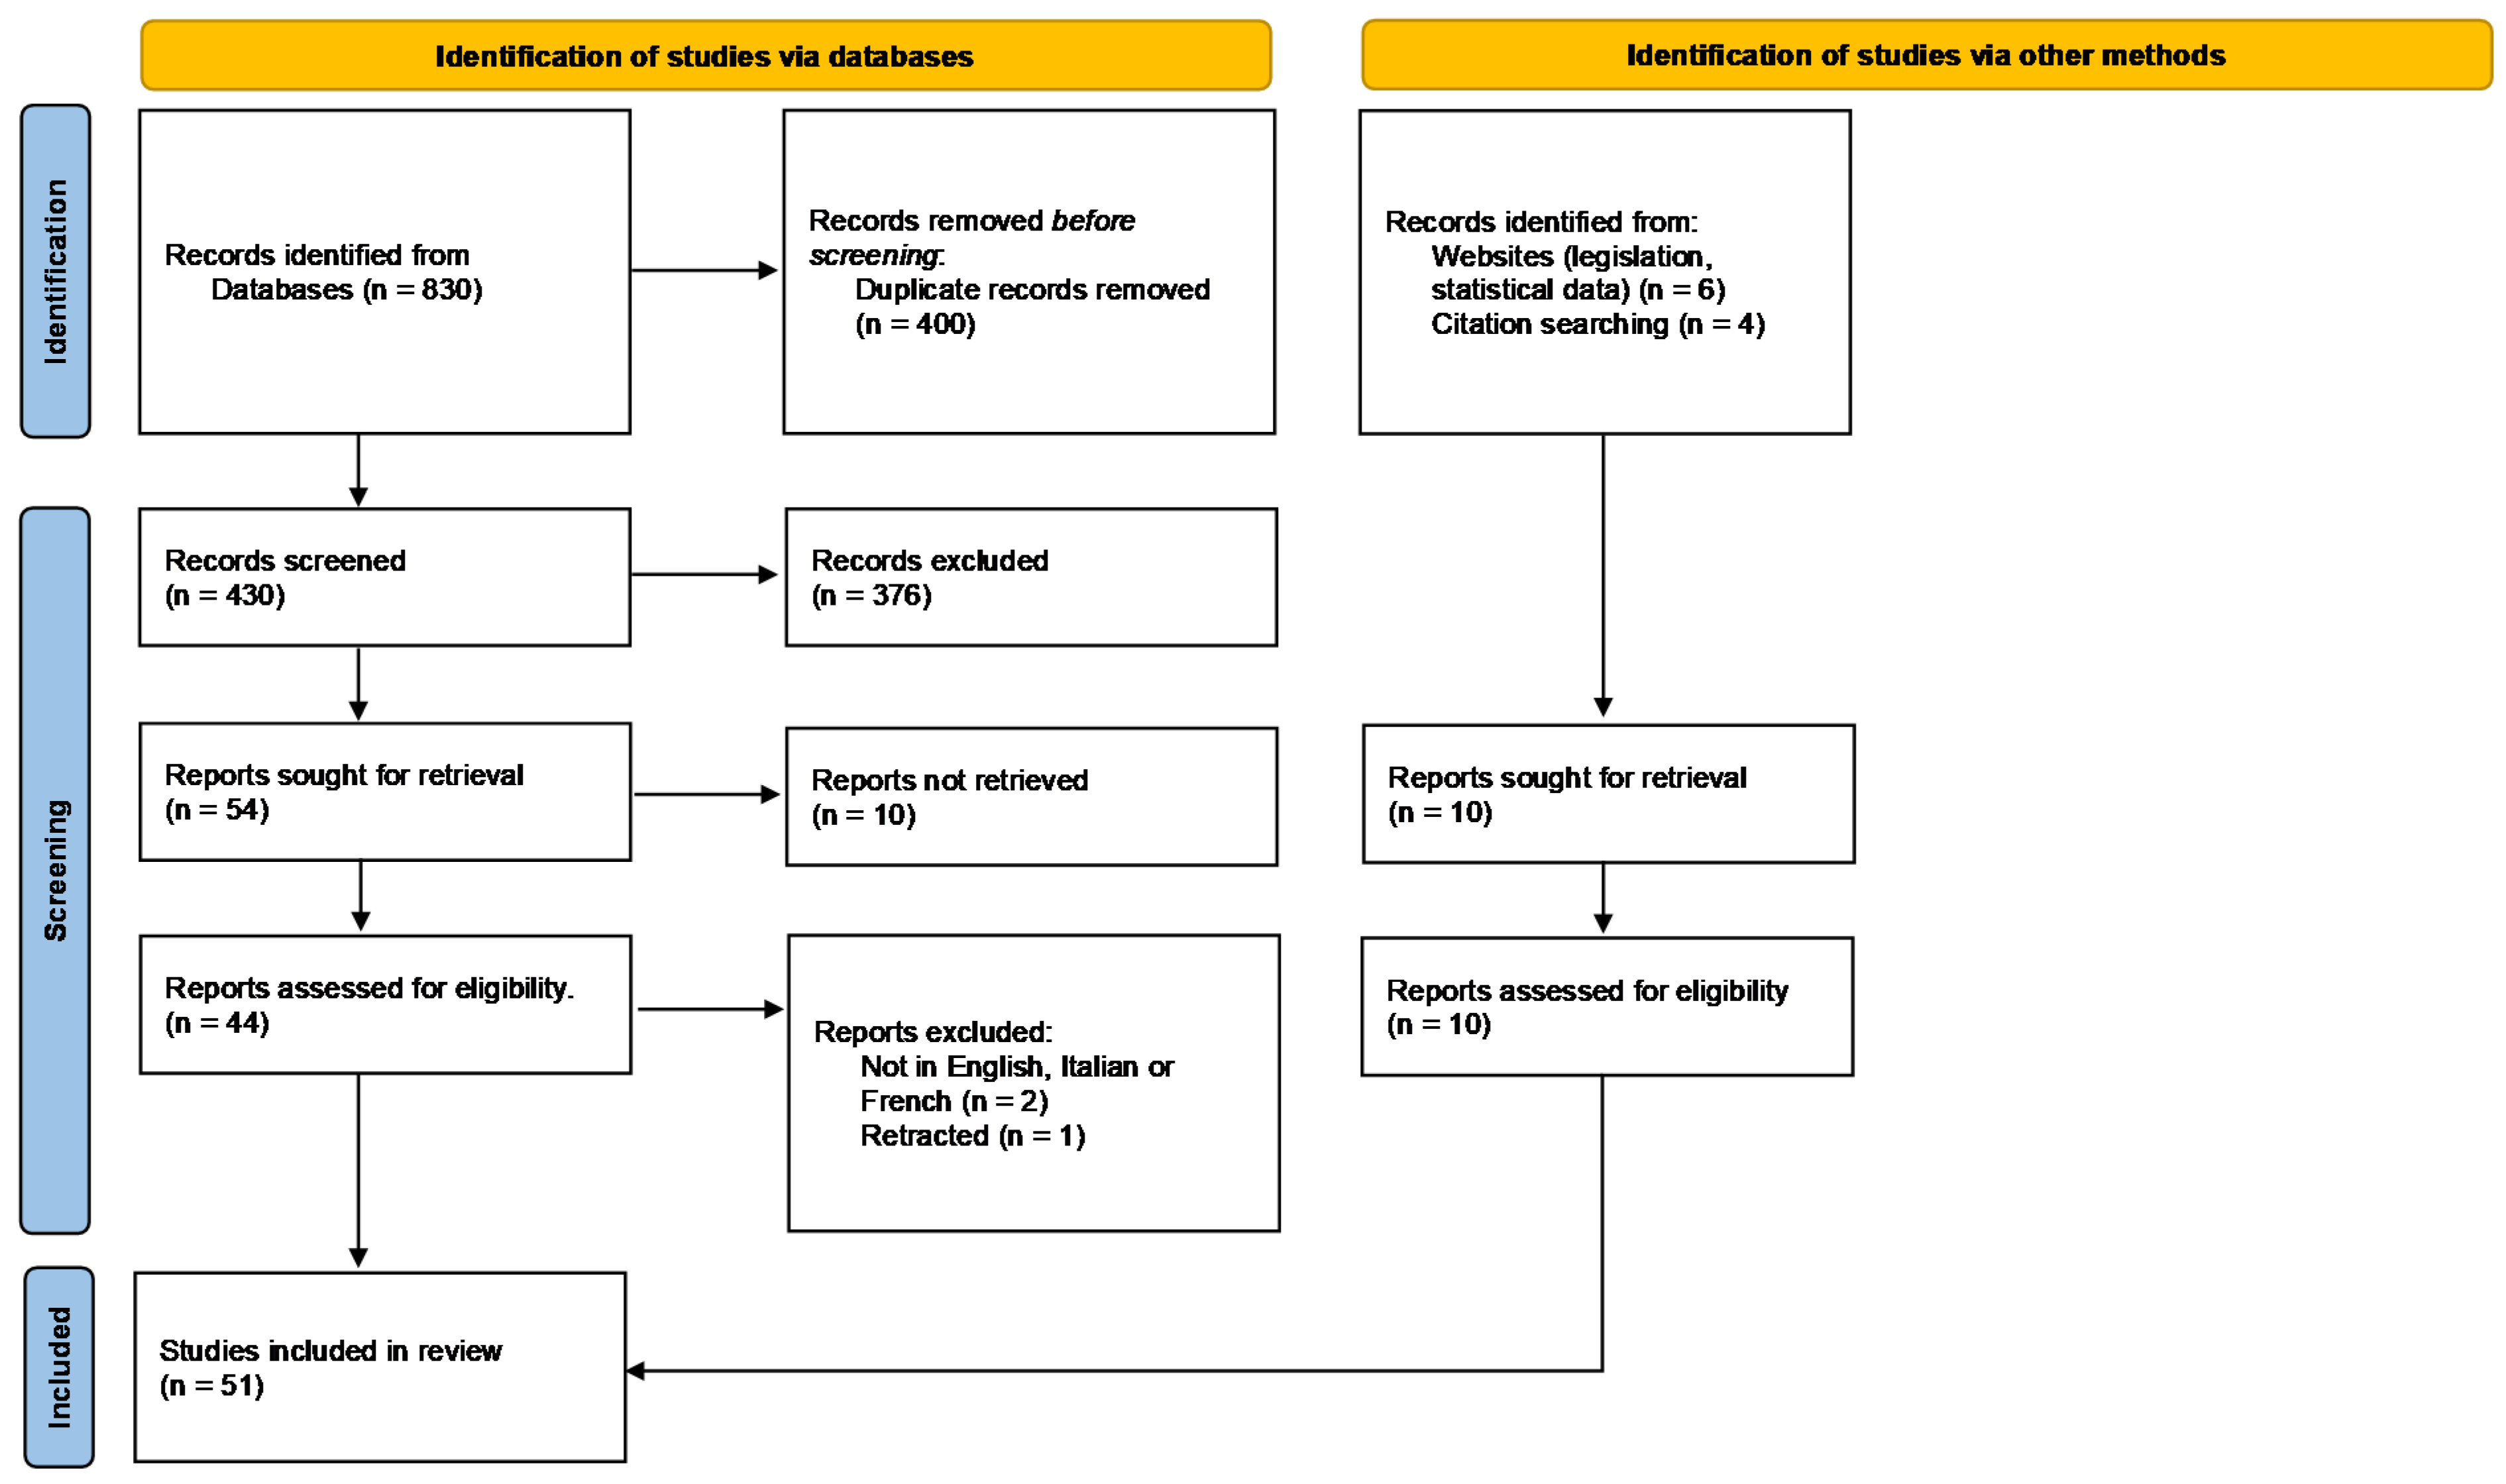
To systematically explore the evolution of wine regulations, the adaptation of the wine industry to sustainability, and the insights from production data and value comparisons, particularly focusing on Romania, we adopted a methodology inspired by the PRISMA 2020 statement [
13], which is the state of the art in reporting systematic reviews. The systematic literature search was conducted over a period spanning from 2010 to 2023. This time frame was chosen to capture the most recent and relevant developments in the field of wine regulations and sustainability practices within the wine industry. Certain older but pivotal works were also included if retrieved by citation searching.
Identification of sources: We started our research by identifying a diverse array of sources, including academic journals, historical texts, government bills, and statistical databases. A comprehensive search was conducted in multiple databases such as Scopus, Web of Science, and Google Scholar, using keywords or topics such as “wine regulations”, “viticulture sustainability”, “wine production data”, and “European wine industry”. Web of Science and Scopus were mainly used for identifying articles and Google Scholar for books. For each search, results were sorted according to relevance, and only the first 100 results for each search were considered. In addition to our primary literature search, we employed a backtracking approach by reviewing the references of the identified papers. This method allowed us to uncover additional relevant studies, including laws and statistical sources that were not initially captured in the database searches, ensuring a thorough and comprehensive review of the literature.
Credibility Assessment: Studies from esteemed publishers and journals known for their strict peer-review standards, such as MDPI, Emerald, Sage, Elsevier, and Springer, were prioritized. Likewise, articles from journals issued by academic institutions or research organizations received preferential consideration. Priority was given to recent articles and highly cited papers.
Screening and eligibility: Following identification, the titles and abstracts were screened to exclude irrelevant studies, resulting in a refined list of sources. The eligibility of the remaining sources was assessed by reviewing the full text, ensuring that each contributed valuable insights to one or more of our research questions. For inclusion, the source had to fit the research questions, be credible, and provide enough information. The inclusion criteria were set to encompass peer-reviewed articles and reports, studies focusing on the historical development of wine regulations, research exploring sustainability practices in viticulture, and data-centric studies on wine production and trade with a particular focus on European countries. Conversely, the exclusion criteria were established to omit non-peer-reviewed articles and commentaries and studies not related to wine industry regulations, sustainability, or production data. Retracted publications were filtered out.
Data Extraction and Analysis: When available, data were extracted from eligible sources, focusing on the historical evolution of regulations, sustainability practices, production volumes, and value comparisons. A thematic analysis was used to categorize the extracted data, facilitating a nuanced exploration of the themes that underlie each research question. Comparative analysis was particularly instrumental in evaluating the production data and value of wines in European countries, with an emphasis on Romania.
Quality Assessment: To ensure the reliability and validity of our findings, a quality assessment was conducted on each included source. This involved evaluating the credibility of the authors, the rigor of the research design, the relevance of the findings, and the overall contribution to the field of study.
Synthesis of Findings: The final step involved synthesizing the findings from the analyzed data, drawing connections between historical developments, contemporary challenges, and industry dynamics. This synthesis allowed for a comprehensive understanding of the multifaceted wine industry, addressing the posed research questions, and contributing to the academic discourse on wine regulations, sustainability, and production diversity.
The PRISMA diagram flow is shown in
Figure 1.
As part of our comprehensive review of the literature in the field of viticulture and wine production, we have identified several key thematic areas that have been the focus of research over the past decades. These areas represent the diverse aspects of wine research, ranging from historical and economic perspectives to the latest advancements in technology and sustainability practices in viticulture.
Table 1 summarizes these thematic areas, providing a brief description and key references that have significantly contributed to each topic. This overview facilitates a better understanding of the current state of research and the evolution of key themes in viticulture and enology.
Table 1 provides an initial set of references for each topic area, forming a foundational basis. It should be noted, however, that this list of references is not comprehensive. Not every article cited in the extensive review is included in this table. Additionally, some cited papers are not directly connected to the bibliographic study; instead, they relate to the technical aspects of the research, such as Principal Component Analysis (PCA) and k-means clustering.
By adhering to a structured and systematic approach inspired by The PRISMA 2020 statement, this methodology ensured a thorough and balanced exploration of the wine industry’s evolution, adaptations, and distinct characteristics, providing a foundation for the insights and conclusions drawn in this article.
3. The Administrative Significance of Wine in Roman Society
The connection between winemakers and authorities dates back to ancient civilizations, where wine was more than a celebratory beverage; it was central to commerce and daily life, especially in ancient Rome. Romans, from aristocrats to commoners, considered wine a staple, making it a significant trade item and a source of livelihood for many. Recognizing the importance of the industry, Roman leaders closely monitored wine quality for public health and economic reasons. Many members of the Senate, Rome’s power center owned vineyards and saw the expansion of the Roman Empire as an opportunity to access new markets for their wine [
14].
The Roman government collected taxes from wine sales, both within Rome and from exports. This tax money was a big part of the government’s income. By making sure the wine was of high quality and genuine, the government had a reason to keep these taxes. Some of Rome’s conquering expeditions, including Julius Caesar’s military expedition into Gallia, were even financed by Roman senators with vested interests in the wine business [
4].
Also, having consistently good wine became a mark of Roman trade. It built trust with other countries and traders. If they were trading with Rome, they knew that they would get genuine good quality wine. To promote fair trade and consumer safety, the Roman authorities established clear guidelines. A notable example was the use of amphorae, large clay jars, for wine transport [
15]. These jars bore codes, logos, numbers, drawings, and letters, indicating their place of origin and vouching for the quality of the wine. This was an early attempt to protect consumers from fraudulent geographical indications and an ancient precursor to today’s labeling practices, showcasing the government’s hands-on approach [
29].
It is worth noting a cultural practice from ancient Greece and Rome. Diluting wine with water before drinking was the norm. Consuming undiluted wine or drinking it “neat” was considered uncivilized. The Romans had a term for such pure wine: “merum”. The Greeks called it “akratos”. This practice was ingrained in their way of life. Renowned ancient authors like Herodotus, Plato, and Aristophanes have documented and discussed this tradition in their works, shedding light on its significance in these societies [
30].
The tradition of blending water with wine is not just cultural; it holds spiritual meaning too [
31]. In Christian religious ceremonies, notably the Mass, a few drops of water are combined with wine, underscoring the ritual’s deep spiritual significance, symbolizing the inseparable union of the people (represented by water) and the Blood of Christ (represented by wine).
Furthermore, ancient civilizations, with their wealth of myths, rituals, and medical practices, often incorporated wine and alcohol into their therapeutic regimens. These substances were considered potent agents capable of healing and rejuvenation [
32].
4. Medieval Oversight and Governance
While the ancient Romans laid the groundwork for the significance of wine in society, the medieval era further refined and expanded upon these foundations. During medieval times in Europe, wine production grew a lot, especially in well-known areas like Bordeaux and Burgundy. These places had good soil and weather for grape growing, making them key spots for winemaking. They became famous both within Europe and outside it. Around this time, groups started to form to oversee the wine trade. With the support of local governments, these groups set standards for making wine, organized events to promote trade, and set prices. They also made sure that wines from places like Bordeaux or Burgundy were well-made and met certain quality standards. These groups also helped winemakers share knowledge with each other. This sharing helped to improve the way wine was made and kept the industry moving forward.
The medieval period, characterized by flourishing trade networks and the rise of urban centers, saw wine not just as a beverage of choice, but also as a significant economic commodity. Taxation was a central theme in the medieval wine trade. Given the widespread consumption of wine among social classes and its religious significance, it was a lucrative source of revenue for monarchs and local lords. Taxation was not merely a means of filling the treasury; it was also a tool of control and regulation. By imposing taxes, rulers could exert influence on trade routes, prices, and even the quality of wine flowing through their territories [
33].
Beyond taxation, government intervention manifested itself in the form of charters: licenses granted to merchants, often accompanied by privileges like tax reductions or exclusive trade rights. However, these charters were double-edged swords. Although they streamlined trade, they also became sources of controversy. Accusations of favoritism and corruption were rife, as influential merchants, through close ties with rulers, sometimes secured undue advantages, sidelining smaller traders. The era witnessed controversies surrounding wine quality. High demand led some traders to adulterate wine, diluting it to increase volume. Such practices, detrimental to the trade’s reputation, prompted government interventions, with strict quality controls being imposed, and wrongdoers facing penalties.
The 18th century was important for the wine industry, especially when it came to setting rules against false labeling. During this time, there was a growing problem with sellers misleading buyers about where their wine came from. To address this, Medici Grand Duke Cosimo III from Florence made a rule in 1716. He marked clear areas in Tuscany, such as Chianti, Carmignano, and Pomino, where specific wines were produced. This meant that sellers from outside these areas could not claim their wine was from there if it was not. Similarly, Portugal made a rule in 1756 for the Duoro Valley. They marked an area in upper Duoro where the best wines came from. Growers in this area could sell their wines at higher prices because they were considered to be of better quality. These rules from Italy and Portugal were early steps to make sure that buyers knew where their wine was really from and that they were getting what they paid for [
34].
Regions in Italy, Germany, and France were renowned for their spiced wines, with Turin establishing itself as a principal producer by the 18th century. Wine transcended its role as a simple drink. The respected 14th century physician and theologian Arnaldus de Villanova ardently advocated for the health benefits of wine, highlighting its potential in mood elevation and liver protection [
35]. Meanwhile, Renaissance surgeon Ambroise Paré used wine-infused ointments for wound care, underscoring wine’s multifaceted role in health and healing [
36].
Some authors argue that during the Middle Ages, alcohol, wine, and their derivatives did not hold the same significance as they did in antiquity, especially in medicine [
37], although small doses of medical wine were still prescribed in various areas such as modern day Azerbaidjan [
38]. The influence of Islam on Middle Age medicine in the Christian West could explain the decreased interest in wine and alcohol. This is significant because Islamic diet laws (halal) prohibit the consumption of alcohol, and this could have influenced medical practices and perspectives on alcohol in regions where Islamic thought had a significant impact.
However, history is often cyclical. As the world moved beyond the Middle Ages and into the Renaissance, there was a revitalization of ancient wisdom. Scholars and medical practitioners began to revisit ancient texts [
39], leading to a revival of the therapeutic importance of wine and alcohol. By the 17th to the 19th century, these substances were once again at the forefront, giving rise to numerous medicines and therapeutic practices.
In essence, the medieval era was not only characterized by increased consumption of wine; it represented a pivotal period where foundational measures were established to regulate wine production, sales, and trade, laying the groundwork for the modern wine industry that we recognize today.
5. Modern Regulatory Frameworks
As centuries passed and the medieval world gave way to modern times, the need for structured regulations in the wine industry became even more pronounced. The end of the 19th and beginning of the 20th century marked a significant shift in the wine industry, as countries began to recognize the need for more structured and organized regulations determined by bigger volumes and the change in consumption habits of consumers. Other studies such as [
40] show that during the expansion phases of economic growth, increasing levels of average income lead to a substantial increase in the average consumption of gross alcohol, wine, and beer, while during recessions, their consumption, mostly persists at the pre-recession phase’s levels, which correlates with a rapid growing population and explains the constant increase in alcoholic beverages production. As such, introducing new regulations became a necessity, not just an administrative procedure. It was also a response to the global need for quality assurance and the protection of local wine identities. When a product, such as wine, displayed a geographical indication, it was a mark of assurance. As fine wine became not only a beverage to be enjoyed but a status symbol and imported fine wines signaled belonging to the elite [
41], it became more and more important for consumers to trust that they were purchasing a product that genuinely originated from the specified region and was not a mere imitation or falsely labeled.
Among the most influential of these regulatory frameworks was France’s Appellation d’Origine Contrôlée (AOC), Italy’s Denominazione di Origine Controllata (DOC), and Denominazione di Origine Controllata e Garantita (DOCG).
The AOC system, established in France, was a pioneering move in wine regulation. It sets forth stringent criteria that wines must meet to be associated with a particular region or ‘appellation’. These criteria included everything from the type of grape used, the method of cultivation, the area of production, to the specific winemaking techniques used. The primary objective was to ensure that each wine reflected the unique characteristics of its region, thus preserving the rich French wine culture. In doing so, the AOC not only guaranteed quality for consumers but also bolstered the reputation of French wines on the global stage [
42].
Similarly, Italy, with its vast and diverse wine heritage, introduced the DOC and DOCG systems. The DOC, like France’s AOC, sets out specific standards that wines must meet to be associated with a particular region. On the other hand, the DOCG represented an even higher level of quality assurance. Wines bearing the DOCG label underwent rigorous testing and tasting evaluations, ensuring that they represented the pinnacle of Italian winemaking. These regulatory frameworks played a crucial role in reinforcing the authenticity and quality of Italian wines, making them highly sought after throughout the world [
43,
44].
Other countries, inspired by the success of the AOC, DOC, and DOCG, introduced similar systems, recognizing the value of protecting regional wine identities. These frameworks not only ensured consistent quality for consumers, but also protected the heritage and traditions of winemaking regions. They prevented the dilution of regional wine identities in an increasingly globalized market.
After World War II, there was a big push to create standards in many industries. This led to the start of the International Standards Organization (ISO) in 1947 [
45]. Around this time, there were many scientific and technical changes. These changes helped create a structured way to study how humans perceive the taste and smell of foods and drinks [
19]. In the 1970s, the first standardized terms for sensory analysis of food were made, thanks to ISO 3972-1979 and ISO 5492-1977 [
20]. This helped everyone agree on the terminology, and there was a shift toward focusing more on what consumers wanted. There were fewer products that people found unacceptable during this time.
One big step forward was creating standardized tools, such as the wine tasting glass based on ISO 3591:1977 [
21]. This made it easier for wine sensory evaluation to be the same everywhere. Having common tools and agreed upon terms made it easier to assess wine quality in different places and markets [
46].
While European nations were pioneering their regulatory systems, newer wine producing regions, inspired by these traditions, began crafting their own guidelines tailored to their unique contexts. Newer wine producing countries, such as the United States and Australia, drew inspiration from the traditions of older wine regions. They designed their own guidelines, considering aspects such as land utilization and wine labeling. For instance, the U.S. introduced the American Viticultural Area (AVA) system, reminiscent of France’s AOC, to pinpoint and safeguard wine-producing territories.
The AVA system was established in the US to consistently identify wine-producing areas based on their geographical attributes. Unlike France’s AOC system, which seamlessly blends age-old winemaking customs with stringent quality checks, the AVA focuses on geographical demarcation. To initiate an AVA, it is imperative to prove that the viticultural area’s name is either locally or nationally acknowledged as representing the specified region [
22].
However, the AVA system faces its own set of hurdles. Some brand names, including those that have been historically recognized, occasionally use AVA names, which can mislead consumers. This stands in stark contrast to the AOC’s emphasis on heritage and excellence, which often overshadows branding considerations.
California, known for its prolific wine-producing zones, has led regulatory dialogues in the US wine sector. Recognizing the role of geographical indications in the wine business, California has initiated measures to ensure that wine labels accurately depict the product’s origin and caliber. The TTB (Alcohol and Tobacco Tax and Trade Bureau) requires that a minimum of 85% of the wine originate from the designated viticultural area. Therefore, a wine labeled “Napa Valley” could comprise up to 14.9% grapes from alternative regions.
6. The Legal Blueprint of Romania’s Wine Industry
Romania has established a comprehensive legal framework to support the quality and authenticity of its wines. The law refers to the production, certification of origin, marketing, and control of wine and vine products, referring to the Annex of the Regulation (EU) of the European Parliament and the Council (The Law of Vine and Wine, 2015). Central to this legislation is the establishment of a robust legal structure for the wine and vine sector. It covers the production processes, origin attestation, marketing avenues, and control mechanisms for wine and vine products. The primary objective of the law is to improve the competitiveness of Romanian wine producers. This enhancement is envisaged through the promotion of wine and vine products, protection of DOC and IG, balance of supply and demand, and support of professional associations.
Romania’s designated grape-production area is aligned with the wine and vine zones of the European Union. ‘The National Office’ oversees the territorial boundaries for DOC and IG wines. The law provides insight into the establishment and maintenance of vineyards, the selection of planting material, and the specifics of grape production for different types of wine. These wines can be traditional names, varietal wines, or wines with specific characteristics. The right to market wines using DOC and IG labels depends on annual certificates.
The Methodological Norms (Methodological Norms for the Implementation of the Law of Vine and Wine, 2016) pertain to the application of the Law of Vine and Wine in the common organization system of the vitivinicultural market. Their aim is to ensure that the production, processing, bottling, labeling, and sale of wine-related products comply with both national and European rules. The norms begin by defining several key terms. For example, when they talk about “vitivinicultural products”, they refer to products derived from grapes, such as wine. Similarly, terms like “wine regions” point to specific areas recognized for grape cultivation, while “bottler” and “wine producer” refer to those involved in the packaging and making of wine, respectively. Other terms, such as “labeling”, “presentation”, “importer”, and “trader”, help clarify the various stages and roles in the wine production and distribution process.
However, the landscape of grape cultivation is not static. The National Office of Vine and Vitivinicultural Products is responsible for any changes in the boundaries of these areas. Their decisions are based on a variety of factors, from the climate and topography of the region to the technologies used in the cultivation and the quality of the products derived from the grapes.
In grape production, detailed recordkeeping is emphasized, documenting both the quantity and value of the grapes produced. Wine is defined legislatively as a product derived solely from the fermentation of fresh grapes or grape must, highlighting its natural origins. The range of wine products includes grape must, grape juice, and wines derived from fresh grapes, among others. Wines are classified according to their sugar content, influencing their taste and character. The classifications include dry wines, with a sugar content of up to 4.0 g/L; non-dry wines, of up to 12.0 g/L; semisweet wines, between 12.01 and 45.0 g/L; and sweet wines, with a sugar content greater than 45 g/L. Specific sugar levels are maintained to ensure the desired taste and classification of the wine. Beyond sweetness, the origin of a wine plays a crucial role in its flavor profile and authenticity.
Wines with a controlled designation of origin (Denumirea de origine controlată—DOC) is a category that is reserved for wines that not only originate from specific regions, but also meet rigorous quality standards. The DOC label certifies the authenticity and superior quality of the wine. It is similar to Italy’s DOC, but smaller in number compared to Italy, given the relative size and history of wine of the two countries. This category includes still wines, quality sparkling wines, wines derived from raisin grapes and those from overripe grapes.
Wines with Geographic Indication (IG) are wines that, while also rooted in specific regions, might have a broader geographical origin than DOC wines. The IG category includes still wines, sparkling wines, and perlant wines, each with its unique characteristics and flavor profiles.
Varietal wines without DOC and IG are wines are labeled using the grape variety name, offering consumers insight into the primary flavor and aroma profiles of the wine.
Wines without DOC, IG, and variety name is a category that encompasses wines that do not fall into the aforementioned classifications but still adhere to the overarching quality standards set by the legislation.
Special wines, as the name suggests, occupy a unique space in the wine production landscape. These include sparkling wines, petiant and perlant wines, liqueur wines, wines from raisin grapes, and those from overripe grapes.
The legislation goes into detail on the sugar content in these wines, which plays a crucial role in their taste and classification. Brut Natur wines are crisp with up to 3 g/L sugar and no post-fermentation additions, while the sweetness gradually increases through Extrabrut to Sweet wines, with the latter having a sugar content exceeding 50 g/L.
In the vitivinicultural sector, the importance of accurate labeling and presentation cannot be overstated, serving as the main interface between the product and the consumer and ensuring compliance with regulations. Labeling includes various elements displayed on packaging and documents, in order to identify the product, convey its quality, characteristics, and origin. Commercial names must avoid misleading elements and labels should not mimic established wine descriptions, particularly those protected by the EU. Regulations emphasize the importance of Designations of Controlled Origin (DOC) and Geographical Indications (IG), and wines imported must display clear information ensuring traceability and authenticity. All mandatory label information must be in one or more official EU languages, with Romanian as a prerequisite, to ensure accessibility. Presentation, referring to packaging, influences consumer perception and purchasing decisions, reflecting the product’s quality and price point.
7. The Modern Challenges of Eco-Friendly Viticulture
While understanding the historical and regulatory aspects of wine production is crucial, it is equally important to recognize the contemporary challenges the industry faces, especially in the realm of sustainability. Grapevines are a significant global crop, yet they are highly sensitive to climate. Factors such as temperature, sunlight, and precipitation crucially impact both the production of the plants and the quality of the resulting wine [
16].
In some countries like Czechia there is a growing preference for white wines, but climate changes favor red wine production [
17]. Adaptation strategies, such as introducing new grape varieties and relocating vineyards, are essential but pose challenges due to geographical constraints and the need for long-term planning. There is a need to balance economic performance with environmental considerations, addressing variations in grape harvests, and promoting sustainable agriculture to ensure the wine industry’s long-term viability in the face of climatic shifts.
One of the top challenges is the pursuit of sustainable viticulture. As the global community becomes increasingly aware of environmental issues, the wine industry is under pressure to demonstrate its commitment to eco-friendly practices. It is no longer just about producing the finest wines; it is about doing so responsibly. This means embracing farming techniques that prioritize the health of the soil and the surrounding ecosystem.
Water, the lifeblood of any agricultural endeavor, has become a focal point of these sustainability efforts. Many of the world’s leading wine-producing regions are confronting the realities of water scarcity. The challenge lies in optimizing irrigation to ensure that grapevines receive the nourishment they need, without depleting or degrading local water resources. The balance is delicate, with both the quality of the wine and the health of the environment hanging in the balance. For example, a study indicated that 85% of South Australian grape growers in the Murray–Darling Basin (MDB) felt water secure, with alternative growers, practicing organic and biodynamic methods, feeling less at risk [
18]. While conventional growers leaned on external solutions, often backed by government investments in irrigation infrastructure, alternative growers championed natural, holistic practices, and agroecological strategies, suggesting a more comprehensive governmental approach might be beneficial.
In the Western Cape area of South Africa, known for its wine-making prowess, farmers have expressed serious reservations about water management strategies. This comes in the backdrop of the country witnessing subdued growth and development in the past decade [
47]. In a study conducted among farmers in the western Cape of South Africa, there was a pronounced concern regarding governmental policies, particularly the perceived lack of support in areas of water management during drought years [
48]. Farmers expressed dissatisfaction with the government’s approach, highlighting issues like potential water rights reallocation and restrictions on building dams. These governmental constraints, combined with the inherent water stress of the region, have posed significant challenges to farmers’ adaptive capacities in the face of climate change.
In Crete, Greece, the focus shifted to the environmental impact of viticulture, with a study that evaluated energy consumption and greenhouse gas emissions in vineyards. The primary culprits were identified as fossil fuels used in machinery and synthetic fertilizers. To address these challenges and promote sustainable practices, the “ECO2VINE” decision support tool was developed, offering a way to calculate the energy use and greenhouse gas emissions of a vineyard, further emphasizing the global push toward sustainable viticulture [
49].
Parallel to these concerns is the ever-present threat of pests. Although pests have been a perennial challenge, the modern twist lies in their growing resistance to conventional pesticides. A study looked at how winegrowers in five European areas decide on using pesticides and managing their vineyards [
50]. These regions were Palatinate in Germany, Leithaberg in Austria, Tarnave in Romania, Bordeaux in France, and Montilla-Moriles in Spain. Tarnave is in the middle of Romania and has a mix of weather due to nearby mountains. This area is known for its white wines. Since Romania joined the EU in 2007, many old vineyards have been updated with government support. The area has two large wine producers and many smaller ones, covering about 5000 hectares with 20 wineries. When it comes to growing practices, winegrowers in Tarnave have different views. Some feel they do not have the right tools or knowledge to do better. Many small winegrowers sell their grapes to groups, so they do not spend much on advertising. They also have less experience in growing grapes than the others in the study. Also, there are not many programs in Romania that encourage the use of fewer pesticides or having more green cover. Currently, there is a mix in how pesticides are used. Some use weed killers between rows, but not all. There is a link between those who do not use weed killers and having more greenery between rows. Bug sprays are used a lot, and while some use scent dispensers to keep bugs away, the number used varies a lot.
Alternative practices in viticulture have demonstrated the efficacy of plastic coverings, which have been shown to significantly curtail the utilization of chemical pesticides. A comparative analysis of agricultural practices during the 2020/2021 cultivation period in Brazil [
51] found that grape production systems using plastic covering have a significantly higher Net Present Value (NPV), indicating better economic viability and greater returns compared to traditional systems, with both systems showing a positive investment outlook. The study was focused on the specific climate of southern Brazil, notably in Sarandi, Rio Grande do Sul. This region experiences a humid subtropical climate with annual average temperatures around 19.1 °C, fluctuating between 38 °C to 0 °C. The soil there is a dystrophic red latosol, which is characterized by its clay content, depth, and good drainage. Plastic coverings acted as a barrier against precipitation, thereby reducing plant surface moisture and diminishing the prevalence of diseases. Furthermore, these coverings give vines protection from extreme climatological events, such as hail and excessive rainfall. This contributes to the sustainability of grape production by reducing reliance on chemical pesticides, thereby mitigating environmental risks.
In the context of viticulture, the decisions of winegrowers are shaped by a confluence of factors including historical precedents, regulatory landscapes, and personal convictions, alongside the tangible constraints of climate and resource availability. These factors collectively guide their responses to the contemporary challenges of sustainable wine production, balancing economic, and environmental imperatives.
8. Wine Production in Europe
In the current study, we have curated a dataset encompassing 22 European wine-producing countries. This sample constitutes a substantive representation of the viticultural landscape within the continent, capturing over half of the nations engaged in this industry. Moreover, our sample includes the pre-eminent wine-producing countries which are globally recognized as the main contributors to European viticulture in both volume and economic impact.
The diversity of wine production profiles, an essential consideration in the adequacy of the sample, is well represented in our dataset. The selected countries exhibit a comprehensive range of grape varieties, climates, viticultural techniques, and regulatory environments (including Protected Designation of Origin, or PDO). This diversity ensures that our findings are reflective of the broader trends and not merely localized phenomena.
The statistical methodologies employed—k-means clustering and Principal Component Analysis (PCA)—are robust to variations in sample size, provided the data are well distributed. Our sample size is consistent with the requirements for such methods, ensuring the validity of the patterns and structures identified through our analysis.
The purpose of our study is to discern overarching trends and provide a macro-level understanding of the European wine industry. We consider the chosen sample size as adequate for such an exploratory investigation, which seeks to identify significant, rather than subtle, patterns within the data.
It is also important to note that our sample size is partly determined by the availability and accessibility of high-quality, comprehensive data across the European continent. In cases where data availability is a constraining factor, it is paramount to select a sample that maximizes data integrity and representativeness.
In
Table A1 and
Figure 2, the 2020 production data, their value, and the ratio between them are presented for various wine varieties. These values have been extracted from official statistics last updated on 18 March 2022 [
25]. These statistics containing data on production for the 2017–2020 period were downloaded in CSV format and then merged using Python data frames. Countries without production were filtered out. Subsequently, the value per production unit was calculated.
The European Union’s PDO system was established to standardize quality across member states, providing a framework that national systems like Italy and Romania’s DOC and France’s AOC could fit into. It ensures consumers know where their food comes from and that it meets certain standards of production. The Protected Geographical Indication (PGI), on the other hand, provides a more general indication of origin without the stringent requirements of the PDO, covering food, agricultural products, and wines. These designations have a direct impact on the production values and practices in member states, as seen in the analyzed data.
With a production volume of 60.1 million units, Romania’s wine without a Protected Designation of Origin stands out. This category, which might be seen as more generic, is significant in volume but has a lower added value, selling at an average of 1.18 euros per liter. This suggests that Romania has a robust domestic market and possibly exports these wines as affordable options for everyday consumption.
A much higher average value is recorded for sparkling wine (5.3 euros/L), with Romania surpassing Italy and Spain in this ratio, although the volumes are still lower compared to other varieties. In addition, a high average value is found for wines having more than 15% alcohol (3.95 euros/L), surpassing Spain and Portugal, although the volume is very low, only 69,000 L, hinting at a niche but a premium segment. As expected, among European countries, France has the best value/production ratio for Champagne and sparkling wine (16.34 euros/L).
Compared to its neighbors, Romania’s wine industry exhibits a unique mixture of volume and value. While its most significant production is in the non-PDO category, like Hungary, Romania’s sparkling wine category and wines with higher alcohol content command a premium, indicating a focus on quality and niche segments. Bulgaria, with its vast production of wines with more than 15% alcohol content, appears to be targeting a different market segment compared to Romania’s premium positioning. Serbia, on the other hand, has a more balanced approach but does not achieve the high value per liter that Romania does for its premium categories.
The data are enriched with the following information, as shown in
Table A2:
The water stress index represents a quantitative measure capturing the competition among water users in each region. Essentially, it gauges the intensity of demand for water in relation to its availability. A higher value of this index signifies increased water stress, implying that the region might be facing challenges related to water scarcity, which could affect various sectors. We used the agricultural sectoral score [
26].
The number of registered wine PDOs is a metric that showcases the diversity and uniqueness of wine production within a country. A Protected Designation of Origin (PDO) for wine ensures that particular wine’s characteristics are deeply rooted in its geographical origin, encompassing factors such as the soil, climate, and traditional production methods of its place of origin. A higher number of registered wine PDOs in a country denotes a rich diversity of unique wines, each representing the distinct character of its region [
27].
Vines in production—wine grapes—total (in hectares) quantifies the overall scale of vineyards dedicated to wine grape production in a country. This measure provides an insight into the magnitude of wine production activities, which can be indicative of the economic and cultural importance of winemaking in that region [
28].
Clustering is a type of unsupervised machine learning technique that is used to group similar data points together based on certain features. One of the most popular and straightforward clustering methods is the k-means algorithm with its different variants such as a k-means++ [
52,
53]. In our study, the primary objective was to identify patterns in wine production and value metrics across different countries. We commenced the data preparation phase by structuring the data in a format amenable to clustering, representing each nation by its wine production and value metrics across various wine types. When applying clustering in the context of countries’ wine production profiles, there are key features that provide valuable insights.
Firstly, the magnitude of production or value serves as a foundational metric. Analyzing this aspect offers a perspective on the relative size and economic significance of the wine industry in each nation. Secondly, to appreciate the spectrum of wine offerings from each country, it is essential to focus on the variety of wine types produced. This assists in discerning the diversity and specialization within the wine production landscape of each country.
In alignment with these considerations the features from
Table A1 and
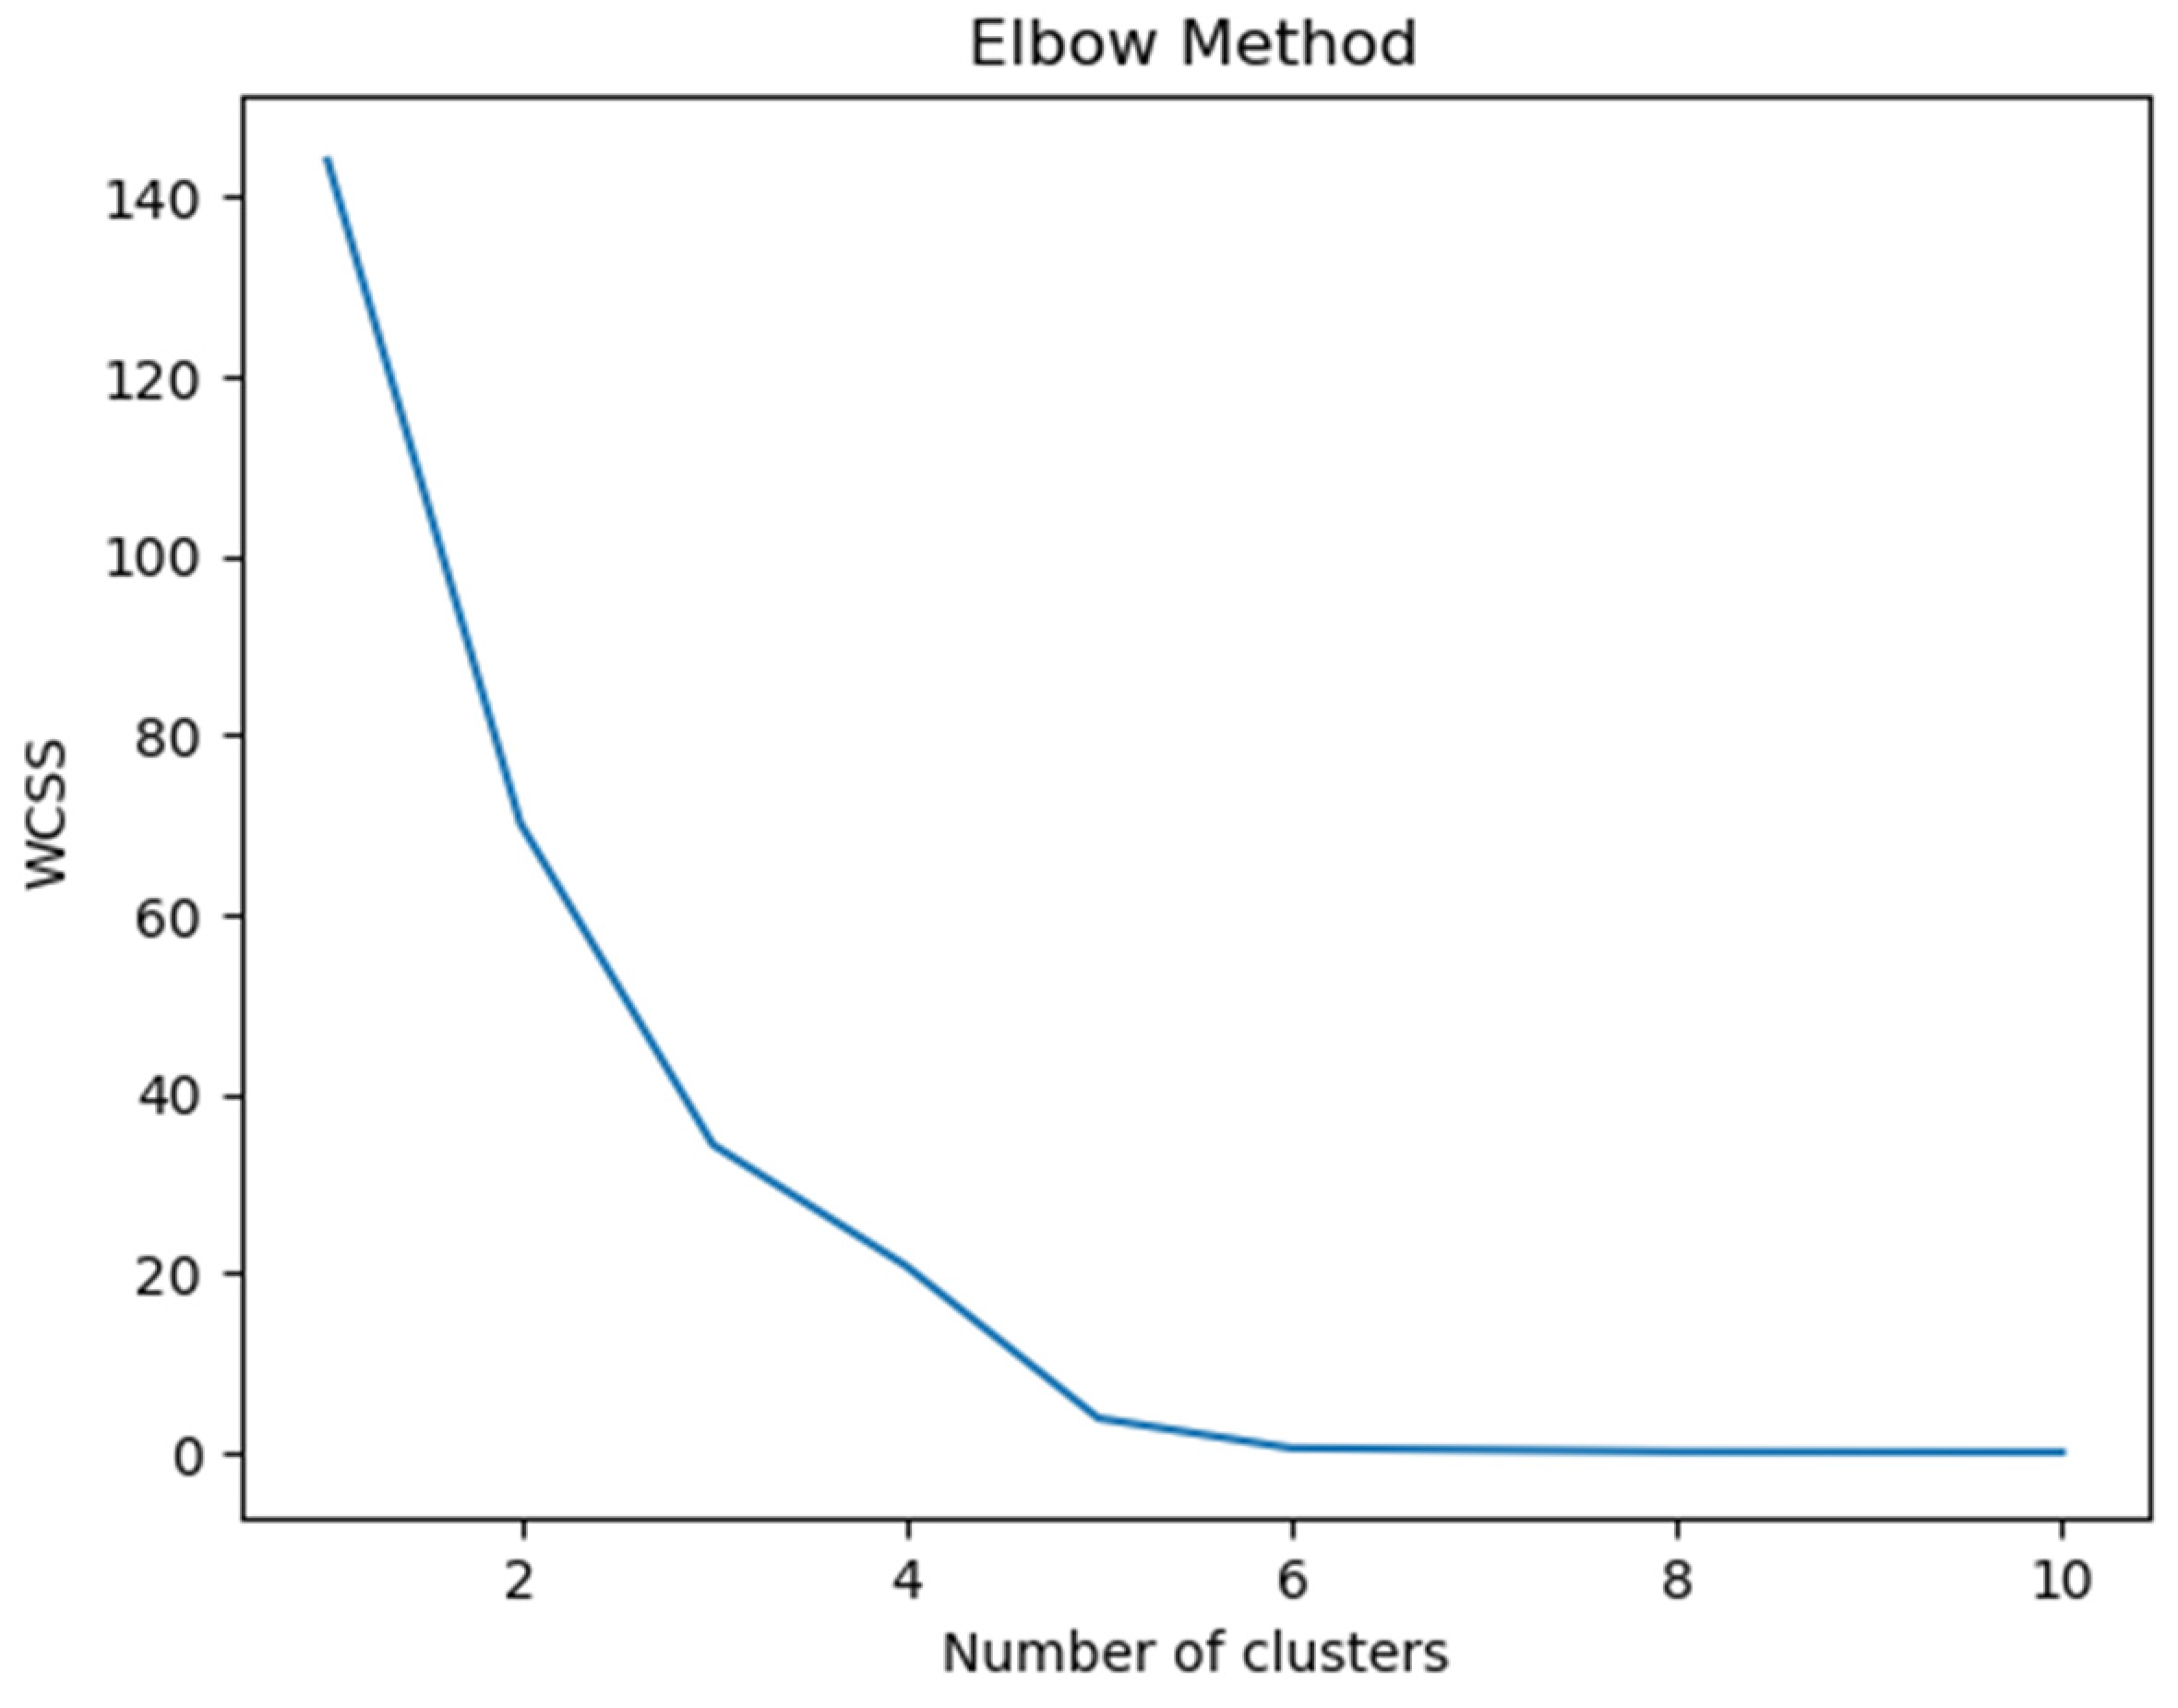
Table A2 were considered for the clustering analysis. Given the sensitivity of clustering algorithms like k-means to the scale of data, it was necessary to standardize our features. This ensured that each feature contributed uniformly to the distance computation. With the data appropriately scaled, our next challenge was to determine the optimal number of clusters. We employed the Elbow method (
Figure 3) which pointed us towards an optimal cluster count of three for our dataset.
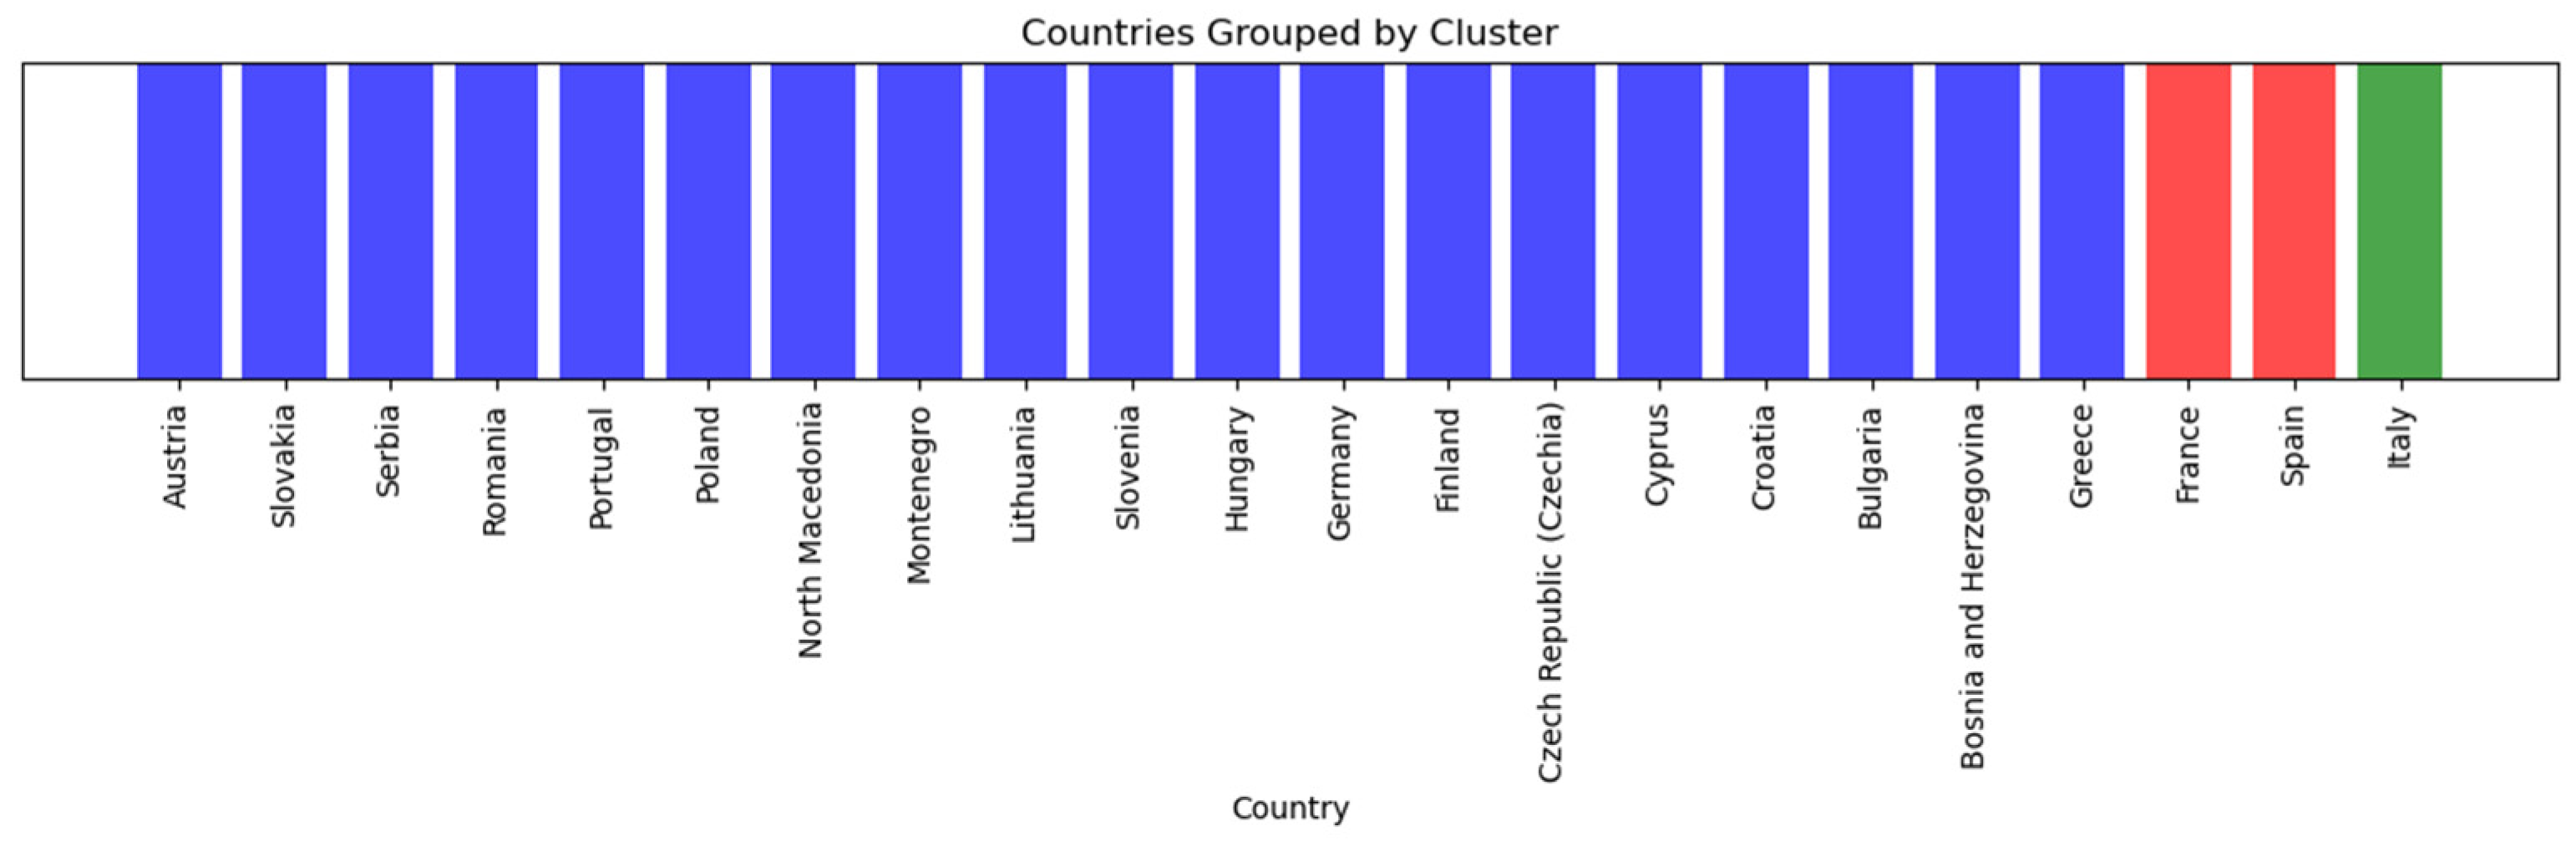
Utilizing Python’s scikit [
54], we applied the k-means clustering algorithm to the data from
Table 1, specifying three as the number of clusters. The resulting clusters unveiled patterns about the relationship between different countries based on their wine data, as visualized in
Figure 4, where each bar represents a country, and its color corresponds to the cluster it belongs to.
Cluster 0, termed as ‘Moderate Producers’, is characterized by a relatively low water-stress index. This cluster has a limited number of wines with a Protected Designation of Origin (PDO) registration. The production of wine grapes in these countries is moderate, and they exhibit lower economic values for champagne, sparkling wine, and other wine types. The quantities produced for various wine types in these countries are also moderate.
Cluster 1, which encompasses the prominent wine producers, France and Spain, as ‘High Producers’, experiences a higher water-stress index. These countries have a notably elevated number of registered PDOs. The vine production for wine grapes in this cluster is extremely high, reflecting their dominant position in the wine industry. The economic values for champagne, sparkling wine, and other wine types are substantially higher in this cluster. Furthermore, the quantities of various wine types produced are significantly higher, underscoring their major role in global wine production.
Cluster 2, represented exclusively by Italy and dubbed as “Specialized Producer”, exhibits a high water-stress index. Italy stands out with the highest number of registered PDOs among the countries analyzed, pointing to its rich wine diversity. The country boasts very high vine production for wine grapes. Particularly notable is the high economic value associated with wines that have added CO2, excluding white and sparkling wines. Italy also produces large quantities of various wine types, with a special emphasis on quality wines with PDOs and those having a volume less than 15%, excluding white and sparkling wines. An interesting observation is Italy’s absence in the production of wines like Port Wine, Madeira, Sherry, and other wines with a volume exceeding 15%.
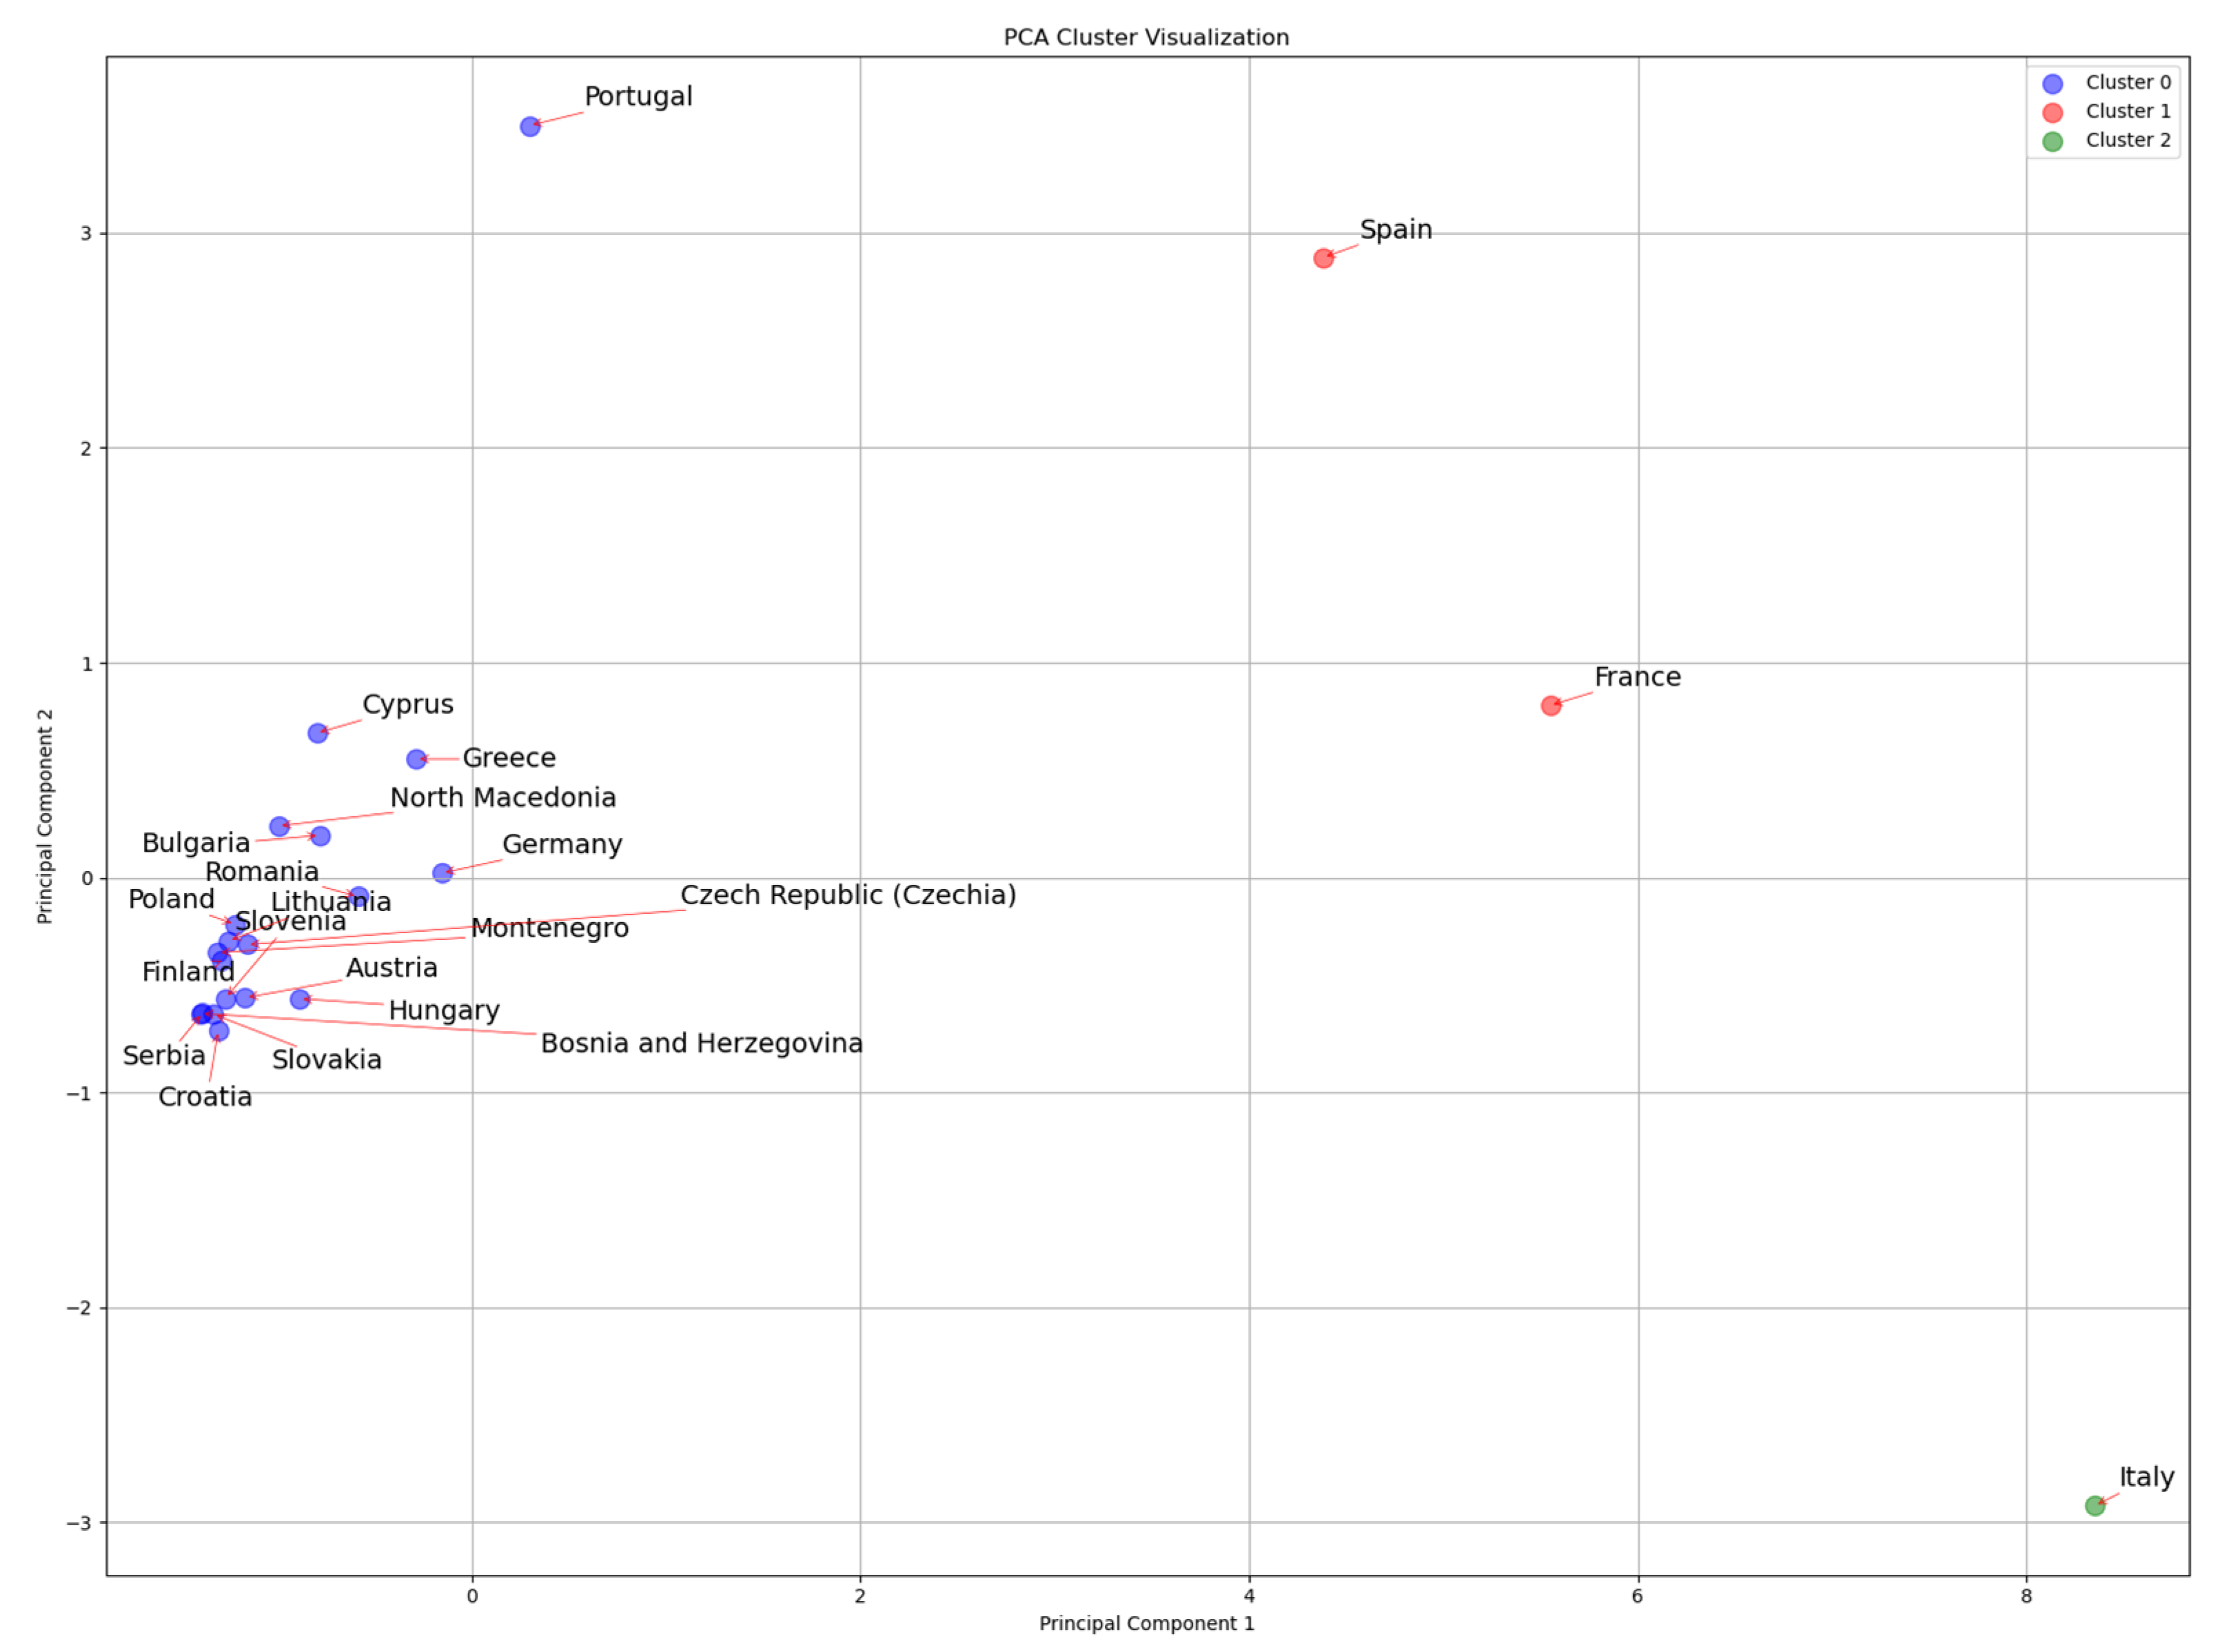
To visualize clusters in lower-dimensional space, Principal Component Analysis (PCA) is employed. By reducing the data to its two principal components, we can plot them and color-code based on cluster assignments. PCA produces a new set of orthogonal features, known as principal components, which capture the data’s variance in descending order. The first two components, PC1 and PC2, are linear combinations of the original features. Their coefficients signify the relevance of each original feature to the principal component.
The Kaiser–Meyer–Olkin (KMO) measure, calculated at 0.5465, signaled a moderate level of sampling adequacy. Although this value does not reach high levels, it surpasses the minimum threshold of 0.5, implying a satisfactory degree of common variance present in the dataset, which is favorable for the application of PCA. Concurrently, the Bartlett’s Test of Sphericity yielded a chi-square value of 504.162 and a p-value of 6.56 × 10−79, indicating that the correlation matrix of the variables substantially deviates from an identity matrix. This significant deviation is indicative of the existence of interrelated variables, thereby reinforcing the applicability of PCA in this context.
The KMO measure, despite its modesty, does not undermine the efficacy of PCA in this study. This is particularly relevant considering that PCA, unlike factor analysis, does not rely as heavily on high correlations between variables. The significant results of Bartlett’s test accentuate the presence of relationships among the variables, lending support to the dimensionality reduction achieved through PCA.
The PCA plot from
Figure 5 visualizes the multidimensional dataset in a reduced two-dimensional space, where each point represents a country. The plot delineates the clustering of countries based on their principal component scores. The proximity of countries within clusters suggests similarities in their underlying data patterns as captured by the PCA. In contrast, the distance between clusters implies dissimilarity. For instance, countries within Cluster 0 exhibit close grouping, indicating homogeneity with respect to the principal components analyzed. Portugal, while aligning with other Cluster 0 countries along the first principal component (PC1), exhibits a distinct position along the second principal component (PC2), suggesting divergence in the variables that PC2 represents.
The PC1 and PC2 values in
Table 2 are the loadings of each variable on the first two principal components in a Principal Component Analysis (PCA). In PCA, the loadings for each principal component (PC) do not necessarily sum up to a specific value. Instead, these loadings, which are the coefficients of the linear combination of the original variables that form the principal component, represent how much each original variable contributes to that component.
Principal Component 1 (PC1):
The loadings on PC1 represent how much each variable contributes to this component. A high positive or negative value indicates a strong contribution.
For example, ‘Quality Wine with Protected Designation of Origin (PDO) with volume < 15%, excluding white and sparkling wine’ has a high loading (0.39) on PC1, which means this variable strongly influences the variation captured by PC1.
Variables like ‘Number of registered PDOs (wine)’, ‘Vines in production—wine grapes—total’, and ‘White Wine with Protected Designation of Origin (PDO)’ also have significant positive loadings, suggesting they are important factors in the variation PC1 represents.
Principal Component 2 (PC2):
The loadings on PC2 indicate the impact of each variable on the second principal component.
‘Port Wine, Madeira, Sherry, and others > 15% volume’ has the highest loading (0.62) on PC2, implying it greatly influences the variation in this component.
The ‘Water-stress index Agricultural’ also has a significant positive loading (0.45), indicating its importance in PC2.
In contrast, variables like ‘Wine with added CO2, excluding white and sparkling wine’ and ‘Grape Must—quantity’ have negative loadings, indicating an inverse relationship with this component.
Furthermore,
Table 2 contains the total variance explained by all the principal components up to a certain number. PC1 explains 64% of the variance, and PC2 explains an additional 15%, so the cumulative variance explained by the first two components is 64.23% + 15.35% = 79.58%. Therefore, these two components together account for almost 80% of the dataset’s total variance, providing a substantial understanding of its underlying structure while reducing dimensionality.
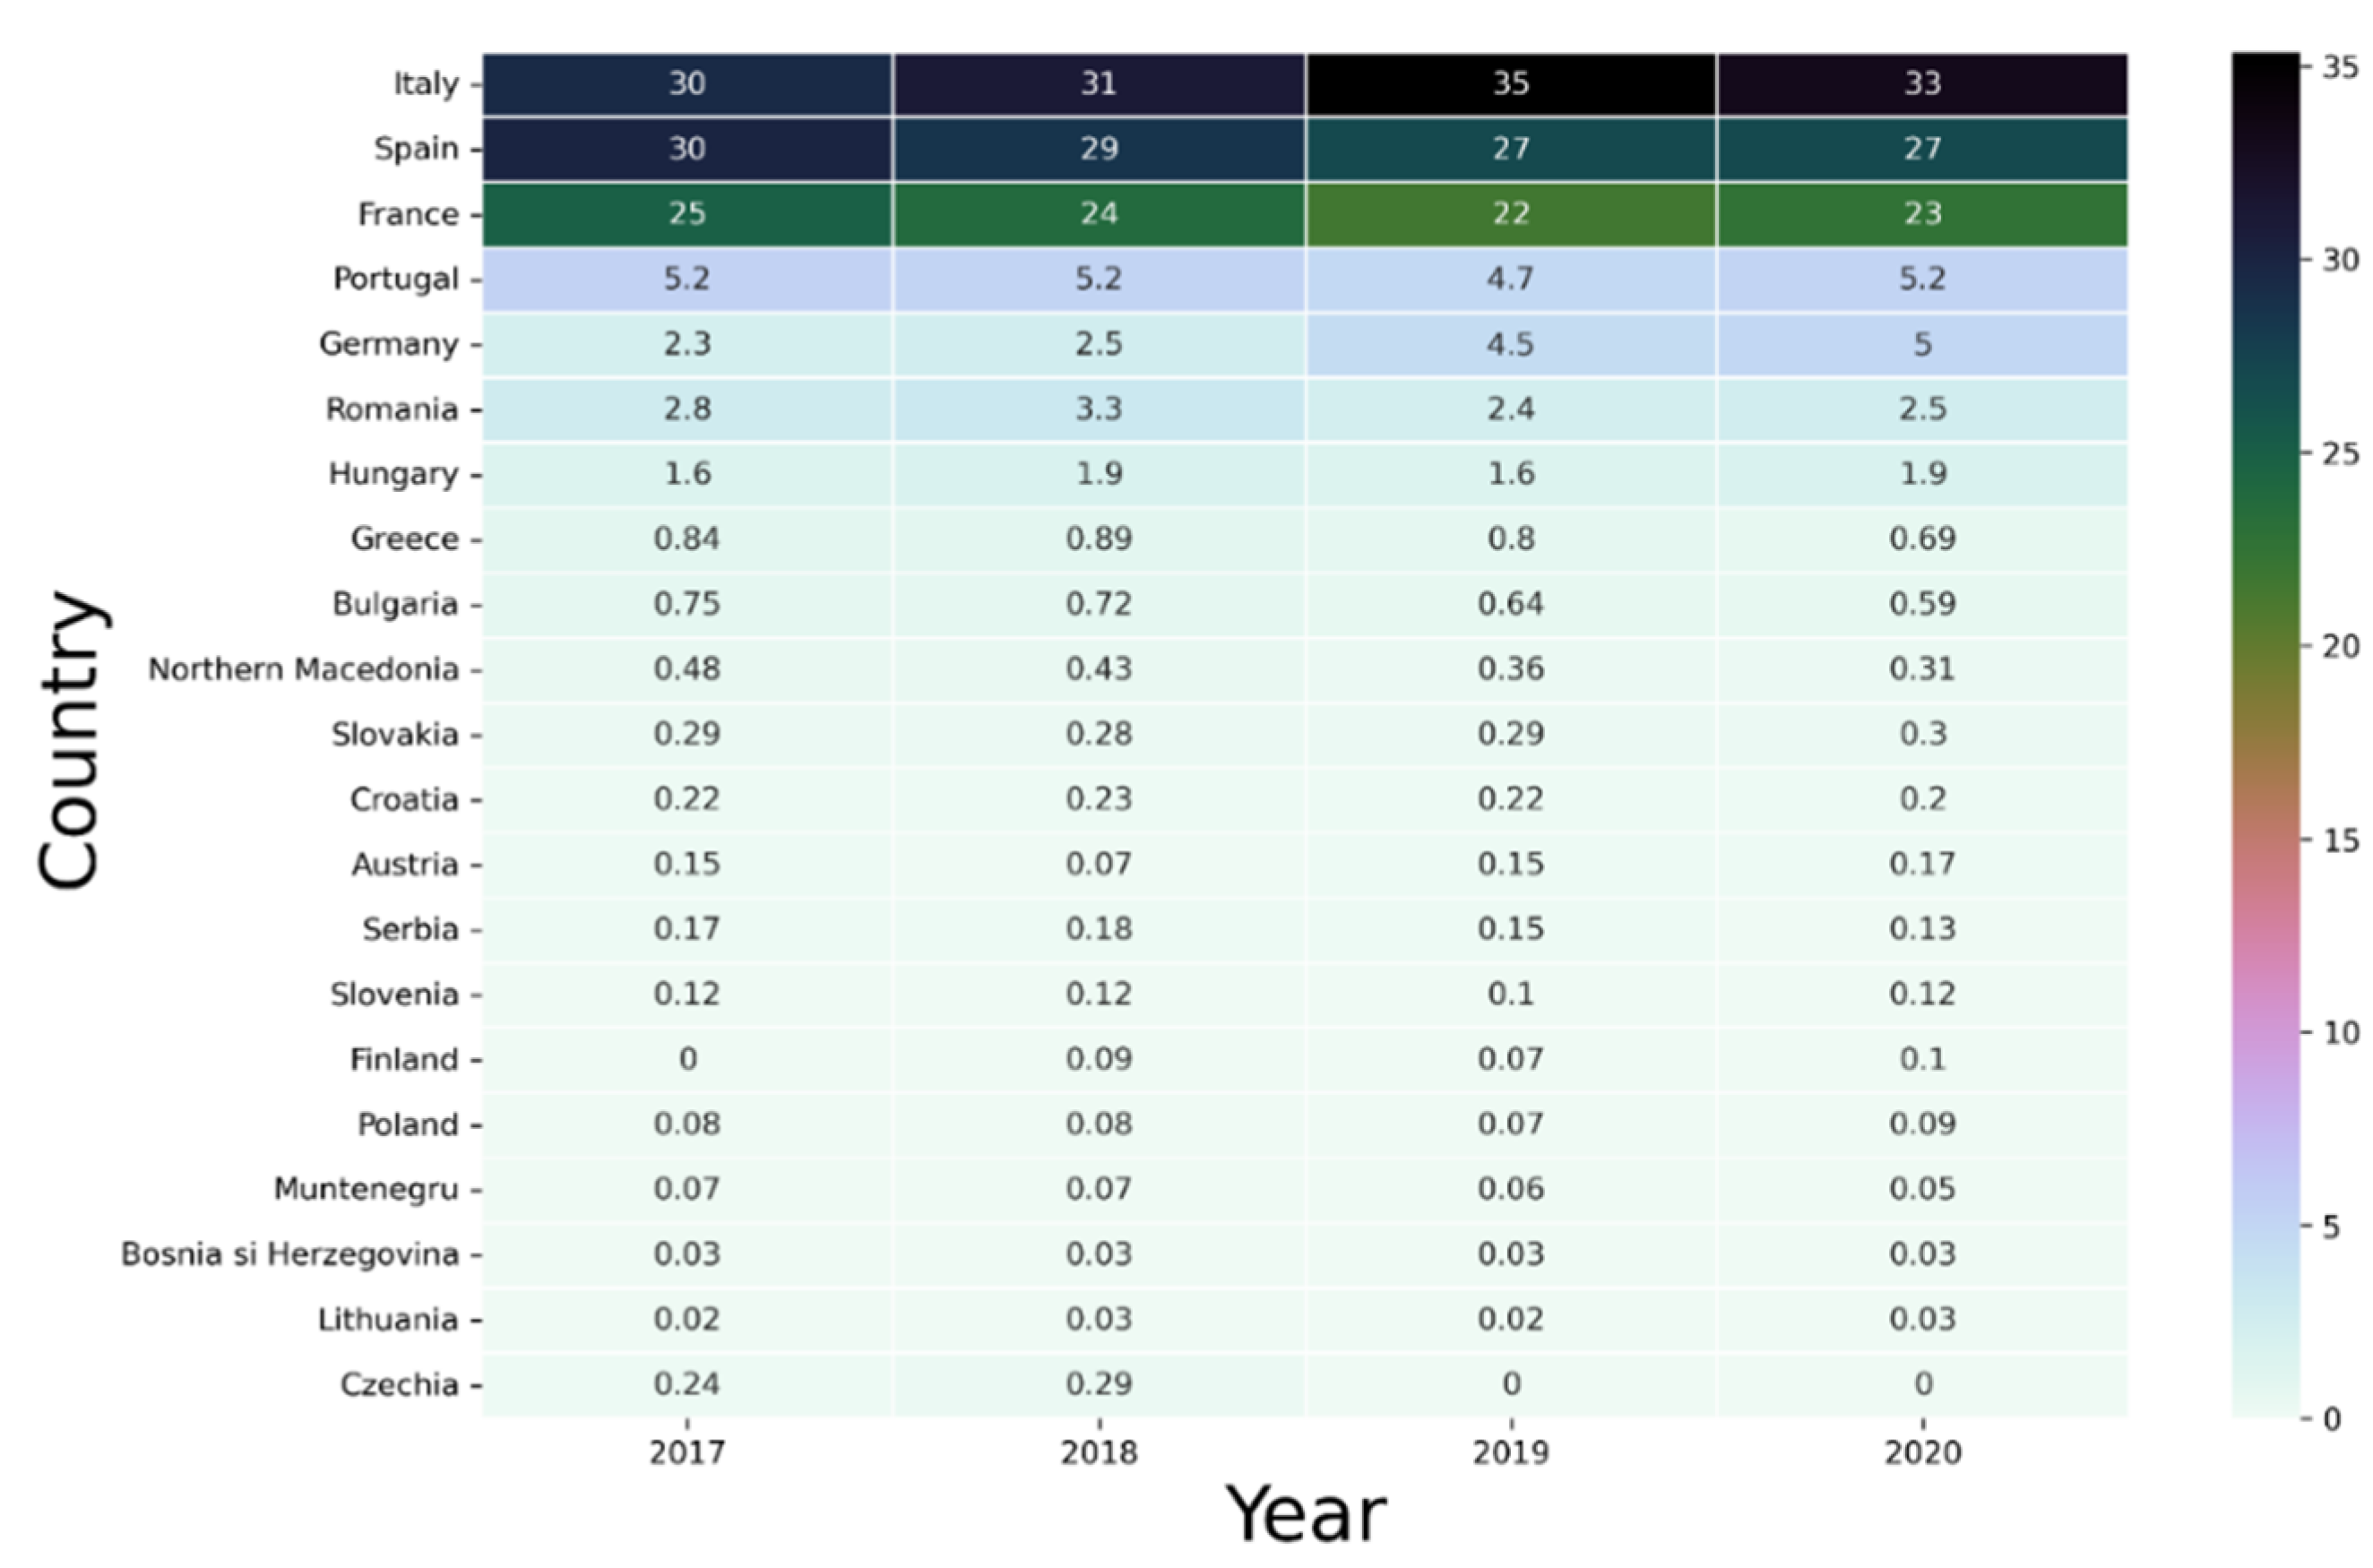
Figure 6 illustrates the trends from 2017 to 2020 in wine production across different varieties. During this period, Italy, Spain, and France consistently ranked as the top three producers. Romania was in sixth place, but its production volume was significantly lower than the top three countries. The rankings were stable throughout these four years.
To conclude, the detailed analysis and application of the clustering of k-means on European wine production data have revealed distinct patterns between countries, highlighting the unique profiles of Italy, the commonalities between France and Spain, and the diverse characteristics of Romania and other nations. Romania’s prominence in the non-PDO category and its premium positioning in specific segments were notable. The consistent leadership of Italy, Spain, and France in the value of wine production emphasizes their enduring influence in the industry.
9. Conclusions
In addressing the research questions presented at the outset, our study looked into the intricate ties between the wine industry’s historical significance, regulatory trajectories, and its adaptation to contemporary challenges.
RQ1 (Evolution of Wine Regulations and Impact on Trade and Production): Wine regulations have transformed considerably over time, with each era reflecting the socio-economic imperatives and government’s role in ensuring quality and trust. From the nascent regulatory practices of ancient civilizations to today’s intricate frameworks, governments have been instrumental in shaping these trajectories. Instruments like the AOC in France, and DOC and DOCG in Italy, demonstrate how governmental oversight has been pivotal in preserving regional wine identities and ensuring consumer trust.
RQ2 (Adaptation to Sustainability in the Contemporary Wine Industry): According to our research, government policies and incentives are key to advancing sustainability initiatives within the wine industry. Regions with robust governmental support showcased accelerated adaptation to eco-friendly practices, highlighting the essential role of state-backed solutions in the industry’s transition. Contrarily, areas with less governmental intervention leaned towards traditional strategies, underscoring the challenges and complexities of harmonizing sustainability with age-old practices.
RQ3 (Insights from Production Data and Value Comparisons—A Focus on Romania): Using production data, we investigated Romania’s strategic positioning in the European wine landscape, influenced by market dynamics and government policies. The balance between volume and value in Romania’s wine production, especially in non-PDO segments, reflects its adaptability to global market demands and domestic regulatory landscapes.
RQ4 (Government Oversight and Economic Impacts from Clustering and PCA): The clustering analysis and PCA underscored the varied economic and regulatory imprints of European wine-producing nations. For instance, the distinct production approach of Italy, possibly shaped by its rigorous governmental regulations, demonstrates the tangible economic repercussions of state interventions in the wine trade.
Our research suggests several policy implications for the wine industry, particularly in the context of evolving wine regulations and sustainability challenges. The findings highlight the necessity for governments and regulatory bodies to adapt policies that encourage sustainable viticulture practices, especially in the context of climate change. The success of the European Union’s PDO system and its impact on maintaining standardized quality across member states, as seen in Romania, suggests that similar frameworks could be beneficial in other emerging wine-producing countries.
Furthermore, our study underscores the importance of technological advancements in the industry. Policymakers could foster innovation by supporting research in sustainable farming practices and digital tools for wine production and trade. Incentivizing eco-friendly practices and providing resources for technological adoption could significantly impact the industry’s environmental footprint.
However, our work is not without limitations. The primary limitation lies in the focus on European countries, particularly Romania, which may not fully represent the global wine industry’s dynamics. Additionally, the application of clustering and PCA methodologies, while insightful, may not capture all the distinctions between smaller wine-producing regions.
For future research, we propose expanding the study to include a more diverse range of wine-producing countries, particularly those outside Europe. This would provide a more comprehensive understanding of global wine industry trends. Further research could also explore the micro-level impact of wine regulations and sustainability practices on smaller vineyards and producers. Finally, longitudinal studies could be conducted to assess the long-term effects of changing regulations and sustainability initiatives on the wine industry.
In conclusion, our study contributes to a growing body of research on wine regulations, production, and trade, offering valuable insights for policymakers and industry stakeholders. By acknowledging the limitations and proposing future research directions, we aim to encourage continued exploration of this vital industry.


 ,
, 

