
Phenotypic Diversity and Characterization of the Southern African Bambara Groundnut Germplasm Collection for Grain Yield and Yield Components


Abstract
:1. Introduction
2. Materials and Methods
2.1. Study Materials and Experimental Sites
2.2. Experimental Design, Trial Establishment and Management
2.3. Data Collection
2.4. Data Analysis
3. Results
3.1. Analysis of Variance, Variance Components and Broad-Sense Heritability (H2) for Grain Yield and Yield Components
3.2. Accession Performance for Grain Yield and Yield Components
3.3. Grouping of the Germplasm Entries in the Dendrogram
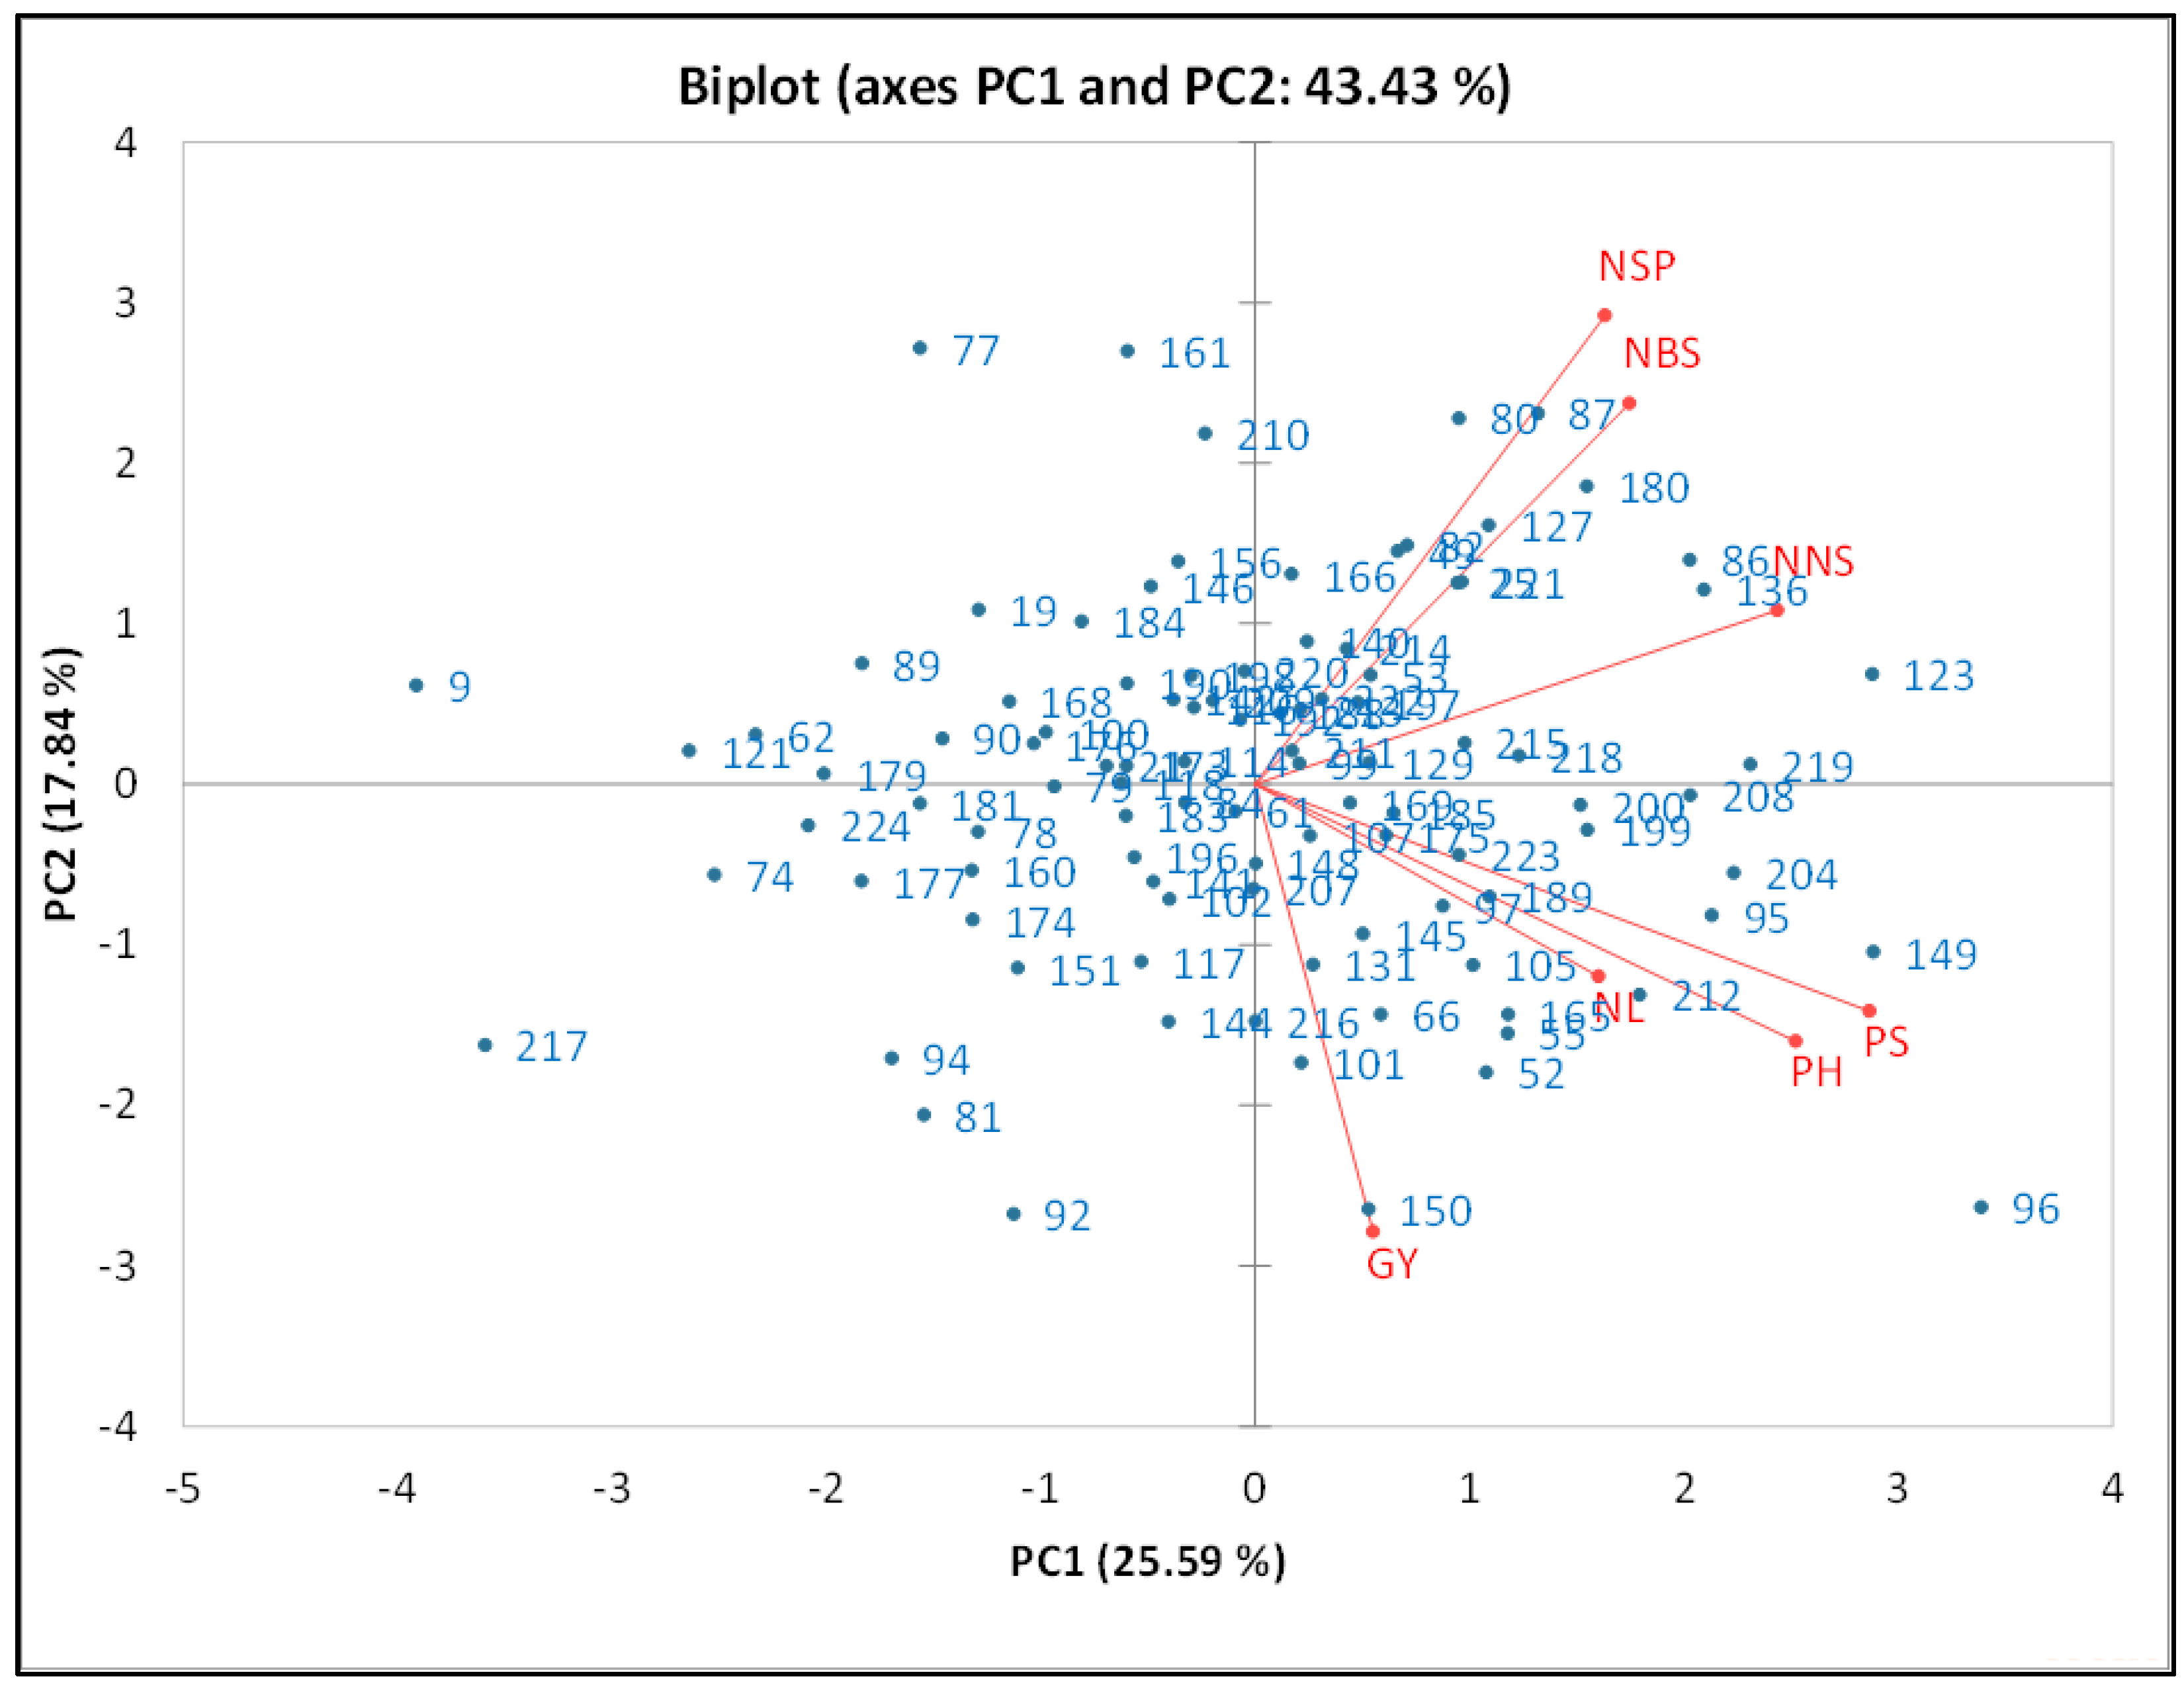
3.4. Principal Component Analysis (PCA)
3.5. Phenotypic Correlations between Grain Yield and Yield Components and Clustered Heat Map
4. Discussion
5. Conclusions
Author Contributions
Funding
Data Availability Statement
Conflicts of Interest
References
- National Research Council. Lost Crops of Africa: Volume II: Vegetables, 1st ed.; The National Academic Press: Washington, DC, USA, 2006; pp. 53–64. [Google Scholar]
- Eltayeb, A.R.S.; Ali, A.O.; Abou-Arab, A.A.; Abu-Salem, F.M. Chemical composition and functional properties of flour and protein isolate extracted from bambara groundnut (Vigna subterranean). Afr. J. Biotechnol. 2011, 5, 82–90. [Google Scholar]
- Emendu, N.B.; Emendu, R.E. Proximate analysis, characterisation and utilization of bambara nut oil (Mmanu—Okpa). Int. J. Sci. Res. 2014, 4, 1–5. [Google Scholar]
- Halimi, R.A.; Barkla, B.J.; Mayes, S.; King, G.J. The potential of the underutilized pulse bambara groundnut (Vigna subterranea (L.) Verdc.) for nutritional food security. J. Food Compos. Anal. 2018, 77, 47–59. [Google Scholar] [CrossRef]
- Majola, N.; Gerrano, A.S.; Shimelis, H. Bambara groundnut (Vigna subterranea [L.] Verdc.) Production, utilisation and genetic improvement in sub-Saharan Africa. Agronomy 2021, 11, 1345. [Google Scholar] [CrossRef]
- Mbuma, N.W.; Labuschagne, M.; Siwale, J.; Hugo, A. Diversity in seed protein content, selected minerals, oil content and fatty acid composition of the Southern African bambara groundnut germplasm collection. J. Food Compos. Anal. 2022, 109, 104477. [Google Scholar] [CrossRef]
- Khan, F.; Azman, R.; Chai, H.H.; Mayes, S.; Lu, C. Genomic and transcriptomic approaches towards the genetic improvement of an underutilised crops: The case of bambara groundnut. Afr. Crop Sci. J. 2016, 24, 429–458. [Google Scholar] [CrossRef] [Green Version]
- Mayes, S.; Ho, W.K.; Chai, H.H.; Song, B.; Chang, Y.; Massawe, F. Bambara Groundnut (Vigna Subterranea (L) Verdc)—A Climate-Smart Crop for Food and Nutrition Security. In Genomic Designing of Climate-Smart Pulse Crops, 1st ed.; Kole, C., Ed.; Springer International Publishing: Cham, Switzerland, 2019; pp. 397–424. [Google Scholar] [CrossRef]
- Ouedraogo, M.; Ouedraogo, J.; Tignere, J.; Bilma, D.; Dabire, C.; Konate, G. Characterization and evaluation of accessions of bambara groundnut (Vigna subterranea (L.) Verdcourt) from Burkina Faso. Sci. Nat. 2008, 5, 191–197. [Google Scholar] [CrossRef] [Green Version]
- Okpuzor, J.; Ogbunugafor, H.A.; Okafor, U.; Sofidiya, M.O. Identification of protein types in bambara nut seeds: Perspectives for dietary protein supply in developing countries. EXCLI J. 2010, 9, 17–28. [Google Scholar]
- Adzawla, W.; Donkoh, S.A.; Nyarko, G.; Reilly, O.P.J.; Olayide, O.E.; Mayes, S.; Feldman, A.; Azman, H.R. Adoption of bambara groundnut production and its effects on farmers welfare in Northern Ghana. Afr. J. Agric. Res. 2016, 11, 583–594. [Google Scholar] [CrossRef]
- Gerrano, A.S.; Jansen van Rensburg, W.S.; Adebola, P.O. Assessment of genetic variability in bambara groundnut (Vigna subterrenea L. Verdc.) using morphological quantitative traits. AJAR 2013, 1, 45–51. [Google Scholar]
- Hlanga, N.C.; Modi, A.T.; Mathew, I. Evaluating nutritional content among bambara groundnut lines. J. Food Compos. Anal. 2021, 102, 104053. [Google Scholar] [CrossRef]
- Khan, M.M.H.; Rafii, M.Y.; Ramlee, S.I.; Jusoh, M.; Mamun, M.A. Genetic analysis and selection of bambara groundnut (Vigna subterranea [L.] Verdc.) landraces for high yield revealed by qualitative and quantitative traits. Sci. Rep. 2021, 11, 7597. [Google Scholar] [CrossRef]
- Minnaar-Ontong, A.; Gerrano, A.S.; Labuschagne, M.T. Assessment of genetic diversity and structure of bambara groundnut [Vigna subterranea (L.) verdc.] landraces in South Africa. Sci. Rep. 2021, 11, 7408. [Google Scholar] [CrossRef]
- Uba, C.U.; Oselebe, H.O.; Tesfaye, A.A.; Abtew, W.G. Genetic diversity and population structure analysis of bambara groundnut (Vigna subterrenea L) landraces using DArT SNP markers. PLoS ONE 2021, 16, e0253600. [Google Scholar] [CrossRef]
- Upadhyaya, H.D.; Ortiz, R. A mini core subset for capturing diversity and promoting utilization of chickpea genetic resources in crop improvement. Theor. Appl. Genet. 2001, 102, 1292–1298. [Google Scholar] [CrossRef] [Green Version]
- Hornakova, O.; Zavodna, M.; Zakova, M.; Kraic, J.; Frantisek, D. Diversity of common bean landraces collected in the Western and Eastern Carpatien. Czech J. Genet. Plant Breed. 2003, 39, 73–83. [Google Scholar] [CrossRef] [Green Version]
- Upadhyaya, H.D.; Kashiwagi, J.; Varshney, R.K.; Gaur, P.M.; Saxena, K.B.; Krishnamurthy, L.; Gowda, C.L.L.; Pundir, R.P.S.; Chaturvedi, S.K.; Basu, P.S.; et al. Phenotyping chickpeas and pigeon peas for adaptation to drought. Front. Physiol. 2012, 3, 179. [Google Scholar] [CrossRef] [Green Version]
- Maisela, R.J. Realizing Agricultural Potential in Land Reform: The Case of Vaalharts Irrigation Scheme in the Northern Cape Province. Master’s Thesis, University of the Western Cape, Cape Town, South Africa, 2007. [Google Scholar]
- Unigwe, A.E.; Gerrano, A.S.; Adebola, P.; Pillay, M. Morphological variation in selected accessions of bambara groundnut (Vigna subterranea L. Verdc) in South Africa. J. Agric. Sci. 2016, 8, 69. [Google Scholar] [CrossRef]
- Mabhaudhi, T.; Modi, A.T. Growth, phenological and yield responses of a bambara groundnut (Vigna subterranea (L.) Verdc.) landrace to imposed water stress under field conditions. S. Afr. J. Plant Soil 2013, 30, 69–79. [Google Scholar] [CrossRef]
- Adeyemo, J.; Otieno, F.; Ojo, O. Analysis of temperature and rainfall trends in Vaal-Harts Irrigation Scheme, South Africa. Am. J. Eng. Res 2014, 3, 265–269. [Google Scholar]
- PGRI/IITA/BAMNET. Descriptors for Bambara Groundnut (Vigna subterranea); International Plant Genetic Resources Institute: Rome, Italy, 2000. [Google Scholar]
- AGROBASE. Generation II SQL, Version 38; Agronomix Software Inc.: Winnipeg, MB, Canada, 2019. [Google Scholar]
- Shimelis, H.; Shiringani, R. Variance components and heritabilities of yield and agronomic traits among cowpea genotypes. Euphytica 2010, 173, 383–389. [Google Scholar] [CrossRef]
- R Core Team. A Language and Environment for Statistical Computing; R Foundation for Statistical Computing: Viena, Austria, 2020; Available online: http://www.R-project.org/ (accessed on 8 November 2020).
- Ntundu, W.H.; Shillah, S.A.; Marandu, W.Y.F.; Christiansen, J.L. Morphological diversity of bambara groundnut [Vigna subterranea (L.) Verdc.] landraces in Tanzania. Crop Evol. Genet. Resour. Crop Evol. 2006, 53, 367–378. [Google Scholar] [CrossRef]
- Falconer, D.S.; Mackay, T.F.C. Introduction to Quantitative Genetics, 4th ed.; Longmans Group: Harlow, UK, 1996; pp. 1–376. [Google Scholar]
- Abu, H.B.; Saaka, S. Characterization of bambara groundnut landraces and their evaluation by farmers in the Upper West Region of Ghana. Int. J. Agric. Sustain. 2011, 6, 64–74. [Google Scholar] [CrossRef]
- Karikari, S.K. Variability between local and exotic bambara groundnut landraces in Botswana. Afr. Crop Sci. J. 2000, 8, 145–152. [Google Scholar] [CrossRef]
- Chijioke, O.B.; Ifeanyi, U.M.; Blessing, A.C. Comparative study on growth and development of some accessions of local germplasm of bambara groundnut (Vigna subterrenea L. Verdc.) of Nigeria in two cropping seasons. J. Crop Sci. Biotechnol. 2010, 13, 21–27. [Google Scholar] [CrossRef]
- Onwubiko, N.I.C.; Odum, O.B.; Utazi, C.O.; Poly-Mbah, P.C. Studies on the adaptation of bambara groundnut [Vigna subterranea (L.) Verdc] in Owerri South-eastern Nigeria. Agric. J. 2011, 4, 60–65. [Google Scholar] [CrossRef] [Green Version]
- Amadou, H.I.; Doumma, A.; Katsileros, A.; Zoubeirou, A.M.; Nourou, S.S.M. Agro-morphological variability in fourteen bambara groundnut (Vigna subterranean (L.) Verdc.) morphotypes cultivated in Niger. SAJB 2015, 3, 774–781. [Google Scholar]
- Benoît, K.B.; Gonné, S.; Félix-Alain, W. Assessment of twenty bambara groundnut (Vigna subterranea (L.) Verdcourt) landraces using quantitative morphological traits. Int. J. Plant Res. 2013, 3, 39–45. [Google Scholar] [CrossRef]
- Musa, M.; Massawe, F.; Mayes, S.; Alshareef, I.; Singh, A. Nitrogen fixation and N-balance studies on bambara groundnut (Vigna subterranea L. Verdc) landraces grown on tropical acidic soils of Malaysia. Commun. Soil Sci. Plant Anal. 2016, 47, 533–542. [Google Scholar] [CrossRef]
- Temegne, N.C.; Taffouo, V.D.; Tadoh, T.C.; Gouertoumbo, W.F.; Wakem, G.A.; Nkou, F.T.D.; Nuemsi, P.P.K.; Youmbi, E. Effect of phosphate fertilization on growth, yield and seed phosphorus content of bambara pea (Vigna subterranea) land races. J. Anim. Plant Sci. 2019, 29, 703–713. [Google Scholar]
- Atoyebi, J.O.; Oyatomi, O.; Osilesi, O.; Adebawo, O.; Abberton, M. Morphological characterisation of selected African accessions of bambara groundnut (Vigna subterranea (L.) Verdc.). Int. J. Plant Res. 2017, 7, 29–35. [Google Scholar] [CrossRef]


| Soil Depth (cm) | pH (KCI) | S (mg kg−1) | Cu (mg kg−1) | Fe (mg kg−1) | Mn (mg kg−1) | Zn (mg kg−1) | CEC cmol (+) kg−1 |
|---|---|---|---|---|---|---|---|
| Vaalharts in 2016–2017 cropping season | |||||||
| 15 | 6.5 | 25.27 | 0.30 | 5.41 | 15.65 | 2.99 | 3.40 |
| 30 | 6.4 | 26.24 | 0.32 | 5.88 | 17.65 | 3.07 | 3.92 |
| Vaalharts in 2017–2018 cropping season | |||||||
| 15 | 6.9 | 17.95 | 0.39 | 6.45 | 13.85 | 2.79 | 4.15 |
| 30 | 6.5 | 30.31 | 0.35 | 5.46 | 8.21 | 3.27 | 4.13 |
| Roodeplaat in 2016–2017 cropping season | |||||||
| 15 | 5.75 | 139.20 | 6.72 | 38.00 | 98.40 | 8.97 | 14.11 |
| 30 | 6.09 | 138.10 | 6.48 | 53.00 | 93.50 | 6.16 | 10.01 |
| 45 | 5.45 | 138.40 | 7.17 | 22.50 | 66.00 | 6.40 | 10.94 |
| Source | GY | NBS | NL | NNS | NSP | PH | PS |
|---|---|---|---|---|---|---|---|
| VHT in 2016–2017 and 2017–2018 cropping seasons | |||||||
| Rep(S) | 1.81 * | 51.29 *** | 101,675.40 *** | 329.49 *** | 230.24 *** | 22.52 | 1321.87 *** |
| Accession (A) | 1.43 * | 6.62 * | 7935.00 | 4.90 * | 8.372 | 40.19 *** | 167.43 ** |
| Season (S) | 19.54 * | 3545.95 *** | 8,633,079.79 *** | 99.33 *** | 6360.34 *** | 690.16 *** | 35,734.80 *** |
| AS | 1.36 * | 7.25 ** | 6962.00 | 3.71 | 7.06 | 20.78 | 115.87 |
| Error | 0.65 | 4.82 | 7323.12 | 3.65 | 8.71 | 24.48 | 113.88 |
| σ2A | 0.05 | 0.00 | 648.67 | 0.79 | 0.87 | 12.94 | 34.37 |
| σ2AS | 0.24 | 0.81 | 0.00 | 0.02 | 0.00 | 0.00 | 0.66 |
| σ2P | 0.23 | 0.65 | 1829.06 | 1.41 | 2.14 | 16.61 | 53.57 |
| H2 | 0.20 | 0.00 | 0.35 | 0.56 | 0.41 | 0.78 | 0.64 |
| VHT and RPT during the 2016–2017 cropping season | |||||||
| Rep(L) | 0.46 | 49.31 *** | 113,816.52 *** | 319.38 *** | 227.16 *** | 30.40 * | 1585.48 *** |
| A | 1.05 *** | 7.16 * | 9525.01 | 4.94 | 7.38 | 17.10 * | 227.02 |
| Location (L) | 73.31 *** | 4491.14 *** | 2,618,804.71 *** | 113.60 *** | 9290.14 *** | 87.48 ** | 22.43 |
| AL | 1.16 *** | 7.45 * | 8119.02 | 4.03 | 8.59 | 15.87 | 203.81 |
| Error | 0.49 | 5.47 | 8598.43 | 3.99 | 8.93 | 12.68 | 183.58 |
| σ2A | 0.00 | 0.00 | 937.33 | 0.61 | 0.00 | 0.82 | 15.47 |
| σ2AL | 0.22 | 0.66 | 0.00 | 0.01 | 0.00 | 1.06 | 6.74 |
| σ2P | 0.08 | 0.94 | 2317.13 | 1.28 | 0.64 | 3.29 | 48.32 |
| H2 | 0.00 | 0.00 | 0.40 | 0.48 | 0.00 | 0.25 | 0.32 |
| Across trials (locations and seasons) | |||||||
| Rep(L) | 1.33 * | 38.68 *** | 75,878.44 *** | 220.62 *** | 153.58 *** | 20.85 | 1735.22 *** |
| A | 1.06 *** | 5.23 * | 6990.64 | 4.40 ** | 5.70 | 31.81 *** | 191.47 |
| L | 36.67 *** | 2697.62 *** | 4,331,373.75 *** | 71.14 *** | 5309.05 *** | 354.64 *** | 23,241.24 *** |
| AL | 1.03 *** | 5.33 ** | 5606.48 | 3.17 | 5.67 | 20.10 | 182.08 |
| Error | 0.48 | 4.03 | 5867.91 | 3.10 | 6.31 | 19.31 | 162.92 |
| σ2A | 0.03 | 0.00 | 1384.16 | 1.23 | 0.03 | 11.71 | 9.39 |
| σ2AL | 0.18 | 0.43 | 0.00 | 0.02 | 0.00 | 0.26 | 6.39 |
| σ2P | 0.14 | 0.49 | 2007.10 | 1.58 | 0.66 | 13.94 | 29.62 |
| H2 | 0.21 | 0.00 | 0.69 | 0.78 | 0.05 | 0.84 | 0.32 |
| Origin | Acc. No. | Accession | GY (t ha−1) | NBS | NL | NNS | NSP | PH (cm) | PS (cm) |
|---|---|---|---|---|---|---|---|---|---|
| South Africa | 9 | SB 4-1 | 0.53 | 6.3 | 177.2 | 4.0 | 7.5 | 23.2 | 45.1 |
| South Africa | 19 | SB 2-1 | 1.64 | 6.5 | 145.8 | 6.0 | 10.1 | 26.1 | 49.7 |
| South Africa | 21 | SB 16-5A | 0.54 | 5.4 | 230.7 | 6.7 | 7.8 | 26.6 | 58.2 |
| South Africa | 25 | SB 19-3A | 0.91 | 6.5 | 255.0 | 6.4 | 9.7 | 27.9 | 63.6 |
| South Africa | 49 | SB 20-2A | 0.81 | 7.1 | 229.8 | 7.6 | 8.4 | 26.7 | 54.3 |
| South Africa | 52 | SB 4-4A | 1.50 | 6.6 | 222.0 | 5.9 | 8.1 | 29.0 | 64.7 |
| South Africa | 53 | SB 10-2A | 1.08 | 7.8 | 218.7 | 5.6 | 8.1 | 29.8 | 58.1 |
| South Africa | 55 | SB 12-3 | 1.64 | 7.1 | 230.0 | 4.4 | 10.0 | 26.6 | 65.7 |
| South Africa | 61 | SB 19-3 | 0.99 | 6.8 | 233.4 | 5.6 | 7.9 | 26.5 | 56.3 |
| South Africa | 62 | SB 8-3 | 0.58 | 5.2 | 136.1 | 4.3 | 7.7 | 26.8 | 56.9 |
| South Africa | 66 | SB 1-1 | 1.13 | 5.2 | 253.1 | 7.5 | 7.1 | 27.9 | 58.8 |
| Botswana | 74 | AS 5 | 0.93 | 5.7 | 136.7 | 4.9 | 6.6 | 27.1 | 54.0 |
| Botswana | 77 | AS 8 | 0.16 | 6.1 | 209.6 | 5.9 | 9.8 | 22.7 | 58.5 |
| Botswana | 78 | AS 9 | 2.20 | 6.8 | 248.7 | 5.8 | 7.9 | 25.4 | 49.2 |
| Botswana | 79 | AS 10 | 1.05 | 6.2 | 257.2 | 5.5 | 8.2 | 26.5 | 57.3 |
| Botswana | 80 | AS 11 | 0.98 | 6.8 | 188.8 | 6.4 | 10.8 | 26.6 | 61.0 |
| Botswana | 81 | AS 12 | 0.84 | 4.1 | 247.3 | 5.6 | 7.4 | 25.8 | 50.5 |
| Botswana | 82 | AS 13 | 0.15 | 5.3 | 249.7 | 7.3 | 9.4 | 25.5 | 54.6 |
| Botswana | 84 | AS 15 | 0.90 | 5.9 | 230.8 | 6.1 | 7.6 | 26.9 | 58.7 |
| Botswana | 86 | AS 17 | 1.24 | 5.5 | 253.3 | 6.5 | 13.3 | 27.4 | 65.2 |
| Botswana | 87 | AS 18 | 0.56 | 7.2 | 191.5 | 6.5 | 10.8 | 27.1 | 58.2 |
| Botswana | 89 | AS 20 | 0.31 | 5.3 | 214.3 | 4.9 | 9.0 | 26.3 | 52.6 |
| Namibia | 90 | K 1 | 1.50 | 6.2 | 232.1 | 5.6 | 8.6 | 23.0 | 53.5 |
| Namibia | 92 | K 3 | 1.24 | 4.9 | 269.9 | 6.3 | 6.3 | 26.0 | 51.1 |
| Namibia | 94 | K 5 | 1.56 | 5.6 | 189.1 | 4.9 | 7.6 | 25.9 | 55.4 |
| Namibia | 95 | K 6 | 1.56 | 6.4 | 289.5 | 6.8 | 8.5 | 27.2 | 65.5 |
| Namibia | 96 | K 7 | 1.20 | 5.3 | 259.3 | 6.2 | 7.8 | 32.9 | 63.0 |
| Malawi | 97 | M 1 | 1.38 | 5.8 | 174.3 | 5.8 | 8.2 | 30.2 | 63.8 |
| Malawi | 99 | M 3 | 0.93 | 6.3 | 163.5 | 6.4 | 7.6 | 27.5 | 56.5 |
| Malawi | 100 | M 4 | 0.18 | 6.4 | 231.5 | 4.9 | 8.2 | 27.0 | 58.4 |
| Malawi | 101 | M 5 | 1.15 | 4.7 | 204.3 | 6.4 | 6.9 | 26.4 | 63.9 |
| Swaziland | 102 | S 1 | 1.42 | 6.4 | 270.1 | 5.7 | 8.3 | 25.7 | 57.6 |
| Swaziland | 105 | S 9 | 1.64 | 4.4 | 227.2 | 7.2 | 8.0 | 26.4 | 62.7 |
| Swaziland | 107 | S 13 | 0.64 | 5.7 | 203.9 | 6.3 | 8.4 | 27.3 | 57.4 |
| Undetermined | 114 | Sel ZEDRES 1 | 0.58 | 5.2 | 205.3 | 7.3 | 7.3 | 25.9 | 61.7 |
| South Africa | 116 | PGR 3 S1 | 1.03 | 5.3 | 170.8 | 5.4 | 9.4 | 28.6 | 61.6 |
| Swaziland | 117 | SWAZI V4 | 1.81 | 6.3 | 240.1 | 5.4 | 7.5 | 26.2 | 61.0 |
| Swaziland | 118 | SWAZI V5A | 0.90 | 5.6 | 230.9 | 6.2 | 7.6 | 25.5 | 60.2 |
| Zimbabwe | 121 | Red Ex Zimbabwe | 0.62 | 4.8 | 173.4 | 4.8 | 8.4 | 25.3 | 57.5 |
| Zimbabwe | 123 | ZIM 003 | 0.85 | 7.8 | 220.2 | 7.4 | 9.1 | 27.5 | 61.9 |
| Madagascar | 127 | MAD 3 | 0.27 | 6.6 | 215.4 | 6.4 | 10.2 | 26.9 | 55.5 |
| South Africa | 129 | 73223 Marabastad | 0.30 | 6.8 | 277.8 | 4.7 | 10.0 | 23.5 | 65.7 |
| South Africa | 131 | 76467 Gravelotte | 1.55 | 6.7 | 232.4 | 5.5 | 8.5 | 28.9 | 61.1 |
| Undetermined | 136 | CAP S1 | 0.57 | 7.6 | 243.5 | 8.7 | 8.7 | 28.0 | 57.2 |
| South Africa | 140 | ETL 76469 | 0.97 | 6.7 | 226.3 | 5.8 | 10.3 | 28.7 | 57.6 |
| South Africa | 141 | PGR3 S2 | 0.66 | 5.9 | 222.9 | 5.0 | 7.6 | 28.0 | 61.7 |
| South Africa | 142 | PGR3 S3 | 0.81 | 6.1 | 206.5 | 6.4 | 8.9 | 27.7 | 59.0 |
| South Africa | 144 | Sel from V4 S3 Dalby | 1.38 | 5.9 | 226.5 | 5.9 | 7.1 | 29.1 | 65.3 |
| Undetermined | 145 | Sel 1 from ZR S4 | 1.29 | 5.7 | 219.7 | 5.2 | 7.9 | 25.4 | 65.7 |
| Swaziland | 146 | Sel 2 from SWAZI V4 S1 | 0.71 | 7.3 | 257.3 | 6.9 | 7.8 | 25.4 | 56.5 |
| Swaziland | 148 | SWAZI V5 | 0.56 | 6.2 | 221.3 | 5.8 | 8.8 | 25.8 | 50.0 |
| South Africa | 149 | V4 S4 (AS) | 0.84 | 5.7 | 170.7 | 5.9 | 9.2 | 26.8 | 48.6 |
| South Africa | 150 | WS 42 (AS) | 2.38 | 5.8 | 170.7 | 5.1 | 8.4 | 27.8 | 59.7 |
| South Africa | 151 | WS 43 | 0.80 | 5.4 | 164.5 | 5.2 | 8.0 | 27.3 | 53.6 |
| South Africa | 156 | WS 49 | 0.69 | 6.7 | 128.0 | 6.9 | 9.6 | 25.5 | 45.5 |
| South Africa | 160 | ZB S1 | 0.76 | 4.6 | 148.8 | 6.3 | 8.0 | 25.4 | 51.6 |
| South Africa | 161 | ZB S2 | 1.33 | 8.7 | 103.1 | 5.7 | 9.9 | 25.1 | 43.6 |
| South Africa | 165 | ZR S3 | 1.24 | 5.4 | 198.7 | 7.8 | 8.8 | 27.9 | 55.8 |
| South Africa | 166 | ZR S4 | 0.74 | 7.1 | 142.0 | 6.6 | 10.1 | 29.4 | 47.3 |
| South Africa | 168 | Sel 1 Potch mengsel | 1.40 | 6.6 | 136.6 | 6.1 | 8.9 | 24.9 | 43.1 |
| South Africa | 169 | SB 10-1F | 1.60 | 7.3 | 141.4 | 6.6 | 9.6 | 27.5 | 52.3 |
| South Africa | 173 | SB 11-1C | 0.35 | 6.4 | 161.3 | 7.1 | 6.9 | 24.3 | 54.1 |
| South Africa | 174 | SB 4-4G | 1.06 | 4.9 | 190.2 | 5.6 | 8.1 | 25.6 | 56.6 |
| South Africa | 175 | SB 4-2B | 1.14 | 5.8 | 161.9 | 7.2 | 7.7 | 28.0 | 52.9 |
| South Africa | 176 | SB 4-4H | 1.59 | 7.4 | 172.9 | 5.1 | 8.3 | 22.7 | 53.6 |
| Undetermined | 177 | S1 Sel 2 | 1.40 | 6.6 | 111.3 | 5.7 | 7.7 | 22.8 | 47.3 |
| Undetermined | 179 | AB 16-5C | 0.75 | 5.7 | 88.6 | 5.5 | 8.2 | 23.3 | 47.6 |
| Namibia | 180 | Caprivi Sel 1 | 0.64 | 6.6 | 168.1 | 8.0 | 9.4 | 27.6 | 45.4 |
| South Africa | 181 | SB 8-1B | 0.74 | 4.7 | 169.7 | 4.7 | 10.1 | 26.4 | 51.7 |
| Undetermined | 183 | S1 Sel 1 | 1.67 | 8.4 | 165.4 | 3.9 | 7.8 | 22.5 | 51.0 |
| South Africa | 184 | SB 14-7B | 0.95 | 6.3 | 154.0 | 6.3 | 9.8 | 24.6 | 45.2 |
| South Africa | 185 | SB 8-3C | 0.99 | 6.9 | 234.8 | 6.2 | 9.6 | 24.4 | 53.4 |
| South Africa | 188 | MV 40-38 | 1.25 | 6.5 | 185.2 | 5.9 | 10.2 | 25.1 | 56.9 |
| South Africa | 189 | MV 67-1 | 2.39 | 9.6 | 149.6 | 5.7 | 7.4 | 26.0 | 52.3 |
| South Africa | 190 | MV 51-5-1C | 1.27 | 6.9 | 150.7 | 6.2 | 10.4 | 24.3 | 54.3 |
| South Africa | 192 | MV 74-2 | 0.49 | 6.0 | 144.7 | 7.2 | 9.4 | 25.0 | 57.4 |
| South Africa | 196 | MV 104-2 | 1.05 | 5.4 | 206.1 | 5.1 | 8.6 | 22.3 | 48.9 |
| South Africa | 197 | MV 8817 | 0.86 | 7.7 | 155.1 | 5.9 | 7.8 | 26.3 | 56.1 |
| Singapore | 198 | Ex Singapore | 0.94 | 8.1 | 178.6 | 5.6 | 8.6 | 24.9 | 51.5 |
| Undetermined | 199 | SCORE 1 | 2.04 | 8.0 | 102.9 | 6.6 | 9.9 | 26.8 | 56.2 |
| Undetermined | 200 | SCORE 2 | 1.03 | 8.0 | 170.5 | 6.7 | 9.0 | 25.7 | 57.8 |
| South Africa | 204 | SB 4-2BB | 1.42 | 6.6 | 192.4 | 6.9 | 9.1 | 28.1 | 56.3 |
| Namibia | 207 | 07K1 | 1.28 | 6.4 | 213.4 | 5.7 | 8.8 | 28.8 | 52.1 |
| Namibia | 208 | 07K3 | 1.52 | 8.2 | 180.8 | 6.8 | 9.6 | 26.9 | 57.0 |
| Undetermined | 209 | 6046 | 0.62 | 6.3 | 69.9 | 6.8 | 7.9 | 26.2 | 53.6 |
| Undetermined | 210 | 6050B | 1.40 | 8.9 | 129.1 | 6.2 | 9.6 | 21.1 | 43.4 |
| South Africa | 211 | RF-6135 | 1.10 | 6.8 | 148.8 | 7.2 | 8.8 | 25.0 | 50.0 |
| South Africa | 212 | RF-6158 | 1.69 | 7.1 | 197.2 | 5.3 | 10.7 | 31.8 | 53.4 |
| South Africa | 213 | RF-6166 | 0.47 | 6.7 | 208.4 | 5.4 | 9.1 | 26.9 | 56.9 |
| South Africa | 214 | RF-6171 | 0.46 | 6.3 | 268.1 | 6.7 | 9.7 | 24.8 | 59.3 |
| South Africa | 215 | RF-6180 | 1.85 | 6.7 | 92.5 | 5.2 | 11.2 | 29.3 | 52.4 |
| South Africa | 216 | RF-6188 | 1.33 | 6.0 | 184.5 | 6.3 | 7.6 | 24.5 | 55.5 |
| South Africa | 217 | RF-6221 | 1.73 | 4.6 | 149.1 | 4.0 | 7.3 | 22.5 | 44.8 |
| South Africa | 218 | RF-6234 | 1.02 | 7.3 | 204.5 | 7.0 | 9.1 | 27.1 | 56.8 |
| South Africa | 219 | RF-6250 | 1.36 | 7.6 | 195.2 | 7.9 | 10.2 | 30.4 | 55.6 |
| South Africa | 220 | RF-6255 | 1.35 | 7.8 | 131.8 | 6.3 | 8.8 | 25.4 | 52.6 |
| South Africa | 221 | RF-6274 | 1.32 | 8.1 | 75.1 | 5.3 | 10.5 | 26.1 | 65.1 |
| South Africa | 222 | RF-6303A | 1.30 | 8.3 | 195.3 | 5.4 | 9.8 | 29.0 | 56.3 |
| South Africa | 223 | RF-6304 | 1.34 | 6.2 | 207.1 | 5.8 | 9.6 | 23.8 | 53.0 |
| South Africa | 224 | RF-7684 | 0.77 | 4.8 | 128.8 | 4.8 | 8.9 | 23.6 | 48.1 |
| Mean | 1.152 | 6.6 | 165.2 | 6.1 | 9.1 | 25.91 | 51.93 | ||
| LSD0.05 | 0.77 | 2.09 | N/A | 1.82 | 2.81 | 4.71 | 10.1579 |
| Origin | Acc. No. | Accession | GY (t ha−1) | NBS | NL | NNS | NSP | PH (cm) | PS (cm) |
|---|---|---|---|---|---|---|---|---|---|
| South Africa | 9 | SB 4-1 | 0.53 | 6.3 | 177.2 | 4.0 | 7.5 | 23.2 | 45.1 |
| South Africa | 19 | SB 2-1 | 1.64 | 6.5 | 145.8 | 6.0 | 10.1 | 26.1 | 49.7 |
| South Africa | 21 | SB 16-5A | 0.54 | 5.4 | 230.7 | 6.7 | 7.8 | 26.6 | 58.2 |
| South Africa | 25 | SB 19-3A | 0.91 | 6.5 | 255.0 | 6.4 | 9.7 | 27.9 | 63.6 |
| South Africa | 49 | SB 20-2A | 0.81 | 7.1 | 229.8 | 7.6 | 8.4 | 26.7 | 54.3 |
| South Africa | 52 | SB 4-4A | 1.50 | 6.6 | 222.0 | 5.9 | 8.1 | 29.0 | 64.7 |
| South Africa | 53 | SB 10-2A | 1.08 | 7.8 | 218.7 | 5.6 | 8.1 | 29.8 | 58.1 |
| South Africa | 55 | SB 12-3 | 1.64 | 7.1 | 230.0 | 4.4 | 10.0 | 26.6 | 65.7 |
| South Africa | 61 | SB 19-3 | 0.99 | 6.8 | 233.4 | 5.6 | 7.9 | 26.5 | 56.3 |
| South Africa | 62 | SB 8-3 | 0.58 | 5.2 | 136.1 | 4.3 | 7.7 | 26.8 | 56.9 |
| South Africa | 66 | SB 1-1 | 1.13 | 5.2 | 253.1 | 7.5 | 7.1 | 27.9 | 58.8 |
| Botswana | 74 | AS 5 | 0.93 | 5.7 | 136.7 | 4.9 | 6.6 | 27.1 | 54.0 |
| Botswana | 77 | AS 8 | 0.16 | 6.1 | 209.6 | 5.9 | 9.8 | 22.7 | 58.5 |
| Botswana | 78 | AS 9 | 2.20 | 6.8 | 248.7 | 5.8 | 7.9 | 25.4 | 49.2 |
| Botswana | 79 | AS 10 | 1.05 | 6.2 | 257.2 | 5.5 | 8.2 | 26.5 | 57.3 |
| Botswana | 80 | AS 11 | 0.98 | 6.8 | 188.8 | 6.4 | 10.8 | 26.6 | 61.0 |
| Botswana | 81 | AS 12 | 0.84 | 4.1 | 247.3 | 5.6 | 7.4 | 25.8 | 50.5 |
| Botswana | 82 | AS 13 | 0.15 | 5.3 | 249.7 | 7.3 | 9.4 | 25.5 | 54.6 |
| Botswana | 84 | AS 15 | 0.90 | 5.9 | 230.8 | 6.1 | 7.6 | 26.9 | 58.7 |
| Botswana | 86 | AS 17 | 1.24 | 5.5 | 253.3 | 6.5 | 13.3 | 27.4 | 65.2 |
| Botswana | 87 | AS 18 | 0.56 | 7.2 | 191.5 | 6.5 | 10.8 | 27.1 | 58.2 |
| Botswana | 89 | AS 20 | 0.31 | 5.3 | 214.3 | 4.9 | 9.0 | 26.3 | 52.6 |
| Namibia | 90 | K 1 | 1.50 | 6.2 | 232.1 | 5.6 | 8.6 | 23.0 | 53.5 |
| Namibia | 92 | K 3 | 1.24 | 4.9 | 269.9 | 6.3 | 6.3 | 26.0 | 51.1 |
| Namibia | 94 | K 5 | 1.56 | 5.6 | 189.1 | 4.9 | 7.6 | 25.9 | 55.4 |
| Namibia | 95 | K 6 | 1.56 | 6.4 | 289.5 | 6.8 | 8.5 | 27.2 | 65.5 |
| Namibia | 96 | K 7 | 1.20 | 5.3 | 259.3 | 6.2 | 7.8 | 32.9 | 63.0 |
| Malawi | 97 | M 1 | 1.38 | 5.8 | 174.3 | 5.8 | 8.2 | 30.2 | 63.8 |
| Malawi | 99 | M 3 | 0.93 | 6.3 | 163.5 | 6.4 | 7.6 | 27.5 | 56.5 |
| Malawi | 100 | M 4 | 0.18 | 6.4 | 231.5 | 4.9 | 8.2 | 27.0 | 58.4 |
| Malawi | 101 | M 5 | 1.15 | 4.7 | 204.3 | 6.4 | 6.9 | 26.4 | 63.9 |
| Swaziland | 102 | S 1 | 1.42 | 6.4 | 270.1 | 5.7 | 8.3 | 25.7 | 57.6 |
| Swaziland | 105 | S 9 | 1.64 | 4.4 | 227.2 | 7.2 | 8.0 | 26.4 | 62.7 |
| Swaziland | 107 | S 13 | 0.64 | 5.7 | 203.9 | 6.3 | 8.4 | 27.3 | 57.4 |
| Undetermined | 114 | Sel ZEDRES 1 | 0.58 | 5.2 | 205.3 | 7.3 | 7.3 | 25.9 | 61.7 |
| South Africa | 116 | PGR 3 S1 | 1.03 | 5.3 | 170.8 | 5.4 | 9.4 | 28.6 | 61.6 |
| Swaziland | 117 | SWAZI V4 | 1.81 | 6.3 | 240.1 | 5.4 | 7.5 | 26.2 | 61.0 |
| Swaziland | 118 | SWAZI V5A | 0.90 | 5.6 | 230.9 | 6.2 | 7.6 | 25.5 | 60.2 |
| Zimbabwe | 121 | Red Ex Zimbabwe | 0.62 | 4.8 | 173.4 | 4.8 | 8.4 | 25.3 | 57.5 |
| Zimbabwe | 123 | ZIM 003 | 0.85 | 7.8 | 220.2 | 7.4 | 9.1 | 27.5 | 61.9 |
| Madagascar | 127 | MAD 3 | 0.27 | 6.6 | 215.4 | 6.4 | 10.2 | 26.9 | 55.5 |
| South Africa | 129 | 73223 Marabastad | 0.30 | 6.8 | 277.8 | 4.7 | 10.0 | 23.5 | 65.7 |
| South Africa | 131 | 76467 Gravelotte | 1.55 | 6.7 | 232.4 | 5.5 | 8.5 | 28.9 | 61.1 |
| Undetermined | 136 | CAP S1 | 0.57 | 7.6 | 243.5 | 8.7 | 8.7 | 28.0 | 57.2 |
| South Africa | 140 | ETL 76469 | 0.97 | 6.7 | 226.3 | 5.8 | 10.3 | 28.7 | 57.6 |
| South Africa | 141 | PGR3 S2 | 0.66 | 5.9 | 222.9 | 5.0 | 7.6 | 28.0 | 61.7 |
| South Africa | 142 | PGR3 S3 | 0.81 | 6.1 | 206.5 | 6.4 | 8.9 | 27.7 | 59.0 |
| South Africa | 144 | Sel V4 S3 Dalby | 1.38 | 5.9 | 226.5 | 5.9 | 7.1 | 29.1 | 65.3 |
| Undetermined | 145 | Sel 1 ZR S4 | 1.29 | 5.7 | 219.7 | 5.2 | 7.9 | 25.4 | 65.7 |
| Swaziland | 146 | Sel 2 SWAZI V4 S1 | 0.71 | 7.3 | 257.3 | 6.9 | 7.8 | 25.4 | 56.5 |
| Swaziland | 148 | SWAZI V5 | 0.71 | 5.8 | 265.6 | 5.6 | 8.2 | 27.3 | 64.4 |
| South Africa | 149 | V4 S4 (AS) | 0.81 | 6.3 | 258.2 | 6.6 | 8.9 | 26.5 | 98.4 |
| South Africa | 150 | WS 42 (AS) | 1.54 | 5.8 | 222.0 | 5.5 | 7.7 | 28.5 | 61.1 |
| South Africa | 151 | WS 43 | 0.83 | 5.2 | 196.1 | 5.8 | 7.0 | 28.2 | 60.1 |
| South Africa | 156 | WS 49 | 0.41 | 5.8 | 164.4 | 5.9 | 8.7 | 25.5 | 51.8 |
| South Africa | 160 | ZB S1 | 0.47 | 3.7 | 204.2 | 5.5 | 7.0 | 27.6 | 51.7 |
| South Africa | 161 | ZB S2 | 0.84 | 9.0 | 163.0 | 5.8 | 10.3 | 24.7 | 47.9 |
| South Africa | 165 | ZR S3 | 1.37 | 4.8 | 263.9 | 8.1 | 7.8 | 28.6 | 60.0 |
| South Africa | 166 | ZR S4 | 0.41 | 5.9 | 172.5 | 5.9 | 9.4 | 25.1 | 59.0 |
| South Africa | 168 | Sel 1 Potch mengsel | 1.15 | 6.3 | 192.9 | 6.4 | 8.7 | 26.1 | 52.9 |
| South Africa | 169 | SB 10-1F | 1.09 | 6.8 | 204.5 | 5.4 | 8.6 | 26.5 | 58.0 |
| South Africa | 173 | SB 11-1C | 0.42 | 6.1 | 215.5 | 7.0 | 6.3 | 27.2 | 61.0 |
| South Africa | 174 | SB 4-4G | 0.83 | 5.0 | 240.9 | 5.9 | 6.8 | 25.5 | 54.1 |
| South Africa | 175 | SB 4-2B | 1.06 | 6.2 | 230.7 | 7.6 | 7.7 | 27.0 | 61.4 |
| South Africa | 176 | SB 4-4H | 1.16 | 7.3 | 229.6 | 5.6 | 7.8 | 24.3 | 58.4 |
| Undetermined | 177 | S1 Sel 2 | 1.63 | 6.1 | 150.9 | 5.9 | 7.8 | 26.6 | 59.7 |
| Undetermined | 179 | AB 16-5C | 0.81 | 5.8 | 130.5 | 4.8 | 7.8 | 23.6 | 57.2 |
| Namibia | 180 | Caprivi Sel 1 | 0.61 | 7.5 | 225.4 | 8.4 | 8.6 | 25.6 | 58.0 |
| South Africa | 181 | SB 8-1B | 0.57 | 4.6 | 208.4 | 4.6 | 9.3 | 27.1 | 54.2 |
| Undetermined | 183 | S1 Sel 1 | 1.79 | 8.3 | 251.7 | 4.4 | 7.9 | 25.6 | 62.2 |
| South Africa | 184 | SB 14-7B | 0.87 | 6.6 | 220.1 | 6.8 | 9.4 | 27.1 | 58.2 |
| South Africa | 185 | SB 8-3C | 1.42 | 5.8 | 311.8 | 5.9 | 8.5 | 26.0 | 63.3 |
| South Africa | 188 | MV 40-38 | 1.50 | 6.4 | 213.8 | 6.0 | 9.4 | 26.1 | 59.1 |
| South Africa | 189 | MV 67-1 | 1.40 | 9.6 | 241.0 | 6.2 | 7.2 | 28.1 | 57.8 |
| South Africa | 190 | MV 51-5-1C | 1.04 | 6.3 | 194.5 | 5.4 | 9.2 | 26.2 | 60.6 |
| South Africa | 192 | MV 74-2 | 0.60 | 5.3 | 188.7 | 5.7 | 9.3 | 23.7 | 68.8 |
| South Africa | 196 | MV 104-2 | 1.17 | 6.3 | 262.7 | 6.0 | 7.6 | 25.0 | 64.4 |
| South Africa | 197 | MV 8817 | 0.75 | 7.4 | 194.8 | 7.3 | 7.4 | 26.6 | 60.4 |
| Singapore | 198 | Ex Singapore | 0.95 | 8.6 | 222.6 | 6.3 | 7.8 | 26.5 | 61.1 |
| Undetermined | 199 | SCORE 1 | 1.47 | 7.6 | 146.3 | 6.4 | 9.6 | 28.9 | 66.7 |
| Undetermined | 200 | SCORE 2 | 1.09 | 6.9 | 223.3 | 6.6 | 8.1 | 27.8 | 64.3 |
| South Africa | 204 | SB 4-2BB | 0.87 | 6.5 | 265.5 | 7.7 | 8.8 | 29.4 | 67.8 |
| Namibia | 207 | 07K1 | 1.04 | 6.1 | 262.0 | 5.7 | 8.3 | 26.9 | 57.9 |
| Namibia | 208 | 07K3 | 0.92 | 7.9 | 282.2 | 6.4 | 8.6 | 26.5 | 66.5 |
| Undetermined | 209 | 6046 | 0.65 | 5.8 | 124.8 | 7.5 | 8.2 | 30.0 | 63.4 |
| Undetermined | 210 | 6050B | 1.32 | 9.2 | 209.3 | 6.6 | 8.5 | 23.3 | 57.6 |
| South Africa | 211 | RF-6135 | 1.05 | 5.7 | 206.0 | 6.3 | 8.6 | 26.8 | 61.9 |
| South Africa | 212 | RF-6158 | 1.06 | 7.1 | 214.2 | 5.3 | 8.9 | 29.4 | 61.5 |
| South Africa | 213 | RF-6166 | 0.42 | 6.5 | 235.1 | 6.2 | 8.8 | 25.5 | 58.3 |
| South Africa | 214 | RF-6171 | 0.48 | 5.8 | 309.7 | 6.6 | 9.2 | 23.3 | 58.5 |
| South Africa | 215 | RF-6180 | 0.98 | 7.3 | 176.9 | 5.7 | 9.8 | 26.8 | 61.3 |
| South Africa | 216 | RF-6188 | 1.05 | 5.4 | 249.8 | 6.9 | 6.9 | 26.9 | 62.7 |
| South Africa | 217 | RF-6221 | 1.72 | 4.7 | 197.6 | 4.4 | 6.7 | 23.9 | 51.4 |
| South Africa | 218 | RF-6234 | 0.44 | 6.7 | 259.6 | 5.9 | 8.3 | 26.0 | 62.9 |
| South Africa | 219 | RF-6250 | 1.40 | 6.8 | 241.8 | 6.9 | 8.8 | 27.0 | 57.4 |
| South Africa | 220 | RF-6255 | 0.81 | 7.2 | 195.6 | 6.8 | 8.1 | 25.3 | 54.6 |
| South Africa | 221 | RF-6274 | 0.81 | 7.7 | 120.8 | 6.0 | 10.3 | 26.4 | 67.0 |
| South Africa | 222 | RF-6303A | 1.12 | 8.2 | 226.7 | 5.6 | 8.8 | 25.0 | 50.1 |
| South Africa | 223 | RF-6304 | 1.18 | 6.9 | 292.0 | 6.9 | 8.9 | 26.1 | 63.8 |
| South Africa | 224 | RF-7684 | 0.84 | 4.2 | 182.5 | 4.9 | 8.2 | 26.0 | 56.7 |
| Mean | 0.98 | 6.3 | 219.1 | 6.1 | 8.4 | 26.6 | 59.46 | ||
| LSD0.05 | 0.67 | 2.23 | 88.27 | 1.90 | 2.84 | 3.39 | 12.90 |
| Origin | Acc. No. | Accession | GY (t ha−1) | NBS | NL | NNS | NSP | PH (cm) | PS (cm) |
|---|---|---|---|---|---|---|---|---|---|
| South Africa | 9 | SB 4-1 | 0.63 | 5.4 | 133.5 | 4.3 | 6.6 | 22.9 | 43.8 |
| South Africa | 19 | SB 2-1 | 1.29 | 5.4 | 109.6 | 6.0 | 8.5 | 25.3 | 46.0 |
| South Africa | 21 | SB 16-5A | 0.63 | 5.0 | 160.9 | 6.3 | 7.0 | 25.4 | 52.6 |
| South Africa | 25 | SB 19-3A | 0.77 | 6.0 | 186.6 | 6.2 | 8.7 | 25.3 | 55.5 |
| South Africa | 49 | SB 20-2A | 0.96 | 6.5 | 169.9 | 7.0 | 8.0 | 25.4 | 49.9 |
| South Africa | 52 | SB 4-4A | 1.51 | 5.6 | 161.7 | 5.8 | 7.1 | 28.0 | 60.2 |
| South Africa | 53 | SB 10-2A | 0.88 | 6.7 | 161.9 | 6.1 | 7.4 | 26.9 | 52.8 |
| South Africa | 55 | SB 12-3 | 1.96 | 6.0 | 169.1 | 4.7 | 8.5 | 26.2 | 63.2 |
| South Africa | 61 | SB 19-3 | 1.02 | 5.6 | 170.3 | 5.8 | 7.5 | 26.4 | 52.7 |
| South Africa | 62 | SB 8-3 | 0.50 | 4.9 | 111.6 | 4.9 | 7.0 | 25.2 | 52.0 |
| South Africa | 66 | SB 1-1 | 1.27 | 4.9 | 185.6 | 7.1 | 6.6 | 26.6 | 54.3 |
| Botswana | 74 | AS 5 | 0.91 | 5.1 | 106.7 | 5.1 | 6.2 | 25.4 | 50.1 |
| Botswana | 77 | AS 8 | 0.18 | 5.3 | 158.0 | 5.8 | 8.7 | 21.3 | 51.5 |
| Botswana | 78 | AS 9 | 1.57 | 6.0 | 183.5 | 5.8 | 7.1 | 23.6 | 45.6 |
| Botswana | 79 | AS 10 | 1.11 | 5.5 | 183.7 | 5.5 | 7.6 | 24.3 | 50.2 |
| Botswana | 80 | AS 11 | 0.84 | 6.2 | 139.2 | 6.7 | 9.3 | 25.0 | 54.9 |
| Botswana | 81 | AS 12 | 1.18 | 3.7 | 181.7 | 5.5 | 6.7 | 25.8 | 51.3 |
| Botswana | 82 | AS 13 | 0.38 | 5.2 | 188.9 | 7.0 | 8.4 | 25.4 | 53.5 |
| Botswana | 84 | AS 15 | 0.76 | 5.6 | 165.9 | 5.9 | 7.0 | 27.9 | 49.6 |
| Botswana | 86 | AS 17 | 1.21 | 5.2 | 184.8 | 6.1 | 11.0 | 26.2 | 57.9 |
| Botswana | 87 | AS 18 | 0.77 | 6.9 | 139.6 | 6.1 | 9.3 | 27.0 | 54.7 |
| Botswana | 89 | AS 20 | 0.45 | 4.8 | 154.5 | 5.0 | 7.9 | 25.9 | 47.8 |
| Namibia | 90 | K 1 | 1.16 | 5.2 | 175.2 | 5.8 | 7.7 | 22.8 | 48.7 |
| Namibia | 92 | K3 | 1.47 | 4.1 | 194.6 | 6.0 | 6.0 | 25.7 | 51.2 |
| Namibia | 94 | K 5 | 1.65 | 5.2 | 137.5 | 5.0 | 6.6 | 25.7 | 50.7 |
| Namibia | 95 | K 6 | 1.30 | 5.9 | 213.7 | 6.7 | 7.7 | 26.7 | 59.7 |
| Namibia | 96 | K 7 | 1.08 | 5.1 | 188.7 | 6.1 | 7.4 | 35.4 | 61.9 |
| Malawi | 97 | M 1 | 1.11 | 5.3 | 139.1 | 6.2 | 7.5 | 28.7 | 57.6 |
| Malawi | 99 | M 3 | 0.89 | 5.5 | 121.7 | 7.1 | 6.9 | 28.0 | 51.7 |
| Malawi | 100 | M4 | 0.45 | 5.5 | 173.8 | 4.9 | 7.4 | 26.2 | 52.4 |
| Malawi | 101 | M5 | 1.41 | 4.8 | 151.9 | 6.3 | 6.8 | 26.3 | 58.7 |
| Swaziland | 102 | S1 | 1.29 | 5.6 | 197.2 | 5.3 | 7.5 | 25.0 | 52.7 |
| Swaziland | 105 | S9 | 1.35 | 4.7 | 171.6 | 6.9 | 7.6 | 26.5 | 57.9 |
| Swaziland | 107 | S 13 | 0.86 | 5.0 | 148.5 | 6.1 | 7.6 | 27.9 | 55.1 |
| Undetermined | 114 | Sel ZEDRES 1 | 0.56 | 4.9 | 150.2 | 6.6 | 7.0 | 26.0 | 54.3 |
| South Africa | 116 | PGR 3 S1 | 0.87 | 4.9 | 132.8 | 5.7 | 8.5 | 26.6 | 54.3 |
| Swaziland | 117 | SWAZI V4 | 1.39 | 5.6 | 175.5 | 5.7 | 6.8 | 25.4 | 52.5 |
| Swaziland | 118 | SWAZI V5A | 0.70 | 5.1 | 173.7 | 6.2 | 7.0 | 24.3 | 54.4 |
| Zimbabwe | 121 | Red Ex Zimbabwe | 0.59 | 4.5 | 127.5 | 4.8 | 7.3 | 24.4 | 50.4 |
| Zimbabwe | 123 | ZIM 003 | 0.62 | 6.4 | 166.3 | 7.3 | 7.9 | 30.0 | 59.3 |
| Madagascar | 127 | MAD 3 | 0.55 | 5.8 | 168.0 | 6.1 | 9.1 | 26.7 | 56.0 |
| South Africa | 129 | 73223 Marabastad | 0.89 | 5.9 | 201.8 | 4.7 | 8.5 | 23.9 | 62.7 |
| South Africa | 131 | 76467 Gravelotte | 1.39 | 5.6 | 166.4 | 5.4 | 7.5 | 27.5 | 55.1 |
| Undetermined | 136 | CAP S1 | 0.73 | 6.8 | 173.7 | 7.7 | 7.5 | 27.3 | 55.0 |
| South Africa | 140 | ETL 76469 | 0.93 | 5.9 | 162.7 | 5.5 | 8.7 | 26.8 | 52.3 |
| South Africa | 141 | PGR3 S2 | 0.74 | 5.3 | 162.7 | 5.0 | 7.2 | 27.6 | 54.8 |
| South Africa | 142 | PGR3 S3 | 0.79 | 5.3 | 145.9 | 5.9 | 7.9 | 26.3 | 52.5 |
| South Africa | 144 | Sel V4 S3 Dalby | 1.20 | 5.2 | 160.1 | 5.7 | 6.5 | 26.4 | 55.8 |
| Undetermined | 145 | Sel 1 ZR S4 | 1.14 | 5.2 | 169.0 | 5.6 | 7.6 | 25.2 | 62.5 |
| Swaziland | 146 | Sel 2 SWAZI V4 S1 | 0.65 | 6.3 | 181.8 | 6.4 | 7.2 | 24.2 | 49.0 |
| Swaziland | 148 | SWAZI V5 | 0.65 | 5.2 | 194.8 | 5.7 | 7.1 | 26.1 | 56.2 |
| South Africa | 149 | V4 S4 (AS) | 0.65 | 5.2 | 181.0 | 6.1 | 7.8 | 26.7 | 76.5 |
| South Africa | 150 | WS 42 (AS) | 1.88 | 5.2 | 165.2 | 5.3 | 7.1 | 27.7 | 59.1 |
| South Africa | 151 | WS 43 | 0.79 | 4.7 | 139.2 | 5.5 | 6.4 | 27.1 | 54.5 |
| South Africa | 156 | WS 49 | 0.61 | 5.7 | 129.4 | 6.2 | 8.0 | 26.4 | 51.0 |
| South Africa | 160 | ZB S1 | 0.69 | 4.2 | 146.9 | 5.9 | 7.0 | 26.6 | 50.9 |
| South Africa | 161 | ZB S2 | 0.97 | 7.3 | 114.2 | 5.6 | 8.8 | 25.0 | 47.3 |
| South Africa | 165 | ZR S3 | 1.07 | 4.4 | 201.1 | 7.2 | 7.1 | 27.6 | 56.0 |
| South Africa | 166 | ZR S4 | 0.63 | 5.8 | 135.6 | 6.1 | 8.3 | 27.9 | 50.9 |
| South Africa | 168 | Sel 1 Potch mengsel | 1.08 | 5.7 | 140.4 | 6.0 | 7.4 | 24.9 | 48.3 |
| South Africa | 169 | SB 10-1F | 1.28 | 5.9 | 148.7 | 6.0 | 7.8 | 26.6 | 55.0 |
| South Africa | 173 | SB 11-1C | 0.49 | 5.5 | 154.2 | 6.5 | 6.2 | 25.0 | 54.9 |
| South Africa | 174 | SB 4-4G | 0.73 | 4.6 | 176.9 | 5.6 | 6.6 | 25.3 | 52.4 |
| South Africa | 175 | SB 4-2B | 0.94 | 5.4 | 162.5 | 7.2 | 6.8 | 26.9 | 53.8 |
| South Africa | 176 | SB 4-4H | 1.19 | 6.5 | 164.7 | 5.3 | 7.1 | 23.1 | 52.6 |
| Undetermined | 177 | S1 Sel 2 | 1.28 | 5.3 | 112.3 | 5.7 | 6.5 | 24.5 | 51.4 |
| Undetermined | 179 | AB 16-5C | 1.02 | 5.0 | 102.4 | 5.1 | 7.4 | 23.8 | 54.5 |
| Namibia | 180 | Caprivi Sel 1 | 0.49 | 6.4 | 169.2 | 8.1 | 7.6 | 26.7 | 51.5 |
| South Africa | 181 | SB 8-1B | 0.69 | 4.3 | 153.5 | 4.7 | 8.1 | 26.3 | 51.6 |
| Undetermined | 183 | S1 Sel 1 | 1.20 | 6.8 | 181.4 | 5.1 | 6.8 | 24.0 | 53.8 |
| South Africa | 184 | SB 14-7B | 0.89 | 5.6 | 156.9 | 6.0 | 8.0 | 24.7 | 49.0 |
| South Africa | 185 | SB 8-3C | 1.05 | 5.4 | 223.2 | 6.0 | 8.1 | 24.8 | 55.2 |
| South Africa | 188 | MV 40-38 | 1.12 | 5.6 | 161.7 | 5.8 | 8.4 | 25.1 | 54.9 |
| South Africa | 189 | MV 67-1 | 1.70 | 7.7 | 178.3 | 5.9 | 6.7 | 27.0 | 53.5 |
| South Africa | 190 | MV 51-5-1C | 1.08 | 5.5 | 145.0 | 5.6 | 8.3 | 24.5 | 53.5 |
| South Africa | 192 | MV 74-2 | 0.57 | 4.9 | 133.8 | 6.0 | 7.8 | 25.2 | 60.5 |
| South Africa | 196 | MV 104-2 | 1.01 | 5.4 | 186.7 | 5.8 | 7.0 | 23.4 | 56.0 |
| South Africa | 197 | MV 8817 | 0.84 | 6.6 | 141.3 | 6.5 | 6.8 | 25.6 | 57.2 |
| Singapore | 198 | Ex Singapore | 0.80 | 6.7 | 162.3 | 5.7 | 7.0 | 25.0 | 53.4 |
| Undetermined | 199 | SCORE 1 | 1.53 | 6.4 | 111.1 | 6.0 | 8.1 | 27.7 | 62.2 |
| Undetermined | 200 | SCORE 2 | 0.88 | 6.1 | 172.2 | 6.4 | 7.4 | 27.1 | 60.4 |
| South Africa | 204 | SB 4-2BB | 1.21 | 6.1 | 184.1 | 6.7 | 7.7 | 28.0 | 60.0 |
| Namibia | 207 | 07K1 | 1.04 | 5.4 | 183.7 | 5.5 | 7.5 | 27.4 | 52.4 |
| Namibia | 208 | 07K3 | 1.11 | 6.7 | 204.5 | 6.3 | 7.7 | 25.9 | 61.2 |
| Undetermined | 209 | 6046 | 0.60 | 5.2 | 92.1 | 6.7 | 7.1 | 27.3 | 55.9 |
| Undetermined | 210 | 6050B | 1.12 | 7.5 | 149.2 | 6.4 | 7.9 | 22.1 | 50.8 |
| South Africa | 211 | RF-6135 | 1.03 | 5.6 | 150.1 | 6.4 | 7.6 | 26.0 | 54.0 |
| South Africa | 212 | RF-6158 | 1.38 | 5.8 | 166.3 | 5.4 | 8.1 | 31.1 | 57.8 |
| South Africa | 213 | RF-6166 | 0.51 | 5.6 | 181.0 | 5.7 | 7.7 | 26.1 | 56.2 |
| South Africa | 214 | RF-6171 | 0.41 | 5.2 | 232.0 | 6.3 | 8.1 | 23.6 | 55.8 |
| South Africa | 215 | RF-6180 | 1.42 | 6.4 | 131.0 | 5.6 | 8.6 | 28.4 | 54.8 |
| South Africa | 216 | RF-6188 | 1.11 | 4.9 | 180.4 | 6.4 | 6.4 | 25.5 | 57.1 |
| South Africa | 217 | RF-6221 | 1.41 | 4.4 | 142.5 | 4.4 | 6.3 | 23.1 | 47.4 |
| South Africa | 218 | RF-6234 | 0.82 | 6.1 | 192.8 | 6.3 | 7.6 | 26.3 | 57.8 |
| South Africa | 219 | RF-6250 | 1.04 | 6.1 | 182.9 | 7.0 | 8.1 | 29.4 | 55.2 |
| South Africa | 220 | RF-6255 | 1.05 | 6.4 | 142.6 | 6.4 | 7.3 | 25.3 | 52.3 |
| South Africa | 221 | RF-6274 | 1.01 | 6.5 | 91.6 | 5.6 | 8.8 | 26.2 | 63.1 |
| South Africa | 222 | RF-6303A | 1.11 | 6.9 | 171.9 | 5.4 | 7.8 | 26.9 | 51.2 |
| South Africa | 223 | RF-6304 | 1.30 | 5.9 | 209.7 | 6.1 | 7.8 | 24.9 | 56.8 |
| South Africa | 224 | RF-7684 | 0.84 | 4.0 | 138.0 | 5.2 | 7.7 | 24.9 | 50.8 |
| Mean | 0.98 | 5.6 | 161.1 | 5.9 | 7.6 | 26.01 | 54.4 | ||
| LSD0.05 | 0.54 | 1.56 | - | 1.37 | 1.95 | 3.41 | - |
| Traits | PC1 | PC2 | PC3 |
|---|---|---|---|
| GY | 0.102 | −0.517 | 0.665 |
| NBS | 0.324 | 0.440 | 0.486 |
| NL | 0.297 | −0.222 | −0.199 |
| NNS | 0.452 | 0.201 | −0.445 |
| NSP | 0.302 | 0.541 | 0.270 |
| PH | 0468 | −0.297 | −0.105 |
| PS | 0.531 | −0.262 | 0.005 |
| Eigenvalue | 1.791 | 1.249 | 1.115 |
| Variability (%) | 25.592 | 17.837 | 15.932 |
| Cumulative (%) | 25.592 | 43.429 | 59.361 |
| Trait | PH | PS | NNS | NL | NSP | NBS |
|---|---|---|---|---|---|---|
| PS | 0.34 *** | |||||
| NNS | 0.15 *** | 0.14 *** | ||||
| NL | 0.23 *** | 0.45 *** | 0.30 *** | |||
| NSP | 0.13 *** | 0.18 *** | 0.40 *** | 0.54 *** | ||
| NBS | 0.12 *** | 0.23 *** | 0.25 *** | 0.56 *** | 0.67 *** | |
| GY | 0.17 *** | 0.16 *** | 0.01 | 0.18 *** | 0.25 *** | 0.28 *** |
Publisher’s Note: MDPI stays neutral with regard to jurisdictional claims in published maps and institutional affiliations. |
© 2022 by the authors. Licensee MDPI, Basel, Switzerland. This article is an open access article distributed under the terms and conditions of the Creative Commons Attribution (CC BY) license (https://creativecommons.org/licenses/by/4.0/).
Share and Cite
Siwale, J.; Labuschagne, M.; Gerrano, A.S.; Mbuma, N.W. Phenotypic Diversity and Characterization of the Southern African Bambara Groundnut Germplasm Collection for Grain Yield and Yield Components. Agronomy 2022, 12, 1811. https://doi.org/10.3390/agronomy12081811
Siwale J, Labuschagne M, Gerrano AS, Mbuma NW. Phenotypic Diversity and Characterization of the Southern African Bambara Groundnut Germplasm Collection for Grain Yield and Yield Components. Agronomy. 2022; 12(8):1811. https://doi.org/10.3390/agronomy12081811
Chicago/Turabian StyleSiwale, Julius, Maryke Labuschagne, Abe Shegro Gerrano, and Ntombokulunga W. Mbuma. 2022. "Phenotypic Diversity and Characterization of the Southern African Bambara Groundnut Germplasm Collection for Grain Yield and Yield Components" Agronomy 12, no. 8: 1811. https://doi.org/10.3390/agronomy12081811
APA StyleSiwale, J., Labuschagne, M., Gerrano, A. S., & Mbuma, N. W. (2022). Phenotypic Diversity and Characterization of the Southern African Bambara Groundnut Germplasm Collection for Grain Yield and Yield Components. Agronomy, 12(8), 1811. https://doi.org/10.3390/agronomy12081811