Article

Plant-Based Protein Hydrolysate Improves Salinity Tolerance in Hemp: Agronomical and Physiological Aspects

1
Department of Agricultural Sciences, University of Naples Federico II, 80055 Portici, Italy
2
Council for Agricultural Research and Economics (CREA)—Research Center for Cereal and Industrial Crops, 81100 Caserta, Italy
3
Institute for Sustainable Plant Protection, National Research Council, 80055 Portici, Italy
4
Department of Agricultural, Food and Forest Sciences, University of Palermo, Viale delle Scienze 4, 90128 Palermo, Italy
*
Authors to whom correspondence should be addressed.
Agronomy 2021, 11(2), 342; https://doi.org/10.3390/agronomy11020342
Submission received: 29 December 2020 / Revised: 2 February 2021 / Accepted: 11 February 2021 / Published: 14 February 2021

Abstract

:
Hemp (Cannabis sativa L.) is a multipurpose plant attracting increasing interest as a source for the production of natural fibers, paper, bio-building material and food. In this research we studied the agronomical performance of Cannabis sativa cv. Eletta Campana irrigated with saline water. Under those conditions, we tested the effect of protein hydrolysate (PH) biostimulant application in overcoming and/or balancing deleterious salinity effects. The results of the diverse treatments were also investigated at the physiological level, focusing on photosynthesis by means of a chlorophyll a fluorescence technique, which give an insight into the plant primary photochemical reactions. Four salinity levels of the irrigation solution (fresh water–EC0, and NaCl solutions at EC 2.0, 4.0 or 6.0 dS m−1, EC2, EC4 and EC6, respectively) were combined with 2 biostimulant treatments (untreated (control) or treated with a commercial legume-derived protein hydrolysate (LDPH)). The increasing salinity affected plant photochemistry resulting in lower plant growth and seed production, while the LDPH biostimulant showed a protective effect, which improved crop performance both in control and in salinity conditions. The LDPH treatment improved seeds yield (+38.6% on average of all treated plants respect to untreated plants), as well as residual biomass, relevant in fiber production.

1. Introduction

Hemp (Cannabis sativa L.) is a very ancient crop: it was the first plant known to be domestically cultivated as proved by remnants of hemp cloth found in ancient Mesopotamia archeological sites dating back to 8000 BC. Since then, hemp has been widely grown worldwide supplying fiber, paper, and food. In Italy, it was cultivated until 1970 when it was abandoned due to several causes: the scarce optimization of crop management, the excessive physical labor for several processing phases, the introduction of new synthetic fibers, but above all the enactment of laws about drugs, which created a great misunderstanding, confusing the industrial hemp varieties with the drug ones. However, at the end of the 1990s, the European Community re-introduced hemp cultivation, as industrial crop and finally, in December 2016, also Italy allowed hemp cultivation destined for fiber, industrial, or food production.
Hemp is a multi-functional crop, and this characteristic has increased the recent come back of interest in the hemp cultivation [1]. In addition to historical uses of hemp, recently this crop has found several use-destinations: bio-building sector [2,3,4], food packaging sector [5], car industries [6], and bioenergy production (biogas [7]; ethanol [8,9]; biomass combustion [8,10]). In addition to the use of fiber or shives, also hemp seeds have a large utilization both in food preparations [11,12], feed [13,14], and cosmetic application [15,16]. Finally, there are several secondary metabolites of hemp, such as cannabinoids, flavonoids and terpenoids, which can be used in pharmaceutical preparations [17], or as bio-pesticides [18].
Moreover, hemp has also a great agronomical value: it is a typical break crop with beneficial effects in the interrupting of any monoculture, both cereals and legumes; it also leaves good residual fertility to the soil; it has a deep root system that on the one hand improves the soil structure [19] and the other one, increase its adaptability to water stress. Cheng et al. [20] define hemp suitable for the improvement of saline lands, but with a notable difference in salt tolerance among the varieties. Plant salinity exposure, is one of the most critical environmental issues, accounting altogether for almost 70% loss of the potential crop yield. According to FAO data [21], about 400 million of hectares agricultural lands in the world are distressed by salinity. Soil salinity can have a natural [22,23] or anthropogenic origin. The latter mostly affects irrigated lands, where the use of saline water or the excessive pumping of groundwater can increase the concentration of salts in the soil. Moreover, climate changes may contribute to a further increase of soil salinity [24].
The saline stress can occur through (i) osmotic stress, caused by the decrease of soil water potential and subsequent reduced water absorption by roots [25]; (ii) nutritional stress, due to modification in nutrient uptake; (iii) toxic stress, mainly linked to salt concentration [26,27]; (iv) oxidative stress [28].
The influence of salinity on crops be contingent on several factors such as type of salt, its concentration, plant species or cultivars, which can have different tolerance to salt stress [29,30]. Nevertheless, a delay in crop growth and a decline in yield, especially in glycophytes species, commonly occurs in crops exposed to salinity [31,32,33,34,35], as salinity affects plant physiology through both osmotic and ionic stress [36,37].
However, in some cases salinity can also improve nutritional quality, as observed in several vegetables [38,39].
The effect of salinity stress on hemp can be perceived in various plant development steps triggering alterations in plant morphology, anatomy, and physiology [28].
Since photosynthesis is the primary factor driving plant productivity, many studies documented the deleterious plant responses to excess salinity on the photosynthetic metabolism in numerous crops [40], thus reducing the crop agronomical performance.
An effective tool for studying the photosynthetic metabolism is the measurement of chlorophyll a (Chl a) fluorescence: this method is based on quick non-destructive measurements which can be conveniently used in vivo, as in the field [41,42].
Photosynthesis involves the conversion of light energy into chemical energy, requiring the cooperation of two functional units or photosystems (PSII and PSI) located on the thylakoid membranes of the chloroplasts. Following absorption by the photosynthetic pigments forming the light harvesting complexes or antennae of the photosystems, light energy is transferred to PSII and PSI reaction centers, where it activates the photochemical reactions. However, part of the energy flowing along the antennae is lost as heat (thermal dissipation) or re-emitted as light (fluorescence), before it reaches the reaction center [31,43]. Since the three processes (photochemistry, thermal dissipation and fluorescence) are competing with each other, a variation in one process will result in a modification in the other two. Therefore, although the re-emission as Chl a fluorescence only accounts for a small proportion (3–5%) of the absorbed light, it provides detailed information about the status and functionality of the photosynthetic apparatus [44]. This information gives an insight into the plant physiological response to different environmental stress factors and can be used to predict crop yield or as a guideline to select plants for the breeding programs [41,43,45,46].
When a leaf is kept in the dark for a sufficiently long time, the photosynthetic apparatus turns to its dark-adapted state (DAS) with the reaction centers in the “open” state, ready to receive excitation energy from the antennae pigments and the quinone pool of primary electron acceptors (QA) completely oxidized [41]. Upon illumination with a saturating flash of light, reaction centers are “closed” by the sudden energy flow from the antennae and a fast increase in fluorescence emission from the Chl a molecules occurs, from a minimum (F0) to a maximum (Fm) fluorescence intensity, following a polyphasic induction kinetic referred to as OJIP [47,48]. From the measurement of F0 and Fm, other fluorescence parameters can be calculated, such as Fv/Fm (related to the maximum quantum yield of PSII in DAS) and Fv/F0 (proportional to the activity of the water splitting complex) [49].
Upon continuous illumination, the photosynthetic metabolism reaches a stationary level known as the light adapted state (LAS) with Chl a fluorescence emission at a low steady state level, referred to as Fs. In this light adapted state, illumination with a saturating flash of light induces a peak of fluorescence emission known as F’m. Fluorescence measurements in the LAS allow for the calculation of the ΦPSII parameter (the effective quantum yield of PSII photochemistry), which is related to the “working” efficiency of CO2 assimilation [41,50].
In salt stressed plants, CO2 availability for photosynthesis is reduced due to stomatal closure [51], thus reducing the photochemical electron sink. Besides, PSII activity is also decreased by saline stress due to deleterious ionic effects on the Oxygen Evolving Complex (OEC), while PSI activity is impaired by the dissociation of plastocyanin/cytochrome c553 [52]. Consequently, the whole chain of electron transport is significantly repressed by salinity [31] and this alters the fluorescence parameters, which can therefore be used to monitor the physiological status of the plant.
Recently, biostimulants application in the agriculture sector has drawn rising interest for their ability to improve plant fitness and increase tolerance to biotic and abiotic stresses [53]. Several studies have highlighted the benefits on plant growth and metabolism of biostimulants derived from animal or plant [54], even under environmental stresses, in particular salinity [55]. In this respect, protein hydrolysates (PHs) have gained increasing popularity because of their ability to enhance crop performance, while they have also proved effective in alleviating the deleterious effects of salinity, as well as drought, heavy metals [30,56], and nitrogen deficiency [57,58,59]. Protein hydrolysates are products containing amino acids and peptides (poly- and oligo-peptides), carbohydrates, and small quantities of micronutrients; they are usually obtained by chemical and/or enzymatic hydrolysis of animal or vegetal materials, such as leather by-products, blood meal, fish by-products, chicken feathers, and casein, and legume seeds, alfalfa hay, corn wet-milling, and vegetable by-products [56].
On this basis, we investigated the agronomical performance of Cannabis sativa cv. “Eletta Campana” irrigated with saline water and we tested the application of a PH biostimulant as an approach to overcome/balance salinity impact. The effect of treatments was also investigated at the physiological level, focusing on photosynthesis by means of a Chl a fluorescence analysis.

2. Materials and Methods

2.1. Experimental Setting and Design

The study was conducted in pots with 0.50 m diameter at the “Gussone Park”, Department of Agricultural Sciences in Portici (Naples, Italy; 70 m a.s.l.). The pots were in open field, filled with sandy soil (91.0% sand, 4.5% silt, and 4.5% clay), pH of 6.6, organic matter 2.6%, a total N of 1.1 g kg−1, 127.2 mg kg−1 of P2O5, and 471.8 mg kg−1 of K2O.
The experimental design consisted of a factorial combination of 4 salinity levels of the irrigation solution (non-saline water –EC0, and NaCl solutions at EC 2.0, 4.0 or 6.0 dS m−1, EC2, EC4 and EC6, respectively) combined with 2 biostimulant treatments (untreated -Control or treated with Trainer®, a commercial legume-derived protein hydrolysate -LDPH, made by Italpollina S.p.A., Rivoli Veronese, Italy). The treatments were replicated 3 times and distributed in a randomized complete block design, yielding 24 experimental units (4S × 2B × 3 replicates).

2.2. Crop Management, Saline Irrigation and Biostimulant Application

The crop tested was a food hemp, cultivar “Eletta Campana”, suitable for seeds production. The sowing was made on May 10th at 80 plants per square meter. Only nitrogen was added at the dose of 80 kg ha−1, as ammonium nitrate (26% N), according to ordinary practice.
During the cultivation cycle, pots were irrigated 19 times, restoring completely the water lost by evapotranspiration, calculated by the Hargreaves formula. For all treatments, the first three irrigations were made with tap water; the irrigations with saline solutions started from the first week of July, at the vegetative phase. The amounts of NaCl needed to prepare the saline solutions were according to the formula:
salt ‰ (g salt liter−1) = 0.64 × EC
where EC is the predefined electrical conductivity of the irrigation solution.
The EC of the watering solutions were checked with a conductimeter prior to each irrigation time.
Starting on June 25th, the plants of the LDPH treatments were sprayed with biostimulant four times, at bi-weekly interval, at dose of 3 mL per liter, based on manufacturers recommendations. The legume-derived PH biostimulant produced via enzymatic hydrolysis comprises mainly amino acids and soluble peptides [57]. Rouphael et al. [60] reported the detailed aminogram, the phenolics, flavonoids, and elemental composition of the product.
The harvests were done when the plants were dry but before the seeds fell, from September 27 to October 14.

2.3. Soil Electrical Conductivity Measurements

In each pot five samplings of soil were made at 0–20 cm depth, to monitor electrical conductivity, that was evaluated via a conductimeter Basic 30 CRISON, using 1:5 method. The electrical conductivity was expressed as dS m−1.

2.4. Yield Measurements

At each harvest time, and in each pot, the inflorescences were cut and separated by the residual biomass (male and female stems, and leaves), then both parts of plants were weighed and oven-dried at 70 °C. The following parameters were determined: seeds production, expressed as kg m−2, 1000 seeds weight (g), number of seeds per plant, production of residual biomass, average fresh weight of female stems, plants height, and harvest index, calculated as the ratio between seeds dry weight and biomass dry weight.

2.5. Chlorophyll Fluorescence Measurements

Chlorophyll a fluorescence measurements were performed in the second decade of September 2019, when plants were in the pre-flowering/early-flowering phase.
Fluorescence measurements were recorded in the field on intact leaves, randomly sampled among the top 3 fully expanded young leaves of each plant, using a PAR-FluorPen FP 110/D portable fluorimeter (Photon Systems Instruments, Drásov, Czech Republic) equipped with detachable leaf-clips. Ten replicate measurements for each experimental treatment were taken between 09:00–10:00 (Central European Summer Time) for the morning measurements and between 13:30–14:30 for the mid-day measurements. Every single measurement in the DAS or in the LAS was made on a different leaf. For the fluorescence readings in the DAS, the leaves were previously dark adapted for 30 min using the fluorimeter leaf clips. Following dark adaptation, Chl a fluorescence was induced by the internal LED blue light (455 nm), producing a saturating light pulse of 2400 µmol photons m−2 s−1 and the fast rise of chlorophyll fluorescence was recorded using the fluorimeter OJIP protocol. Chlorophyll fluorescence measurements in the LAS were taken with the QY protocol of the Fluorpen.
Absolute values of chlorophyll a fluorescence intensity (Fo and Fm in the DAS or F’m and Fs in the LAS) are given in arbitrary units (a.u.), while Fv/Fm, Fv/F0 and ΦPSII are dimensionless ratios, calculated as follows by the FluorPen software ver. 1.1 (Photon Systems Instruments, Drásov, Czech Republic) [42]:
Fv/Fm = (Fm − F0)/Fm
Fv/F0 = (Fm − F0)/F0
ΦPSII = (F’m − Fs)/F’m
Fluorescence data acquired with the FluorPen software were further analyzed using MS Excel 365.

2.6. Statistics

Agronomic and physiological data set were subjected to statistical analysis using the SPSS software package (SPSS version 22, Chicago, IL, USA), through GLM (General Linear Model). The source of variance effect was appraised by applying two-way ANOVA and three-way ANOVA for agronomic and physiological data, respectively. Multiple comparison of means was performed by using the Duncan Test.

3. Results

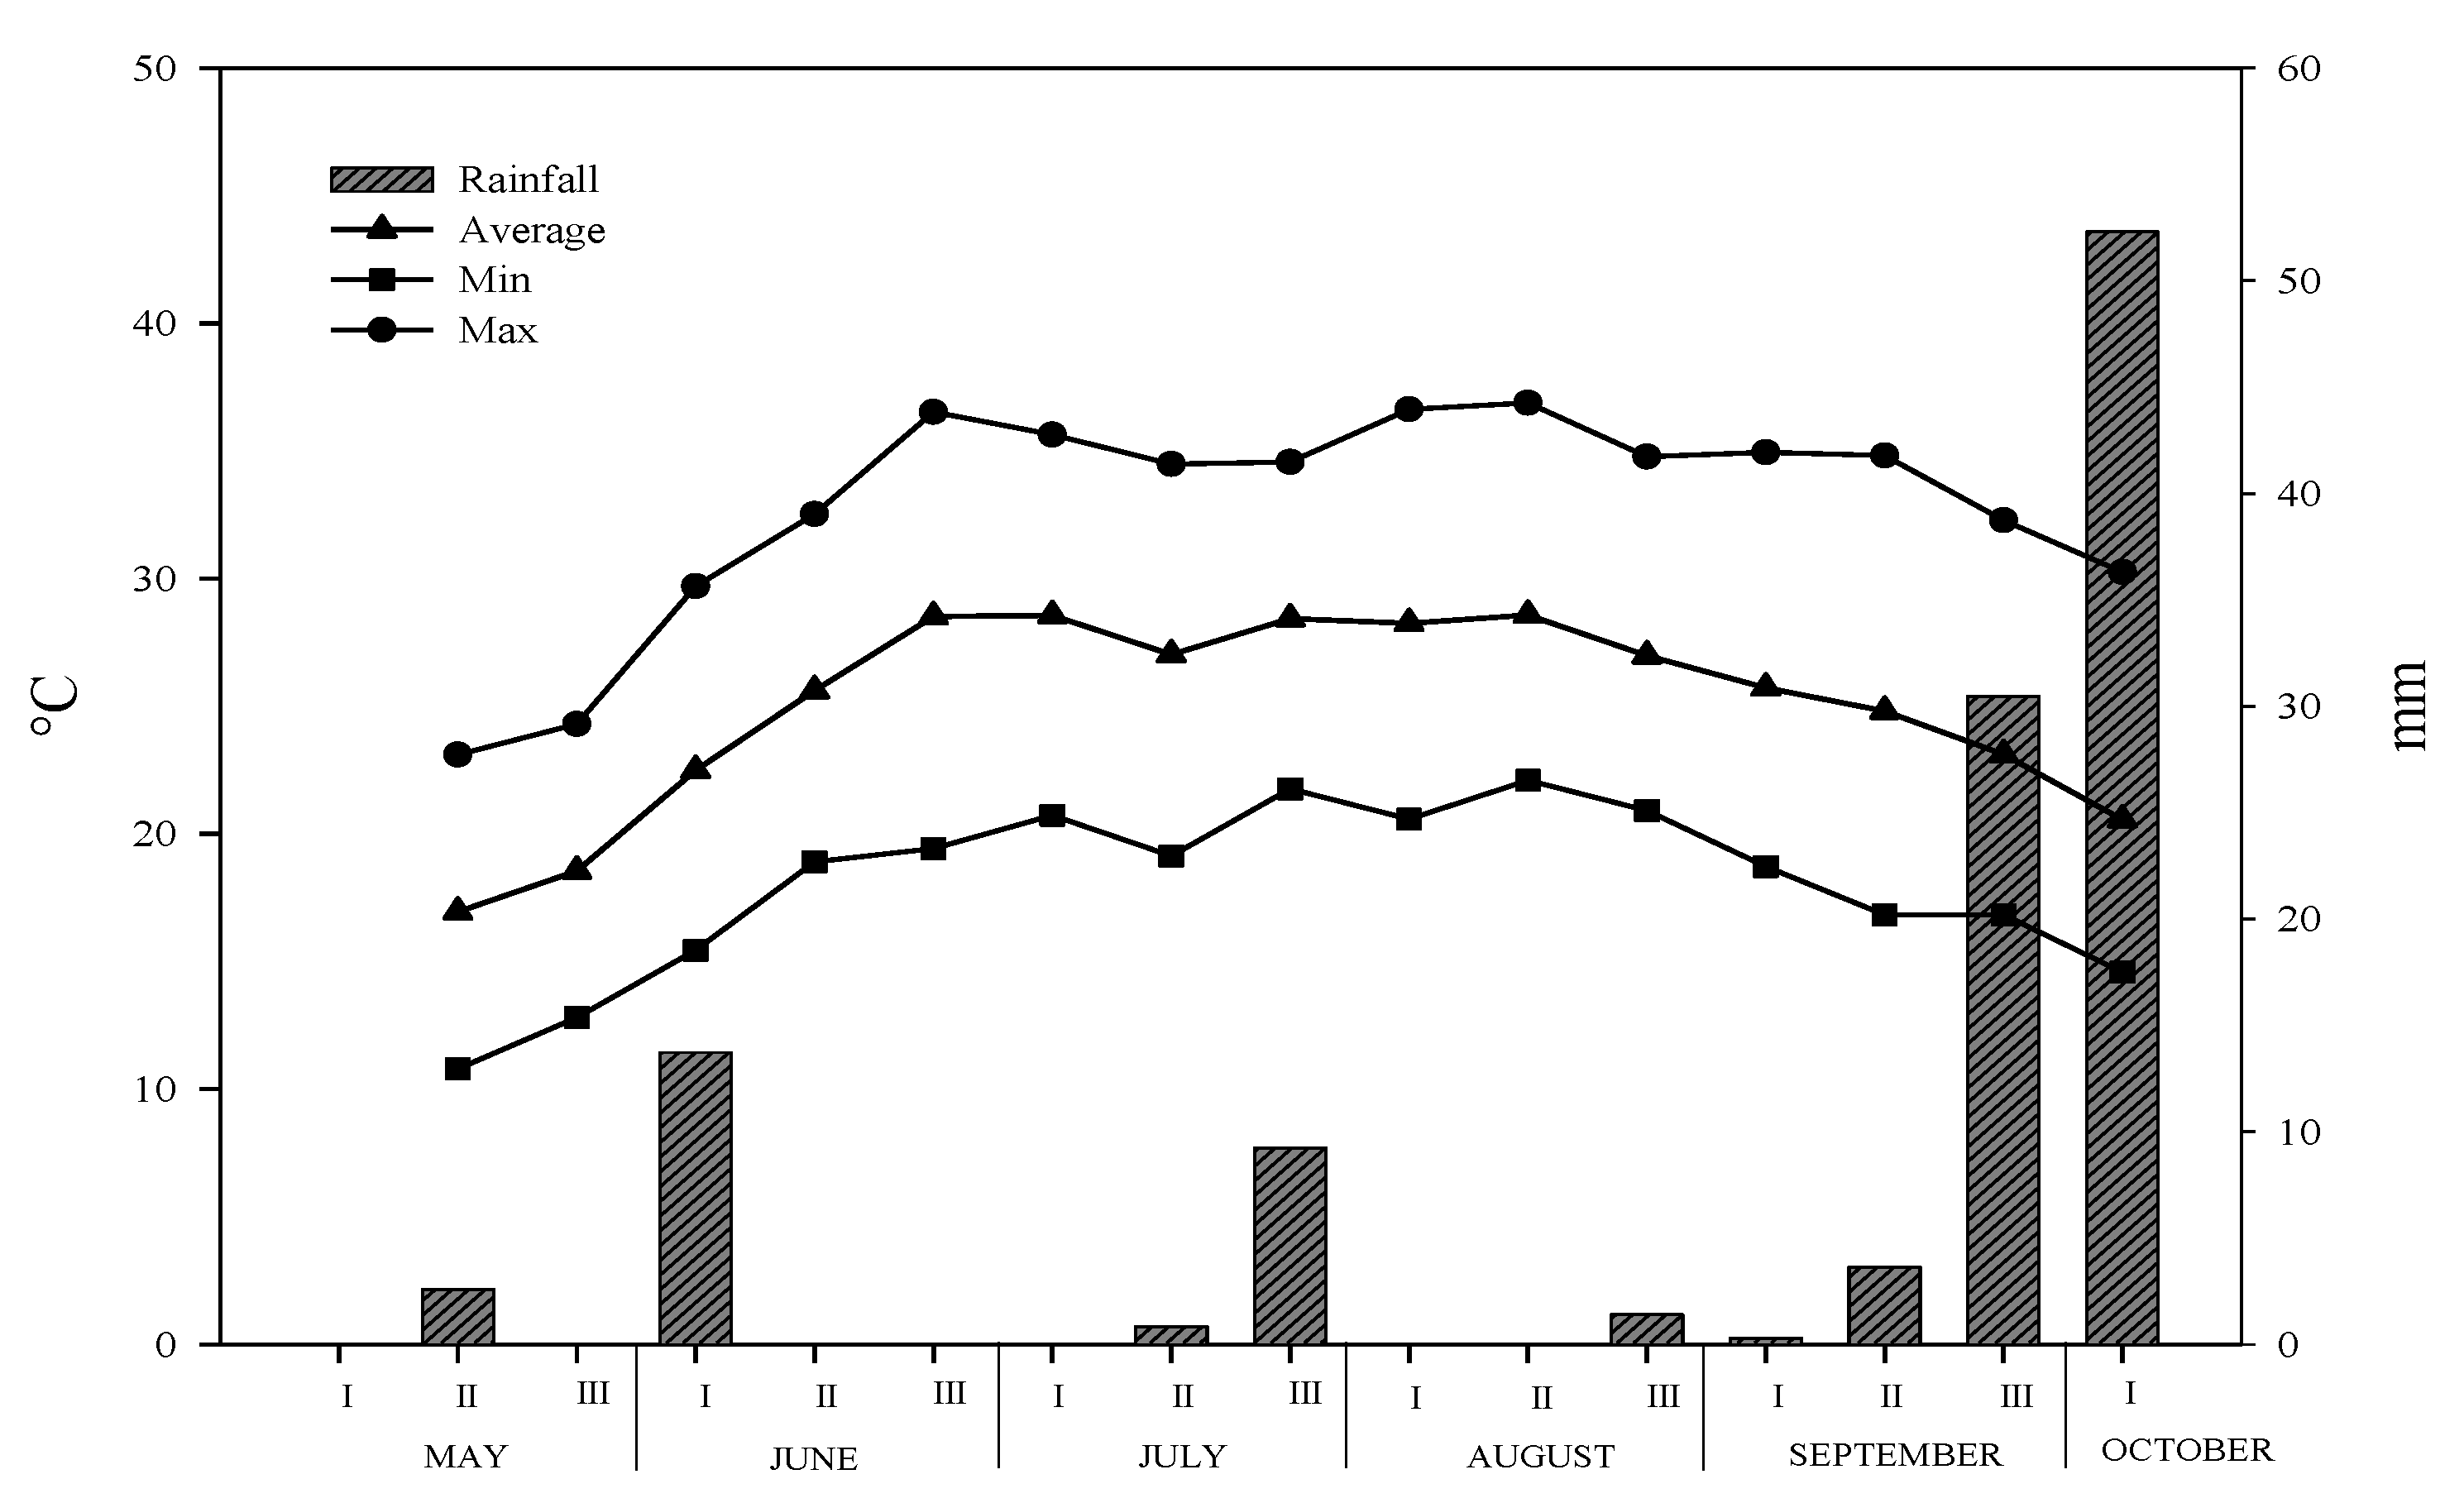
3.1. Climate Characteristics of Experimental Site

The climate characteristics of experimental site during the crop growing period is reported in Figure 1. A typical trend of Mediterranean area was observed, with the maximum temperatures over 35 °C from the end of June to the end of August. In the same period, also the minimum temperatures were not under 20 °C. The total rainfall was 114.5 mm, of which about 70% was concentrated in the third decade of September and the first of October.

3.2. Electrical Conductivity of Soil

Through the crop cycle the electrical conductivity of soil increased when the saline stress level increased: the saline treatments were significantly different between them and from EC0, starting from the end of July and until the end of August. Then this value decreased already in the sampling of the end of September and more again after the last harvest. On the average of the cycle, the all treatments were significantly different (Table 1).

3.3. Seeds Production and Its Parameters

The effect of interaction between the saline water stress and biostimulant application on the seeds production was found and it was reported in Figure 2. The seeds production always decreased at the increase of water salinity, but for treated plants, it linearly decreased at a rate of −0.0074 per each dS m−1 of water salinity, instead in control plants (untreated) the line that best fit the yield decrease was exponential. The plants sprayed by LDPH always reached higher values than the untreated control plants, with an average increase of 38.6% over control production. Interestingly, the EC2 plants treated with biostimulant had a seeds production similar to the EC0 control plant. Similarly, the yield recorded in EC4 treatment sprayed with biostimulant was not significantly different compared to EC2 control plants. However, under severe salt stress conditions (EC6) there were no differences between biostimulant and untreated treatments.
For hemp yield parameters (number of seeds per plant, seeds average weight, and percentage of seeds weight on inflorescence weight) the main effects of water salinity and biostimulant application were observed; the data have been reported in Table 2. The seeds average weight and the seeds number were negatively affected by increasing saline stress from fresh water to water at 6 dS m−1. Interestingly, both parameters were boosted by biostimulant application, that elicited 25.3% and 15.4% increase, for number of seeds per plant and average seeds weight, respectively (Table 2). Instead, the percentage by weight of seeds on inflorescences reached the highest value in EC6 plants, without differences between the other treatments.

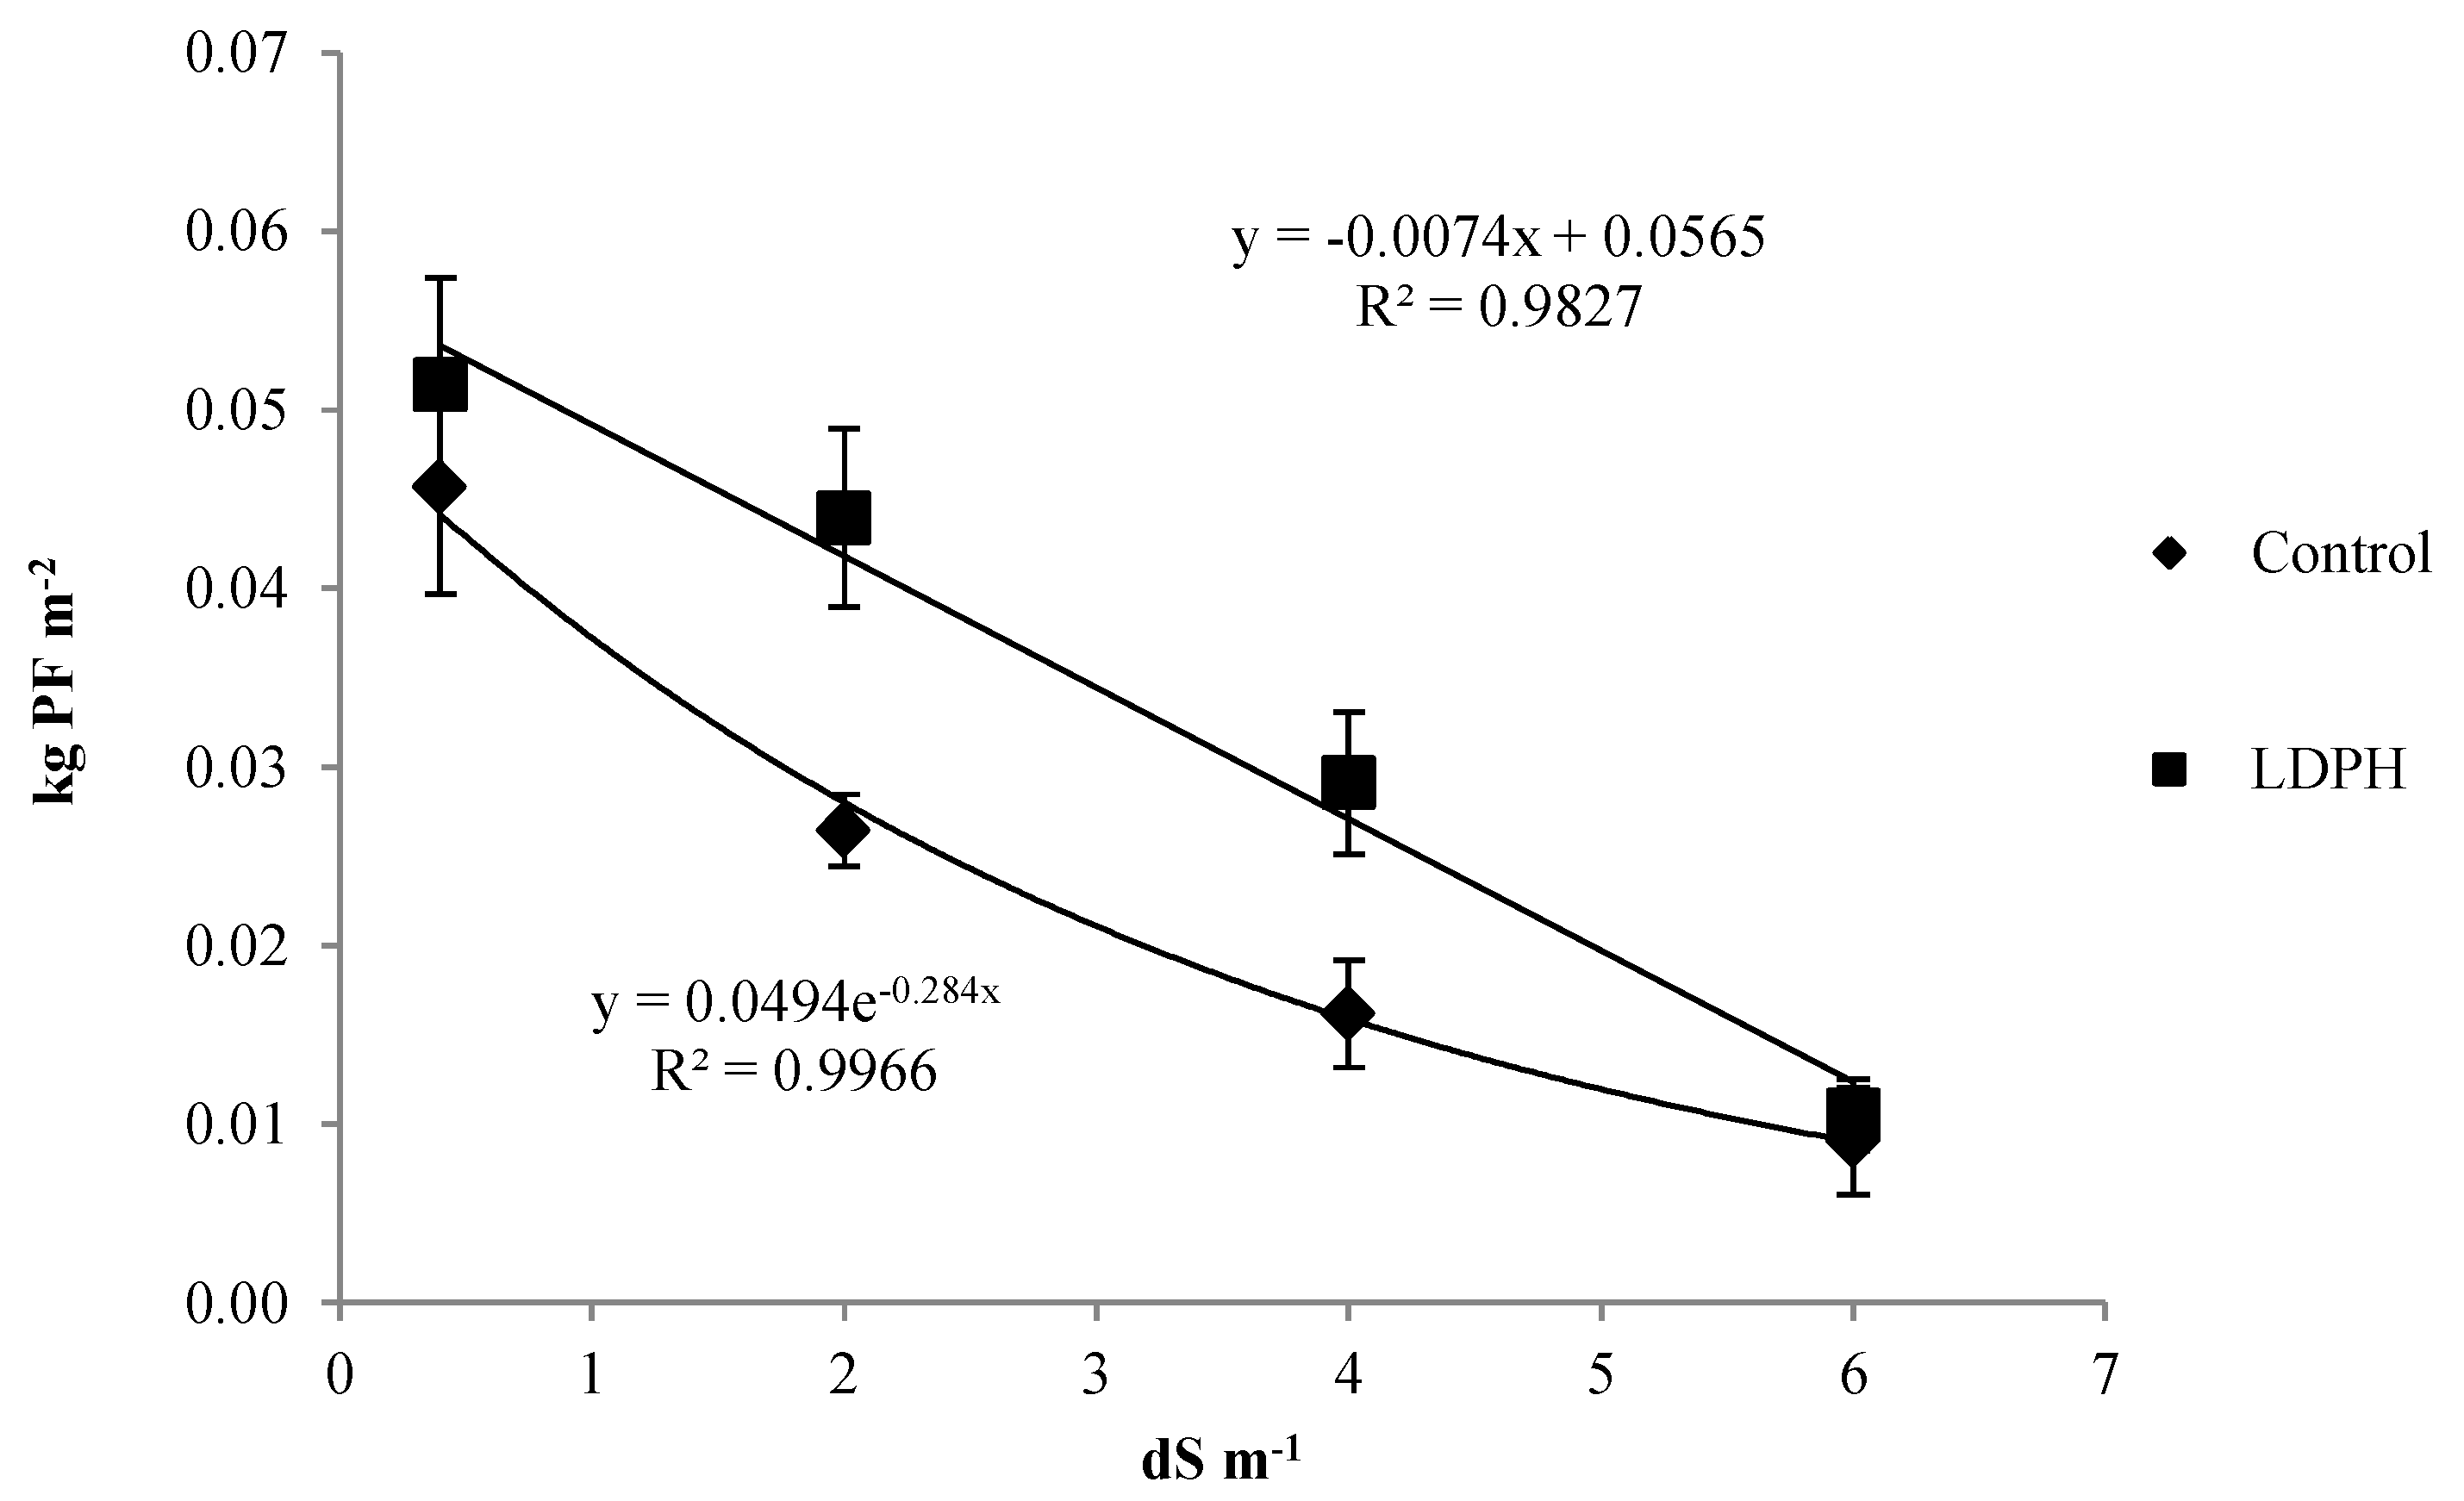
3.4. Residual Biomass and Its Parameters

The results regarding the residual biomass (male and female stems, and leaves), plants height, average weight of female plants and harvest index are reported in Table 3. Again, only the main effects of the two experimental factors were observed. All parameters decreased when the saline stress increased, but with different trends: the most stressed treatment showed always the lowest value, except for plants height, when it was no statistically different from the other saline treatments. The legume derived-PH application significantly also boosted residual biomass, average weight of female stems, and plants height, 33.3%, 32.2% and 13.6%, respectively.

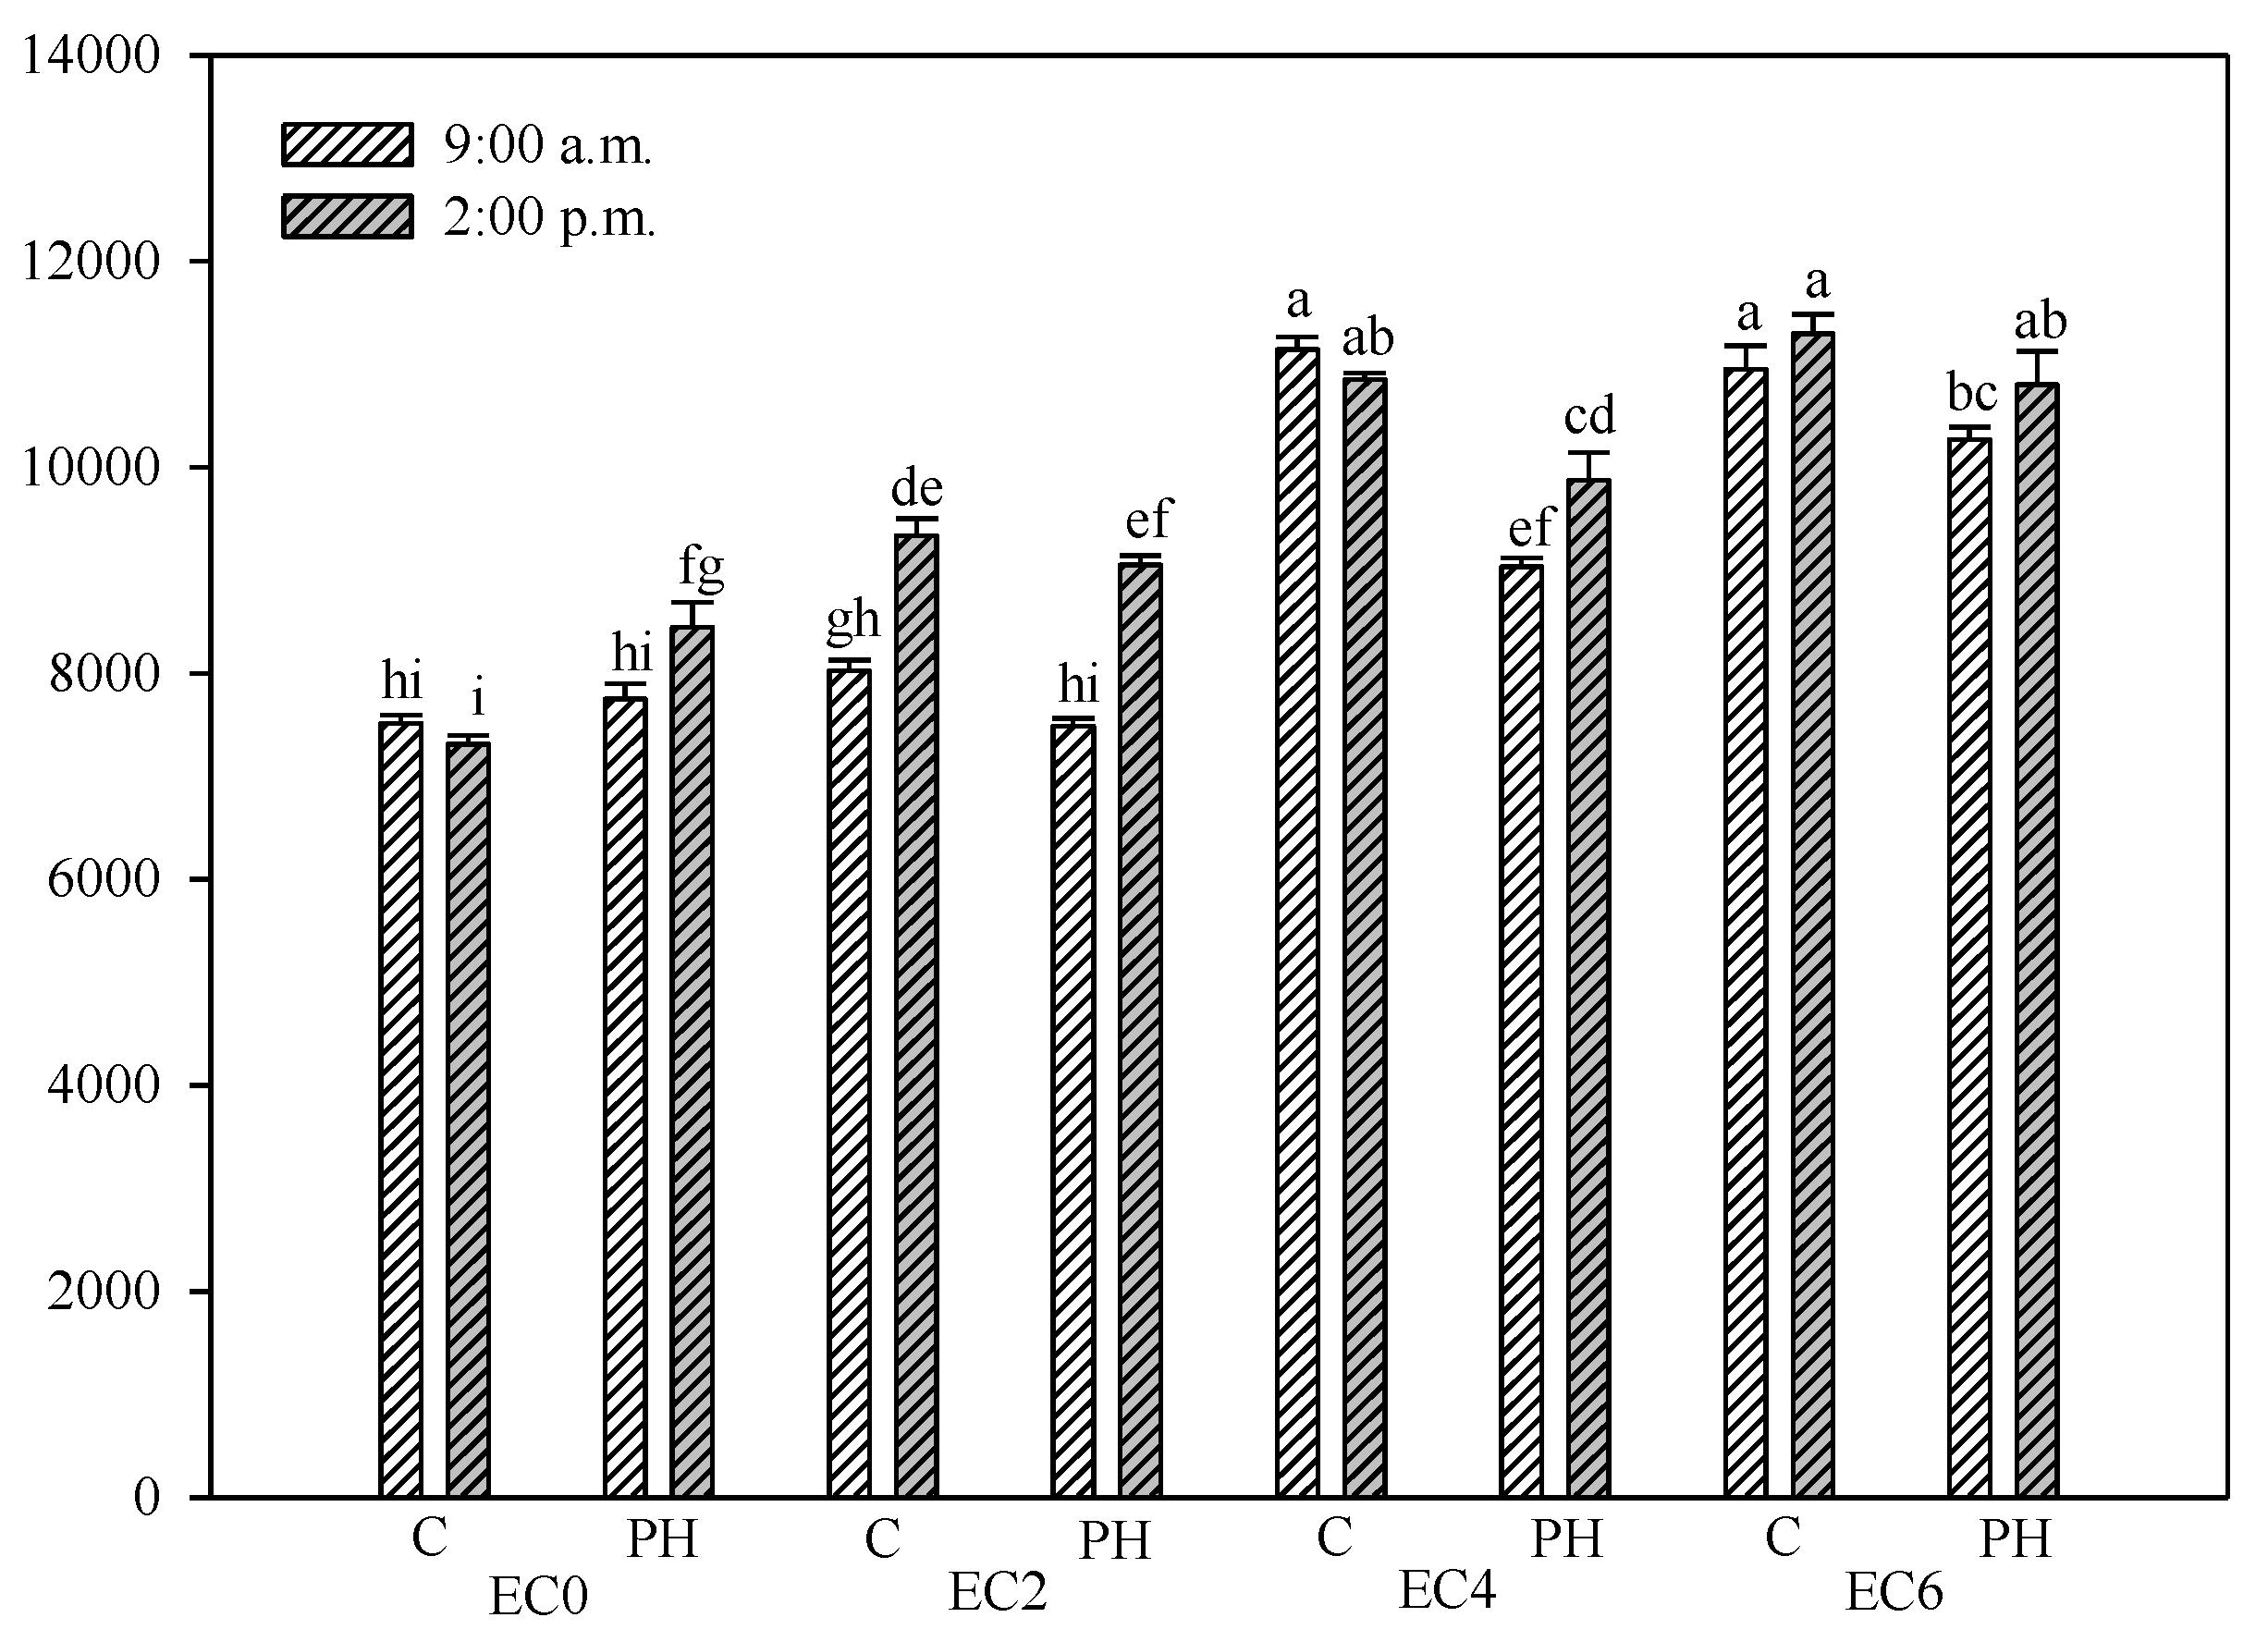
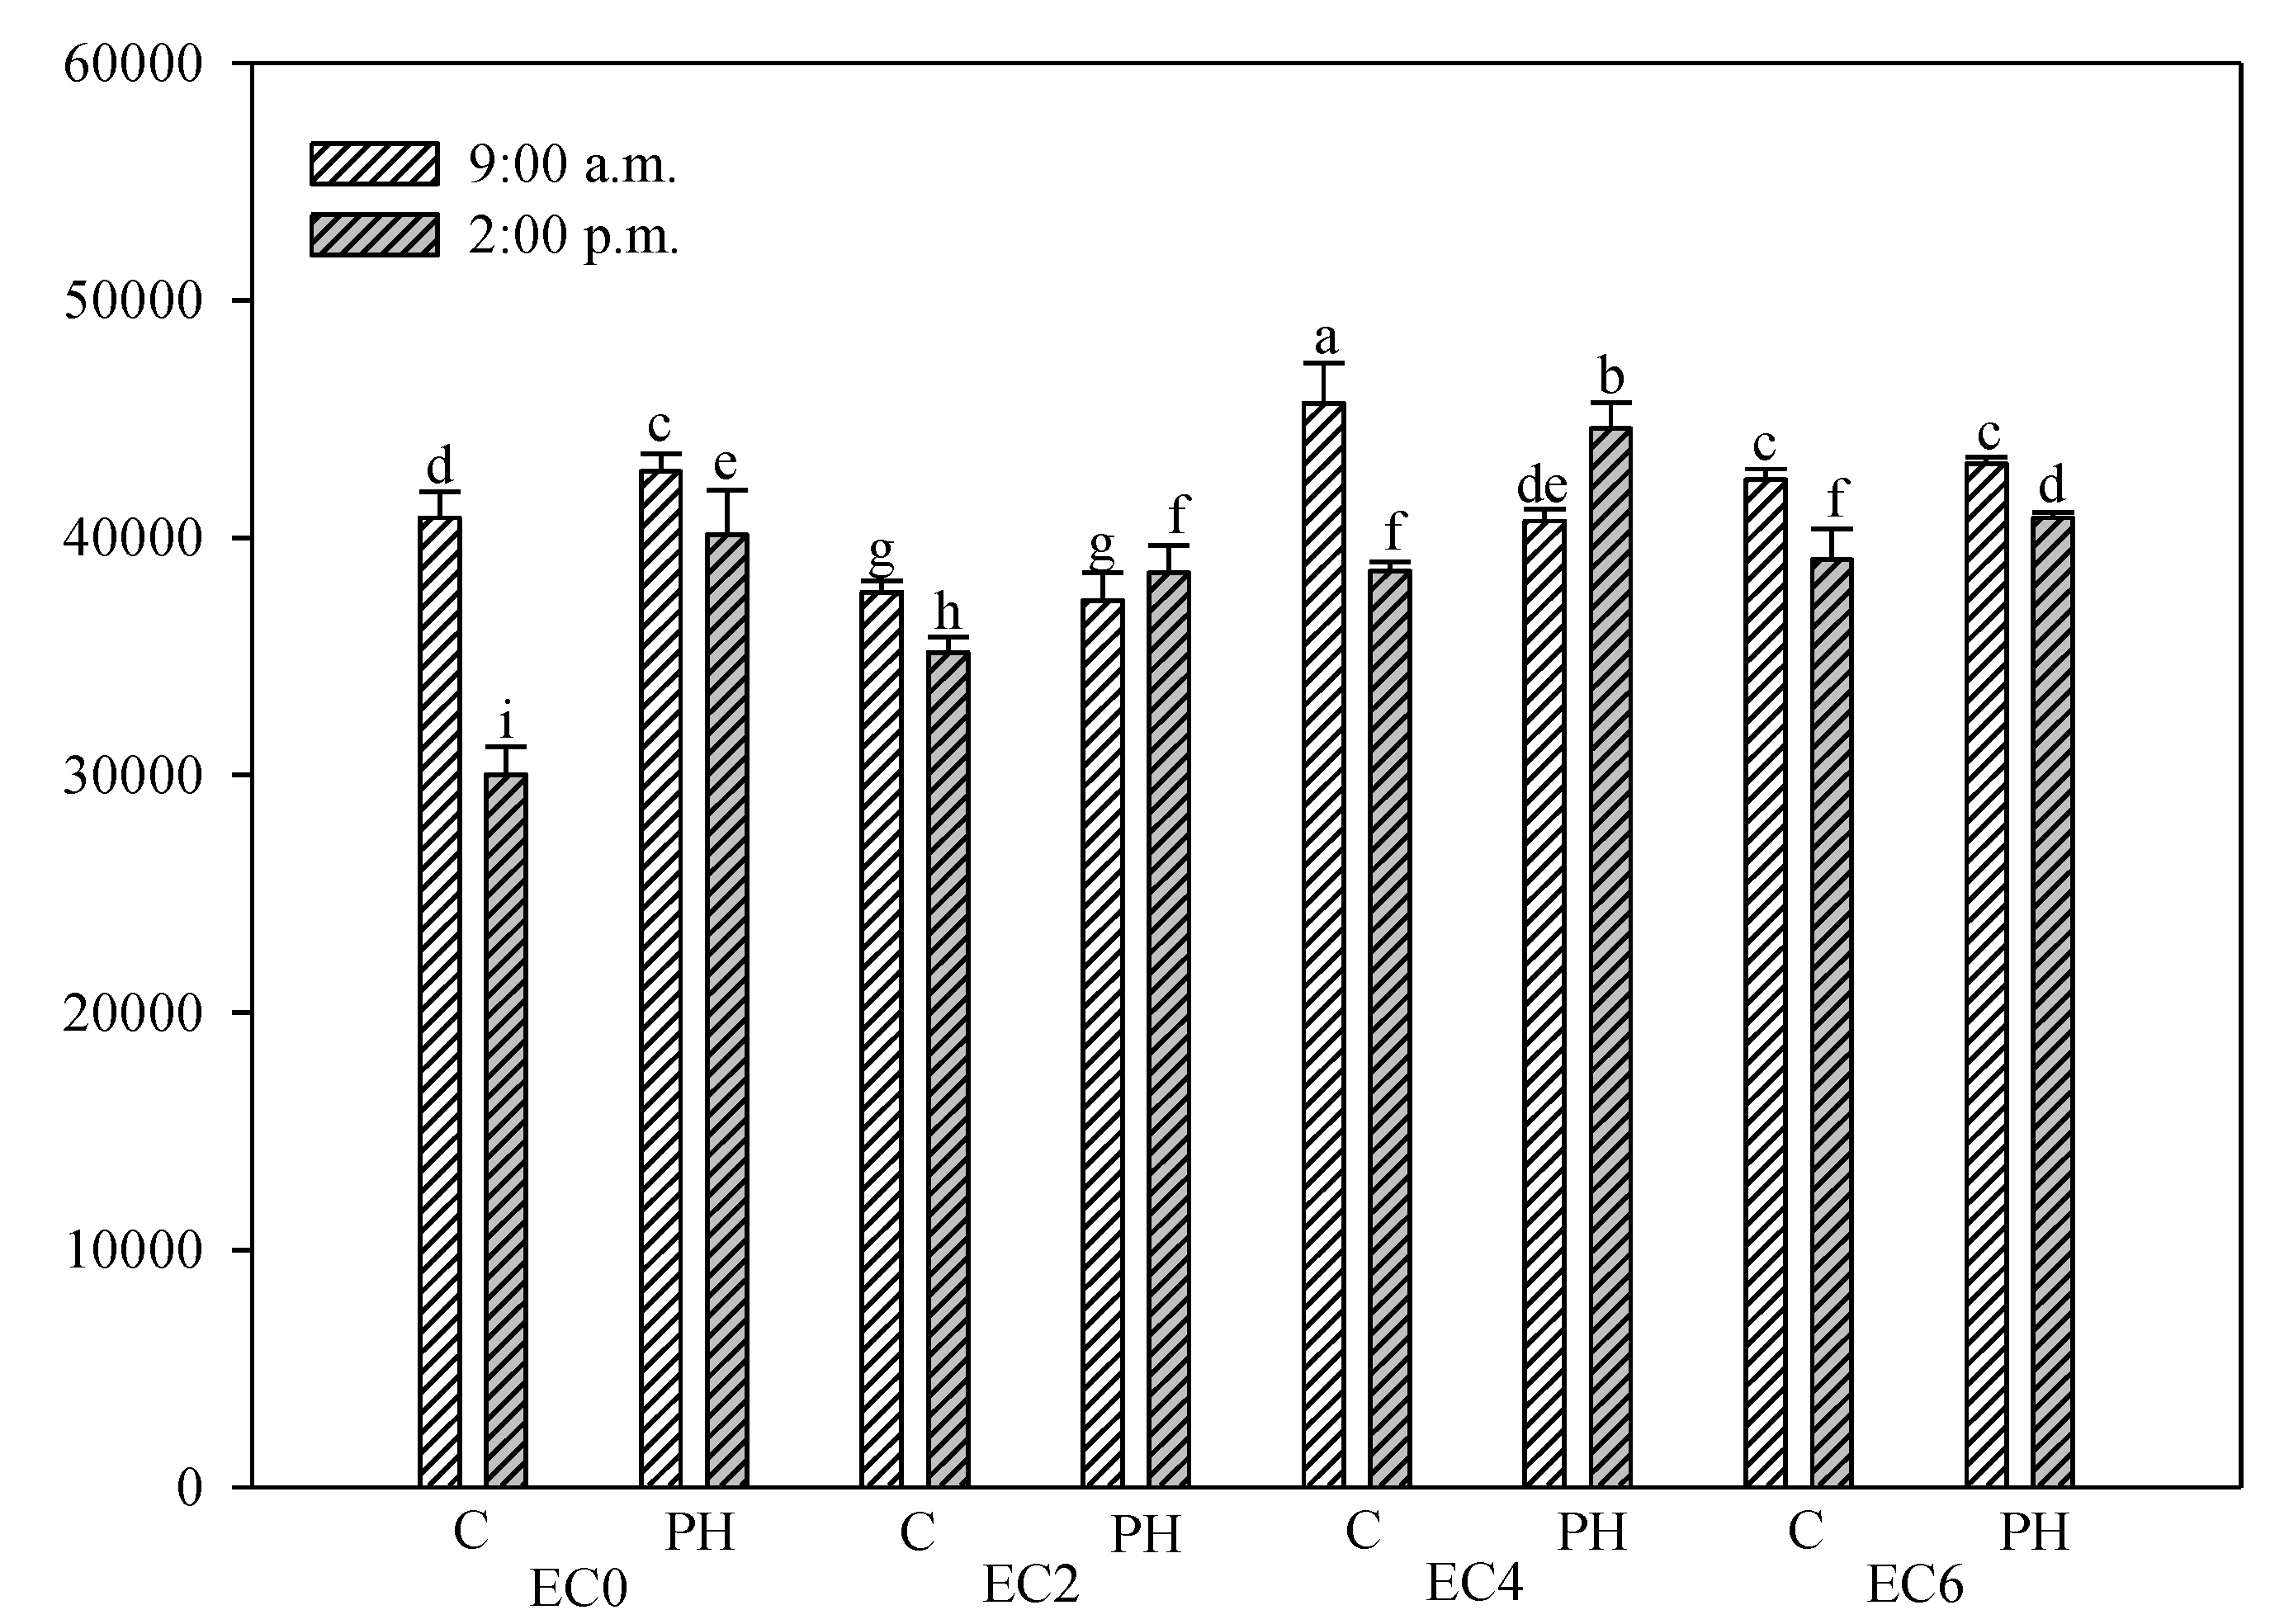
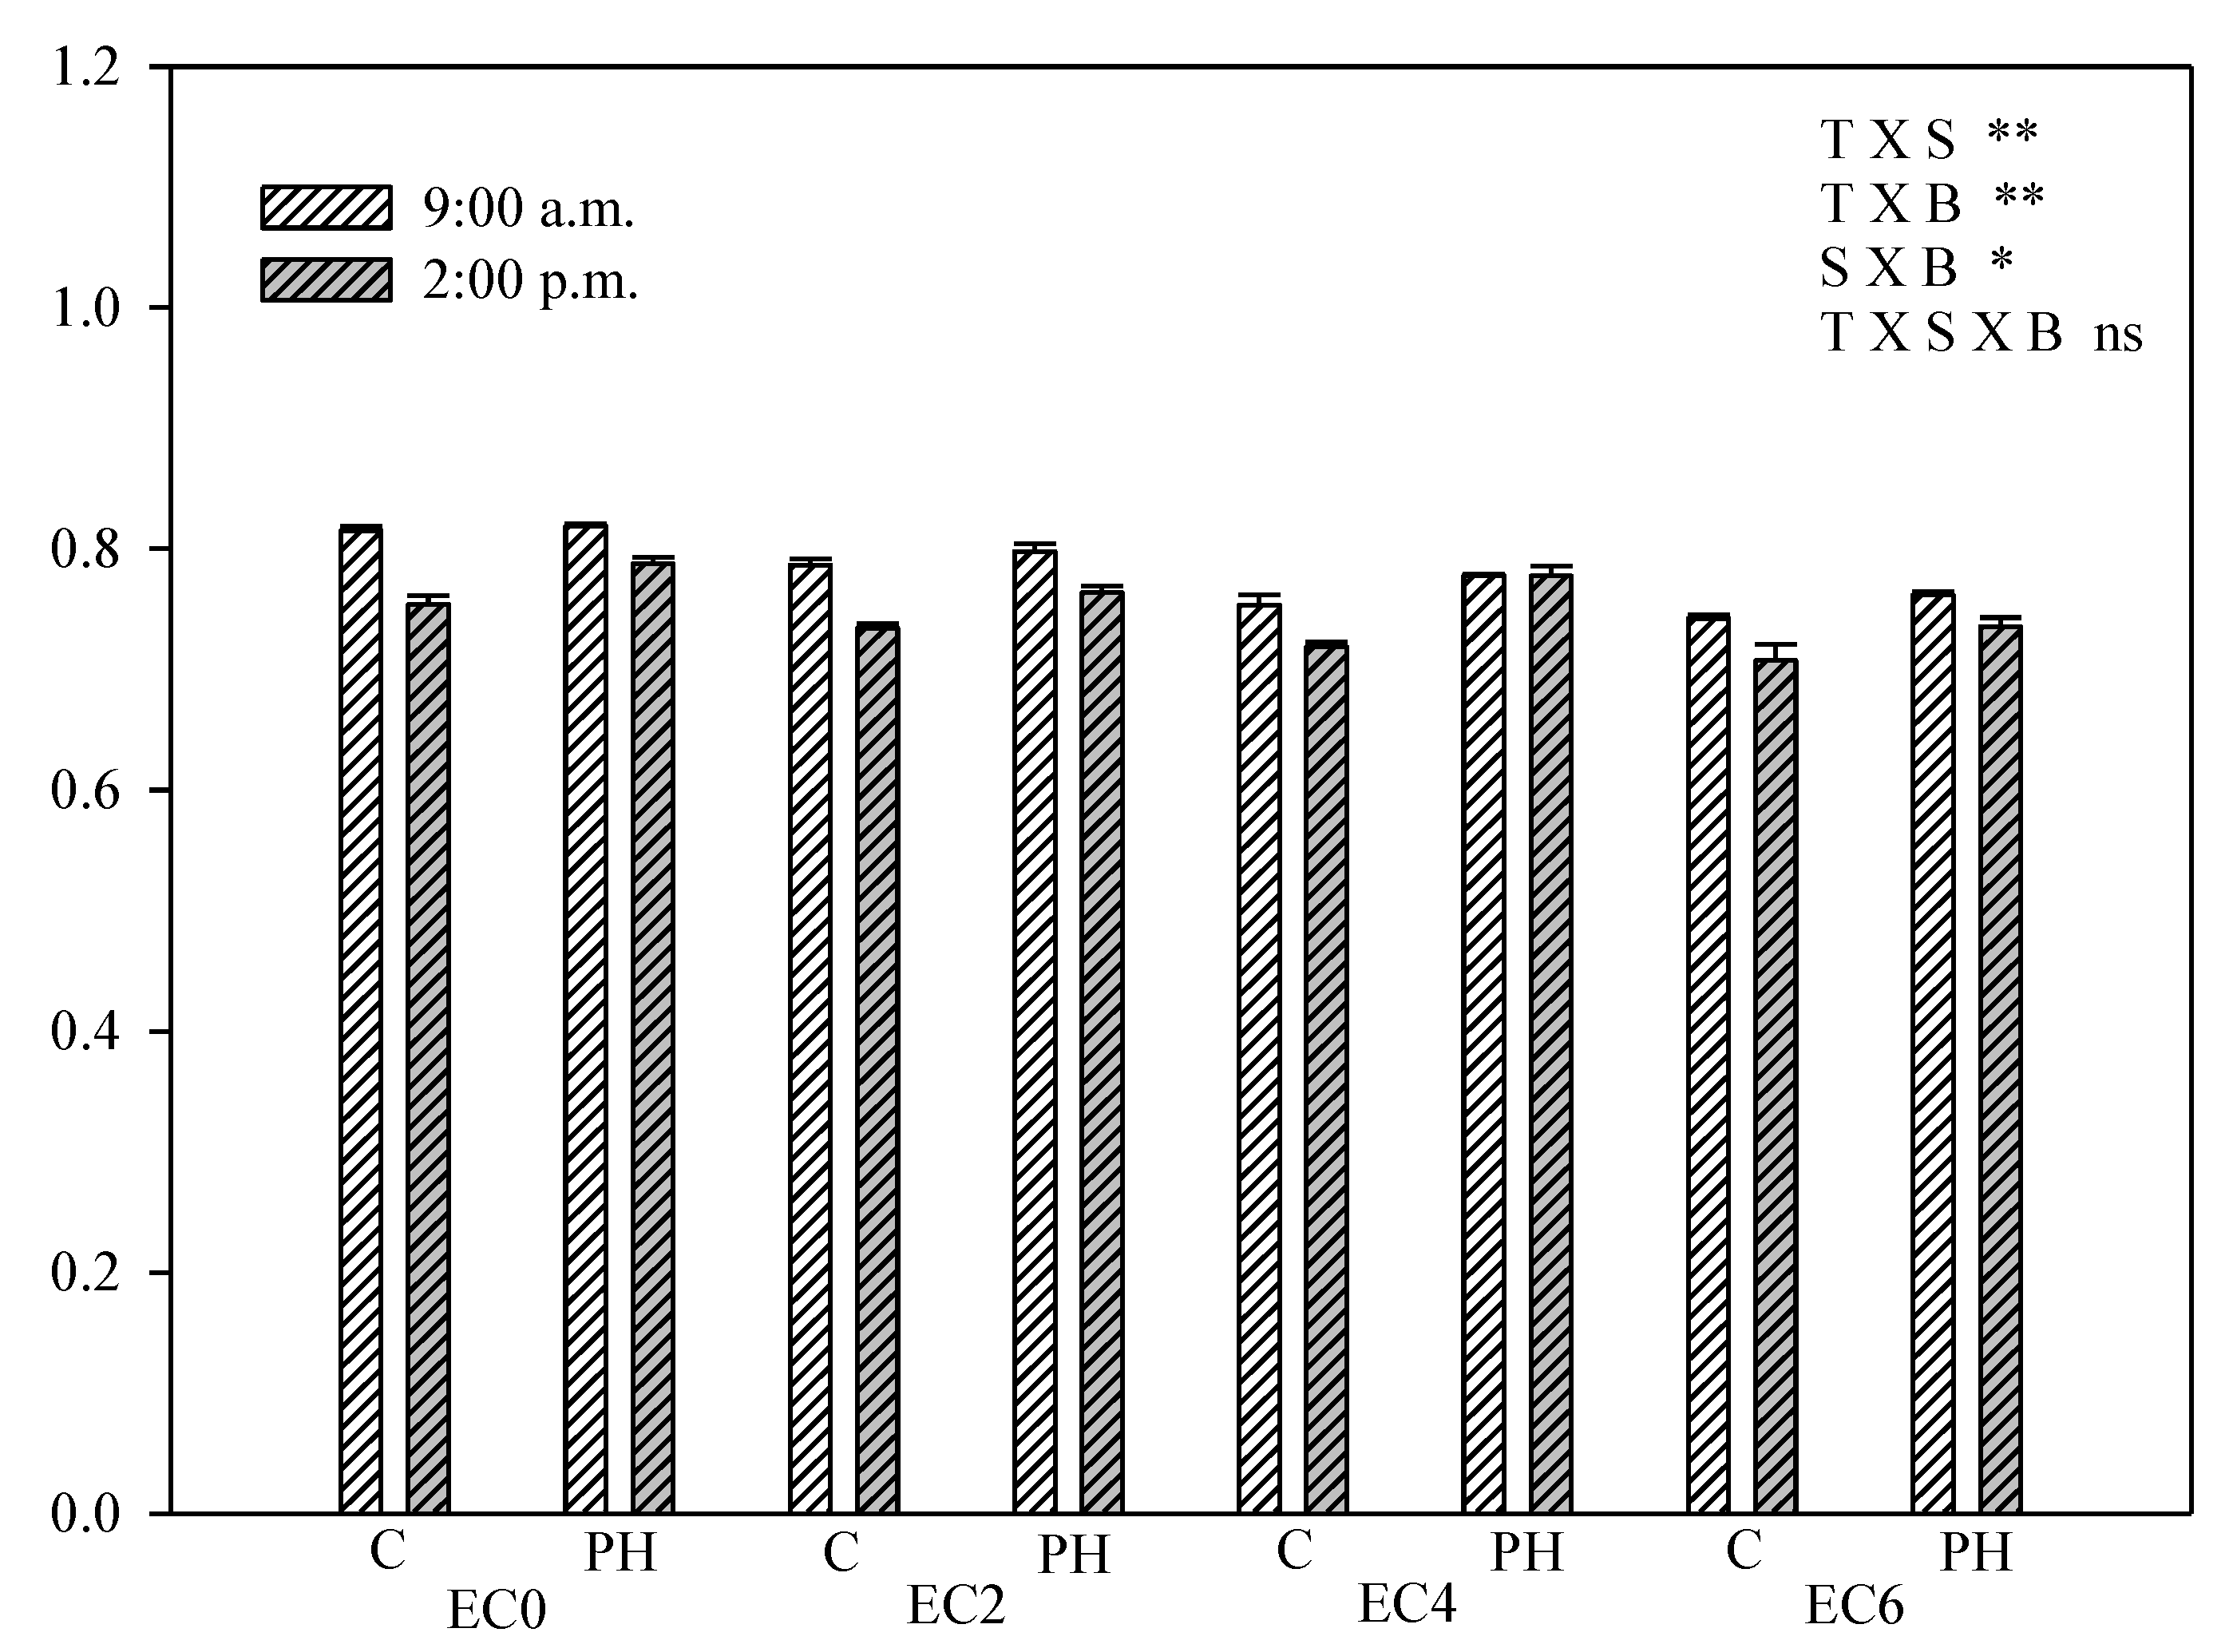
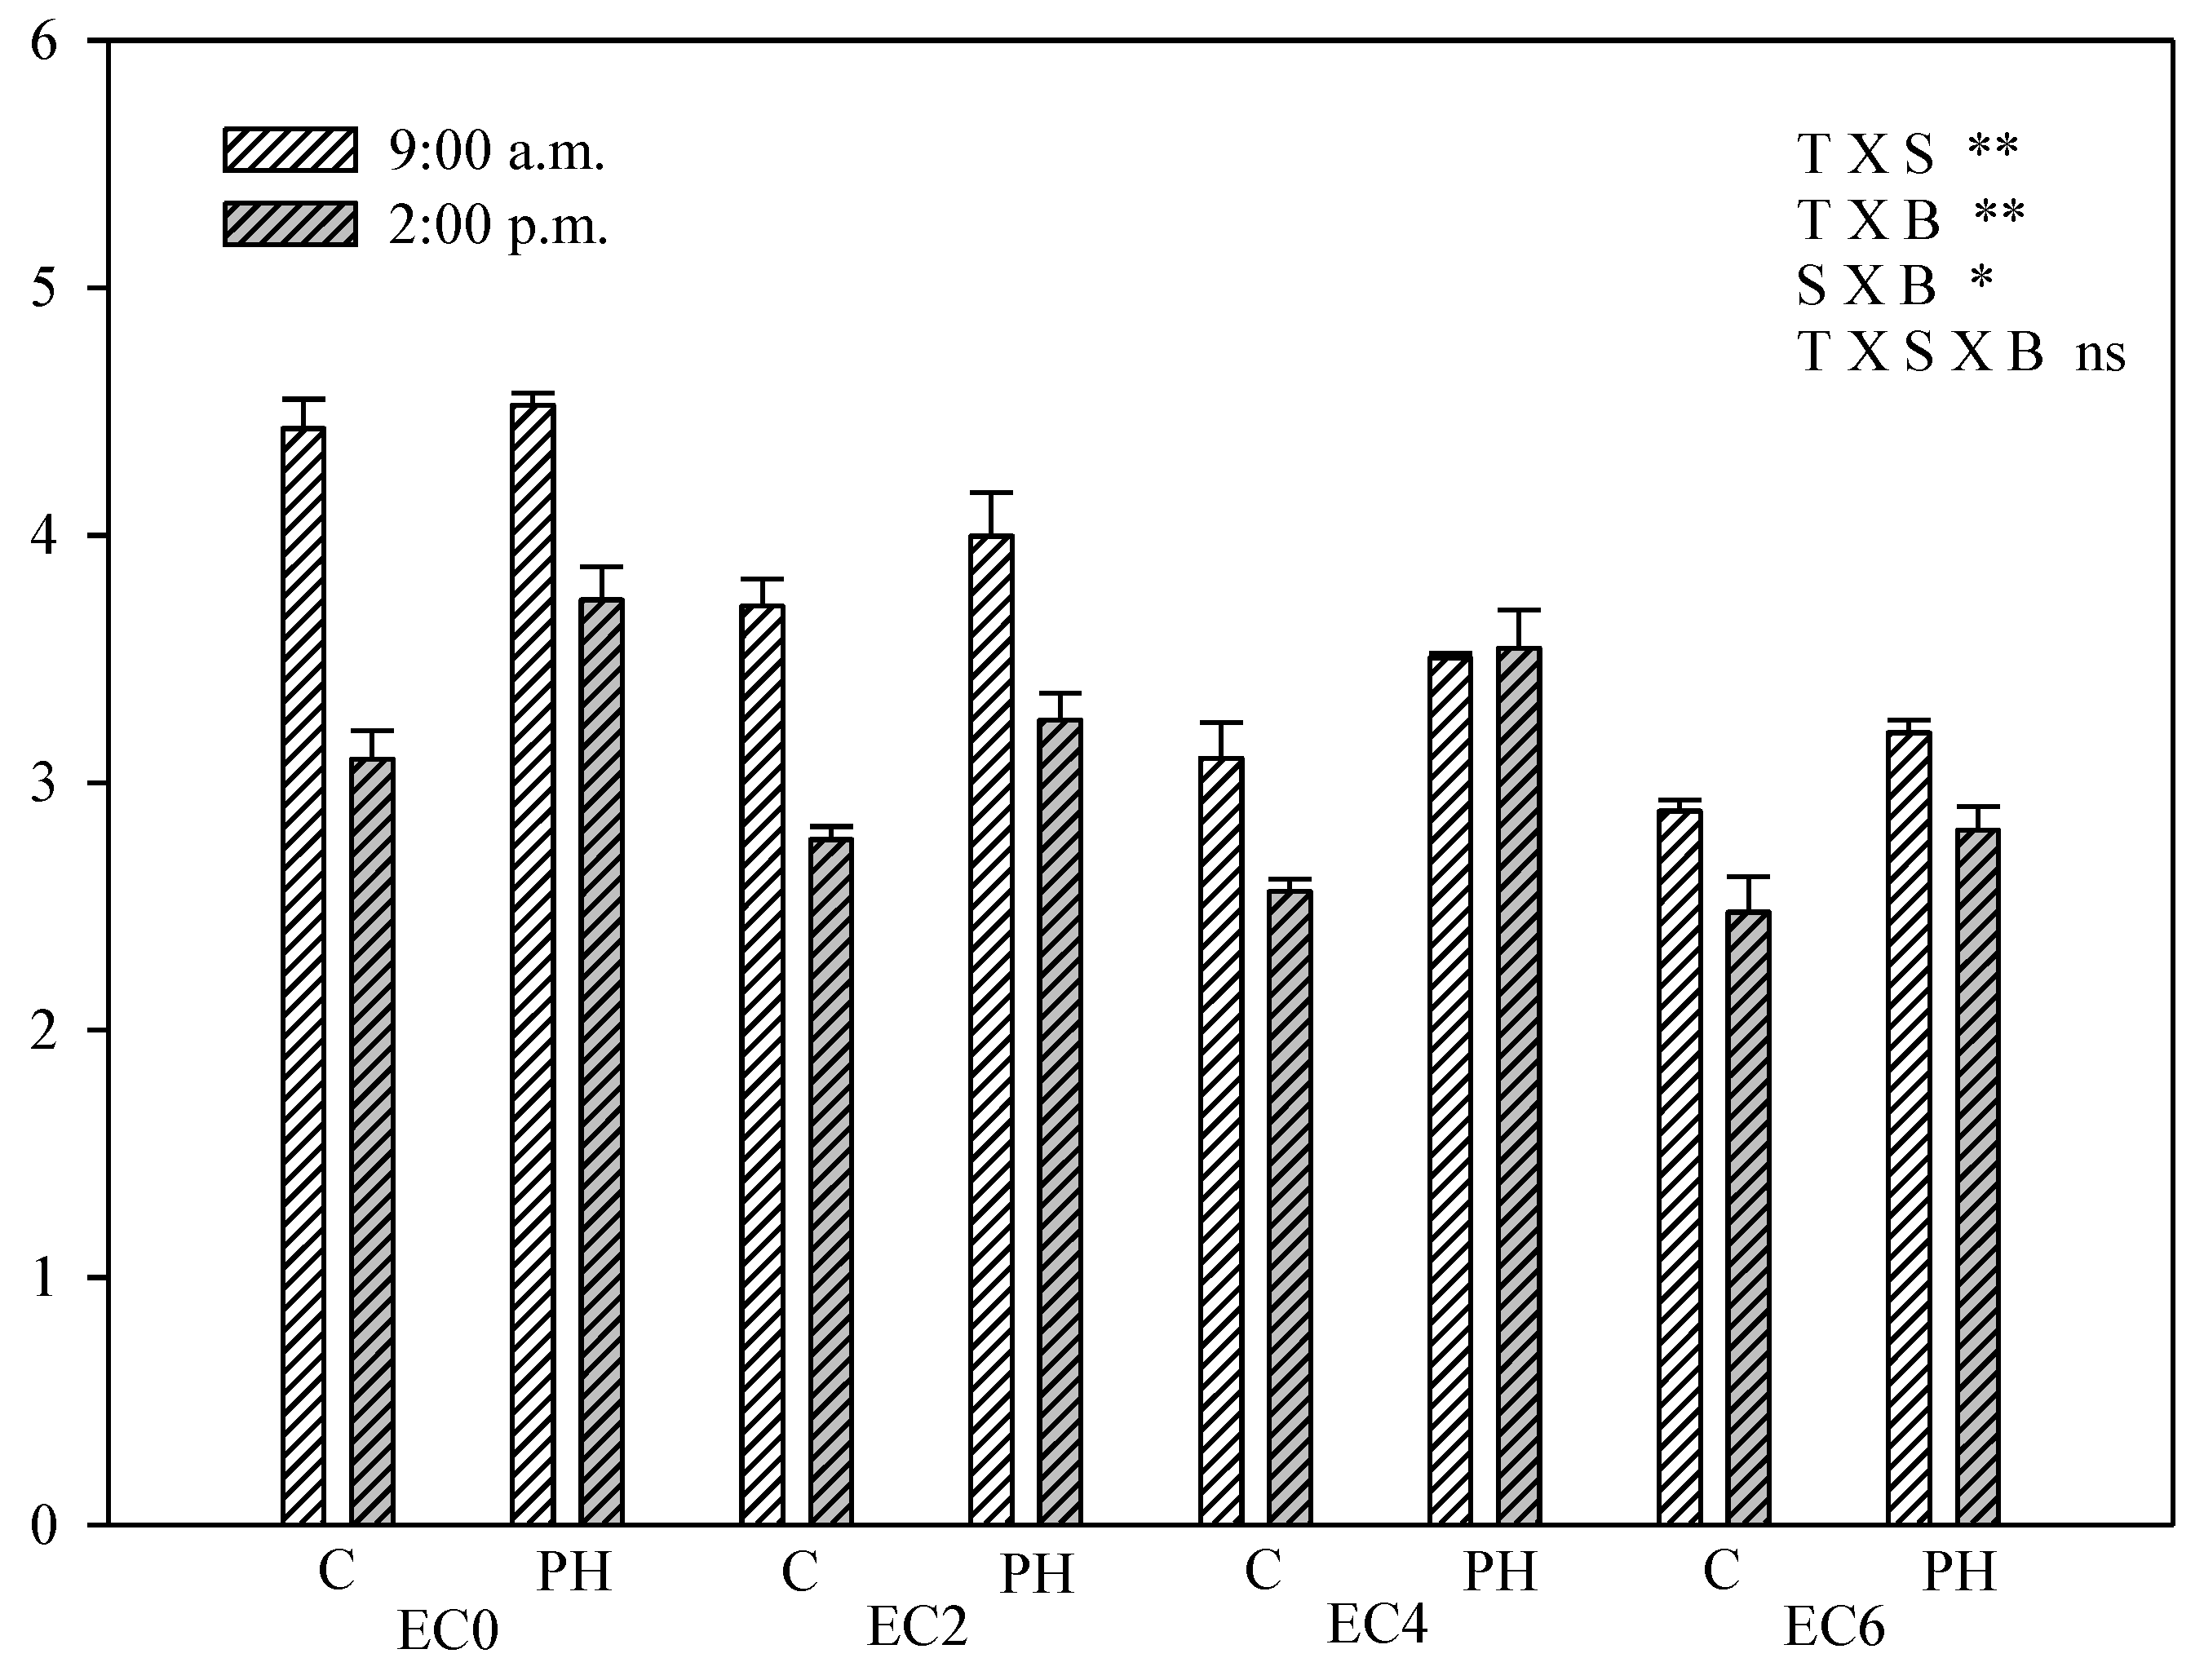
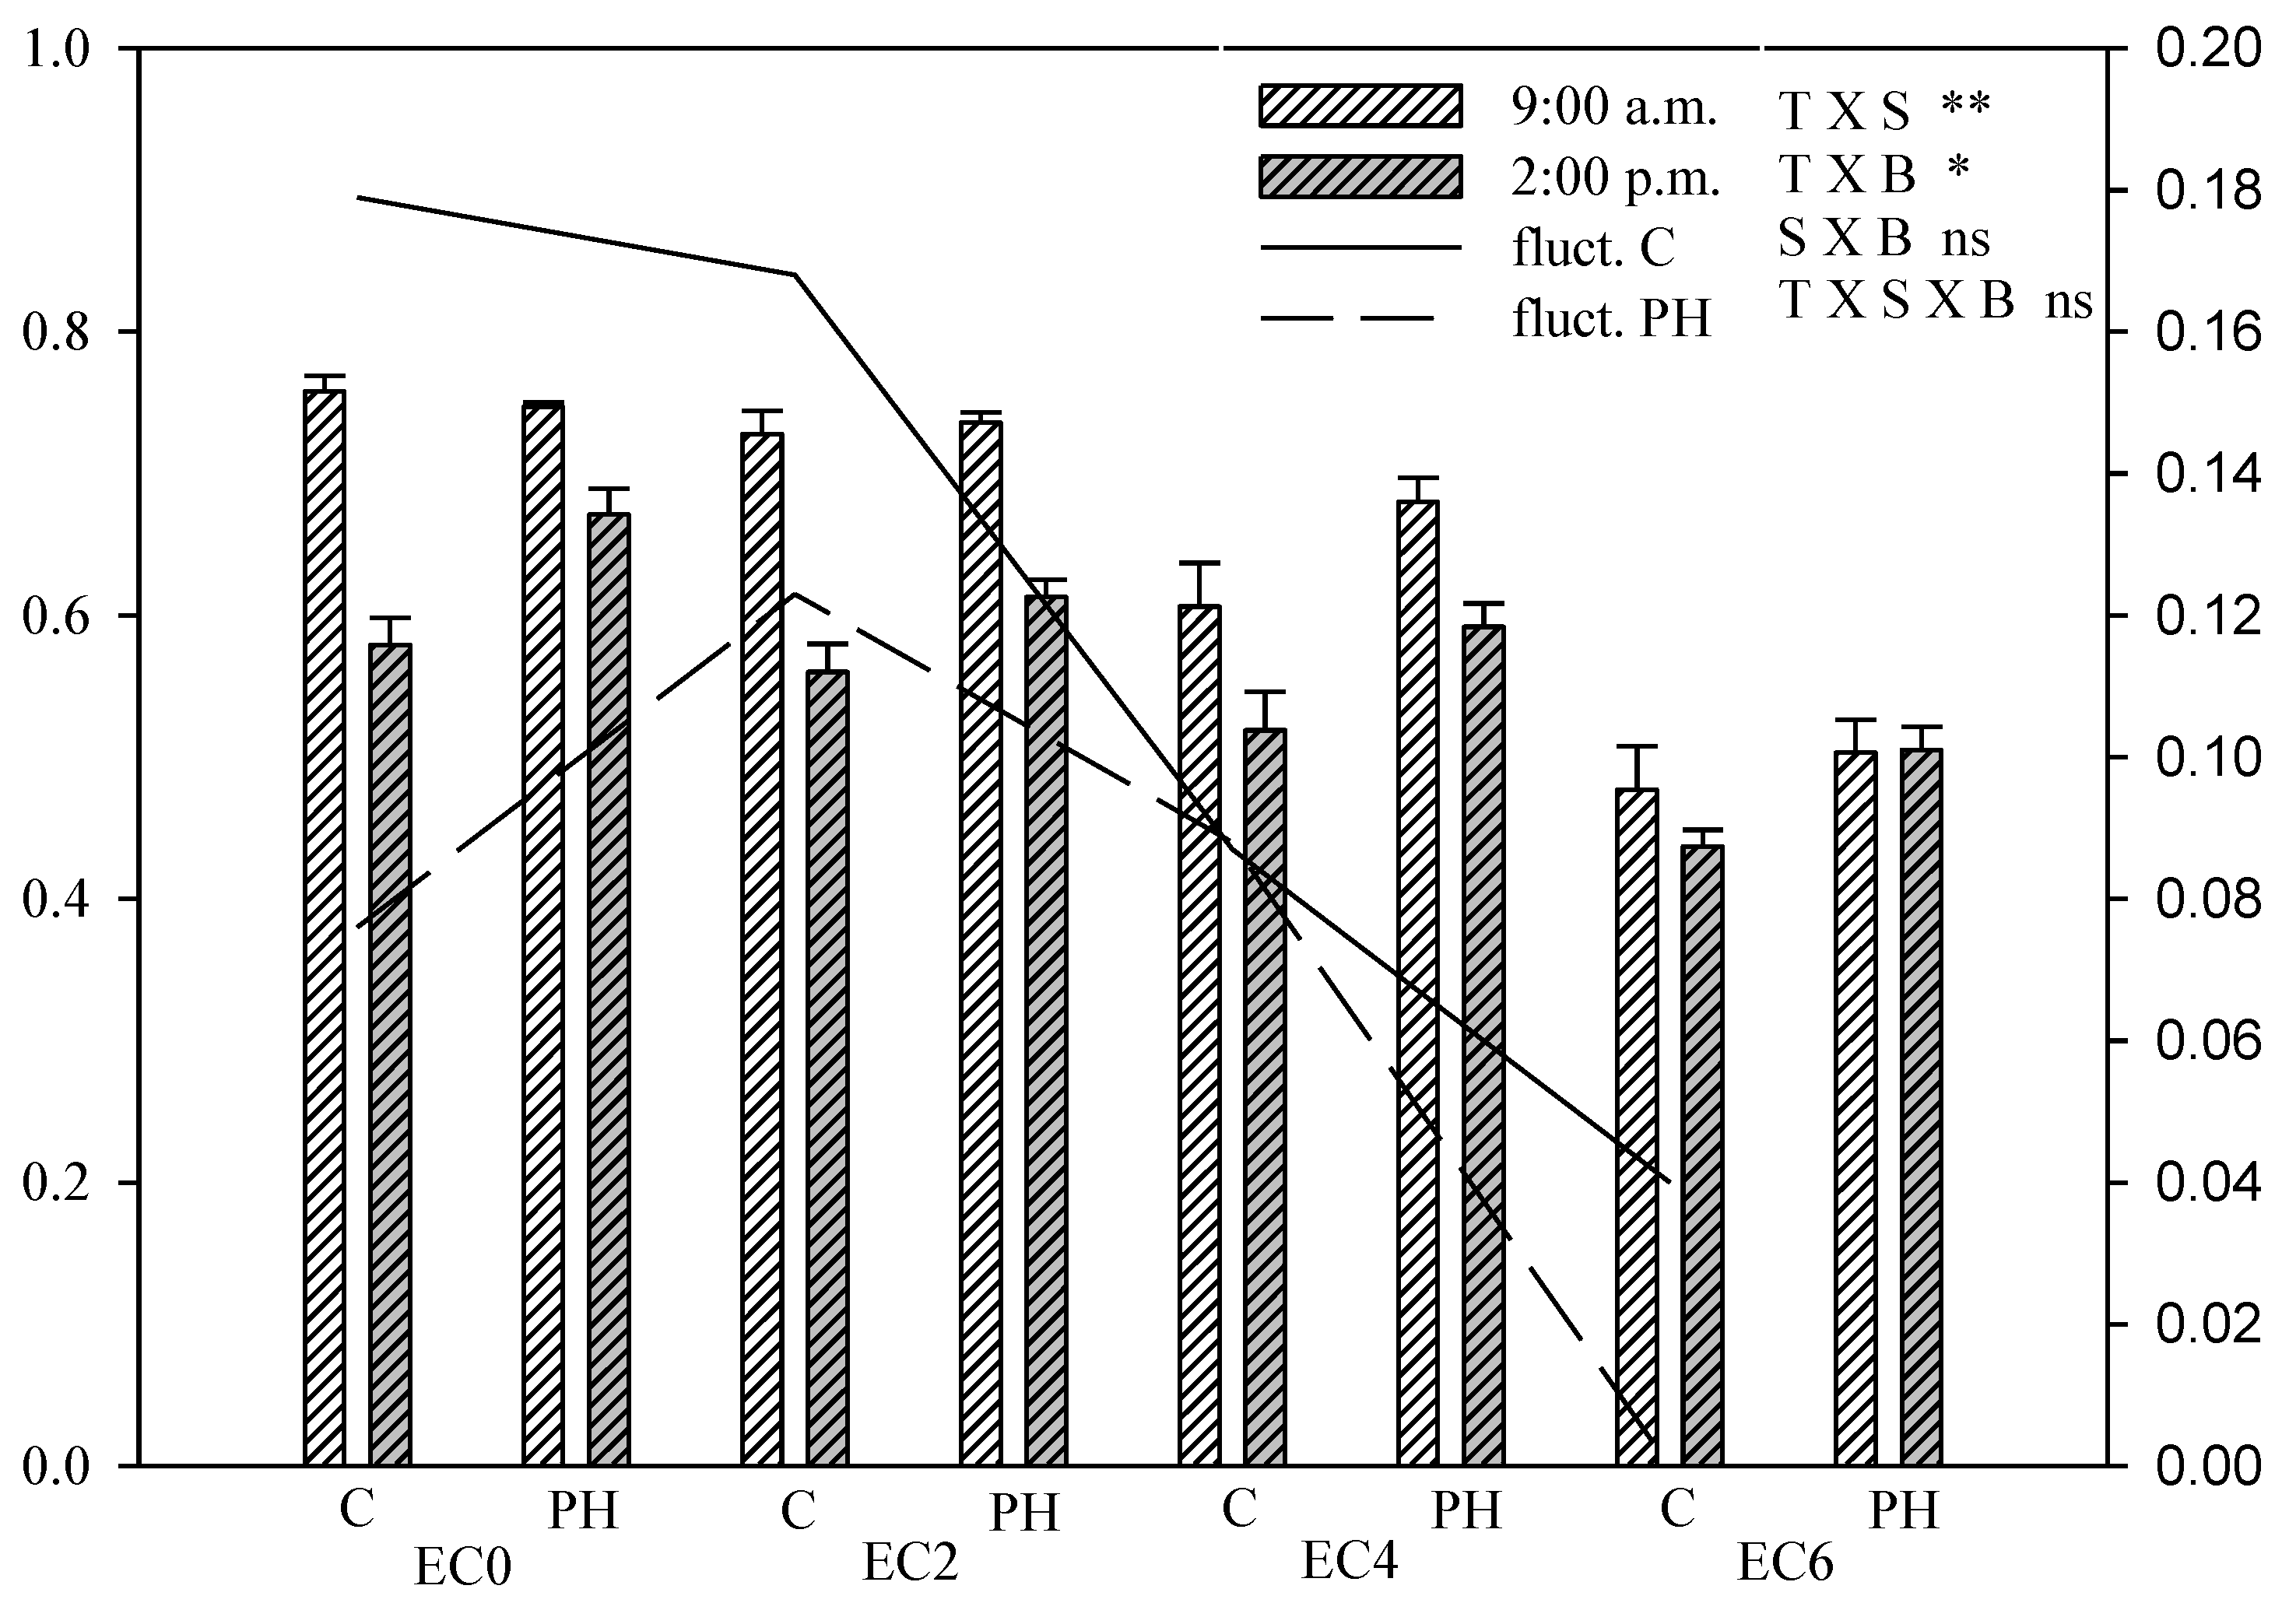
3.5. Chlorophyll Fluorescence Measurements

The experimental protocol was based on the measurement of the Chl a fluorescence parameter at two times during the day. This procedure allowed us to detect the effect of PH biostimulant application both in EC0 and in salt stressed crops, as well as to record the amplitude of the daily fluctuations of photochemical metabolism. After the sampled leaves were dark adapted for 30 min using the fluorimeter leaf clips, we measured the F0 and Fm values of chlorophyll fluorescence in the DAS, from which the derived ratios (Fv/Fm; Fm/F0; Fv/F0) were calculated.
F0 is the chlorophyll fluorescence emission associated with energy losses in the light harvesting complexes of PSII [43]. In EC0 plants, when no PH treatments were applied, the lowest F0 was recorded, with no significant daily fluctuation (Figure 3). Conversely, the biostimulant treatments induced a significant AM/PM fluctuation of F0 in EC0 plants, resulting from the higher F0 emission at the 02:00 p.m. The increasing salinity induced a corresponding increase in F0, which reached the maximum of 11,295 a.u. (55% higher than EC0 plants) at the 02:00 p.m., in plants at the highest (EC6) salinity level and without biostimulant application. Within each salinity level, at the 09:00 hrs the F0 was lower in PH-treated plants, also if it was not always statistically significant. A similar trend was also observed in the 02:00 p.m. measurements for the saline treatments, but a statistically significant difference was only recorded in the EC4 salinity level. The maximum difference between plants treated and non-treated with biostimulant was recorded at the medium salinity level (EC4), where the morning F0 values were 19% lower in PH treated plants (9035 a.u.) than in the untreated ones (11140 a.u.).
Fm is the maximum level of fluorescence from the dark-adapted leaves, measured when all PSII reaction centers are “closed” with a saturating flash of light.
Significant daily fluctuations in Fm were recorded both in EC0 and in salt treated plants (Figure 4). In all irrigation treatments, the PH treatment effectively reduced the amplitude of the daily fluctuation of Fm by maintaining a higher Fm at the 02:00 p.m. compared with plants from control plots. In respect to the plants subjected to the biostimulant treatment and irrigated with saline water at 2 and 4 dS m−1, the Fm value recorded at 2:00 p.m. was significantly higher than the value at 9:00 a.m.; instead, the trend is inverted for EC6 plants.
At the 9:00 a.m. and at the highest salinity level, no significant difference between PH treated plants and untreated control were detected.
From the dark-adapted F0 and Fm values, the Fv/Fm and Fv/F0 ratios were calculated, as indicators of the DAS efficiency of photochemical activities in PSII.
When analyzing the fluorescence ratios, we found that some significant dissimilarities between treatments were not revealed by the Duncan’s post-hoc test. Therefore, we carried on a further series of pairwise comparisons using the Student’s t-test, in order to compare AM and PM values (within each treatment) or PH-treated and PH-untreated plants (at the same time and within each salinity level).
EC0 plants with or without PH treatment had an Fv/Fm of 0.82 at 09:00 a.m., corresponding to the optimum value for healthy, non-stressed plants [61] (Figure 5; Table S1).
The Fv/Fm decreased during the morning and at 02:00 p.m. it was significantly lower than at 09:00 a.m., thus evidencing the daily fluctuation in the maximum quantum yield of PSII photochemistry. At 02:00 p.m. significant differences emerged between PH-treated (Fv/Fm = 0.79) and untreated (Fv/Fm = 0.75) plants. Overall, the increasing salinity resulted in lower Fv/Fm values, while the PH-treated plants at 02:00 p.m. had consistently higher Fv/Fm compared with untreated plants thus confirming that PH treatment helped reducing the daily fluctuation in Fv/Fm by reducing the mid-day depression in the maximum quantum yield of PSII.
The Fv/F0 value is proportional to the activity of the water-splitting and oxygen evolving complex of the PSII [43]. This parameter followed a very similar pattern of variation as the Fv/Fm described above, evidencing the effect of salinity and PH application on plant photochemistry on a wider sensitivity scale (Figure 6).
At the same time as the DAS measurements, the Chl a fluorescence was measured on a separate set of light-adapted leaf samples, allowing us to evaluate the effective quantum yield efficiency of PSII (ΦPSII) in the LAS.
In the morning (09:00 a.m.), no significant differences in ΦPSII were recorded between PH-treated and non-treated plants in the case of EC0, EC2 and EC6 salinity levels. At the 02:00 p.m. measurement, however, in all cases PH-treated plants had a significantly higher ΦPSII compared to untreated plants (Figure 7).
The increasing salinity progressively reduced the effective quantum efficiency of photochemistry (ΦPSII) in hemp (Figure 7) in all of the experimental treatments. In the morning, plants exposed to the highest salinity level in the absence of PH treatment had a 37% lower ΦPSII compared with the corresponding EC0 treatment.
With the only exception of the highest salinity treatment, the ΦPSII was significantly higher in the morning than in the afternoon, resulting in daily fluctuations of photochemical efficiency as evidenced in Figure 7.
PH treated plants were able to maintain a higher ΦPSII in the central part of the day compared with plants which were not treated with the biostimulant and this reduced the amplitude of the daily fluctuation of the effective photochemical efficiency.

4. Discussion

Soil and water salinity is an imperative factor limiting the crop performance. A great quota of agricultural land yearly becomes unfertile due to salts accumulation [62,63]. The main effect of salinity on most agricultural crops is growth and yield reduction [64], and in the most serious cases the death of plants. Each crop shows a different sensibility/tolerance to salt stress, varying with the varieties within the specie and with the pheno-phase.
Cheng et al. [20] consider textile hemp plants as a salt tolerance species but a notable variation can be observed among genotypes and at diverse plant growth and development steps, affecting alterations in plant morphology, anatomy and physiology. For example, Hu et al. [65] remarked a considerable antagonist influence of saline stress on seed germination in diverse hemp cultivars.
In our test we observed a decline of seeds yield at increasing of salt stress, with about 50% average losses of EC4 respect plants irrigated with non-saline water. Nevertheless, not all plants responded equally to saline irrigation; in fact, plants treated with legume-derived hydrolysate proteins had a linear decrease in seed yield, instead the non-treated plants had an exponential decrease. The LDPH seems to mitigate the detrimental effects of salinity on crop productivity, indeed it boost seed production, in fact at low and moderate saline stress (EC2 and EC4) the plants treated with biostimulants reached a level of production almost double of corresponding non treated plants. Our outcomes tie well with previous studies on lettuce [66] and maize [67], both grown under saline conditions and treated with a protein hydrolysate-based biostimulant. The lower seeds production was due both to number of seeds per plant and their average weight, both lower under increasing stress conditions. Again, the foliar application of biostimulant enhanced both parameters: 25.3% and 15.4% increase, for the number of seeds per plant and average seeds weight, respectively. Previous researches have demonstrated that PH has a direct effect on the stimulation of carbon and nitrogen metabolism in plants [56], with improvements also in the N-Use and N-Uptake efficiency in several crops, among which baby spinach and lamb’s lettuce [57]. This beneficial effect can be associated with modification of root density and length, as well as with the higher number of lateral roots [56], so increasing the root absorption surface and favoring the intake of nutrients and water.
Obviously, the decline in yield is the result of depressed plant growth, as highlighted by lower residual biomass and plant height especially under high saline conditions. Analogous findings were stated by Hu et al. [68], which revealed that dry matter and height of two hemp genotypes (fiber and seed type) gradually decreased when increasing NaCl or Na2CO3 concentrations were imposed in the seedlings’ growth phase. Here too, the application of LD protein hydrolysate positively affected these parameters.
As pointed out above, the decline in growth and yield in salt stressed crops could be ascribed to reduced water uptake resulting from osmotic stress [25,69] as well as to interference with different aspects of the plant physiology among which pigment synthesis and photosynthetic metabolism [70]. Photosynthesis is linked to plant biomass as about 10–40% of the energy goes into biomass accumulation under favorable conditions [40]. Therefore, all stress factors affecting the efficiency of photosynthesis lead to reduced plant biomass and growth [71].
A number of studies have shown that biostimulants may sustain plant productivity by increasing photosynthetic efficiency [72] although, as pointed out by Xu and Mou [73], previously published reports on the effect of PHs application on photochemical efficiency are not consistent. Some authors reported that PHs had no effect on the Chl a fluorescence parameter [73,74]; while in other cases PHs treatment was found to increase photochemical efficiency in stressed plants only, but they had no effects without stress [75,76]. Contrastingly, others appraised that PHs improved photochemical efficiency either with or without salt stress [66].
On the other hand, many studies reported the physiological daily fluctuations of the Chl a fluorescence parameter, e.g., Fv/Fm [77], ΦPSII and NPQ [78], Fv/Fm, ΦPSII and NPQ [79].
In this study, we show that one critical factor to be considered is the time of day when the fluorescence measurements are recorded.
For instance, in the case of the EC0 treatment no effects of PH application on Fv/Fm or on ΦPSII were recorded at 09:00 a.m., while a substantially different picture emerged at the 02:00 p.m. measurement, when the plants treated with PH had significantly higher quantum yield efficiency compared to the control plants (Figure 5 and Figure 7). In such a circumstance, the wrong conclusions about the effectiveness of PH treatments would have been drawn if only one daily measurement had been acquired.
It is also possible that in a number of other published studies this evidence might have been hidden by the timing of the fluorescence measurements which were limited to only one measure during the day, possibly over an exceedingly long-time interval. We recommend that the timing of the measurements should be properly planned when acquiring the experimental data.
In this research salinity was shown to reduce crop productivity by directly affecting the primary photosynthetic processes in Cannabis leaves, while the application of a PH biostimulant had a protective effect against the deleterious effects of salt stress. Increasing salinity significantly affected the Chl a fluorescence parameter, consequently reducing the quantum yields of photochemistry. This was recorded in terms of a decrease of the Fv/Fm and ΦPSII ratio, which measure the maximum and the effective quantum use efficiency of PSII in DAS and LAS, respectively. Such alterations in the Chl a fluorescence parameters are in agreement with previous studies on different crops [80,81,82,83] and were also reported for plants exposed to a range of abiotic stresses such as high light, drought, high/low temperatures, nutrient limitation or pollution [31].
While the ΦPSII measures the effective efficiency of PSII (i.e., the proportion of absorbed energy which is actually used in photochemistry) in light adapted leaves, the dark-adapted fluorescence parameters presented above (Fo, Fm, Fv/Fm and Fv/F0) provide information about the physiological processes which have altered the efficiency.
The minimum fluorescence (F0) was found to increase with the increasing salinity treatments and this is in accordance with preceding reports [84]. The increase of F0 is known as a strong indicator of photo-inhibition resulting from an impairment of the energy transfer from the PSII antennae to the Reaction Centers, which is in turn caused by the dissociation of antennae from the PSII core and/or by increased number of inactive reaction centers [49,85].
The Fv/Fm ratio is widely used as a stress indicator. It represents the maximum quantum yield of PSII in dark-adapted leaves and it indicates the probability that a trapped photon will end up in the reaction center and start a photochemical event [86]. Salt stress was already reported to impair the plant photosynthetic efficiency thus resulting in decreased Fv/Fm [32,87,88], as we confirm in our study observing a significant reduction in this parameter caused by the increasing salinity levels.
This lower photochemical efficiency could result from enhanced thermal energy dissipation, indicating that salinity induces the occurrence of photo-protection [89].
The effect of salinity on the photosynthetic efficiency was confirmed by the Fv/F0 ratio, which is a more sensitive index than Fv/Fm to minor changes in Fv and/or F0 [90,91] and it is related to the fraction of functional PSII reaction centers [92]. The reduction in Fv/F0 was in accordance with previous studies [88] and confirmed the deleterious effect of salinity on the photosynthetic apparatus.
Overall, the increasing salinity disrupted the functioning of the photochemical apparatus, resulting in higher F0 as well as decreased Fv/Fm and Fv/F0. However, the application of PH as a biostimulant effectively counteracted the effects of salinity, resulting in the maintenance of higher Fv/Fm, Fv/F0 and ΦPSII at all salinity levels and it appeared to be crucial in delaying photo-inhibition thus increasing the photosynthetic productivity of hemp crops. Comparable outcomes were described by Rouphael et al. [30] on lettuce.
From a physiological point of view, the negative effects of salinity on the photosynthetic metabolisms are ascribed to the increased uptake of sodium (Na+) and chloride (Cl), causing nutritional imbalance and reduced K/Na ratio in the shoot tissues [30,93,94]. This is accompanied by oxidative stress due to the generation of reactive oxygen species (ROS) especially in the chloroplast compartment, which in turn cause oxidative damage to cell membranes and alteration in the thylakoid membrane protein profile. The above-mentioned events ultimately lead to decreased energy transfer from light harvesting antennae to PSII reaction centers [87,94,95,96], thus affecting photochemistry as recorded by the Chl a fluorescence data reported above.
When salinity does not exceed the physiological range tolerated by each species, variety or landrace, plants are able to control the concentration of ROS within their tissues by means of an array of enzymatic and non-enzymatic antioxidant systems [97] which protect the metabolic functions. However, the plant antioxidant defense systems can be boosted by the application of PH biostimulants [30,93,97], thus effectively improving the physiological protection of the photosynthetic apparatus [67]. This appears to be the case in our research, where the chlorophyll fluorescence indices as well as the overall crop performance benefited from the protective effect of the PH biostimulant application.
Moreover, we suggest that the observed protective effect on the photosynthetic metabolism originates from the auxin-like activity of the “Trainer” PH, reported in previously published research [98,99]. Indeed, the application of exogenous auxin is known to increase the activities of antioxidant enzymes and to result in higher stomatal conductance, higher internal CO2 concentration and higher net photosynthetic rate [100]. This supports our experimental results, explaining the positive effect of the PH treatment on photochemistry even in the absence of salinity and confirming that hemp crops may benefit from the application of PHs even when salinity is not an issue.
The application of PH biostimulant appeared to be crucial in maintaining a higher photochemical efficiency in treated plants, as well as in reducing the range of the daily fluctuation in effective quantum yield. As suggested by Rouphael et al. [30], these factors guaranteed a better functioning of the photosynthetic metabolism thus improving plant productivity.
On the other hand, we found a direct relationship between plant photochemistry and plant productivity, confirming that the Chl a fluorescence parameter can be used to forecast the crop performance in the field.

5. Conclusions

The irrigation with saline water, already at 2.0 dS m−1, negatively affected hemp seeds production (−27.5% on average). Additionally, the fluorescence parameters showed a direct proportionality between the saline level and the damage to photosynthetic system. The two most stressed treatments (EC4 and EC6) caused a persistent depression of photochemical parameters, which were not restored during the night.
The LD-protein hydrolysate has protected the photosynthetic system, improving hemp productivity. In fact, the LDPH application boosted seeds yield (+38.6% over control plants), as well as residual biomass (+24.6%). So, interestingly, the residual biomass can be destined to other uses for increasing the farmer’s income.

Supplementary Materials

The following are available online at https://www.mdpi.com/2073-4395/11/2/342/s1, Table S1: Resulting p-values of the Student’s t-test pairwise comparisons between AM and PM values (within each single treatment) or between PH-treated (PH) and PH-untreated (C) plants at the same time and within each salinity level).

Author Contributions

Conceptualization, M.M., E.C., I.D.M., Y.R. and S.C.; methodology, M.M., I.D.M., E.C. and S.C.; software, L.O. and L.S.; validation, M.M. and S.C., G.M., A.T.; formal analysis, I.D.M., L.O. and S.C.; investigation, I.D.M. and G.M., A.T.; resources, E.C. and G.M.; data curation, M.M.; writing—original draft preparation, I.D.M., and S.C.; writing—review and editing, I.D.M., L.S., Y.R., S.C. and A.T.; visualization, L.O., E.C., S.C. and A.T.; supervision, Y.R. and S.C.; project administration, M.M.; funding acquisition, M.M. All authors have read and agreed to the published version of the manuscript.

Funding

This research received no external funding.

Institutional Review Board Statement

Not applicable.

Informed Consent Statement

Informed consent was obtained from all subjects involved in the study.

Acknowledgments

We would like to thank Sabrina Nocerino for her support in laboratory work.

Conflicts of Interest

The authors declare no conflict of interest.

Abbreviations

ECelectrical conductivity
PHprotein hydrolysate
LDPHlegume-derived protein hydrolysate
Chl achlorophyll a
DASdark-adapted state
LASlight adapted state

References

  1. Karus, M.; Vogt, D. European hemp industry: Cultivation, processing and product lines. Euphytica 2004, 140, 7–12. [Google Scholar] [CrossRef]
  2. Jarabo, R.; Fuente, E.; Monte, M.C.; Savastano, H., Jr.; Mutjé, P.; Negro, C. Use of cellulose fibres from hemp core in fibre-cement production. Effect on flocculation, retention, drainage and product properties. Ind. Crops Prod. 2012, 39, 89–96. [Google Scholar] [CrossRef] [Green Version]
  3. Li, Z.; Wang, X.; Wang, L. Properties of hemp fibre reinforced concrete composites. Compos. Part A Appl. Sci. Manuf. 2006, 37, 497–505. [Google Scholar] [CrossRef] [Green Version]
  4. Elfordy, S.; Lucas, F.; Tancret, F.; Scudeller, Y.; Goudet, L. Mechanical and thermal properties of lime and hemp concrete (‘hempcrete’) manufactured by a projection process. Constr. Build. Mater. 2008, 22, 2116–2123. [Google Scholar] [CrossRef]
  5. Bénézet, J.C.; Stanojlovic-Davidovic, A.; Bergeret, A.; Ferry, L.; Crespy, A. Mechanical and physical properties of expanded starch, reinforced by naturalfibres. Ind. Crops Prod. 2012, 37, 435–440. [Google Scholar]
  6. Holbery, J.; Houston, D. Natural-fibre-reinforced polymer composites in auto-motive applications. J. Miner. Met. Mater. Soc. 2006, 58, 80–86. [Google Scholar] [CrossRef]
  7. Kreuger, E.; Prade, T.; Escobar, F.; Svensson, S.E.; Englund, J.E.; Björnsson, L. Anaerobic digestion of industrial hemp—Effect of harvest time on methane energy yield per hectare. Biomass Bioenergy 2011, 35, 893–900. [Google Scholar] [CrossRef]
  8. Prade, T.; Svensson, S.E.; Andersson, A.; Mattsson, J.A. Biomass and energy yield of industrial hemp grown for biogas and solid fuel. Biomass Bioenergy 2011, 35, 3040–3049. [Google Scholar] [CrossRef]
  9. Sipos, B.; Kreuger, E.; Svensson, S.E.; Réczey, K.; Björnsson, L.; Guido, Z. Steam pre-treatment of dry and ensiled industrial hemp for ethanol production. Biomass Bioenergy 2010, 34, 1721–1731. [Google Scholar] [CrossRef] [Green Version]
  10. Aluru, M.; Kukk, L.; Astover, A.; Shanskiy, M.; Loit, E. An agro-economic analysis of briquette production from fibre hemp and energy sunflower. Ind. Crops Prod. 2013, 51, 186–193. [Google Scholar] [CrossRef]
  11. Callaway, J.C. Hempseed as a nutritional resource. Euphytica 2004, 140, 65–72. [Google Scholar] [CrossRef]
  12. Matthäus, B.; Brühl, L. Virgin hemp seed oil: An interesting niche product. Eur. J. Lipid Sci. Technol. 2008, 110, 655–661. [Google Scholar] [CrossRef]
  13. Hessle, A.; Eriksson, M.; Nadeau, E.; Turner, T.; Johansson, B. Cold-pressed hempseed cake as a protein feed for growing cattle. Acta Agric. Scand. A Anim. Sci. 2008, 58, 136–145. [Google Scholar] [CrossRef]
  14. Goldberg, E.M.; Gakhar, N.; Ryland, D.; Aliani, M.; Gibson, R.A.; House, J.D. Fatty acid profile and sensory characteristics of table eggs from laying hens fed hempseed and hempseed oil. J. Food Sci. 2012, 77, 153–160. [Google Scholar] [CrossRef]
  15. Sapino, S.; Carlotti, M.E.; Peira, E.; Gallarate, M. Hemp-seed and olive oils: Their stability against oxidation and use in O/W emulsions. J. Cosmet. Sci. 2005, 56, 227–251. [Google Scholar] [CrossRef] [PubMed]
  16. Vogl, C.R.; Mölleken, H.; Lissek-Wolf, G.; Surböck, A.; Kobert, J. Hemp (Cannabis sativa L.) as a resource for green cosmetics: Yield of seed and fatty acid compositions of 20 varieties under the growing conditions of organic farming in Austria. J. Ind. Hemp 2004, 9, 51–68. [Google Scholar] [CrossRef]
  17. Appendino, G.; Gibbons, S.; Giana, A.; Pagani, A.; Grassi, G.; Stavri, M.; Smith, E.; Rahman, M.M. Antibacterial cannabinoids from Cannabis sativa: Astructure–activity study. J. Nat. Prod. 2008, 71, 1427–1430. [Google Scholar] [CrossRef] [PubMed]
  18. Mukhtar, T.; Kayani, M.Z.; Hussain, M.A. Nematicidal activities of Cannabissativa L. and Zanthoxylum alatum Roxb. against Meloidogyne incognita. Ind. Crops Prod. 2013, 42, 447–453. [Google Scholar] [CrossRef]
  19. Amaducci, S.; Zatta, A.; Raffanini, M.; Venturi, G. Characterisation of hemp (Cannabis sativa L.) roots under different growing conditions. Plant Soil 2008, 313, 227–235. [Google Scholar] [CrossRef]
  20. Cheng, X.; Deng, G.; Su, Y.; Liu, J.J.; Yang, Y.; Du, G.H.; Chen, Z.Y.; Liu, F.H. Protein mechanisms in response to NaCl-stress of salt-tolerant and salt-sensitive industrial hemp based on iTRAQ technology. Ind. Crops Prod. 2016, 83, 444–452. [Google Scholar] [CrossRef]
  21. Food and Agriculture Organization of the United Nations. World Soil Resources Reports No.106. Rome: International Soil Classification System for Naming Soils and Creating Legends for Soil Maps. Available online: http://www.opengrey.eu/item/display/10068/310015 (accessed on 25 November 2020).
  22. Rozema, J.; Flowers, T. Crops for a salinized world. Science 2008, 322, 1478–1480. [Google Scholar] [CrossRef]
  23. Brady, N.C.; Weil, R.R. The Nature and Properties of Soils, 14th ed.; Prentice-Hall: Upper Saddle River, NJ, USA, 2008. [Google Scholar]
  24. Machado, R.; Serralheiro, R. Soil salinity: Effect on vegetable crop growth. Management practices to prevent and mitigate soil salinization. Horticulturae 2017, 3, 30. [Google Scholar] [CrossRef]
  25. Di Mola, I.; Guida, G.; Mistretta, C.; Giorio, P.; Albrizio, R.; Visconti, D.; Fagnano, M.; Mori, M. Agronomic and physiological response of giant reed (Arundo donax L.) to soil salinity. Ital. J. Agron. 2018, 13, 31–39. [Google Scholar] [CrossRef] [Green Version]
  26. Munns, R. Genes and salt tolerance: Bringing them together. New Phytol. 2017, 167, 645–663. [Google Scholar] [CrossRef] [PubMed]
  27. Ntatsi, G.K.A.; Aliferis, Y.; Rouphael, F.; Napolitano, K.; Makris, G.; Kalala, G.; Katopodis, G.; Savvas, D. Salinity source alters mineral composition and metabolism of Cichorium spinosum. Environ. Exp. Bot. 2017, 141, 113–123. [Google Scholar] [CrossRef]
  28. Akram, N.A.; Shafiq, F.; Ashraf, M.; Iqbal, M.; Ahmad, P. Advances in Salt Tolerance of Some Major Fiber Crops Through Classical and Advanced Biotechnological Tools: A Review. J. Plant Growth Regul. 2020. [Google Scholar] [CrossRef]
  29. Rouphael, Y.; Cardarelli, M.; Bassal, A.; Leonardi, C.; Giuffrida, F.; Colla, G. Vegetable quality as affected by genetic, agronomic and environmental factors. J. Food Agric. Environ. 2012, 10, 680–688. [Google Scholar]
  30. Rouphael, Y.; Cardarelli, M.; Bonini, P.; Colla, G. Synergistic Action of a Microbial-based Biostimulant and a Plant Derived-Protein Hydrolysate Enhances Lettuce Tolerance to Alkalinity and Salinity. Front. Plant Sci. 2017, 8, 131. [Google Scholar] [CrossRef] [PubMed] [Green Version]
  31. Stirbet, A.; Lazar, D.; Kromdijk, J. Chlorophyll a fluorescence induction: Can just a one-second measurement be used to quantify abiotic stress responses? Photosynthetica 2018, 56, 86–104. [Google Scholar] [CrossRef]
  32. Rastogi, A.; Kovar, M.; He, X.; Zivcak, M.; Kataria, S.; Kalaji, H.M.; Skalicky, M.; Ibrahimova, U.F.; Hussain, S.; Mbarki, S.; et al. JIP-test as a tool to identify salinity tolerance in sweet sorghum genotypes. Photosynthetica 2019, 58, 518–528. [Google Scholar] [CrossRef] [Green Version]
  33. Di Mola, I.; Rouphael, Y.; Colla, G.; Fagnano, M.; Paradiso, R.; Mori, M. Morpho physiological traits and nitrate content of greenhouse lettuce as affected by irrigation with saline water. HortScience 2017, 52, 1716–1721. [Google Scholar] [CrossRef] [Green Version]
  34. Mori, M.; Amato, M.; Di Mola, I.; Caputo, R.; Quaglietta Chiaranda, F.; Di Tommaso, T. Productive behaviour of “cherry”-type tomato irrigated with saline water in relation to nitrogen fertilization. Eur. J. Agron. 2008, 29, 135–143. [Google Scholar] [CrossRef]
  35. Mori, M.; Di Mola, I.; Quaglietta Chiarandà, F. Salt stress and transplant time in snap bean: Growth and productive behaviour. Int. J. Plant Prod. 2011, 5, 49–64. [Google Scholar]
  36. Parida, A.K.; Das, A.B. Salt tolerance and salinity effects on plants: A review. Ecotoxicol. Environ. Safe 2005, 60, 324–349. [Google Scholar] [CrossRef] [PubMed]
  37. Acosta-Motos, J.R.; Ortuño, M.F.; Bernal-Vicente, A.; Diaz-Vivancos, P.; Sanchez-Blanco, M.J.; Hernandez, J.A. Responses to salt stress: Adaptive mechanisms. Agronomy 2017, 7, 18. [Google Scholar] [CrossRef] [Green Version]
  38. Colla, G.; Rouphael, Y.; Cardarelli, M.; Rea, E. Effect of salinity on yield, fruit quality, leaf gas exchange, and mineral composition of grafted watermelon plants. HortScience 2006, 41, 622–627. [Google Scholar] [CrossRef] [Green Version]
  39. Rouphael, Y.; Cardarelli, M.; Rea, E.; Battistelli, A.; Colla, G. Comparison of the subirrigation and drip-irrigation systems for greenhouse zucchini squash production using saline and non-saline nutrient solution. Agric. Water Manag. 2006, 82, 99–117. [CrossRef]
  40. Wungrampha, S.; Joshi, R.; Singla-Pareek, S.L.; Pareek, A. Photosynthesis and salinity: Are these mutually exclusive? Photosynthetica 2018, 56, 366–381. [Google Scholar] [CrossRef]
  41. Maxwell, K.; Johnson, G.N. Chlorophyll fluorescence—A practical guide. J. Exp. Bot. 2000, 51, 659–668. [Google Scholar] [CrossRef]
  42. Roháček, K.; Soukupová, J.; Barták, M. Chlorophyll fluorescence: A wonderful tool to study plant physiology and plant stress. In Plant Cell Compartments—Selected Topics; Schoefs, B., Ed.; Research Signpost: Kerala, India, 2008; pp. 41–104. ISBN 978-81-308-0104-9. [Google Scholar]
  43. Kalaji, H.M.; Goltsev, V.N.; Zuk-Golaszewska, K.; Zivcak, M.; Brestic, M. Chlorophyll Fluorescence: Understanding Crop Performance—Basics and Applications; CRC Press: Boca Raton, FL, USA, 2017; p. 222. [Google Scholar]
  44. Govindjee, G. Chlorophyll a Fluorescence: A Bit of Basics and History. In Chlorophyll a Fluorescence: A Signature of Photosynthesis. Advances in Photosynthesis and Respiration; Papageorgiou, G.C., Govindjee, G., Eds.; Springer: Dordrecht, The Netherlands, 2004; pp. 1–42. [Google Scholar]
  45. Strasser, R.J.; Tsimilli-Michael, M.; Srivastava, A. Analysis of the chlorophyll a fluorescence transient. In Chlorophyll a Fluorescence: A Signature of Photosynthesis. Advances in Photosynthesis and Respiration; Papageorgiou, G.C., Govindjee, G., Eds.; Springer: Dordrecht, The Netherlands, 2004; pp. 321–362. [Google Scholar]
  46. Stirbet, A.; Riznichenko, G.Y.; Rubin, A.B. Modeling Chlorophyll a Fluorescence Transient: Relation to Photosynthesis. Biochemistry (Moscow) 2014, 79, 291–323. [Google Scholar] [CrossRef]
  47. Strasser, R.J. On the O-J-I-P transient in leaves and D1 mutants of Chlamydomonas reinhardtii. In Research in Photosynthesis; Murata, N., Ed.; Kluwer Academic Publishers: Dordrecht, The Netherlands, 1992; Volume 2, pp. 29–32. [Google Scholar]
  48. Tsimilli-Michael, M. Revisiting JIP-test: An educative review on concepts, assumptions, approximations, definitions and terminology. Photosynthetica 2019, 1, 90–107. [Google Scholar] [CrossRef] [Green Version]
  49. Kalaji, H.M.; Bosa, K.; Koscielniak, J.; Zuk-Golaszewska, K. Effects of salt stress on photosystem II efficiency and CO2 assimilation of two Syrian barley landraces. Environ. Exp. Bot. 2011, 73, 64–72. [Google Scholar] [CrossRef]
  50. Genty, B.; Briantais, J.M.; Baker, N.R. The relationship between the quantum yield of photosynthetic electron transport and quenching of chlorophyll fluorescence. Biochim. Biophys. Acta 1989, 990, 87–92. [Google Scholar] [CrossRef]
  51. Chaves, M.M.; Flexas, J.; Pinheiro, C. Photosynthesis under drought and salt stress: Regulation mechanisms from whole plant to cell. Ann. Bot. 2009, 103, 551–560. [Google Scholar] [CrossRef] [Green Version]
  52. Allakhverdiev, S.I.; Murata, N. Salt stress inhibits photosystem II and I in cynobacteria. Photosynth. Res. 2008, 98, 529–539. [Google Scholar] [CrossRef] [PubMed]
  53. Du Jardin, P. Plant biostimulants: Definition, concept, main categories and regulation. Sci. Hortic. 2015, 196, 3–14. [Google Scholar] [CrossRef] [Green Version]
  54. Consentino, B.B.; Virga, G.; La Placa, G.G.; Sabatino, L.; Rouphael, Y.; Ntatsi, G.; Iapichino, G.; La Bella, S.; Mauro, R.P.; D’Anna, F.; et al. Celery (Apium graveolens L.) Performances as Subjected to Different Sources of Protein Hydrolysates. Plants 2020, 9, 1633. [Google Scholar] [CrossRef]
  55. Dell’Aversana, E.; D’Amelia, L.; De Pascale, S.; Carillo, P. Use of Biostimulants to Improve Salinity Tolerance in Agronomic Crops. In Agronomic Crops; Hasanuzzaman, M., Ed.; Springer: Singapore, 2020. [Google Scholar] [CrossRef]
  56. Colla, G.; Hoagland, L.; Ruzzi, M.; Cardarelli, M.; Bonini, P.; Canaguier, R.; Rouphael, Y. Biostimulant Action of Protein Hydrolysates: Unraveling Their Effects on Plant Physiology and Microbiome. Front. Plant Sci. 2017, 8, 2202. [Google Scholar] [CrossRef] [PubMed] [Green Version]
  57. Di Mola, I.; Cozzolino, E.; Ottaiano, L.; Nocerino, S.; Rouphael, Y.; Colla, G.; El-Nakhel, C.; Mori, M. Nitrogen Use and Uptake Efficiency and Crop Performance of Baby Spinach (Spinacia oleracea L.) and Lamb’s Lettuce (Valerianella locusta L.) Grown under Variable Sub-Optimal N Regimes Combined with Plant-Based Biostimulant Application. Agronomy 2020, 10, 278. [Google Scholar] [CrossRef] [Green Version]
  58. Di Mola, I.; Cozzolino, E.; Ottaiano, L.; Giordano, M.; Rouphael, Y.; Colla, G.; Mori, M. Effect of vegetal- and seaweed extract-based biostimulants on agronomical and leaf quality traits of plastic tunnel-grown baby lettuce under four regimes of nitrogen fertilization. Agronomy 2019, 9, 571. [Google Scholar] [CrossRef] [Green Version]
  59. Di Mola, I.; Ottaiano, L.; Cozzolino, E.; Senatore, M.; Giordano, M.; El-Nakhel, C.; Sacco, A.; Rouphael, Y.; Colla, G.; Mori, M. Plant-Based Biostimulants Influence the Agronomical, Physiological, and Qualitative Responses of Baby Rocket Leaves under Diverse Nitrogen Conditions. Plants 2019, 8, 522. [Google Scholar] [CrossRef] [PubMed] [Green Version]
  60. Rouphael, Y.; Giordano, M.; Cardarelli, M.; Cozzolino, E.; Mori, M.; Kyriacou, M.; Bonini, P.; Colla, G. Plant and seaweed-based extracts increase yield but differentially modulate nutritional quality of greenhouse spinach through biostimulant action. Agronomy 2018, 8, 126. [Google Scholar] [CrossRef] [Green Version]
  61. Björkman, O.; Demmig, B. Photon yield of O2 evolution and chlorophyll fluorescence characteristics at 77 K among vascular plants of diverse origins. Planta 1987, 170, 489–504. [Google Scholar] [CrossRef] [PubMed]
  62. Pimentel, D.; Berger, B.; Filiberto, D.; Newton, M.; Wolfe, B.; Karabinakis, E.; Clark, S.; Poon, E.; Abbett, E.; Nandagopal, S. Water resources: Agricultural and environmental issues. Bioscience 2004, 54, 909–918. [Google Scholar] [CrossRef] [Green Version]
  63. Okur, B.; Örçen, N. Soil Salinization and Climate Change. In Climate Change and Soil Interactions; Elsevier: Amsterdam, The Netherlands, 2020; pp. 331–350. [Google Scholar]
  64. Benazzouk, S.; Dobrev, P.I.; Djazouli, Z.E.; Motyka, V.; Lutts, S. Positive impact of vermicompost leachate on salt stress resistance in tomato (Solanum lycopersicum L.) at the seedling stage: Aphytohormonal approach. Plant Soil 2020, 446, 145–162. [Google Scholar] [CrossRef]
  65. Hu, H.; Liu, H.; Liu, F. Seed germination of hemp (Cannabis sativa L.) cultivars responds differently to the stress of salt type and concentration. Ind. Crops Prod. 2018, 123, 254–261. [Google Scholar] [CrossRef]
  66. Lucini, L.; Rouphael, Y.; Cardarelli, M.; Canaguier, R.; Kumar, P.; Colla, G. The effect of a plant-derived biostimulant on metabolic profiling and crop performance of lettuce grown under saline conditions. Sci. Hortic. 2015, 182, 124–133. [Google Scholar] [CrossRef]
  67. Ertani, A.; Schiavon, M.; Muscolo, A.; Nardi, S. Alfalfa plant-derived biostimulant stimulate short-term growth of salt stressed Zea mays L. plants. Plant Soil 2013, 364, 145–158. [Google Scholar] [CrossRef]
  68. Hu, H.; Liu, H.; Du, G.; Fei, Y.; Deng, G.; Yang, Y.; Feihu, L. Fiber and seed type of hemp (Cannabis sativa L.) responded differently to salt-alkali stress in seedling growth and physiological indices. Ind. Crops Prod. 2019, 129, 624–630. [Google Scholar] [CrossRef]
  69. Maggio, A.; De Pascale, S.; Fagnano, M.; Barbieri, G. Saline agriculture in Mediterranean environments. Ital. J. Agron. 2011, 6, 36–43. [Google Scholar] [CrossRef]
  70. Colla, G.; Rouphael, Y.; Leonardi, C.; Bie, Z. Role of grafting in vegetable crops grown under saline conditions. Sci. Hortic. 2010, 127, 147–155. [Google Scholar] [CrossRef]
  71. Munns, R.; Gilliham, M. Salinity tolerance of crops—What is the cost? New Phytol. 2015, 208, 668–673. [Google Scholar] [CrossRef] [PubMed] [Green Version]
  72. Yakhin, O.I.; Lubyanov, A.A.; Yakhin, I.A.; Brown, P.H. Biostimulants in plant science: A global perspective. Front. Plant Sci. 2017, 7, 2049. [Google Scholar] [CrossRef] [PubMed] [Green Version]
  73. Xu, C.; Mou, B. Drench application of fish-derived protein hydrolysates affects lettuce growth, chlorophyll content, and gas exchange. HortTechnology 2017, 27, 539–543. [Google Scholar] [CrossRef]
  74. Paul, K.; Sorrentino, M.; Lucini, L.; Rouphael, Y.; Cardarelli, M.; Bonini, P.; Reynaud, H.; Canaguier, R.; Trtiílek, M.; Panzarovaá, K.; et al. Understanding the Biostimulant Action of Vegetal-Derived Protein Hydrolysates by High-Throughput Plant Phenotyping and Metabolomics: A Case Study on Tomato. Front. Plant Sci. 2019, 10, 47. [Google Scholar] [CrossRef]
  75. Botta, A. Enhancing plant tolerance to temperature stress with amino acids: An approach to their mode of action. Acta Hortic. 2013, 1009, 29–35. [Google Scholar] [CrossRef]
  76. Kauffman, G.L., III; Kneival, D.P.; Watschke, T.L. Effects of biostimulant on the heat tolerance associated with photosynthetic capacity, membrane thermostability, and polyphenol production of perennial ryegrass. Crop Sci. 2007, 47, 261–267. [Google Scholar] [CrossRef]
  77. Haldimann, P.; Fracheboud, Y.; Stamp, P. Photosynthetic performance and resistance to photoinhibition of Zea mays L. leaves grown at sub-optimal temperature. Plant Cell Environ. 1996, 19, 85–92. [Google Scholar] [CrossRef]
  78. González, A.; Tezara, W.; Rengifo, E.; Herrera, A. Ecophysiological responses to drought and salinity in the cosmopolitan invader Nicotiana glauca. Braz. J. Plant Physiol. 2012, 24, 213–222. [Google Scholar]
  79. Tattini, M.; Sebastiani, F.; Brunetti, C.; Fini, A.; Torre, S.; Gori, A.; Centritto, M.; Ferrini, F.; Landi, M.; Guidi, L. Dissecting molecular and physiological response mechanisms to high solar radiation in cyanic and acyanic leaves: A case study on red and green basil. J. Exp. Bot. 2017, 68, 2425–2437. [Google Scholar] [CrossRef]
  80. Zribi, L.; Gharbi, F.; Rezgui, F.; Rejeb, S.; Nahdi, H.; Rejeb, M.N. Application of chlorophyll fluorescence for the diagnosis of salt stress in tomato “Solanum lycopersicum (variety Rio Grande)”. Sci. Hortic. 2009, 120, 367–372. [Google Scholar] [CrossRef]
  81. Lu, K.X.; Cao, B.H.; Feng, X.P.; He, Y.; Jiang, D.A. Photosynthetic response of salt tolerant and sensitive soybean varieties. Photosynthetica 2009, 47, 381–387. [Google Scholar] [CrossRef]
  82. Hanachi, S.; Van Labeke, M.C.; Mehouachi, T. Application of chlorophyll fluorescence to screen eggplant (Solanum melongena L.) cultivars for salt tolerance. Photosynthetica 2014, 52, 57–62. [Google Scholar] [CrossRef]
  83. He, Y.; Zhu, Z.; Yang, J.; Ni, X.; Zhu, B. Grafting increases the salt tolerance of tomato by improvement of photosynthesis and enhancement of antioxidant enzymes activity. Environ. Exp. Bot. 2009, 66, 270–278. [Google Scholar] [CrossRef]
  84. Lutts, S.; Kinet, J.M.; Bouharmont, J. NaCl-induced senescence in leaves of rice (Oryza sativa L.) cultivars differing in salinity resistance. Ann. Bot. 1996, 78, 389–398. [Google Scholar] [CrossRef]
  85. Aro, E.M.; Virgin, I.; Andersson, B. Photoinhibition of photosystem II. Inactivation, protein damage and turnover. Biochim. Biophys. Acta 1993, 1143, 113–134. [Google Scholar] [CrossRef]
  86. Banks, J.M. Continuous excitation chlorophyll fluorescence parameters: A review for practitioners. Tree Physiol. 2017, 37, 1128–1136. [Google Scholar] [CrossRef]
  87. Gao, Y.; Lu, Y.; Wu, M.; Liang, E.; Li, Y.; Zhang, D.; Yin, Z.; Ren, X.; Dai, Y.; Deng, D.; et al. Ability to remove Na+ and retain K+ correlates with salt tolerance in two maize inbred lines seedlings. Front. Plant Sci. 2016, 7, 1716. [Google Scholar] [CrossRef] [Green Version]
  88. Zaghdoudi, M.; Msilini, N.; Govindachary, S.; Lachaâl, M.; Ouerghi, Z.; Carpentier, R. Inhibition of photosystems I and II activities in salt stress-exposed Fenugreek (Trigonella foenum graecum). J. Photochem. Photobiol. 2011, 105, 14–20. [Google Scholar] [CrossRef] [PubMed]
  89. Demmig-Adams, B.; Adams, W.W., III. Photoprotection and other responses of plants to high light stress. Annu. Rev. Plant Physiol. 1992, 43, 599–626. [Google Scholar] [CrossRef]
  90. Babani, F.; Lichtenthaler, H.K. Light-induced and age-dependent development of chloroplasts in etiolated barley leaves as visualized by determination of photosynthetic pigments, CO2 assimilation rates and different kinds of chlorophyll fluorescence ratios. J. Plant Physiol. 1996, 148, 555–566. [Google Scholar] [CrossRef]
  91. Govindachary, S.; Bukhov, N.G.; Joly, D.; Carpentier, R. Photosystem II inhibition by moderate light under low temperature in intact leaves of chilling-sensitive and -tolerant plants. Physiol. Plant 2004, 121, 322–333. [Google Scholar] [CrossRef]
  92. Kana, R.; Lazar, D.; Prasil, O.; Naus, J. Experimental and theoretical studies on the excess capacity of photosystem II. Photosynth. Res. 2002, 72, 271–284. [Google Scholar] [CrossRef]
  93. Isayenkov, S.V.; Maathuis, F.J.M. Plant Salinity Stress: Many unanswered questions remain. Front. Plant Sci. 2019, 10, 80. [Google Scholar] [CrossRef] [Green Version]
  94. Sitohy, M.Z.; Desoky, E.S.M.; Osman, A.; Rady, M.M. Pumpkin seed protein hydrolysate treatment alleviates salt stress effects on Phaseolus vulgaris by elevating antioxidant capacity and recovering ion homeostasis. Sci. Hortic. 2020, 271, 109495. [Google Scholar] [CrossRef]
  95. Sudhir, P.R.; Pogoryelov, D.; Kovacs, L.; Garab, G.; Murthy, D.S. The effects of salt stress on photosynthetic electron transport and thylakoid membrane proteins in the cyanobacterium Spirulina platensis. J. Biochem. Mol. Biol. 2005, 38, 481–485. [Google Scholar] [CrossRef] [Green Version]
  96. Suo, J.; Zhao, Q.; David, L.; Chen, S.; Dai, S. Salinity response in chloroplasts: Insights from gene characterization. Int. J. Mol. Sci. 2017, 18, 1011. [Google Scholar] [CrossRef] [PubMed]
  97. Blokhina, O.; Virolainen, E.; Fagerstedt, K.V. Antioxidants, oxidative damage and oxygen deprivation stress: A review. Ann. Bot. 2003, 91, 179–194. [Google Scholar] [CrossRef] [PubMed] [Green Version]
  98. Colla, G.; Rouphael, Y.; Canaguier, R.; Svecova, E.; Cardarelli, M. Biostimulant action of a plant-derived protein hydrolysate produced through enzymatic hydrolysis. Front. Plant Sci. 2014, 5, 448. [Google Scholar] [CrossRef] [Green Version]
  99. Carillo, P.; Colla, G.; Fusco, G.M.; Dell’Aversana, E.; El-Nakhel, C.; Giordano, M.; Pannico, A.; Cozzolino, E.; Mori, M.; Reynaud, H.; et al. Morphological and physiological responses induced by protein hydrolysate-based biostimulant and nitrogen rates in greenhouse spinach. Agronomy 2019, 9, 450. [Google Scholar] [CrossRef] [Green Version]
  100. Mir, A.R.; Siddiqui, H.; Alam, P.; Hayat, S. Foliar spray of Auxin/IAA modulates photosynthesis, elemental composition, ROS localization and antioxidant machinery to promote growth of Brassica juncea. Physiol. Mol. Biol. Plants 2020, 26, 2503–2520. [Google Scholar] [CrossRef] [PubMed]
Figure 1. Maximum and minimum air temperature trends, and rainfall during the growing period of hemp.
Agronomy 11 00342 g001
Figure 2. Seeds production of hemp as affected by saline water irrigation (EC0 = non-saline water; EC2 = water at 2.0 dS m−1; EC4 = water at 4.0 dS m−1; EC6 = water at 6.0 dS m−1) and biostimulant application (treated with a commercial legume-derived protein hydrolysate (LDPH) and non-treated (control)).
Agronomy 11 00342 g002
Figure 3. F0 (minimum fluorescence) of hemp leaves in the dark-adapted state (DAS) as affected by saline water irrigation (EC0 = non-saline water; EC2 = water at 2.0 dS m−1; EC4 = water at 4.0 dS m−1; EC6 = water at 6.0 dS m−1) and biostimulant application (treated with a commercial legume-derived protein hydrolysate = PH and non-treated = C) recorded at 9:00 a.m. and at 2:00 p.m. Bars are means ± s.e. (n = 10). Bars with different letters are significantly different according to the Duncan’s test with p ≤ 0.05.
Agronomy 11 00342 g003
Figure 4. Fm (maximum fluorescence) of hemp leaves in the DAS as affected by saline water irrigation (EC0 = non-saline water; EC2 = water at 2.0 dS m−1; EC4 = water at 4.0 dS m−1; EC6 = water at 6.0 dS m−1) and biostimulant application (treated with a commercial legume-derived protein hydrolysate = PH and non-treated = C) recorded at 9:00 a.m. and at 2:00 p.m. Bars are means ± s.e. (n = 10). Bars with different letters are significantly different according to the Duncan’s test with p ≤ 0.05.
Agronomy 11 00342 g004
Figure 5. Fv/Fm of hemp leaves in the DAS as affected by saline water irrigation (EC0 = non-saline water; EC2 = water at 2.0 dS m−1; EC4 = water at 4.0 dS m−1; EC6 = water at 6.0 dS m−1) and biostimulant application (treated with a commercial legume-derived protein hydrolysate = PH and non-treated = C) recorded at 9:00 a.m. and at 2:00 p.m. Bars are means ± s.e. (n = 10). The significance of the interactions between experimental factors (T time of measurement, S salinity level, B biostimulant application) according to Duncan’s test is reported (* p ≤ 0.05, ** p ≤ 0.01, ns non-significant); pairwise comparisons with the Student’s t-test are reported in Table S1.
Agronomy 11 00342 g005
Figure 6. Fv/F0 of hemp leaves in the DAS as affected by saline water irrigation (EC0 = non-saline water; EC2 = water at 2.0 dS m−1; EC4 = water at 4.0 dS m−1; EC6 = water at 6.0 dS m−1) and biostimulant application (treated with a commercial legume-derived protein hydrolysate = PH and non-treated = C) recorded at 9:00 a.m. and at 2:00 p.m. Bars are means ± s.e. (n = 10). The significance of the interactions between experimental factors (T time of measurement, S salinity level, B biostimulant application) according to Duncan’s test is reported (* p ≤ 0.05, ** p ≤ 0.01, ns non-significant); pairwise comparisons with the Student’s t-test are reported in Table S1.
Agronomy 11 00342 g006
Figure 7. ΦPSII (effective quantum yield efficiency of PSII) of hemp leaves in the DAS as affected by saline water irrigation (EC0 = non-saline water; EC2 = water at 2.0 dS m−1; EC4 = water at 4.0 dS m−1; EC6 = water at 6.0 dS m−1) and biostimulant application (treated with a commercial legume-derived protein hydrolysate = PH and non-treated = C) recorded at 9:00 a.m. and at 2:00 p.m. Bars are means ± s.e. (n = 10). The significance of the interactions between experimental factors (T time of measurement, S salinity level, B biostimulant application) according to Duncan’s test is reported (* p ≤ 0.05, ** p ≤ 0.01, ns non-significant); pairwise comparisons with the Student’s t-test are reported in Table S1. The lines show the fluctuation between the 9:00 a.m. and 2.00 p.m. of ΦPSII (values on the right axis) per each salinity level.
Agronomy 11 00342 g007
Table 1. Pattern of soil electrical conductivity (dS m−1) through the hemp cycle in relation to saline water treatments (EC0 = non-saline water; EC2 = water at 2.0 dS m−1; EC4 = water at 4.0 dS m−1; EC6 = water at 6.0 dS m−1).
TreatmentsElectrical Conductivity (dS m−1)
JuneJulyAugustSeptemberOctober
EC00.166 ± 0.0070.195 ± 0.0130.251 ± 0.0130.152 ± 0.0070.161 ± 0.009
EC20.178 ± 0.0150.428 ± 0.0871.019 ± 0.0940.392 ± 0.0570.252 ± 0.027
EC40.158 ± 0.0120.786 ± 0.0931.769 ± 0.1470.552 ± 0.0780.247 ± 0.014
EC60.162 ± 0.0080.998 ± 0.1062.212 ± 0.1180.705 ± 0.0720.228 ± 0.011
Table 2. Hemp yield parameters (number of seeds per plant, seeds average weight, and percentage of seeds weight on inflorescence weight) at harvest in relation to water salinity (EC0 = non-saline water; EC2 = water at 2.0 dS m−1; EC4 = water at 4.0 dS m−1; EC6 = water at 6.0 dS m−1) and biostimulant application (treated with a commercial legume-derived protein hydrolysate (LDPH) and non-treated (control)).
TreatmentsSeeds
% on Inflorescencen° plant−1g 1000−1
Water Salinity (S)
EC020.6 b478.7 a21.7 a
EC218.5 b425.3 b18.1 b
EC421.5 b288.7 c17.0 b
EC624.1 a152.0 d13.1 c
Biostimulant (B)
Control22.1315.7 b16.2 b
LPDH20.2395.8 a18.7 a
Significance
Salinity*****
BiostimulantNS***
S × BNSNSNS
Data within a column followed by different letters are significantly different according to Duncan’s test (p ≤ 0.05). NS, non-significant; *, significant at p ≤ 0.05; **, significant at p ≤ 0.01.
Table 3. Characteristics of hemp plants (residual biomass, plants height, average weight of female plants and harvest index) at harvest in relation to water salinity (EC0 = no-saline water; EC2 = water at 2.0 dS m−1; EC4 = water at 4.0 dS m−1; EC6 = water at 6.0 dS m−1) and biostimulant application (treated with a commercial legume-derived protein hydrolysate (LDPH) and no-treated (control)).
TreatmentsResidual BiomassAverage WeightHeightHI
kg m−2g Female Plant−1Cm
Water Salinity
EC00.10 a20.7 a89.1 a0.26 a
EC20.08 b15.1 b74.4 b0.25 a
EC40.07 b13.2 b77.0 b0.21 b
EC60.04 c7.3 c69.3 b0.18 c
Biostimulant
Control0.06 b12.1 b72.5 b0.22
LPDH0.08 a16.0 a82.4 a0.23
Significance
Salinity*******
Biostimulant****NS
S × BNSNSNSNS
Data within a column followed by different letters are significantly different according to Duncan’s test (p ≤ 0.05). NS, non-significant; *, significant at p ≤ 0.05; **, significant at p ≤ 0.01.
Publisher’s Note: MDPI stays neutral with regard to jurisdictional claims in published maps and institutional affiliations.

