Abstract
Crop area mapping is important for tracking agricultural production and supporting food security. Spaceborne approaches using synthetic aperture radar (SAR) now allow for mapping crop area at moderate spatial and temporal resolutions. Multi-frequency SAR data is highly useful for crop monitoring because backscatter response from vegetation canopies is wavelength dependent. This study evaluates the utility of C-band Sentinel-1B (Sentinel-1) and L-band ALOS-2 (PALSAR) data, collected during the 2019 growing season, for generating accurate active crop extent (crop vs. non-crop) classifications over an agricultural region in western Canada. Evaluations were performed against the Agriculture and Agri-Food Canada satellite-based Annual Cropland Inventory (ACI), an open data product that maps land cover across the extent of Canada’s agricultural land. Classifications were performed using the temporal coefficient of variation (CV) approach, where an optimal crop/non-crop delineating CV threshold (CVthr) is selected according to Youden’s J-statistic. Results show that crop area mapping agreed better with the ACI when using Sentinel-1 data (83.5%) compared to PALSAR (73.2%). Analysis of performance by crop reveals that PALSAR’s poorer performance can be attributed to soybean, urban, grassland, and pasture ACI classes. This study also compared CV values to in situ wet biomass data for canola and soybeans, showing that crops with lower biomass (soybean) had correspondingly lower CV values.
1. Introduction
Global-scale crop area mapping is important for tracking agricultural production and addressing issues relating to food security [1,2]. Conventional approaches for global crop mapping are based heavily on spaceborne approaches using multispectral optical sensors, such as the Moderate Resolution Imaging Spectroradiometer (MODIS), Landsat, Sentinel-2 and others [2]. However, a majority of agricultural fields are just over two hectares in size, making moderate resolution platforms such as MODIS (250 m) unsuitable for mapping these smaller fields [3]. Additionally, optical sensors such as Landsat and Sentinel-2 have a less frequent revisit than MODIS, and as such cloud cover can create large temporal gaps in the data record. Classifications can be less accurate when imaging opportunities are missed during critical crop growth periods [4,5].
Synthetic aperture radar (SAR) sensors offer unique abilities to assess agricultural landscapes due to their near-all-weather capabilities and sensitivity of microwave signals to the dielectric and structural characteristics of soils and crops (i.e., dielectric constant, roughness, orientation and density of canopy), in contrast to those derived from optical instruments [6,7]. Historically, space-based crop monitoring has relied primarily on the exploitation of optical data. The limited use of SAR technologies in operational mapping of soils and crops may be at least partially attributable to: (a) insufficient access to free and open SAR data; (b) lack of large-area acquisition strategies at appropriate scales; (c) poor quality digital elevation models required for processing; (d) complex data structures relative to optical data; and (e) the lack of standardized workflows for SAR data processing for land applications. The increase in the availability of SAR data from Sentinel-1A and 1B has created new opportunities for integrating moderate resolution SAR into operational crop mapping. These data are needed in cloud-prone regions, as well as during critical growth stages, to mitigate image gaps and establish robust monitoring programs [8,9,10].
The optimal SAR frequency for crop identification is canopy dependent. For the sensor to be able to detect crop-related information, there must be a balance between: (1) sufficiently deep penetration of the microwave into the canopy as to permit scattering within the canopy elements; and (2) a sufficiently shallow penetration into the soil, to ensure that the scattering contribution from the soil is relatively small compared to the vegetation. Shorter C-band wavelengths are well suited to smaller biomass canopies as the scattering will originate primarily from within the canopy. However, when significant biomass accumulates due to crop type or growth stage, classification benefits from the data collected at longer L-band wavelengths [11]. Classification accuracies are improved with the integration of SAR data acquired at multiple microwave frequencies [7,12]. Unfortunately, consistent standard coverages of L-band SAR data over global agricultural regions are more limited compared to C-band.
The NASA and Indian Space Research Organization (ISRO) SAR mission, NISAR, is an upcoming satellite mission that will collect data in the L- and S-bands. It is anticipated to launch in late 2022 or early 2023. NISAR will have an open data access policy that will allow for the wider use of L-band SAR for agricultural monitoring. NISAR will operate at a frequency of 1.26 GHz (25 cm wavelength) and have a mean revisit time of 12 days. NISAR science applications will cover a range of different domains. Of specific interest are data products relevant to agriculture such as crop area mapping, soil moisture retrievals and biomass estimation, all of which will be conducted in close collaboration with the United States Department of Agriculture (USDA), the Group on Earth Observations Global Agricultural Monitoring (GEOGLAM) through its underlying research and development group, the Joint Experiment for Crop Assessment and Monitoring (JECAM), and others [13]. NISAR has a science requirement of being able to make crop area estimates at a 1 hectare resolution. This product will be validated over JECAM calibration-validation sites (http://jecam.org/) with an intended classification accuracy exceeding 80% [13].
The NISAR science algorithm for determining crop area consists of a temporal coefficient of variation (CV) approach that has already been applied and described in prior studies. These studies have included the use of SAR data acquired in the C- and L-bands, as well as simulated NISAR L-band data from airborne systems [14,15,16,17]. One of these studies compared biweekly airborne C- and L-band SAR data collected during the growing season (April–August) over an agricultural area in Germany, as part of the 2006 AgriSAR campaign [14]. Using the CV approach, these researchers reported crop classification accuracies of 87% and 79% for the L-band and C-band data, respectively [14]. This is the only study to date which has tested a dense C- and L-band time series for estimating crop area using the temporal CV approach. It is expected that crop area classification accuracies will vary by region of interest (ROI) depending on the relative prevalence of each crop and non-crop class within the ROI, as well as variations in the landscape due to climate, management practices, soils, and terrain. Backscatter can be expected to vary among crop types, and even from field to field planted with the same crop, depending on planting densities, growth stages, crop cultivars, row orientations, and how individual fields are managed (tilling, irrigation, fallowing) [6,18,19].
With the impending launch of NISAR it is imperative to conduct more extensive evaluations of the NISAR Level 2 Cropland Area science algorithm, the temporal CV approach. The objectives of this study are to conduct further testing of the temporal CV approach, specifically with respect to: (1) providing first estimates at the NISAR calibration-validation site in southwestern Canada called Carman; (2) making comparisons of the temporal CV approach between Sentinel-1 C-band and PALSAR-2 L-band SAR data, to help elucidate the differences and synergies between the two frequencies; and (3) to make comparisons between in situ biomass data to the CV values obtained using Sentinel-1 and PALSAR-2 data.
Differences in the performance of L- and C-band SAR are expected among ROIs given differences in crop and non-crops mixes, variations in management practices and different cropping seasons. For example, L-band frequencies may tend to underestimate crop acreages because the CV over low-biomass fields may be small, leading to misclassifications of crop to non-crop. On the other hand, while the C-band would be better at detecting low biomass crops, this higher frequency signal may saturate for high biomass crops, yielding smaller CV values, and leading to classifications as a non-crop. This study examines backscatter response for a single growing season, and as such, CV values may also provide information on crop biomass. For example, CV values are expected to be larger for crops where biomass accumulation over the season is more substantial. Consequently, the magnitude of the CV may inform field-to-field differences in crop biomass.
The innovations of this study are specific to the temporal CV approach and lie in: (1) assessing whether NISAR’s accuracy requirement of 80% can be met at Carman, when using PALSAR-2 L-band data as proxy; (2) determining how classification accuracies vary by crop and frequency; and (3) to use in situ biomass data to examine whether temporal CV values are consistent with crop biomass, using the hypothesis that substantially lower (higher) biomass crops will have substantially lower (higher) temporal CV values.
2. Materials
2.1. Study Area
The region of interest (ROI) for this study is situated in an area of agricultural importance to Canada. Carman is located in southwestern Manitoba, CA, and this region has been a long term site of SAR research dating back to the Shuttle Imaging Radar C (SIR-C) mission. The ROI is an agricultural hot spot located outside Carman, a small town located within Manitoba, Canada (Figure 1a). In 2011, Agriculture and Agri-Food Canada (AAFC) instrumented the Carman site with an in situ soil moisture network (the Real-time In situ Soil Monitoring for Agriculture (RISMA) network; https://agriculture.canada.ca/SoilMonitoringStations/index-en.html) to support RADARSAT-2 research for agricultural monitoring. Carman was also the site of two soil moisture active passive experiments in 2012 and 2016 (SMAPVEX-12 and SMAPVEX16-MB) [20,21]. Satellite and airborne SAR, as well as field data, have been used to develop and test algorithms for crop mapping, crop health monitoring, and biophysical parameter retrievals [21,22,23,24,25].
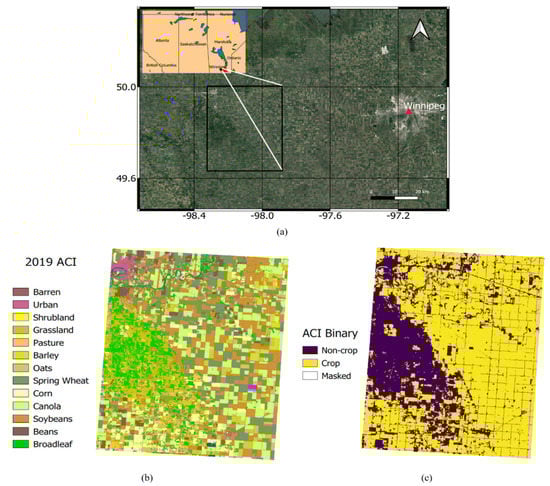
Figure 1.
(a) The heterogeneous agricultural study area located near Carman, Manitoba, Canada (black box); (b) dominant land cover types include annual and perennial crops, with small towns and limited forest and shrub covers; (c) binary classification as crop and non-crop according to the Agriculture and Agri-Food Canada (AAFC) Annual Crop Inventory.
2.2. AAFC Annual Crop Inventory (ACI)
This study uses the 2019 AAFC Annual Crop Inventory (ACI), shown in Figure 1b, as reference for the accuracy assessments [18]. The ACI is in many ways similar to the United States Department of Agriculture (USDA) National Agricultural Statistics Service (NASS) Cropland Data Layer (CDL) [26] in that it is also: (1) generated using remote sensing data trained to in situ collection but using a combination of optical and RADASAT data; (2) operational and updated on annual basis but starting in 2009 compared to 1997 for the CDL; (3) produced on 30 m x 30 m raster grids; and (4) includes detailed land cover classes, encompassing all major annual and perennial crops, and many non-crop classes. The estimated overall accuracy of the ACI with respect to ground validation data has been found to consistently exceed 85% [18]. The ACI for a given year is made available early the following year and is made freely available to the public. ACI data from 2009 onwards can be obtained at https://open.canada.ca/ using the search term “Annual Crop Inventory”. It should be noted that the source ACI has a non-standard coordinate reference system, and to facilitate data processing we reprojected the ACI grids to Universal Transverse Mercator Zone 14 (UTM14) coordinates (EPSG: 32614), which altered the grid spacing to 28.9 m (columns) by 31 m (rows).
According to the 2019 ACI, three crops—spring wheat, canola and soybeans—accounted for nearly three-quarters of the crop acreage at Carman. These crops comprised 25.4%, 21.9%, and 25.2% of the crop extent, respectively. Major non-annual crop cover at the site comprises mostly grasslands and broadleaf forests, which make up 30.9% and 32.5% of acreages not under annual production, respectively. Approximately 67% of the Carman study site is classed as cropland (Figure 1c). The ACI raster data (Figure 1b,c) over Carman consists of a total of 1,503,482 pixels (1117 columns and 1346 rows) of dimension 30 m × 30 m (0.09 ha) with 1,007,294 and 450,042 of them classified as crop and non-crop, respectively. The remaining pixels were masked because they either corresponded to waterbodies (4723 or 0.3%) or pixels outside the ROI (41423 or 2.8%). The rules for classifying the ACI as crop, non-crop, and masked are provided in Table 1. Water pixels need to be masked because these areas have a low signal to noise ratio and may often indicate relatively large CV values that would be falsely classified as crop. For this study, we also considered grassland and pasture as non-crop, although mainly because of an a priori expectation that CV values over those land covers should be relatively smaller owing to these land covers being managed differently, compared to staple crops. After excluding masked pixels and those falling outside the ROI, 1,457,336 ‘valid’ pixels remain, with a breakdown of 69.1% and 30.9% for crop and non-crop, respectively.

Table 1.
Aggregation scheme used for re-classifying the 2019 AAFC Annual Crop Inventory into binary crop/non-crop grids (Figure 1b).
2.3. ALOS-2 PALSAR-2 Data
ALOS-2 PALSAR-2 (PALSAR-2) collected during 2019, at HV-polarization, were used to calculate the CV (Table 2). Data were obtained as the L1.1 CEOS product format, in stripmap mode with nominal resolution of 10 m. PALSAR-2 collects data at an L-band frequency of 1.257 GHz (23.8 cm wavelength). PALSAR-2 data are first converted to the σ0 backscattering coefficient. A Gamma Map speckle filter with a 9 by 9 filter size is applied to suppress speckle noise [27]. The data are then terrain corrected and co-registered using the Range Doppler algorithm with Shuttle Radar Topography Mission (SRTM) 1 arcsecond Digital Elevation Model (DEM) and resampled to 30 m pixel spacing [28,29]. For making comparisons with the ACI, PALSAR-2 data were re-projected to the UTM 14N grids of the ACI using bilinear interpolation. Both ascending and descending data (local time of 12 am or 12 pm) were combined to provide a longer (here, also a denser) time series for using the temporal CV approach described in Section 3. Using longer time series had been shown to provide more accurate classifications [30]. The study region is located in an incidence angle range of 35° to 37.8° for the descending pass and 29.5° to 32.5° for the ascending pass. A priori, there could be concern in that combining datasets of different incidence angle ranges could appreciably impact results. Prior work already examined how the temporal CV algorithm is impacted by combining ascending and descending pass UAVSAR L-band data over a region of interest having a much wider incidence angle range (33°–47°). Those results showed that accuracy was comparable to when only ascending or descending pass data were used, or even improved [31].
Table 2.
PALSAR-2 observation dates (2019) used for computing the coefficient of variation.
2.4. Sentinel-1 Data
Sentinel-1B (Sentinel-1) Ground Range Detected (GRD) data at VH-polarization, acquired for 16 dates in 2019 were used to calculate the CV (Table 3). The Sentinel-1 is in Terrain Observation by Progressive Scans (TOPS) imaging mode, one type of ScanSAR imaging modes. The Path and Frame of the study area are 136 and 158, respectively. Only the ascending data were used, having a local overpass time of 6 pm. Sentinel-1 collects data at the C-band frequency of 5.4 GHz (5.6 cm wavelength). Data were obtained from the Alaska Satellite Facility (ASF) Vertex website (https://search.asf.alaska.edu/). The Sentinel-1 data are first radiometrically corrected to calculate the γ0 backscatter coefficient. Each image is filtered using the Lee sigma filter with 7-by-7 window size [32]. Utilizing an external 90 m SRTM DEM, data were terrain corrected using the SAR Simulation method [33] through cross-correlating a simulated SAR image and the original image, resulting in a 30 m resolution product. For making comparisons with the ACI, Sentinel-1 data were re-projected to the UTM 14N grids of the ACI using bilinear interpolation. We note that the data processing steps between the Sentinel-1 and PALSAR-2 were different ultimately due to PALSAR-2 data sharing restrictions. However, we do not anticipate that the use of two different SAR processing streams would substantially impact analyses, due to temporal CV being a metric of relative change over time.
Table 3.
Sentinel1 observation dates (2019) used for computing the coefficient of variation.
2.5. Ground Truth: Wet Biomass
Above ground wet biomass data were collected from five canola and four soybean fields, and over the course of eight different visits that occurred between 6 June and 1 August 2019 (Table 2 and Table 3). Wet biomass was determined by cutting each plant just above soil level. Each plant was handled individually and placed in a pre-weighed plastic bag. For soybeans, five plants were cut from each of two rows and planting density was used to scale soybean biomass to grams per square meter (gm−2). Samples were collected for one site per field, with the same site revisited for each of the eight field campaigns. A portable scale was used to weigh the wet biomass immediately after collection. Samples were not dried to determine dry biomass, due to lack of available drying ovens. Previous research at Carman clearly demonstrated a strong correlation between wet and dry biomass, for both soybeans and canola [19].
3. Methods
3.1. Crop and Non-Crop Classification
The coefficient of variation (CV) represents the amount of variation in backscatter over time, with higher values indicating greater variation. The premise of the CV approach for delineating crop and non-crop areas is that actively managed agricultural fields experience substantial and frequent change over time as compared to other areas such as urban or forest. Agricultural practices such as tilling, irrigation, and harvesting, and vegetation growth have substantial impacts on the SAR scattering cross sections. Thus, agricultural areas are generally expected to have notably greater CV values compared to non-agricultural regions. CV is calculated as:
where µ is mean and σ is the standard deviation of the backscatter calculated over time for each pixel.
Following the methods of Whelen and Siqueira (2017, 2018), a binary crop and non-crop classification is applied at each pixel by comparing the pixel’s CV value to a CV threshold value (CVthr) [14,15]:
3.2. Performance Metrics
The crop and non-crop classifications were compared to the reference dataset (Section 2.2) using a confusion matrix. The confusion matrix tabulates the number of 0.09 ha pixels for which both datasets agreed on the crop and non-crop pixels, accounting for the true positive (TP) and true negative (TN) counts, respectively. The confusion matrix also calculates the classification errors and their types. False positive errors (FP) are those where the classifications indicated crop, but the reference data did not. False negative errors (FN) are those where the classifications indicated non-crop, but the reference data did not.
The overall accuracy is calculated from the confusion matrix (Table 4) as:
Table 4.
Confusion matrix for crop and non-crop classification.
Solely relying on accuracy as a performance metric is problematic because of its inability to evaluate the model’s classification performance. Trivial cases such as assigning all classifications to be crop (CVthr is 0) or non-crop (CVthr is large, e.g., 1 or greater), may still yield high accuracy values in cases where a study site consists entirely of crop or non-crop, or where a model indicates no skill [16]. Thus, we also employ Cohen’s Kappa (κ) parameter to evaluate the model’s performance. Unlike accuracy, κ also attempts to account for random chance using standard assumptions, and will usually indicate zero values—indicating results obtained by random chance—for the trivial cases above [16,34,35]. Following the methods of McHugh (2012) [35], we calculate Kappa in terms of the four confusion matrix categories (TP, TN, FP, FN) shown in Table 4:
where pO is the observed proportionate agreement, given by
and pe is the overall random agreement probability, given by
where pY and pN respectively are the expected probability of random agreement and disagreement, given by
Possible values of Kappa range between −1.0 to 1.0. Values below zero indicate poor agreement, while 1.0 represents a perfect agreement between the validation data and the SAR-based crop/non-crop classifications.
3.3. Finding the Optimal CVthr Value Using a Receiver Operating Curve Approach
The optimal CVthr value is determined from a receiver operating curve (ROC) approach [36]. The ROC curve is obtained by plotting the true positive rate (Sensitivity) vs. the false positive rate (1-Specificity) of the classifications. Because the Sensitivity and Specificity must be known for the optimization, this step can only be performed when a reference layer such as the ACI is available. Individual points on the ROC curve are obtained by selecting a CVthr value and evaluating how well the classifications performed according to the confusion matrix (Table 4). Sensitivity and specificity are calculated from the confusion matrix:
For each point on the ROC (here, 101 points between 0.00 through 1.00 in 0.01 increments), we use the sensitivity and specificity to calculate the Youden’s J-statistic, J [37]:
J is a measure of separation between the true positive (Sensitivity) and false positive (1-Specificity) [37,38]. In the ROC optimization approach, the optimal CVthr value is that for which J was the largest. It is important to note that this is not necessarily where accuracy is the largest; but in practice, optimal CVthr values do closely match the best accuracy values [16]. The ROC curve is useful because it is an easily interpretable visual representation of classification performance. Classifications are generally poor if the curve falls relatively close to the 1:1 line.
4. Results and Discussion
4.1. Comparison of L- and C-Band CV Values
CV values fell between 0.11 to 3.40 and 0.07 to 2.34 for Sentinel-1 and PALSAR-2 data, respectively (Figure 2). Over the entire scene, the Sentinel-1 and PALSAR-2 data have mean CV values of 0.63 and 0.60 with a standard deviation of 0.24 and 0.30, respectively. Although the range of CV values is smaller for the PALSAR-2 data relative to the Sentinel-1 data, the mean and standard deviation values are comparable. Visually, the PALSAR-2 data has displayed better contrast with the L-band CVs showing clearer differences between fields Figure 2b). The CV values derived from Sentinel-1 appear to have less contrast from field to field (Figure 2a).
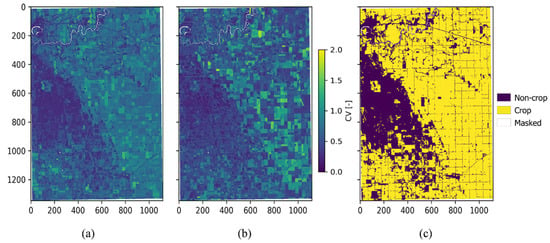
Figure 2.
Coefficient of variation (CV) values for (a) Sentinel-1 and (b) PALSAR-2 data. (c) The Annual Cropland Inventory (ACI) after it had been classified as crop and non-crop. Water is masked (white). Pixels are 29 m × 31 m. The x- and y-values are the coordinates of the pixels in the raster, with 0,0 being the top left corner.
The difference in CV values between the SAR datasets is attributed to differences in SAR frequencies between the C-band Sentinel-1 and PALSAR-2′s L-band. The PALSAR-2 waves are nearly five times longer than those of Sentinel-1 (25 cm compared to 5.6 cm), resulting in differential penetration. L-band waves will interact with leaf and stalk features deeper in the canopy, and depending on biomass and incidence angle, may interact with the soil. Most fields in this region and at this point in the season would have smooth surface roughness relative to L-band frequency, because the surface roughness correlation length is considerably greater than the L-band wavelength [39]. However, variations in soil moisture could contribute to SAR backscatter if penetration is sufficient. In contrast, although C-band Sentinel-1 backscatter values can have a significant dynamic range prior to peak biomass, these shorter wavelengths can saturate with saturation expected to be observed earlier in the season and for lower biomass canopies compared to PALSAR-2 data [40]. The C-band CV may be expected to be higher earlier in the cropping season, but the CV is likely to decrease as peak biomass approaches and the signal saturates. Thus, when computing the CV across all dates, higher early season CV values are averaged with smaller late season CVs. Ultimately the CV metric is impacted by the combination of the length of the time series, the SAR frequency, the specific crop, and any other local factors impacting the scattering cross sections, such as field management practices.
The PALSAR-2 data demonstrates greater field to field variation. Canopy structure (size, shape, and orientation of leaves, stalks, and fruit) varies vertically, and this structure is crop type specific. As such, a longer L-band wave is scattered deeper within the canopy architecture. In addition, L-band backscatter does not saturate until greater biomass accumulation relative to the C-band. Thus, saturation of the L-band signal may not be observed for lower biomass crops like soybeans even at the point of peak biomass. However, because changes in L-band backscatter for low biomass crops can be relatively smaller over time, the CV can also be small, potentially leading to misclassification as non-crop fields. For example, the northeast area of the Carman site is dominated by canola and soybeans (Figure 1b), and PALSAR-2 data shows small CV values (Figure 2b). Whereas Sentinel-1 data indicates greater CV values for both crops in this area, with CV values for canola greater than those of soybeans.
Overall, both datasets are able to clearly indicate that non-crop lands are mainly located in the western portion of the ROI, while the remainder is dominated by crops (Figure 2c). The Sentinel-1 data have similar CV values for most crops (Figure 2a), whereas PALSAR-2 CV values vary from field to field. The L-band data may prove useful for assessing field to field and within field variability in biomass due to site conditions (soil, topography) and crop management, as the L-band CV values appear to capture a greater range of biomass (Figure 2b). However, this sensitivity may lead to higher classification errors with L-band SAR, as the CV values of low biomass crops and for the non-crop classes may be comparable. There may be a trade-off in that the CVthr value that correctly classifies pixels in the top right corner of the image as crop would yield incorrect classifications in the left portion of the image (Figure 2b).
4.2. Classification Performance
ROC curves indicate how well the binary classifications perform over a range of CVthr values. The CVthr values that correspond to points further away from the line of no discrimination yield better results in terms of minimizing and maximizing false and true positives in the classifications. Figure 3 shows that the distance between the line of no discrimination to points on the ROC curve varies substantially for Sentinel-1 (Figure 3a) but remains fairly constant for PALSAR-2 (Figure 3b). The area under the ROC curve (AUC) can be viewed as a measure of expected classification performance over a range of cost parameters and data points [41]. Because of its greater AUC and J values, Sentinel-1 based classifications have greater ability to precisely distinguish active cultivation extent at this site.
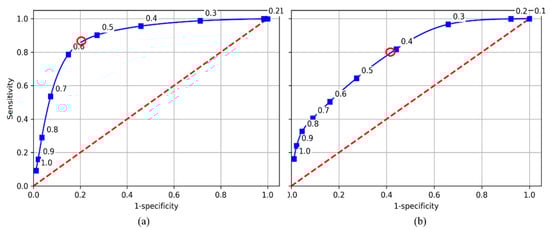
Figure 3.
Receiver operating curves (ROCs) for (a) Sentinel-1 and (b) PALSAR-2 based classifications. The marked points indicate the Sensitivity and 1-Specificity obtained when using a given CVthr value. The dashed line is the line of no discrimination. Red circles indicate the CVthr value yielding the best J-statistic values.
The optimal CVthr value is that which corresponds to the point on the ROC curve that is furthest away from the line of no discrimination, and is given in the ‘J statistic’ row of Table 5. The other rows in Table 5 also show the CVthr values that corresponded to the maxima of the accuracy and κ metrics. Overall, the Sentinel-based classifications (84.8%) performed considerably better than PALSAR-2 (77.4%). Optimal CVthr values are somewhat greater for Sentinel-1 (0.5) than PALSAR-2 (0.3), indicating that crop areas on the whole had relatively greater CV values for Sentinel-1 than for PALSAR-2. This is consistent with results shown in Figure 2: nearly all of the agricultural fields had above average CV values for Sentinel, whereas the PALSAR-2 data also produced below-average CV values over many of them.
Table 5.
Optimal CVthr values as function of performance metric (rows) and observing platform (columns). Values in parentheses show the metric’s maximum value.
The mapped results of the confusion matrix yields information on the classification accuracy and the types of errors as a function of CVthr values (Figure 4). Results for the J-optimized CVthr values for Sentinel-1 (CVthr = 0.56) and PALSAR-2 (CVthr = 0.41) are shown in the center panel. Sentinel-1 results fall close to the maximum possible accuracy: an accuracy of 83.5% was achieved when optimizing for J, compaed to the accuracy of 84.8% when directly optimizing for accuracy. For PALSAR-2, the J-optimized CVthr value achieved an accuracy somewhat further away from the maximum possible (73.2% out of 77.4%). The classification accuracy levels are comparable to the 2006 AgriSAR results, but with performance of C- and L-band reversed. The crop composition of the Carman site is more variable than that of the AgriSAR site. Carman has a mix of high biomass (canola, corn) moderate biomass (wheat) and low biomass (soybean) canopies. This crop composition may be relatively less conducive to L-band measurements and more suitable for C-band measurements. Soybeans are a dominant row crop in this region, with smaller canopies and wide row spacing. The AgriSAR study was focused on a homogeneous area consisting of corn, a high biomass crop [14]. This result supports our initial expectation that classification performance may greatly depend on crop mixes and their prevalences within the ROI. Performance metrics by crop will be examined in more detail in Section 4.3.
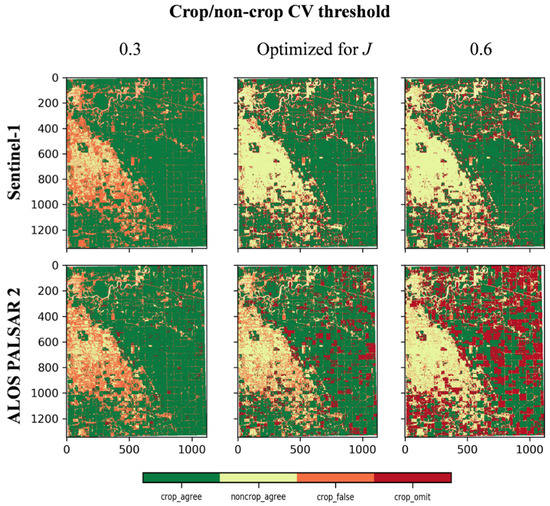
Figure 4.
Crop/non-crop confusion matrix results for classifications based on Sentinel-1 and PALSAR-2 data (columns) as a function of crop delineating threshold (CVthr, rows) shows high rates of crop area omission in the longer L-band PALSAR-2 data at higher thresholds.
The middle panel of Figure 4 also shows that the J-optimized CVthr values yield balanced values between FP and FN: 13% and 14% for PALSAR-2 and 7% and 8% for Sentinel, respectively. At lower CVthr values (e.g., CVthr ≤ 0.3), the vast majority of errors stem from classifying non-crop as crop for both platforms (Figure 4). At higher CVthr values (e.g., CVthr ≥ 0.6), crop omission errors increase, with those for PALSAR-2 (34%) data being substantially greater compared to Sentinel-1 (15%). As indicated in Section 4.1, for PALSAR-2 to accurately detect the top right corner as crop, CVthr values would have to be so low as to produce false crop detections over the non-crop areas in the left portion of the image (CVthr = 0.3), and vice versa (CVthr = 0.6).
Plots of accuracy, J and κ versus CVthr show that these metrics varied more with CVthr values for the Sentinel-1 data than for PALSAR-2 (Figure 5). These metrics also had greater values for nearly every CVthr value for Sentinel-1 data. While the PALSAR-2-based classifications never exceeded a desired accuracy of 80%, it reached 77.4% using a CVthr = 0.31. The Sentinel-based classifications performed close to or above 80% for a wide range of CVthr values, approximately between 0.3 to 0.65. This is nearly twice the range noted in a comparable study, but using L-band data over an agricultural site in Mississippi [16].
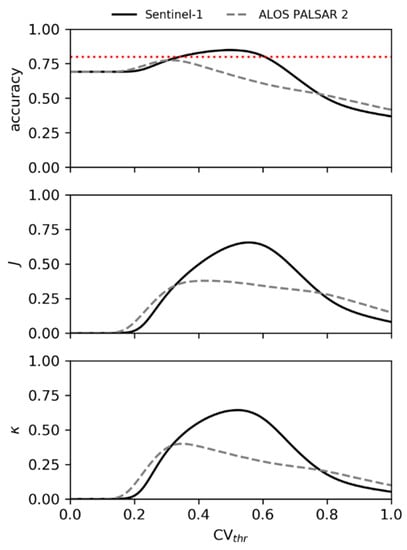
Figure 5.
Plot of the three performance metrics (Accuracy, J-statistic and Cohen’s Kappa) versus the crop/non-crop delineating threshold for Sentinel-1 (solid) and PALSAR-2 (dashed). The horizontal dashed line indicates an accuracy threshold of 80%.
For interpreting how accuracy varies with respect to CVthr, it is important to point out that the ACI indicated a breakdown of crop and non-crop of 69% to 31%. It explains why accuracy approaches 69% and 31% in the limit of small and large CVthr values: small and large CVthr values will result in pixels being classified as crop and non-crop respectively, and accuracy will then resemble the ACI’s crop and non-crop percentages.
4.3. Classification Performance by Land Cover
The performance evaluations were also stratified by the land cover types in the ACI. Spurious land covers were eliminated by only considering those making up more than 2% of the ROI (Section 2.2). Figure 6 shows that 11 land cover type classes remain after applying the 2% threshold to the ACI data, and that these classes account for about 95% of all of the valid pixels. Thus, the 11 ACI classes are highly representative of the dataset, and subsequent analyses of them is expected to accurately describe the ROI.
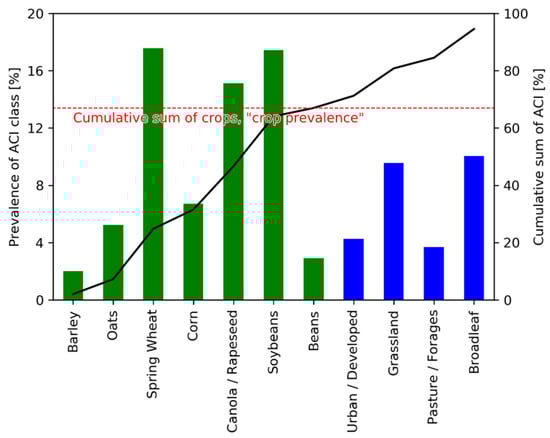
Figure 6.
Plot of the prevalence of each ACI land cover class, colored by crop (green) and non-crop (blue). Because only ACI land cover classes covering more than 2% of the valid pixels are considered, we indicate the respective crop prevalence (horizontal line) and cumulative sum. The figure shows that the analysis can be reduced to 11 ACI land cover classes while still representing nearly all pixels (95%).
Statistics were calculated over all pixels of the same ACI class, specifically the median, 25th (Q1), and 75th (Q3) values, each for the Sentinel-1 and PALSAR-2 CV values. These statistics were then plotted as boxplots along with their respective J-optimized CVthr for comparison and ordered from crop (first 7) to non-crop (last 4) classes (Figure 7).
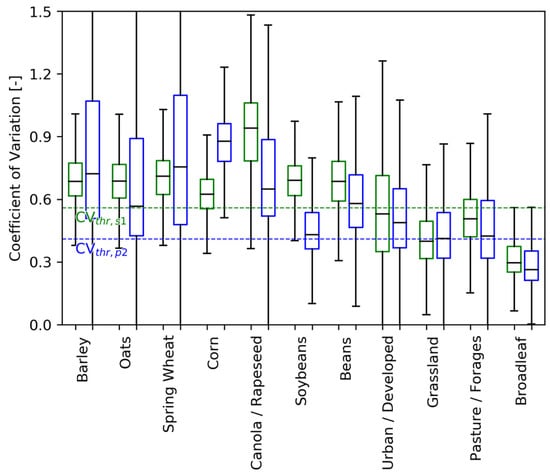
Figure 7.
Boxplot showing the median (horizontal bar inside each box) and the interquartile range of the Sentinel-1 and PALSAR-2 CV data of all ACI land cover classes with prevalence >2%. The IRQ is the difference between the 75th (Q3) and 25th (Q1) percentile value (the upper and lower bounds of the box) and whiskers extend 1.5*IQR above and below Q3 and Q1. Median CV values of most crops (non-crops) are above the respective CVthr value, indicating good (poor) classification accuracy.
Figure 7 shows several notable features: (1) PALSAR-2 data have a much larger range of values (size of the box) for the relatively higher biomass crops than Sentinel-1 (barley, oats, spring wheat and canola); and (2) irrespective of whether C-band or L-band data are used, crop and non-crop classification appears to be robust for most ACI classes, except for soybeans and most of the non-crop classes (minus broadleaf). In all but these cases, the Q1 or Q3 values fell above/below the respective PALSAR-2 and Sentinel-1 CVthr values. For grassland, the Sentinel-1 Q3 value fell well below the CVthr,s1 threshold, whereas the PALSAR-2 median CV value for this class corresponded to CVthr,p2. The same was true for pastures, but with Sentinel-1 Q3 slightly extending above CVthr,s1. For urban, the median Sentinel-1 CV value was just beneath CVthr,s1, while nearly all of the box was above CVthr,p2—indicating that urban would classify better as a crop rather than non-crop for PALSAR-2. Figure 7 also shows interesting features over canola and corn: (1) for corn, PALSAR-2 had a much greater median CV value than CVthr,p2 and also the Sentinel-1 CV median value; (2) for canola, Sentinel-1 had a much greater median CV value than CVthr,s1 and the PALSAR-2 CV median value.
When applying the 2% ACI class prevalence threshold, overall accuracies when using the J-optimized CVthr values were 83.7% and 73.8% for Sentinel-1 and PALSAR-2, respectively. Those accuracy values were slightly above their respective maximum values for J: at J values of 0.66 and 0.38 (Table 5), accuracies are 83.5% and 73.2% for Sentinel-1 and PALSAR-2, respectively. This indicates that the remaining pixels having ACI class prevalence < 2%, 5.46% of all pixels, had somewhat lower classification accuracy than that observed for ACI classes > 2%. Figure 8 shows the accuracy breakdown by ACI class: (1) Sentinel-1 and PALSAR-2 classifications for crop were comparable to one another except for corn and soybeans. PALSAR-2 is far more accurate over corn (96.6%) than Sentinel-1 (73.4%), whereas Sentinel-1 (85.6%) was far more accurate over soybeans compared to PALSAR-2 (57.0%), and this is consistent with results reported by McNairn et al. (2009) [11], who reported that L-band data performed better at classifying high biomass crops and worse at classifying low biomass crops, compared to C-band—for all other crops, classification accuracy fell within a few percentage points; and (2) Sentinel-1 performed substantially better over the non-crop classes compared to PALSAR-2—PALSAR-2 performed quite poorly over all non-crop classes (<50%) except for broadleaf (82.8%), whereas Sentinel-1 only performed poorly over urban (53.4%) and pasture (65.0%) and accuracies were quite good over grassland (86.3%) and broadleaf (93.8%).
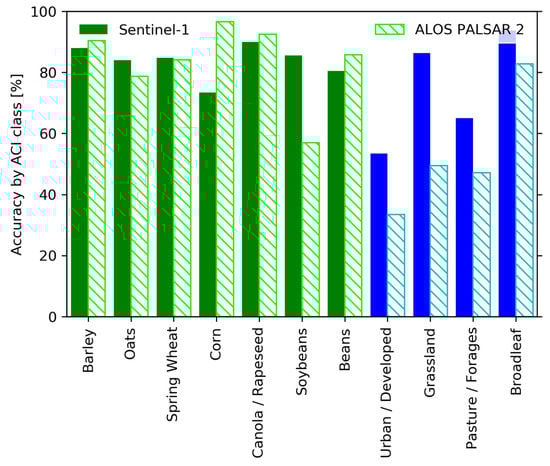
Figure 8.
Bar graph showing the overall accuracy by ACI land cover class with prevalence >2% for the Sentinel-1 (solid bars) and PALSAR-2 (hatched bars) data.
Rangelands type land cover classes, such as grassland and pastures, are difficult to separate from other land covers [18,42,43,44,45]. This is also reflected in our results, Figure 7 and Figure 8 show that classifications of grassland and pasture at L-band are a toss-up; overall accuracy would not appreciably change whether we considered it a crop or non-crop a priori (CV values are close to CVthr, Figure 7), whereas in the C-band, those land covers classify much more clearly as non-crop (CV values are clearly lower than CVthr, Figure 7). Thus, with regards to classification performance, the a priori categorization of grassland and pasture as crop or non-crop was not at the same in the L-band as compared to the C-band.
The relatively poor classifications over urban areas are somewhat surprising, as we would not expect CV values to be particularly large for these targets. However, this issue had also been noted in the 2006 AgriSAR study, where the authors suggested that lower performance could be due to integration of small fields and gardens between buildings in what the reference dataset (the ACI) classified as a non-crop region [14]. It is possible that the relatively poorer performance over urban areas stems from the quality of the reference dataset in those areas, which is something that bears further study. In retrospect, the overall accuracies reported here could be improved by about 2% if urban areas were masked (4.3% prevalence, Figure 6). However, it is not clear that urban areas should be masked a prior, as the physical basis indicates that CV values over urban areas should be relatively smaller compared to active agricultural fields.
These results are generally consistent with the data presented in Figure 7. For example, PALSAR-2 classifications for non-crop classes that performed poorly (urban, pasture, grassland) were expected to perform relatively poorly as the CV values for Q1, median, and Q3 fell relatively closer to CVthr,p2 over those classes.
4.4. Comparison of Coefficient of Variation to In Situ Biomass Data
Figure 7 showed very substantial differences in C- vs. L-band CV values between canola, corn, and soybeans—the IQR boxes defined by Q3–Q1 had nearly no overlap between Sentinel-1 and PALSAR-2. Canola and soybeans had substantially greater CV values I the C-band than the L-band, whereas corn had greater CV values in the L-band (Figure 7). Figure 8 also showed that two of these crops (corn and soybean) exhibited substantial differences in classification accuracy, between Sentinel-1 and PALSAR-2. These results are consistent with the rationale that: (1) low biomass crops (soybean) could be more readily misclassified as non-crop when using L-band, leading to relatively poorer accuracy; and (2) high biomass crops (corn) could be more readily classified as a non-crop due to the signal saturating over time resulting in smaller CV. This section compares CV values to in situ wet biomass measurements of soybean and canola.
AAFC collected data for five canola and four soybean fields located in the southeast of the ROI (Figure 9). Wet biomass was collected at eight different times between 6 June and 1 August 2019. The PALSAR-2 CV data over these fields indicates that, consistent with results in Figure 7, canola has somewhat greater CV values compared to soybeans and relatively greater values in the C-band vs. the L-band. For these sample fields, the median CV values in the L-band were 0.79 for canola and 0.39 for soybeans. In the C-band, the median CV value was 1.22 for canola and 0.79 for soybeans.
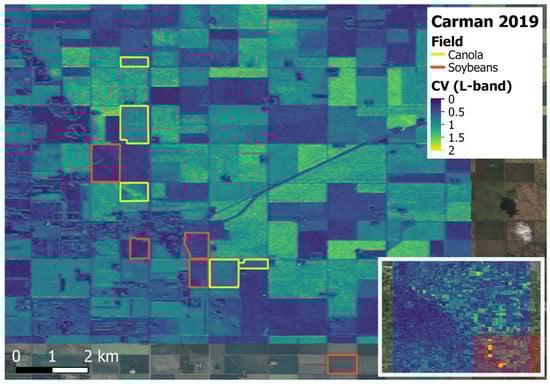
Figure 9.
Biomass fields within the study area.
Because CV values are calculated over time and represent the backscatter information over a range of crop growth stages, we calculated the temporal average of wet biomass in each field to make comparisons (Table 6). Summarizing the biomass results by crop yields 2.24 ± 0.33 kg/m2 and 0.69 ± 0.24 kg/m2 for canola and soybeans, respectively. Thus, canola has about three times greater biomass compared to soybeans. CV values for canola are consistently greater than for soybeans, by a factor of about 2.0 and 1.6 at L-band and C-band, respectively (Table 6).
Table 6.
Field data for wet biomass (time-averaged) and the coefficient of variation (time-averaged).
Consistent with our hypothesis, the crop having substantially greater variations in biomass also had substantially greater CV values (factor of 1.6 to 2.0, depending on SAR frequency). This comparison, although limited to only two crops and nine fields, suggests that CV values might very well contain additional information relating to crop biomass. Also, magnitudes of the CV values over each field are highly consistent with crop biomass; the CV values are substantially larger over canola fields than soybean and the CV values are consistent by crop and SAR frequency. The CV values of canola and soybean are quite different from one another.
The potential dual-use of the temporal CV approach for simultaneous crop area mapping and biomass estimation would be valuable and also convenient, as CV will already be calculated and used for crop area estimates, and this approach has low computational cost. While there clearly are some important caveats (e.g., as described in Section 4.1), it may be possible to develop quantitative estimates of agricultural biomass and ultimately yields using CV in the future, in particular if different SAR frequencies are exploited.
4.5. Limitations
The temporal CV approach is not suitable for making land cover classifications beyond crop or non-crop. This is because the CV values (Q1, Q3, medians) are too similar for the different crop and non-crop sub-classes (Figure 7). For both crop and non-crop sub-classes, boxes have substantial overlap with one another, indicating a lack of distinguishing information for the different classes. The only classes with somewhat distinguishable metrics are canola in the C-band (CV > 0.8) and broadleaf forests at both SAR frequencies (CV < 0.3). Figure 7 also indicates that even the crop versus non-crop classifications are somewhat difficult in the L-band, as crops such as soybeans and beans have CV values in line with non-crop classes. However, other than the urban class, C-band data appears to have fairly good separation between crop and non-crop classes. Thus, with respect to land cover identification, the temporal CV approach appears to be only suitable for crop vs. non-crop classifications.
Also, the ability to use CV data to make biomass estimates is limited. This is because CV values can also be impacted by factors unrelated to biomass itself, such as vegetation structure, orientation, soil moisture, soil roughness, or phenology over time. For example, during the growing season canola will shed its lower leaves, and its biomass will actually decrease for some time. This process however likely will inflate CV value disproportionately compared to the amount of biomass present. But this will also depend on the SAR frequency used, because depending on the upper canopy structure and biomass, the C-band may be more or less sensitive than the L-band to the loss of leaves in the lower canopy.
It is also important to note that CV values in this study were obtained from SAR datasets that have been processed independently of one another, resulting from different workflows. As a result, the underlying data have differences in geocoding, radiometric, and terrain corrections, speckle filtering and backscatter normalization. It is quite common for different SAR data sources (or even the same ones) to undergo different data processing steps and methods. This is also a common limitation when dealing with closed source datasets that restrict data sharing to down processed datasets, i.e., CV values that had been computed on the basis of a separate workflow vs. backscatter data that can be re-processed as needed. One major strength of the temporal CV approach is that it does not consider the absolute values of SAR datasets, because it is a relative change metric describing how the SAR data changes over time relative to its mean value. Thus, we expect that processing differences would only have relative minor impacts. This is supported by other studies having similar findings, i.e., Whelen et al. (2017), and McNairn et al. (2009) [11,14].
5. Conclusions
This study presents first results of the temporal CV approach, an algorithm to be used for NISAR’s Cropland Area product, over a NISAR calibration-validation site located near Carman in Manitoba, Canada. We employed both C- and L-band SAR data from the Sentinel-1B and ALOS-2 PALSAR-2 satellites respectively to generate a crop area estimate. Each pixel was classified as crop if its temporal CV value exceeded a threshold value. The optimal threshold value used in this study was determined using a receiver operating curve approach, which is robust and yielded close to the maximum possible accuracy when using CV values. Evaluations were performed against the Annual Cropland Inventory (ACI), which contains detailed land cover classification on 30 m × 30 m pixels and includes a wide range of crop and non-crop classes. Comparisons show that crop area estimates were considerably better when using the C-band (84%) compared to the L-band over Carman (74%). A more detailed look at the classifications by ACI class revealed that the L-band classifications performed poorly (< 60%) due to classifying many soybean fields as non-crop, and many of the major non-crop classes (urban, grassland, and pasture) as crop. Whereas limiting factors for Sentinel-1 accuracy were relatively poor performances over urban (53%), pasture (65%), and corn (73%). Thus, both frequencies are useful for cropland classifications, and performance over a given region will mainly depend on the crop and non-crop types and their relative prevalence within the ROI. Lastly, because we noted that CV values showed large variation by fields when using PALSAR-2 data, we also sought out available in-situ biomass data to provide further context. Comparisons of CV values to in-situ biomass data collected a eight different times and in nine fields (five canola, four soybeans) revealed that the crop with substantially lower biomass (soybean) also had substantially lower CV values in both the C- and L-bands. This is an interesting result and speaks to the potential opportunity in also using the CV approach for making biomass estimates in addition to computing crop area.
This work, like others but using NISAR’s Level 2 Cropland Area science algorithm (temporal CV), demonstrates the added value of using both C- and L-band SAR data over agricultural areas. L-band retrievals provided added value compared to C-band over corn (97% vs. 73%), whereas C-band data provided added value over soybeans (86% vs. 57%). We also showed that this approach is acceptable for making crop and non-crop classifications with L- and C-band data, but not for crop classifications due to many land cover types having comparable CV values. This and other studies had already indicated that the temporal CV approach appears to be robust and fairly accurate for crop and non-crop classifications. Future work should build on the initial results reported here that CV values might also be useful for making estimates of agricultural biomass and, eventually, crop yields. Such studies will be of particular relevance as open source L-band SAR data becomes available through NISAR in 2022/2023, which will enable frequent and global scale, multi-frequency mapping of agricultural parameters such as crop area, but potentially also crop yields and soil moisture at sub-field scales.
Author Contributions
Conceptualization, N.T. and S.K.; methodology, S.K.; software, S.K., N.T., X.H., X.J.; validation, S.K., X.J., X.H.; formal analysis, S.K., X.J.; investigation, S.K.; resources, M.H.C., P.S., N.T., H.M.; data curation and processing, X.J., X.H., H.M., S.K.; writing—original draft preparation, S.K.; writing—review and editing, all authors; visualization, S.K.; supervision, S.K.; project administration, P.S., M.H.C., N.T., H.M.; funding acquisition, M.H.C., P.S., N.T., H.M. All authors have read and agreed to the published version of the manuscript.
Funding
This research was funded by NASA, grant numbers 80NSSC19K1497 and NNX16AK59G and USDA ARS grant number 58-8042-8-072.
Institutional Review Board Statement
Not applicable.
Informed Consent Statement
Not applicable.
Data Availability Statement
Sentinel-1 data are publicly available from the Alaska Space Facility (ASF). This data can be found here: https://search.asf.alaska.edu/#/. Restrictions apply to ALOS-2 PALSAR-2 data. Data were obtained from the Japanese Space Agency. An example workflow of the temporal CV method for crop non-crop classifications is provided at https://github.com/UMassMIRSL/Coefficient_of_Variation_CropClassification.
Acknowledgments
The authors would like to thank the anonymous reviewers for their time and helpful comments. ALOS-2 PALSAR-2 data were provided by JAXA. ©JAXA/METI ALOS-2 PALSAR-2 L1.0 2019. Appreciation and thanks to all the agencies for providing field and satellite data including AAFC, ESA and JAXA. USDA is an equal opportunity employer and provider.
Conflicts of Interest
The authors declare no conflict of interest. The funders had no role in the design of the study; in the collection, analyses, or interpretation of data; in the writing of the manuscript, or in the decision to publish the results.
References
- Becker-Reshef, I.; Barker, B.; Humber, M.; Puricelli, E.; Sanchez, A.; Sahajpal, R.; McGaughey, K.; Justice, C.; Baruth, B.; Wu, B. The GEOGLAM crop monitor for AMIS: Assessing crop conditions in the context of global markets. Glob. Food Sec. 2019, 23, 173–181. [Google Scholar] [CrossRef]
- Fritz, S.; See, L.; Bayas, J.C.L.; Waldner, F.; Jacques, D.; Becker-Reshef, I.; Whitcraft, A.; Baruth, B.; Bonifacio, R.; Crutchfield, J. A comparison of global agricultural monitoring systems and current gaps. Agric. Syst. 2019, 168, 258–272. [Google Scholar] [CrossRef]
- Yan, L.; Roy, D.P. Conterminous United States crop field size quantification from multi-temporal Landsat data. Remote Sens. Environ. 2016, 172, 67–86. [Google Scholar] [CrossRef]
- Gong, P.; Yu, L.; Li, C.; Wang, J.; Liang, L.; Li, X.; Ji, L.; Bai, Y.; Cheng, Y.; Zhu, Z. A new research paradigm for global land cover mapping. Ann. GIS 2016, 22, 87–102. [Google Scholar] [CrossRef]
- Yu, L.; Wang, J.; Clinton, N.; Xin, Q.; Zhong, L.; Chen, Y.; Gong, P. FROM-GC: 30 m global cropland extent derived through multisource data integration. Int. J. Digit. Earth 2013, 6, 521–533. [Google Scholar] [CrossRef]
- McNairn, H.; Brisco, B. The application of C-band polarimetric SAR for agriculture: A review. Can. J. Remote Sens. 2004, 30, 525–542. [Google Scholar] [CrossRef]
- McNairn, H.; Shang, J. A review of multitemporal synthetic aperture radar (SAR) for crop monitoring. In Multitemporal Remote Sensing; Springer: Berlin/Heidelberg, Germany, 2016. [Google Scholar]
- Bouvet, A.; Le Toan, T. Use of ENVISAT/ASAR wide-swath data for timely rice fields mapping in the Mekong River Delta. Remote Sens. Environ. 2011, 115, 1090–1101. [Google Scholar] [CrossRef]
- Nelson, A.; Setiyono, T.; Rala, A.B.; Quicho, E.D.; Raviz, J.V.; Abonete, P.J.; Maunahan, A.A.; Garcia, C.A.; Bhatti, H.Z.M.; Villano, L.S. Towards an operational SAR-based rice monitoring system in Asia: Examples from 13 demonstration sites across Asia in the RIICE project. Remote Sens. 2014, 6, 10773–10812. [Google Scholar] [CrossRef]
- Torbick, N.; Chowdhury, D.; Salas, W.; Qi, J. Monitoring rice agriculture across myanmar using time series Sentinel-1 assisted by Landsat-8 and PALSAR-2. Remote Sens. 2017, 9, 119. [Google Scholar] [CrossRef]
- McNairn, H.; Shang, J.; Jiao, X.; Champagne, C. The contribution of ALOS PALSAR multipolarization and polarimetric data to crop classification. IEEE Trans. Geosci. Remote Sens. 2009, 47, 3981–3992. [Google Scholar] [CrossRef]
- Steele-Dunne, S.C.; McNairn, H.; Monsivais-Huertero, A.; Judge, J.; Liu, P.-W.; Papathanassiou, K. Radar remote sensing of agricultural canopies: A review. IEEE J. Sel. Top. Appl. Earth Obs. Remote Sens. 2017, 10, 2249–2273. [Google Scholar] [CrossRef]
- NISAR Science Team. NISAR Science Users’ Handbook. Available online: https://nisar.jpl.nasa.gov/files/nisar/NISAR_Science_Users_Handbook.pdf (accessed on 1 June 2020).
- Whelen, T.; Siqueira, P. Time series analysis of L-Band SAR for agricultural landcover classification. In Proceedings of the 2017 IEEE International Geoscience and Remote Sensing Symposium (IGARSS), Fort Worth, TX, USA, 23–28 July 2017; pp. 5342–5345. [Google Scholar]
- Whelen, T.; Siqueira, P. Coefficient of variation for use in crop area classification across multiple climates. Int. J. Appl. Earth Obs. Geoinf. 2018, 67, 114–122. [Google Scholar] [CrossRef]
- Kraatz, S.; Rose, S.; Cosh, M.; Torbick, N.; Huang, X.; Siqueira, P. Performance Evaluation of UAVSAR and Simulated NISAR Data for Crop/Non-crop Classification over Stoneville, MS. Earth Sp. Sci. 2020. [Google Scholar] [CrossRef]
- Jpl, N. Simulated NISAR Data. Available online: https://uavsar.jpl.nasa.gov/science/documents/nisar-sample-products.html (accessed on 1 June 2020).
- McNairn, H.; Champagne, C.; Shang, J.; Holmstrom, D.; Reichert, G. Integration of optical and Synthetic Aperture Radar (SAR) imagery for delivering operational annual crop inventories. ISPRS J. Photogramm. Remote Sens. 2009, 64, 434–449. [Google Scholar] [CrossRef]
- Wiseman, G.; McNairn, H.; Homayouni, S.; Shang, J. RADARSAT-2 polarimetric SAR response to crop biomass for agricultural production monitoring. IEEE J. Sel. Top. Appl. Earth Obs. Remote Sens. 2014, 7, 4461–4471. [Google Scholar] [CrossRef]
- McNairn, H.; Jackson, T.J.; Wiseman, G.; Belair, S.; Berg, A.; Bullock, P.; Colliander, A.; Cosh, M.H.; Kim, S.-B.; Magagi, R. The soil moisture active passive validation experiment 2012 (SMAPVEX12): Prelaunch calibration and validation of the SMAP soil moisture algorithms. IEEE Trans. Geosci. Remote Sens. 2014, 53, 2784–2801. [Google Scholar] [CrossRef]
- Bhuiyan, H.A.K.M.; McNairn, H.; Powers, J.; Friesen, M.; Pacheco, A.; Jackson, T.J.; Cosh, M.H.; Colliander, A.; Berg, A.; Rowlandson, T. Assessing SMAP soil moisture scaling and retrieval in the Carman (Canada) study site. Vadose Zone J. 2018, 17, 1–14. [Google Scholar] [CrossRef]
- Colliander, A.; Cosh, M.H.; Misra, S.; Jackson, T.J.; Crow, W.T.; Powers, J.; McNairn, H.; Bullock, P.; Berg, A.; Magagi, R. Comparison of high-resolution airborne soil moisture retrievals to SMAP soil moisture during the SMAP validation experiment 2016 (SMAPVEX16). Remote Sens. Environ. 2019, 227, 137–150. [Google Scholar] [CrossRef]
- Mandal, D.; Kumar, V.; Lopez-Sanchez, J.M.; Bhattacharya, A.; McNairn, H.; Rao, Y.S. Crop biophysical parameter retrieval from Sentinel-1 SAR data with a multi-target inversion of Water Cloud Model. Int. J. Remote Sens. 2020, 41, 5503–5524. [Google Scholar] [CrossRef]
- Kahimba, F.C.; Ranjan, R.S.; Mann, D.D. Modeling soil temperature, frost depth, and soil moisture redistribution in seasonally frozen agricultural soils. Appl. Eng. Agric. 2009, 25, 871–882. [Google Scholar] [CrossRef]
- McNairn, H.; Jiao, X.; Pacheco, A.; Sinha, A.; Tan, W.; Li, Y. Estimating canola phenology using synthetic aperture radar. Remote Sens. Environ. 2018, 219, 196–205. [Google Scholar] [CrossRef]
- Boryan, C.; Yang, Z.; Mueller, R.; Craig, M. Monitoring US agriculture: The US Department of Agriculture, National Agricultural Statistics Service, Cropland Data Layer Program. Geocarto Int. 2011, 26, 341–358. [Google Scholar] [CrossRef]
- Lopes, A.; Nezry, E.; Touzi, R.; Laur, H. Maximum a posteriori speckle filtering and first order texture models in SAR images. In Proceedings of the 10th Annual International Symposium on Geoscience and Remote Sensing, College Park, MD, USA, 20–24 May 1990; pp. 2409–2412. [Google Scholar]
- Dingle Robertson, L.; Davidson, A.; McNairn, H.; Hosseini, M.; Mitchell, S.; De Abelleyra, D.; Verón, S.; Cosh, M.H. Synthetic Aperture Radar (SAR) image processing for operational space-based agriculture mapping. Int. J. Remote Sens. 2020, 41, 7112–7144. [Google Scholar] [CrossRef]
- Wu, C.; Liu, K.Y.; Jin, M. Modeling and a correlation algorithm for spaceborne SAR signals. IEEE Trans. Aerosp. Electron. Syst. 1982, AES-18, 563–575. [Google Scholar] [CrossRef]
- Huang, X.; Reba, M.; Coffin, A.; Runkle, B.R.; Huang, Y.; Chapman, B.D.; Ziniti, B.; Skakun, S.; Kraatz, S.; Siqueira, P.; et al. Cropland mapping with L-band UAVSAR and development of NISAR products. Remote Sens. Environ. 2021. [Google Scholar] [CrossRef]
- Kraatz, S.; Cosh, M.; Torbick, N.; Huang, X.; Siqueira, P. Evaluating the robustness of NISAR’s cropland algorithm to time of observation, observing mode and dithering. In Proceedings of the AGU Fall Meeting Abstracts, San Francisco, CA, USA, 30 November–16 December 2020. [Google Scholar]
- Lee, J.-S.; Wen, J.-H.; Ainsworth, T.L.; Chen, K.-S.; Chen, A.J. Improved sigma filter for speckle filtering of SAR imagery. IEEE Trans. Geosci. Remote Sens. 2008, 47, 202–213. [Google Scholar]
- Veci, L.; Prats-Iraola, P.; Scheiber, R.; Collard, F.; Fomferra, N.; Engdahl, M. The sentinel-1 toolbox. In Proceedings of the Proceedings of the IEEE International Geoscience and Remote Sensing Symposium (IGARSS), Quebec City, QC, Canada, 14–18 July 2014; pp. 1–3. [Google Scholar]
- Cohen, J. A coefficient of agreement for nominal scales. Educ. Psychol. Meas. 1960, 20, 37–46. [Google Scholar] [CrossRef]
- McHugh, M.L. Interrater reliability: The kappa statistic. Biochem. Med. Biochem. Med. 2012, 22, 276–282. [Google Scholar] [CrossRef]
- Fan, J.; Upadhye, S.; Worster, A. Understanding receiver operating characteristic (ROC) curves. Can. J. Emerg. Med. 2006, 8, 19–20. [Google Scholar] [CrossRef]
- Youden, W.J. Index for rating diagnostic tests. Cancer 1950, 3, 32–35. [Google Scholar] [CrossRef]
- Habibzadeh, F.; Habibzadeh, P.; Yadollahie, M. On determining the most appropriate test cut-off value: The case of tests with continuous results. Biochem. Med. Biochem. Med. 2016, 26, 297–307. [Google Scholar] [CrossRef] [PubMed]
- Manns, H.R.; Berg, A.A.; Bullock, P.R.; McNairn, H. Impact of soil surface characteristics on soil water content variability in agricultural fields. Hydrol. Process. 2014, 28, 4340–4351. [Google Scholar] [CrossRef]
- McNairn, H.; Ellis, J.; Van Der Sanden, J.J.; Hirose, T.; Brown, R.J. Providing crop information using RADARSAT-1 and satellite optical imagery. Int. J. Remote Sens. 2002, 23, 851–870. [Google Scholar] [CrossRef]
- Flach, P.A.; Hernández-Orallo, J.; Ramirez, C.F. A coherent interpretation of AUC as a measure of aggregated classification performance. In Proceedings of the ICML, Bellevue, WA, USA, 28 June–2 July 2011. [Google Scholar]
- Lark, T.J.; Mueller, R.M.; Johnson, D.M.; Gibbs, H.K. Measuring land-use and land-cover change using the US department of agriculture’s cropland data layer: Cautions and recommendations. Int. J. Appl. Earth Obs. Geoinf. 2017, 62, 224–235. [Google Scholar] [CrossRef]
- Fisette, T.; Davidson, A.; Daneshfar, B.; Rollin, P.; Aly, Z.; Campbell, L. Annual space-based crop inventory for Canada: 2009–2014. In Proceedings of the 2014 IEEE Geoscience and Remote Sensing Symposium, Quebec City, QC, Canada, 13–18 July 2014; pp. 5095–5098. [Google Scholar]
- Lindsay, E.J.; King, D.J.; Davidson, A.M.; Daneshfar, B. Canadian prairie rangeland and seeded forage classification using multiseason Landsat 8 and Summer RADARSAT-2. Rangel. Ecol. Manag. 2019, 72, 92–102. [Google Scholar] [CrossRef]
- Waske, B.; Braun, M. Classifier ensembles for land cover mapping using multitemporal SAR imagery. ISPRS J. Photogramm. Remote Sens. 2009, 64, 450–457. [Google Scholar] [CrossRef]
Publisher’s Note: MDPI stays neutral with regard to jurisdictional claims in published maps and institutional affiliations. |
© 2021 by the authors. Licensee MDPI, Basel, Switzerland. This article is an open access article distributed under the terms and conditions of the Creative Commons Attribution (CC BY) license (http://creativecommons.org/licenses/by/4.0/).