Abstract
Paddy soil is an important emission source of agricultural greenhouse gases. The excessive application of chemical fertilizer to paddy soil is one of the important reasons for high greenhouse gas emissions. Emissions can be reduced through optimized agricultural management measures. The incorporation of Chinese milk vetch (CMV) and rice straw in the field to replace some of the chemical fertilizer can reduce the emissions of greenhouse gases, but the relationship between these emissions and soil properties after the incorporation of CMV and rice straw is unclear. Through the continuous determination of greenhouse gases and the physical and chemical properties of soil, it was found that the addition of CMV and straw could increase the emissions of methane (CH4) and carbon dioxide (CO2), but nitrous oxide (N2O) emissions were lower. The effect of the combined incorporating of CMV and rice straw on soil properties was more significant than CMV alone. It was also found that CH4 and CO2 emissions were positively correlated with microbial biomass carbon and nitrogen, pH, and soil catalase and β-xylosidase activities. In practice, we can reduce greenhouse gas emissions by water and fertilizer management.
1. Introduction
From a global perspective, the issue of climate warming is an emerging problem, and reducing non-carbon dioxide greenhouse gas emissions is a relatively fast way to reduce the impact of greenhouse gases on climate warming [1]. The agricultural sector is an important source of artificial greenhouse gas emissions, and proper farmland management can reduce agricultural greenhouse gas emissions [2,3]. Methane is the most abundant non-CO2 greenhouse gas [1], and rice cultivation is an important source of methane emissions in agricultural production [4]. N2O is one of the three most important atmospheric greenhouse gases (CO2, CH4, and N2O). The warming potential of N2O is 298 times that of CO2, and N2O is also the most important ozone-depleting gas [5,6]. Although the main greenhouse gas emitted from rice fields is methane, N2O cannot be ignored. Intermittent irrigation to reduce CH4 emissions will lead to increased rice field N2O emissions [7]. The excessive use of nitrogen fertilizer in agricultural production is the main cause of greenhouse gas emissions [1,8], so it is important to identify farmland management measures to reduce the use of chemical fertilizers.
Chinese milk vetch (CMV; Astragalus sinicus L.) is the traditional winter crop in paddy fields in southern China. CMV, used as green manure, can effectively reduce chemical fertilizer application and increase rice yield [9] while increasing the nitrogen use efficiency and soil organic matter content [10]. Long-term rotation of rice and CMV can increase soil fertility, improve soil pH, change the soil microbial community structure, increase the number of beneficial bacteria [11,12], improve the soil ecological environment, and fix nitrogen. Incorporating rice straw in the field can improve the nitrogen use efficiency, rice yield, and soil carbon balance [13], but also increase methane emissions during the rice growing season [9,14]. Studies have found that the C:N ratio in plant residues is an important factor for N2O emissions; the lower the C:N ratio, the higher the N2O emissions [15]. However, the correlation between greenhouse gas emissions and soil physical and chemical factors under mixed incorporation of CMV and rice straw in the soil remains unclear.
Based on previous research, we collected soil samples from double-cropping rice paddy soil and conducted incubation experiments to investigate the greenhouse gas emission trend of paddy soil and its correlation with soil factors under the influence of CMV and rice straw.
2. Materials and Methods
2.1. Treatments and Experimental Set-Up
Soil was collected from the cultivated layer (0–20 cm) of the long-term double-cropping rice field at Dengjiabu Rice Seed Farm (116.85° N, 28.22° E), Yingtan, Jiangxi Province. The soil was fertile silt loam, which was naturally air-dried and sieved through a 1 mm sieve. The experiment included three treatments: no addition of CMV and rice straw as a control (NSV), the addition of CMV alone (V), and the addition of CMV and straw (SV). Each treatment was replicated three times. The initial pH of the cultivated soil in the experimental field was 5.10, and the total carbon was 17.50 g kg−1. The total nitrogen, alkaline nitrogen, available phosphorus, and available potassium contents were 1.83 g kg−1, 218.76 mg kg−1, 10.31 mg kg−1, and 58.49 mg kg−1, respectively. The soil bulk density was 1.11 g cm−3, and the water content was 60.93%.
The water content of the CMV during the flowering period was 88%, the organic carbon content was 350.52 g kg−1, the nitrogen content was 25.4 g kg−1, and the C:N ratio was 13.8. Fresh CMV and rice straw were cut into 2–3 mm segments and mixed before use.
Our study was carried out by constant temperature micro-culture under dark conditions, using glass jars (500 mL, bottom diameter 8.2 cm, top diameter 5 cm), with an air-tight rubber lid. In total, 120 g of naturally air-dried soil was placed in each bottle and incubated at 60% water-filled pore space (WFPS) for 7 days under dark conditions to restart microbial activity before the application of treatments. After 7 days of pre-cultivation, we collected the gas from each jar as the initial gas sample; then, 1.8 g fresh CMV was added to all treatments except NSV, and 0.5 g of straw was added at the same time to the SV treatment. We added 20 mL of deionized water to each treatment; this was followed by thorough mixing, and an approximate 1 mm water layer was maintained, then each jars’ sample was weighed separately. The soil water content was maintained under flooded conditions by weighing the jars and adding distilled water on alternate days. All treatments were randomly distributed under the same incubation conditions, and another set of the same treatments was used for soil sampling. All sample bottles were covered with tinfoil with pinholes (to maintain ventilation) to reduce excessive moisture evaporation and were incubated at 30 ± 1 °C in a controlled chamber for 52 days (until the emission of three gases tended to be stable).
2.2. Gas Sampling and Analysis
Gas samples were collected from jars after treatment initiation. The gas sampling method was adopted as described by Maucieri et al. [16]. Two gas samples, immediately after closure (T0) and after 60 min (T1), were collected from the headspace of the jars using a 20 mL syringe. Airtight three-way stop-cock syringes were used to collect the gas samples. After sampling, the bottles were covered with tinfoil. Gas samples were analyzed within 2 days by a gas chromatograph (Agilent 7890B, Santa Clara, CA, USA) equipped with a flame ionization detector (FID) for CH4 and CO2 analysis, and an electronic capture detector (ECD) for N2O analysis. During incubation, gas was collected between 8 a.m. and 10 a.m. Gas sampling was performed after added CMV and straw on days 0, 1, 2, 3, 4, 5, 6, 8, 10, 13, 17, 24, 31, 38, 45, and 52 (the frequency of gas collection according to the change of gas emission).
Greenhouse gas fluxes were calculated by the following equation [15,17,18]:
where is the emission flux rate of CO2 (μg·g−1·h−1), CH4 (ng·g−1·h−1), or N2O (ng·g−1·h−1); is the standard atmospheric pressure (Pa); is the head space volume (cm3); is the concentration of CO2 (ppm), CH4 (ppb) or N2O (ppb) produced during the chamber was sealed; is the time between sample collections (h); is the general gas constant; is the absolute value of the incubation temperature (K); is the molecular weight of CO2, CH4 or N2O (g·mol−1); and is the soil quality based on dry weight (g).
The cumulative greenhouse gas (GHG) emissions were calculated as follows:
where is the cumulative CO2 (μg·g−1), CH4 (ng·g−1) or N2O (ng·g−1) emissions; is the sampling interval, day (d); and is the number of gas acquisition samples [19].
2.3. Soil Sampling and Analysis
Soil samples were collected to measure nitrate nitrogen and ammonium nitrogen on days 3, 9, 34, and 52. We sampled and analyzed soil parameters on day 52.
Soil pH was measured using a 1:2.5 soil–water extraction method with a glass electrode (E-301-CF; LEICI, Shanghai, China). Concentrations of nitrate and ammonium nitrogen were assessed using a flow injection analyzer (FIA automated ion analyzer, Lachat Instruments, Loveland, CO, USA). Total carbon was measured by dry combustion with a macro elemental analyzer (Vario MAX C/N; Elementar Analysensysteme, Hanau, Germany). Total nitrogen (TN) in soil was determined by the Kjeldahl method [20]. Soil microbial biomass carbon (MBC) and microbial biomass nitrogen (MBN) were determined by chloroform fumigation and K2SO4 extraction, respectively [21,22]. Catalase was determined by the scat-1-y kit (Comin Biotechnology Co., Ltd, Suzhou, China) and glucosidase by the sbxys-1-y kit (Comin Biotechnology Co., Ltd, Suzhou, China). Soil easily-oxidized organic carbon (EOC) was determined by the 333 mmol L−1 potassium permanganate oxidation method [23].
R (v. 4.0.0) [24] was used for all analysis of variance. Significant effect between treatments was tested using least significant difference (LSD). Spearman correlation analysis was conducted to find out the relationship between greenhouse gases and soil factors. Related packages including agricolae [25], ggplot2 [26], PerformanceAnalytics [27], corrplot [28], and dplyr [29] were used for data analysis and plotting.
3. Results
3.1. Greenhouse Gas Dynamics
During the cultivation period, the CO2 emissions of the SV and V treatments exhibited peak values on the second day after the addition of CMV and then decreased. The emission peaks of the SV and V treatments showed no significant difference. Emissions from the NSV treatment peaked on the first day and then continued to decline. After 30 days of incubation, the CO2 emissions of all treatments tended to be stable (Figure 1).
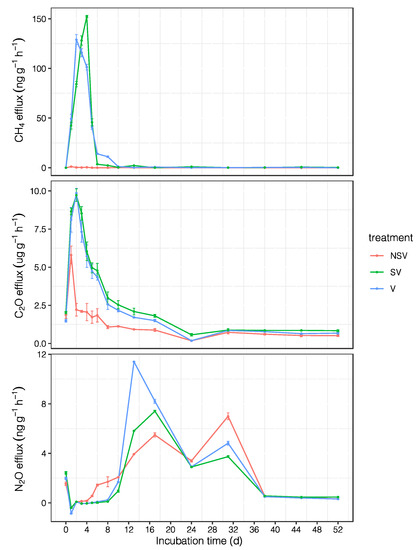
Figure 1.
The daily emission dynamics of CO2, CH4, and N2O from the NSV, SV, and V treatments during the incubation period. NSV: no added CMV and straw; SV: added CMV and straw; V: only added CMV. Error bars represent the standard error (n = 3).
In the SV and V treatments, CH4 emission peaks appeared from the fourth and second day, with peaks of 152.29 ± 1.11 ng g−1 h−1 and 129 ± 5.04 ng g−1 h−1, respectively. Then, the two emission values gradually decreased; after 13 days, they tended to be stable. With respect to the NSV treatment, methane emissions were consistently low during the incubation cycle; the highest value was 1.13 ng g−1 h−1, and a negative value appeared after 13 days (Figure 1).
In contrast to the information presented above, N2O emissions peaked twice. The first peak values of NSV, SV, and V were 5.49 ± 0.17 ng g−1 h−1, 7.41 ± 0.07 ng g−1 h−1, and 11.4 ± 0.03 ng g−1 h−1, respectively; the second emission peak appeared on the 31st day, and the time span for maintaining high emission longer than CO2 and CH4, followed by a gradual decrease and then stabilization (Figure 1).
3.2. Cumulative Greenhouse Gas (GHG) Emissions
The cumulative CO2 emissions of the SV treatment reached 2.47 ± 0.11 mg g−1, which was 2.12 times the value of the NSV treatment, and the cumulative emissions of the V treatment were 1.83 times those of the NSV treatment. The cumulative CH4 emissions of the V treatment were 11.81 ± 0.16 μg g−1; this value was not significantly different from that of the SV treatment and was 274 times that of the NSV treatment. The cumulative N2O emissions from the V treatment were 3.68 ± 0.01 μg g−1, and the lowest value (SV treatment) was 2.93 ± 0.03 μg g−1 (Figure 2).
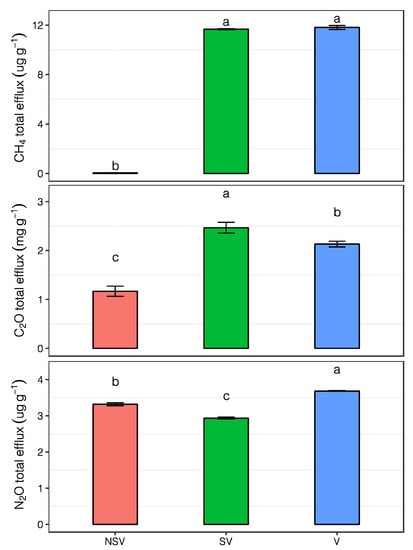
Figure 2.
The cumulative emissions of CO2, CH4, and N2O from the NSV, SV, and V treatments. Error bars represent the standard error (n = 3). Bars with different letters indicate a significant difference among treatments (p < 0.05).
3.3. The Change Trends of Soil Nitrate and Ammonium Nitrogen
From the measured data, we observed that on the third day of culture, the concentration of ammonium nitrogen was the highest, after which the concentration continued to decline. The nitrate nitrogen concentration in the SV and V treatments reached the peak value around the 35th day of culture and then decreased. There was no obvious peak value in the NSV treatment (Figure 3).
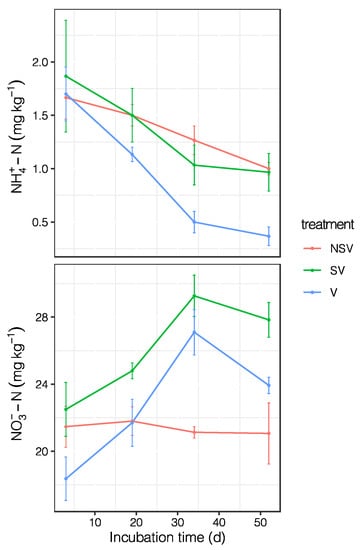
Figure 3.
The dynamics of ammonium nitrogen and nitrate nitrogen during the incubation period. Error bars represent the standard error (n = 3).
3.4. Effect of CMV and Rice Straw on Soil Properties
The addition of CMV alone or in combination with straw had positive effect on total carbon (TC), easily-oxidized organic carbon (EOC), microbial biomass carbon (MBC), microbial biomass nitrogen (MBN), pH and the activity of catalase (CAT) and β-xylosidase. The MBC and MBN contents of SV were 1.95 and 1.81 times that of CK respectively. On the whole, the combined application of CMV and straw was more effective as compared to the sole application of CMV (Table 1).

Table 1.
Effect of CMV and rice straw on soil factors.
3.5. Correlation between Greenhouse Gas Emissions and Soil Properties
It can be seen from Figure 4 that the cumulative CO2 emissions were positively correlated with easily-oxidized organic carbon, MBC, MBN, pH, catalase, and β-xylosidase. Among these correlations, those with MBC and MBN were 0.9 and 0.92, respectively. The cumulative CH4 emissions had the strongest correlation with catalase, with a correlation coefficient of 0.9, followed by MBC, MBN, and β-xylosidase. N2O was negatively correlated with MBC and MBN, and the correlation coefficient was 0.5.
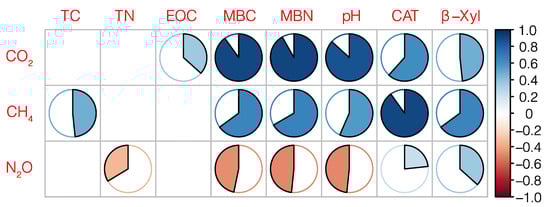
Figure 4.
The correlations between cumulative greenhouse gas emissions and soil physicochemical properties. The shaded area represents the strength of the correlation. Empty boxes represent correlation absolute values of less than 0.2. TC: total carbon; TN: total nitrogen; EOC: easily-oxidized organic carbon; MBC: microbial biomass carbon; MBN: microbial biomass nitrogen; CAT: catalase; β-Xyl: β-xylosidase.
4. Discussion
4.1. Effect of CMV and Straw on Greenhouse Gas Emissions
The V and SV treatments significantly increased CH4 emissions compared to the NSV treatment (Figure 1). Fresh CMV has a low C:N ratio; it readily decomposes when mixed in the soil and can rapidly provide nutrients for the next crop. However, after the addition of CMV, an interaction between organic matter and soil microorganisms occurs [30]. The mineralization of organic carbon in CMV accelerates soil respiration and increases CO2 emissions [14]. At the same time, methanogens reproduce after flooding, and CH4 emissions increase [31]. The combined incorporation of straw and CMV did not significantly increase CH4 emissions, which may be related to the high C:N ratio of the straw and the slow mineralization rate of the main component (cellulose). From the perspective of the entire incubation cycle, high CH4 emissions last for a short period of time, and this stage is a key period for controlling methane emissions. Reasonable measures should be taken to reduce CH4 emissions, reduce soil organic carbon loss, and increase carbon sequestration.
More than two-thirds of the N2O emissions from the soil can be attributed to the denitrification and nitrification processes of bacteria and fungi [32]. In this experimental cycle, the first N2O emission peaks occurred after the CH4 and CO2 emissions decreased significantly. The cumulative N2O emissions of the SV treatment were the lowest, while those of the V treatment were the highest. Nitrous oxide emissions from the soil were reported to be positively correlated with the content of nitrogen in the soil [33], and CMV with a low C:N ratio was more conductive to N2O emissions when applied alone.
From the perspective of cumulative emissions, SV is the best treatment for maintaining the soil fertility and sustainable production of paddy fields. On the one hand, the use of CMV and rice straw can reduce the application of chemical fertilizers and the environmental pollution caused by nitrogen fertilizer; on the other hand, it can achieve the goal of energy conservation and emission reduction. From the changes in ammonium nitrogen and nitrate nitrogen, it can be seen that after the CMV was mixed in the soil, it rapidly released nutrients and provided nutrients for the next crop. In addition, it has nitrogen-fixing ability, so CMV represents a suitable catch crop.
4.2. The Differences of Soil Properties and Correlations between Greenhouse Gases and Soil Properties
The results showed that the addition of CMV and rice straw changed the properties of soil. The effect of the combined incorporating of CMV and rice straw on soil properties was more significant than CMV alone. In particular, there were significant positive effects on MBC and MBN (Table 1). The addition of organic matter increased the content of soil organic carbon and nitrogen, among which MBC and MBN were the most affected [34,35,36]. The addition of organic matter to soil not only affects soil organic carbon, but also affects the activity of soil enzymes and soil pH [37].
Greenhouse gas emissions are mainly the result of soil microbial activity [38] and are closely related to soil physical and chemical properties [39]. CO2 and CH4 emissions were positively correlated with the pH, which is consistent with Z.P. Wang [40]. Therefore, CH4 emissions can be reduced by appropriately controlling soil pH in the field. CH4 emissions were significant positively correlated with CAT, maybe since the genes coding for catalase are present and important in methanogens [41]. β-xylosidase participates in the turnover of soil organic carbon and therefore has a positive correlation with CO2 and CH4 emissions. Some scholars believe that β-xylosidase has no relationship with CH4 [42], which could be the reason for the more-complicated soil environment during planting and different treatment.
We used incubated soil to analyze the changes in greenhouse gases after the CMV and rice straw were mixed in the soil. Although the greenhouse gas emissions were different from the field planting conditions, the individual contributions of CMV and straw to greenhouse gas emissions could be determined. The contribution of CMV and rice straw to soil nitrogen fertilizer and the correlation between greenhouse gases and soil physical and chemical properties have been clarified. This experiment is a good supplement to field experiments and represents the theoretical basis of an effective crop residue management strategy to reduce greenhouse gas emissions in rice fields.
5. Conclusions
Through the continuous monitoring of greenhouse gases in a paddy soil mixed with CMV and rice straw, the emission dynamics of greenhouse gases and the nitrogen supplied by CMV and rice straw in paddy soil were determined. After the CMV and rice straw were mixed in the soil, the CH4 emissions quickly reached a peak value, which persisted for only a short time period. The cumulative CH4 emissions from the V treatment were not significantly different from those measured in the SV treatment and was 274 times the value measured in the NSV treatment. However, the N2O emissions from the SV treatment were lower than those from the control. Greenhouse gas emissions from paddy soil were positively related to the soil physical and chemical properties such as the MBC and MBN, catalase, β-xylosidase, and pH. The effect of the combined incorporating of CMV and rice straw on soil properties was more significant than CMV alone. In modern rice production, the effects of green manure and straw on greenhouse gases can be reduced by properly adjusting the physical and chemical properties of soil, for example, we can use lime to improve soil pH [43].
Author Contributions
Conceptualization, Q.M. and G.H.; methodology, Q.M., J.L. and M.A.; software, Q.M. and J.L.; validation, Q.M., J.L., M.A. and G.H.; formal analysis, Q.M. and J.L.; investigation, Q.M.; resources, G.H.; data curation, Q.M.; writing—original draft preparation, Q.M. and J.L.; writing—review and editing, Q.M. and G.H.; visualization, Q.M. and J.L.; supervision, G.H.; project administration, G.H. and Q.M. funding acquisition, G.H. All authors have read and agreed to the published version of the manuscript.
Funding
This research was funded by the National Natural Science Foundation of China (grant no. 41661070).
Conflicts of Interest
The authors declare no conflict of interest.
References
- Montzka, S.A.; Dlugokencky, E.J.; Butler, J.H. Non-CO2 greenhouse gases and climate change. Nature 2011, 476, 43–50. [Google Scholar] [CrossRef] [PubMed]
- Gan, Y.; Liang, C.; Chai, Q.; Lemke, R.L.; Campbell, C.A.; Zentner, R.P. Improving farming practices reduces the carbon footprint of spring wheat production. Nat. Commun. 2014, 5, 5012. [Google Scholar] [CrossRef] [PubMed]
- Cui, Z.; Zhang, H.; Chen, X.; Zhang, C.; Ma, W.; Huang, C.; Zhang, W.; Mi, G.; Miao, Y.; Li, X.; et al. Pursuing sustainable productivity with millions of smallholder farmers. Nature 2018, 555, 363–366. [Google Scholar] [CrossRef] [PubMed]
- Mingxing, W.; Jing, L. CH4 emission and oxidation in Chinese rice paddies. Nutr. Cycl. Agroecosyst. 2002, 64, 43–55. [Google Scholar] [CrossRef]
- Ravishankara, A.R.; Daniel, J.S.; Portmann, R.W. Nitrous oxide (N2O): The dominant ozone-depleting substance emitted in the 21st century. Science 2009, 326, 123–125. [Google Scholar] [CrossRef]
- Revell, L.E.; Tummon, F.; Salawitch, R.J.; Stenke, A.; Peter, T. The changing ozone depletion potential of N2O in a future climate. Geophys. Res. Lett. 2015, 42, 10047–10055. [Google Scholar] [CrossRef]
- Kritee, K.; Nair, D.; Zavala-Araiza, D.; Proville, J.; Rudek, J.; Adhya, T.K.; Loecke, T.; Esteves, T.; Balireddygari, S.; Dava, O.; et al. High nitrous oxide fluxes from rice indicate the need to manage water for both long- and short-term climate impacts. Proc. Natl. Acad. Sci. USA 2018, 115, 9720–9725. [Google Scholar] [CrossRef]
- Wang, Z.B.; Chen, J.; Mao, S.C.; Han, Y.C.; Chen, F.; Zhang, L.F.; Li, Y.B.; Li, C.D. Comparison of greenhouse gas emissions of chemical fertilizer types in China’s crop production. J. Clean. Prod. 2017, 141, 1267–1274. [Google Scholar] [CrossRef]
- Lee, C.H.; Do Park, K.; Jung, K.Y.; Ali, M.A.; Lee, D.; Gutierrez, J.; Kim, P.J. Effect of Chinese milk vetch (Astragalus sinicus L.) as a green manure on rice productivity and methane emission in paddy soil. Agric. Ecosyst. Environ. 2010, 138, 343–347. [Google Scholar] [CrossRef]
- Aulakh, M.S.; Khera, T.S.; Doran, J.W.; Bronson, K.F. Managing crop residue with green manure, urea, and tillage in a rice-wheat rotation. Soil Sci. Soc. Am. J. 2001, 65, 820–827. [Google Scholar] [CrossRef]
- Zhang, X.; Zhang, R.; Gao, J.; Wang, X.; Fan, F.; Ma, X.; Yin, H.; Zhang, C.; Feng, K.; Deng, Y. Thirty-one years of rice-rice-green manure rotations shape the rhizosphere microbial community and enrich beneficial bacteria. Soil Biol. Biochem. 2017, 104, 208–217. [Google Scholar] [CrossRef]
- Toda, M.; Uchida, Y. Long-term use of green manure legume and chemical fertiliser affect soil bacterial community structures but not the rate of soil nitrate decrease when excess carbon and nitrogen are applied. Soil Res. 2017, 55, 524. [Google Scholar] [CrossRef]
- Li, F.; Wang, Z.; Dai, J.; Li, Q.; Wang, X.; Xue, C.; Liu, H.; He, G. Fate of nitrogen from green manure, straw, and fertilizer applied to wheat under different summer fallow management strategies in dryland. Biol. Fertil. Soils 2015, 51, 769–780. [Google Scholar] [CrossRef]
- Hwang, H.Y.; Kim, G.W.; Kim, S.Y.; Mozammel Haque, M.; Khan, M.I.; Kim, P.J. Effect of cover cropping on the net global warming potential of rice paddy soil. Geoderma 2017, 292, 49–58. [Google Scholar] [CrossRef]
- Huang, Y.; Zou, J.; Zheng, X.; Wang, Y.; Xu, X. Nitrous oxide emissions as influenced by amendment of plant residues with different C:N ratios. Soil Biol. Biochem. 2004, 36, 973–981. [Google Scholar] [CrossRef]
- Maucieri, C.; Zhang, Y.; McDaniel, M.D.; Borin, M.; Adams, M.A. Short-term effects of biochar and salinity on soil greenhouse gas emissions from a semi-arid Australian soil after re-wetting. Geoderma 2017, 307, 267–276. [Google Scholar] [CrossRef]
- Deng, B.; Li, Z.; Zhang, L.; Ma, Y.; Li, Z.; Zhang, W.; Guo, X.; Niu, D.; Siemann, E. Increases in soil CO2 and N2O emissions with warming depend on plant species in restored alpine meadows of Wugong Mountain, China. J. Soils Sediments 2016, 16, 777–784. [Google Scholar] [CrossRef]
- Hu, Y.; Zhang, L.; Deng, B.; Liu, Y.; Liu, Q.; Zheng, X.; Zheng, L.; Kong, F.; Guo, X.; Siemann, E. The non-additive effects of temperature and nitrogen deposition on CO2 emissions, nitrification, and nitrogen mineralization in soils mixed with termite nests. Catena 2017, 154, 12–20. [Google Scholar] [CrossRef]
- Xu, H.; Li, D.; Zhu, B.; Zhang, K.; Yang, Y.; Wang, C.; Jiang, Y.; Zeng, Z. CH4 and N2O emissions from double-rice cropping system as affected by Chinese milk vetch and straw incorporation in southern China. Front. Agric. Sci. Eng. 2017, 4, 59–68. [Google Scholar] [CrossRef][Green Version]
- Henry, S.; Bru, D.; Stres, B.; Hallet, S.; Philippot, L. Quantitative detection of the nosZ gene, encoding nitrous oxide reductase, and comparison of the abundances of 16S rRNA, narG, nirK, and nosZ genes in soils. Appl. Environ. Microbiol. 2006, 72, 5181–5189. [Google Scholar] [CrossRef]
- Kudeyarov, V.N.; Jenkinson, D.S. The effects of biocidal treatments on metabolism in soil-VI. Fumigation with carbon disulphide. Soil Biol. Biochem. 1976, 8, 375–378. [Google Scholar] [CrossRef]
- Shen, S.M.; Pruden, G.; Jenkinson, D.S. Mineralization and immobilization of nitrogen in fumigated soil and the measurement of microbial biomass nitrogen. Soil Biol. Biochem. 1984, 16, 437–444. [Google Scholar] [CrossRef]
- Blair, G.J.; Lefroy, R.D.; Lisle, L. Soil carbon fractions based on their degree of oxidation, and the development of a carbon management index for agricultural systems. Aust. J. Agric. Res. 1995, 46, 1459–1466. [Google Scholar] [CrossRef]
- R Core Team. R: A Language and Environment for Statistical Computing; R Foundation for Statistical Computing: Vienna, Austria, 2020. [Google Scholar]
- Felipe de Mendiburu. Agricolae: Statistical Procedures for Agricultural Research. R package Version 1.3-2. 2020. Available online: https://cran.r-project.org/web/packages/agricolae/index.html (accessed on 11 May 2020).
- Wickham, H. ggplot2: Elegant Graphics for Data Analysis; Springer: New York, NY, USA, 2016. [Google Scholar]
- Peterson, B.G.; Carl, P. Performance Analytics: Econometric Tools for Performance and Risk Analysis (R Package Version 2.0.4). 2020. Available online: https://CRAN.R-project.org/package=PerformanceAnalytics (accessed on 11 May 2020).
- Wei, T.; Simko, V. R Package “Corrplot”: Visualization of a Correlation Matrix (Version 0.84). 2017. Available online: https://github.com/taiyun/corrplot (accessed on 11 May 2020).
- Hadley, W.; Romain, F.; Lionel, H.; Kirill, M. dplyr: A Grammar of Data Manipulation (R Package Version 0.8.5). 2020. Available online: https://CRAN.R-project.org/package=dplyr (accessed on 11 May 2020).
- Kuzyakov, Y. Priming effects: Interactions between living and dead organic matter. Soil Biol. Biochem. 2010, 42, 1363–1371. [Google Scholar] [CrossRef]
- Min, H.; Zhao, Y.H.; Chen, M.C.; Zhao, Y. Methanogens in paddy rice soil. Nutr. Cycl. Agroecosyst. 1997, 49, 163–169. [Google Scholar] [CrossRef]
- Torres, M.J.; Simon, J.; Rowley, G.; Bedmar, E.J.; Richardson, D.J.; Gates, A.J.; Delgado, M.J. Nitrous Oxide Metabolism in Nitrate-Reducing Bacteria: Physiology and Regulatory Mechanisms. Adv. Microb. Physiol. 2016, 68, 353–432. [Google Scholar]
- Freney, J.R. Emission of nitrous oxide from soils used for agriculture. Nutr. Cycl. Agroecosyst. 1997, 49, 1–6. [Google Scholar] [CrossRef]
- Powlson, D.S.; Prookes, P.C.; Christensen, B.T. Measurement of soil microbial biomass provides an early indication of changes in total soil organic matter due to straw incorporation. Soil Biol. Biochem. 1987, 19, 159–164. [Google Scholar] [CrossRef]
- Kallenbach, C.; Grandy, A.S. Controls over soil microbial biomass responses to carbon amendments in agricultural systems: A meta-analysis. Agric. Ecosyst. Environ. 2011, 144, 241–252. [Google Scholar] [CrossRef]
- Li, Y.; Chang, S.X.; Tian, L.; Zhang, Q. Conservation agriculture practices increase soil microbial biomass carbon and nitrogen in agricultural soils: A global meta-analysis. Soil Biol. Biochem. 2018, 121, 50–58. [Google Scholar] [CrossRef]
- Kim, S.Y.; Gutierrez, J.; Kim, P.J. Considering winter cover crop selection as green manure to control methane emission during rice cultivation in paddy soil. Agric. Ecosyst. Environ. 2012, 161, 130–136. [Google Scholar] [CrossRef]
- Conrad, R. Soil Microorganisms as Controllers of Atmospheric Trace Gases (H2, CO, CH4, OCS, N2O, and NO). Am. Soc. Microbiol. 1996, 60, 609–640. [Google Scholar] [CrossRef]
- Allaire, S.E.; Lange, S.F.; Lafond, J.A.; Pelletier, B.; Cambouris, A.N.; Dutilleul, P. Multiscale spatial variability of CO2 emissions and correlations with physico-chemical soil properties. Geoderma 2012, 170, 251–260. [Google Scholar] [CrossRef]
- Wang, Z.P.; Delaune, R.D.; Patrick, W.H.; Masscheleyn, P.H. Soil Redox and pH effects on methane production in a flooded rice soil. Soil Sci. Soc. Am. J. 1993, 57, 382–385. [Google Scholar] [CrossRef]
- Erkel, C.; Kube, M.; Reinhardt, R.; Liesack, W. Genome of Rice Cluster I Archaea-the Key Methane Producers in the Rice Rhizosphere. Science 2006, 313, 370–372. [Google Scholar] [CrossRef]
- Zhu, Z.; Ge, T.; Liu, S.; Hu, Y.; Ye, R.; Xiao, M.; Tong, C.; Kuzyakov, Y.; Wu, J. Rice rhizodeposits affect organic matter priming in paddy soil: The role of N fertilization and plant growth for enzyme activities, CO2 and CH4 emissions. Soil Biol. Biochem. 2017, 116, 369–377. [Google Scholar] [CrossRef]
- Zeng, Y.; van Gestel, N.; Jiang, Y.; Huang, S.; Liao, P.; Sun, Y.; van Groenigen, K.J.; Zhang, W. Lime application lowers the global warming potential of a double rice cropping system. Geoderma 2018, 325, 1–8. [Google Scholar]
© 2020 by the authors. Licensee MDPI, Basel, Switzerland. This article is an open access article distributed under the terms and conditions of the Creative Commons Attribution (CC BY) license (http://creativecommons.org/licenses/by/4.0/).