Article

Chemical Extraction of Phosphorus from Dairy Manure and Utilization of Recovered Manure Solids

by
Ariel A. Szogi
1,*,
Virginia H. Takata
2 and
Paul D. Shumaker
1
1
United States Department of Agriculture, Agricultural Research Service, Coastal Plains Soil, Water and Plant Research Center, 2611 W. Lucas Street, Florence, SC 29501, USA
2
Soil and Water Department, Agronomy Faculty, University of the Republic, Garzon 780, Montevideo 12900, Uruguay
*
Author to whom correspondence should be addressed.
Agronomy 2020, 10(11), 1725; https://doi.org/10.3390/agronomy10111725
Submission received: 23 September 2020 / Revised: 31 October 2020 / Accepted: 4 November 2020 / Published: 6 November 2020

Abstract

:
Repeated land application of dairy manure can increase soil phosphorus above crop requirements because of manure’s low nitrogen (N) to phosphorus (P) ratio (N:P < 4:1). This soil P build-up can lead to off-site P transport and impairment of surface water quality. We evaluated a treatment process to extract P from manures, called Quick Wash, integrated with a double-stage solids separation system to recover coarse and fine manure solids. The Quick Wash process uses a combination of acid, base, and organic polymers to extract and recover P from manures, improving the N:P ratio of recovered manure solids (RMS). Results showed that coarse RMS could have use as bedding materials for dairy cows, and the fine acidified RMS with N:P > 10:1 can be used as a low-P organic soil amendment. A soil incubation test showed that acidified RMS stimulated N mineralization and nitrification having higher nitrate levels than untreated dairy slurry when incorporated into soil. Our results suggest that the inclusion of Quick Wash in a dairy manure management system can improve manure’s value, lowering costs of bedding material and manure hauling, and recover P for use as fertilizer while reducing the environmental impact of land spreading manure P.

1. Introduction

In the US, the large amount of manure produced by dairy operations (18.9 Tg per year) is as big as the total manure from feedlot beef and confined swine production combined [1]. When adequately applied to farm fields, dairy manure is a valuable source of nutrients for crop production. Federal and state regulations require confined dairy operations to implement a comprehensive nutrient management plan to land apply manure nutrients [2]. Usually, the nutrient management plans prescribe manure applications based on a crop’s N requirement. However, repeated land application of dairy manure can increase the amount of soil P above crop requirements because of the imbalance of N and P content (N:P ratio) in manure and harvested crops [3,4]. The N:P ratio in plant biomass of most grain and hay crops is 8:1 against manures that usually have a smaller N:P ratio of less than 4:1 [5,6]. Therefore, an excessive soil P build-up can lead to soil P losses through leaching and runoff and impairment of water quality in lakes and rivers [4,7]. Besides, P pollution accelerates algal blooms in drinking water sources, drastically increasing treatment costs and shortages in potable water supplies [8]. Nevertheless, dairy production operators are interested in alternative manure management systems to both reduce the environmental impact of land spreading and recover value from manure and its byproducts [9,10].
Processed dairy manure has beneficial uses such as composting, renewable energy production in anaerobic digesters, and animal bedding material. Dairy operations use separated solids from dairy manure slurry as a compost substrate or, with subsequent drying, as an alternative to sand for animal bedding [9,11]. Anaerobic digestion is another alternative use of dairy manure slurry with the benefit of reducing malodors and greenhouse gases, producing biogas for fuel, a nutrient-rich effluent for fertilizer use, and solids for animal bedding [12,13]. However, the dairy manure and its byproducts seldom have a balanced N:P ratio, and their land application for crop production remains an environmental risk for off-site P transport [14,15]. Therefore, mitigation of the environmental impact of imbalanced N:P ratios in manures would require processing manure for P extraction before land application [7].
A process called ‘’Quick Wash’’, developed to extract and recover P and simultaneously increase the N:P ratio in recovered animal manure solids, can solve the intractable problem of imbalanced N:P ratio of manure byproducts before soil application [16]. The Quick Wash process uses a novel combination of acid, base, and organic polymer to selectively extract and recover P from manure slurries. It generates two products: (1) acidic washed solid residue with a more balanced N:P ratio; and (2) a concentrated P product. The acidification helps control ammonia (NH3) emissions while selectively extracting P from manure solids. The recovered manure solids (RMS) are dewatered from the acidified slurry by solid-liquid separation methods. After that, P is recovered from the acid extract as a P-rich precipitate under alkaline pH by adding a base and an organic polymer.
The Quick Wash approach integrated into a dairy manure management system can be retrofitted to solid-liquid separation systems already used in many dairy operations. Among the numerous solid-liquid separation technologies [9,17], double-stage solid separation systems are commonly used in dairy operations to separate coarser and finer dairy manure solids for use as animal bedding and organic soil amendments [18]. Here, we performed laboratory tests to assess the feasibility of integrating the Quick Wash process with a double-stage solid-liquid separation system, having two stationary screens in series. Because the first step of the Quick Wash process is the acidification of the manure, we tested the following two options of injecting acid into the manure slurry: (1) before the separation through the first-stage screen, and (2) before separation through the second-stage screen. Given that the second-stage screen separated the finer manure solids, a chemical flocculant was used to enhance solid-liquid separation [19]. Therefore, our study had the following objectives: (1) evaluate acid rates for optimal P extraction in soluble form from scraped dairy manure slurry; (2) determine the N:P ratio of recovered solids after acid addition, and a solids and P mass balance; (3) evaluate recovered solids as a source of N when used as an organic soil amendment.

2. Materials and Methods

2.1. Manure Source

We obtained a fresh manure sample from a dairy farm located in Laurens County, South Carolina, USA, with 300 Jersey milking cows under grazing. The routine manure management consisted of scraping the manure slurry from the milking center into a concrete settling basin, daily application of supernatant liquid to a pasture adjacent to the milking center, and land application of dairy manure solids accrued in the settling basin every two days. We collected a composite manure sample from the settling basin in a 20-L plastic container. Next, we sealed, transported, and placed the container in cold storage (<4 °C) until we used the scraped manure for our experiments. The manure slurry had a moisture content of 84.7%, and a total nutrient content of 402 g C kg−1, 30 g N kg−1, 5.5 g P kg−1, and 15.6 g K kg−1 expressed on a dry weight basis. Before performing the experiments, we diluted the manure with distilled-deionized water to reach a 6:1 water to dried solids ratio to ease mechanical homogenization and mixing of chemicals.

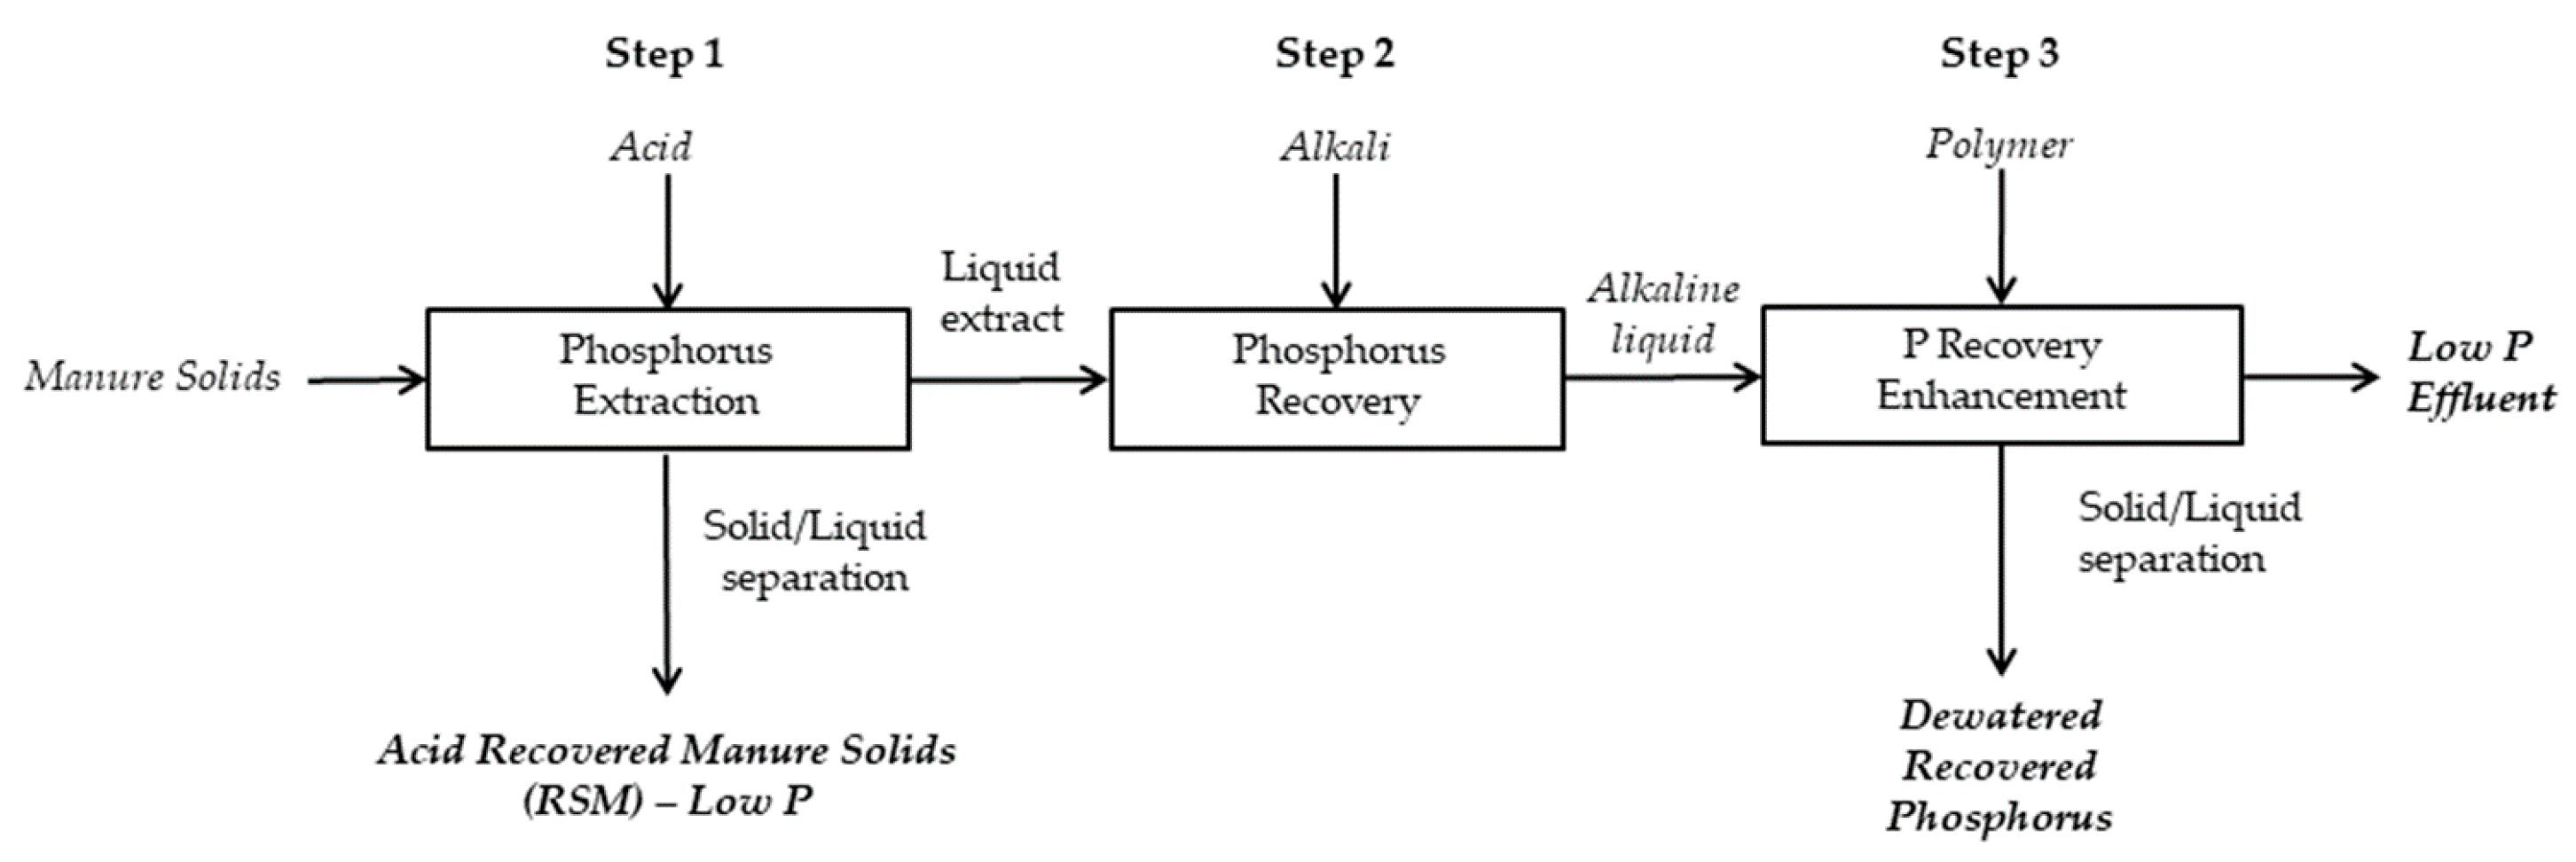
2.2. Acid-Base-Organic Polymer Process (Quick Wash)

The Quick Wash process includes three steps [16]: Step 1 includes mixing manure with an acid solution to form a homogeneous slurry followed by solid-liquid separation to dewater the slurry. The dewatering of the slurry generates an acid-washed solid residue and an acidic extract rich in soluble P. In step 2, P recovery occurs through precipitation under alkaline conditions by adding liquid lime (Ca (OH)2) to the acidic extract. In step 3, the addition of an organic anionic polymer promotes the P enrichment in the precipitate (Figure 1).

2.3. Experimentation

2.3.1. Integration of the Quick Wash Process into a Dairy Manure Management System

We performed three sets of experiments to adapt the Quick Wash process to recover manure solids and nutrients from scraped dairy manure (Figure 1). In the first experiment, we determined the acid requirement and mixing time to optimize P concentration in the acidic extract. In the second experiment, we tested a two-stage process for solid-liquid separation of the acidified manure slurry. The two-stage solid-liquid separation approach recovers coarse, fibrous solids for use as bedding materials, and finer solids for use as an organic soil amendment. In the third experiment, we determined the liquid lime rates required for recovering P from acidified extracts according to steps 2 and 3 of the Quick Wash process.
  • Experiment 1: Acid Requirement and Mixing Time for Optimal P Extraction
To optimize the acid application rate and mixing time, we performed a duplicate test for the effect of mixing time (20 min against 24 h) on the pH and concentration of inorganic phosphate-P (PO4-P) extracted from the acid and manure slurry mixtures. We carried out the test at ten concentration levels of sulfuric acid (H2SO4) ranging from zero to 92 mmol L−1. We poured 40 mL of dairy manure slurry (6:1 water/solid ratio) into 50-mL graduated glass test tubes for each acid concentration level. We mixed the acidified manure slurry by placing the tubes in a reciprocating shaker (135 oscillations min−1) at ambient temperature (23 °C) and pressure (101.3 kPa). After mixing the acidified manure slurries for 20 min, we stopped the shaker and took 5-mL samples from each tube for analysis. Then, we returned the tubes to the shaker to continue mixing the acidified slurry for 24 h. After 24 h, we stopped the mixing and took a second set of 5-mL samples for analysis. We centrifuged (2000× g) both sets of 5-mL samples for 10 min to separate solids from liquid and analyzed the decanted liquid for pH and PO4-P concentrations. At the end of the 24 h test, we used the acidified slurry remaining in the tubes to determine the total P (TP) content.
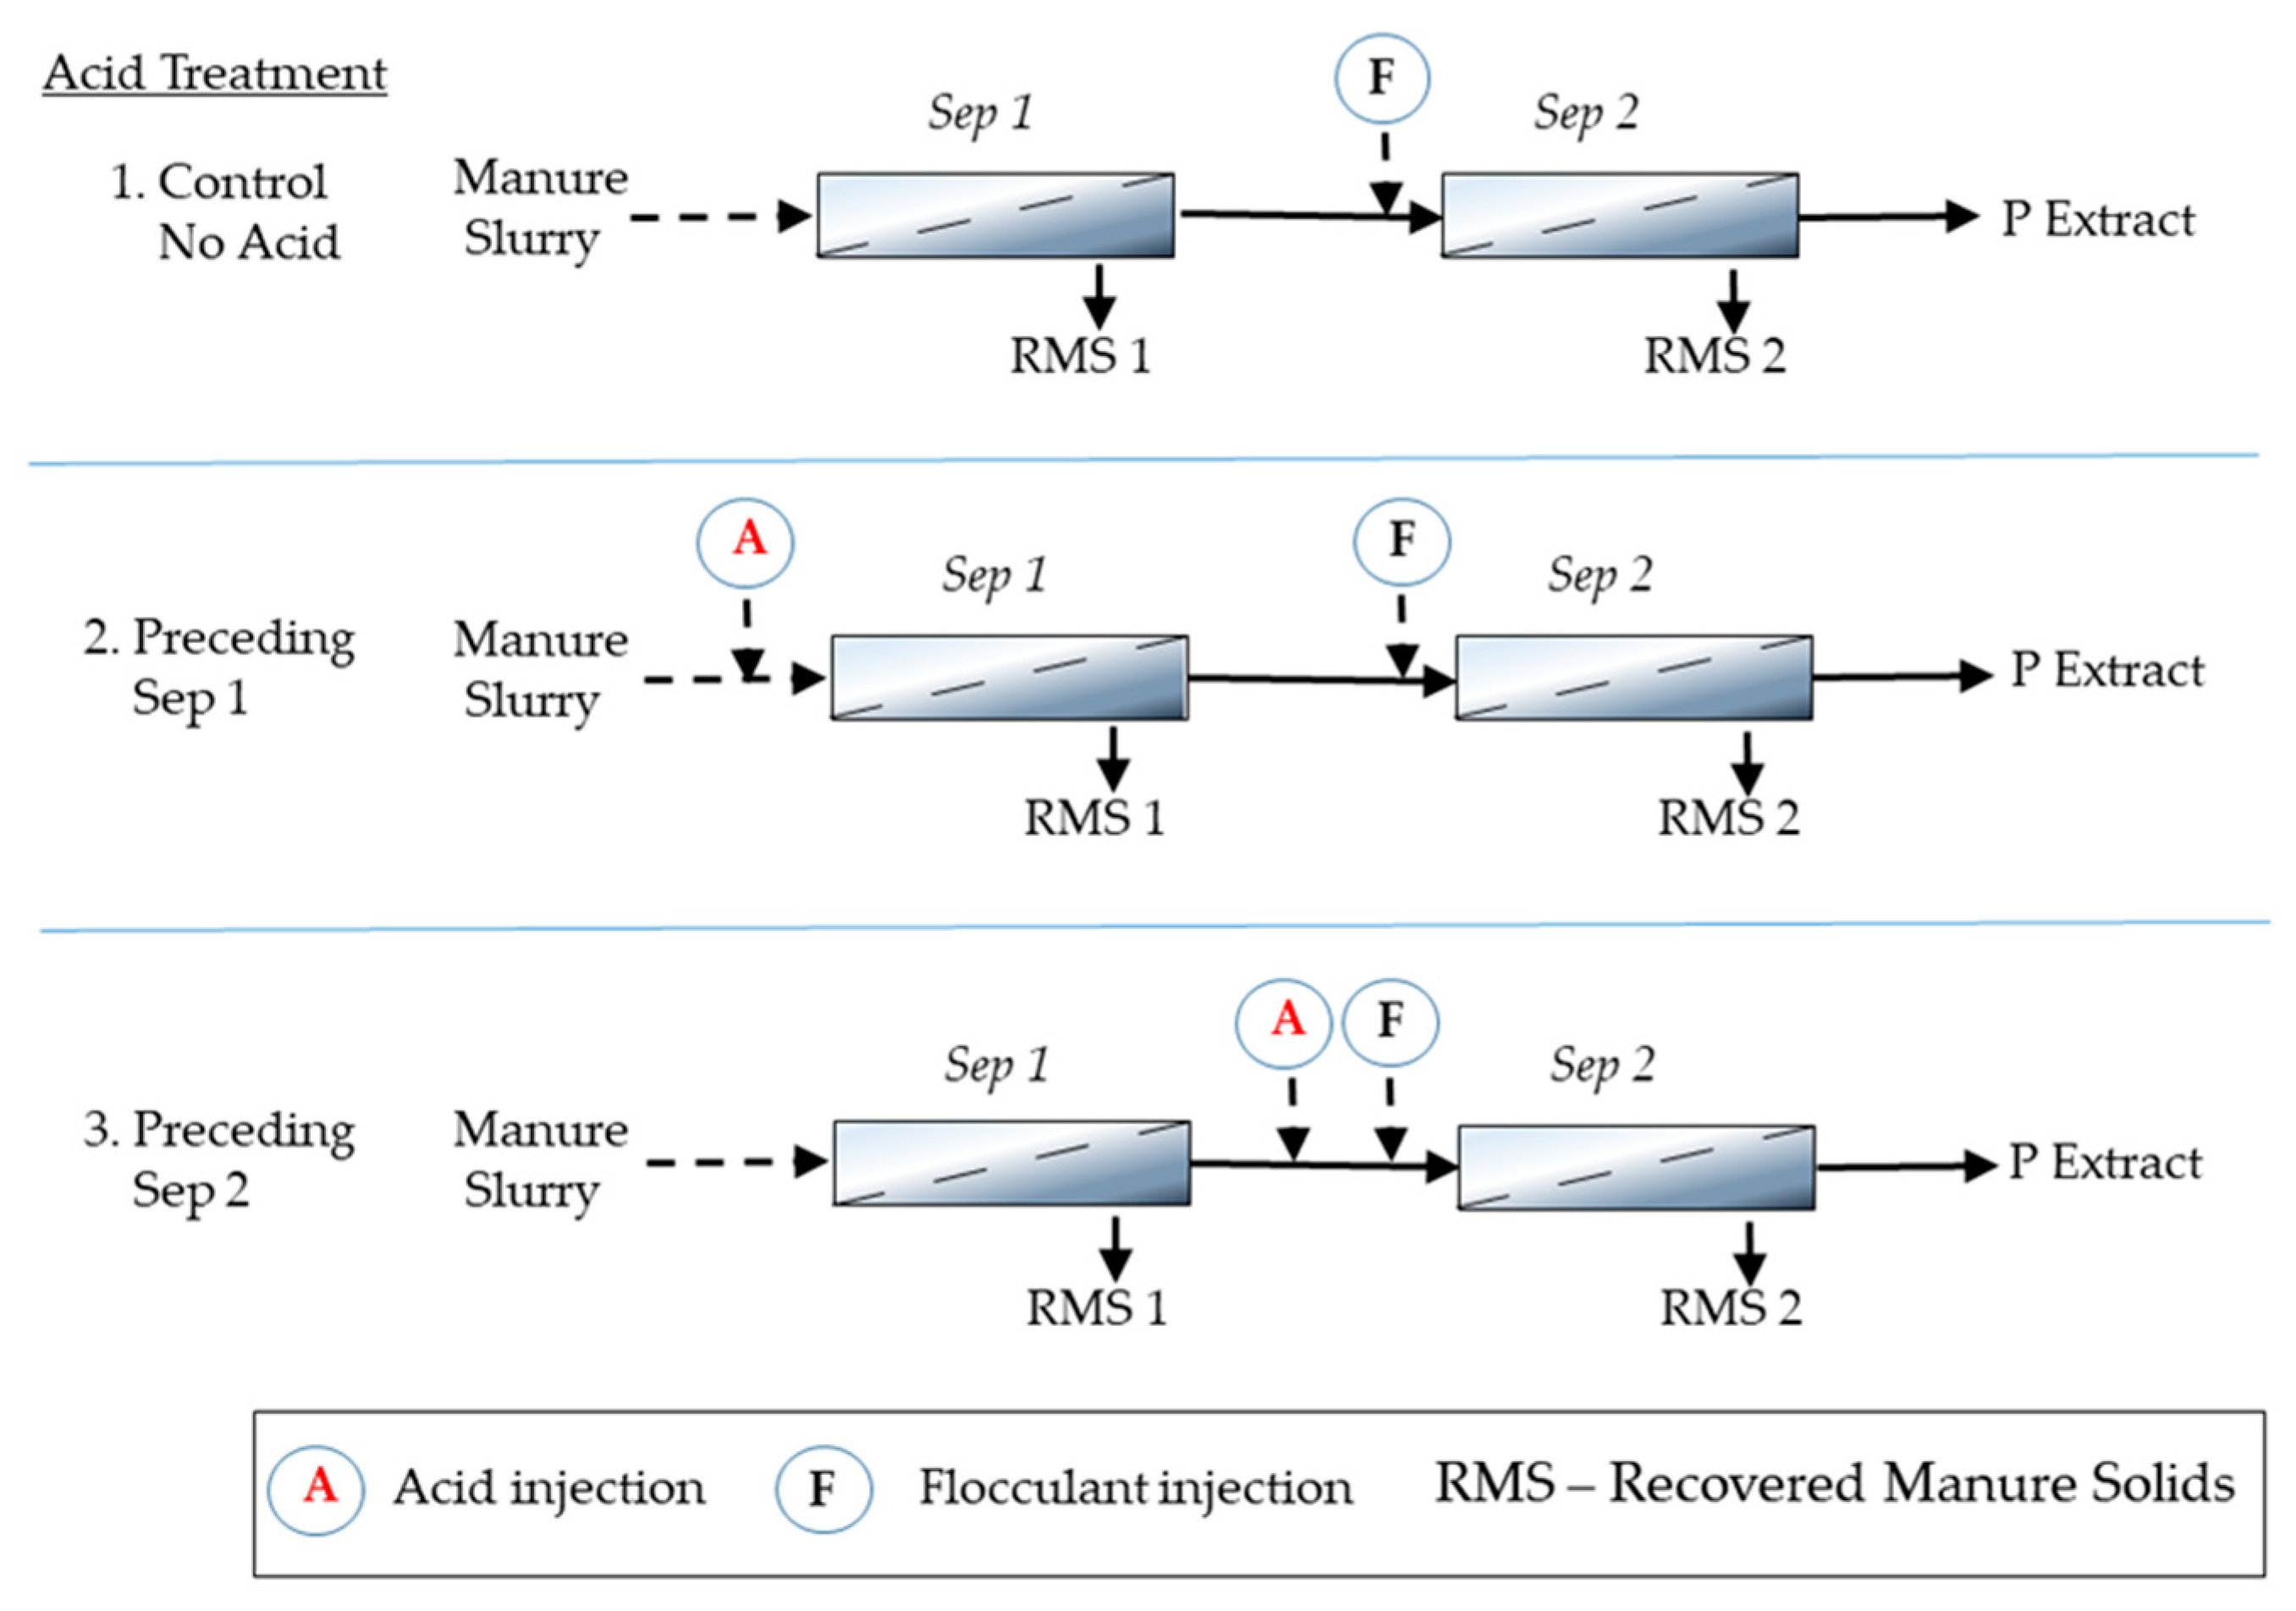
  • Experiment 2: Acid Addition in Two-Stage Solid-Liquid Separation of Manure Slurry
This experiment determined the better injection point for adding acid in the two-stage solid-liquid separation process. We used 1550 mL of the scraped manure (6:1 water/solid ratio) in each test. Acidification of the slurry consisted of dosing H2SO4 at a rate of 25 mmol L−1. We homogenized the slurry and mixed chemicals using an overhead stirrer in a 5-L plastic settling tank to simulate the field process of mixing the acid with the slurry inside a tank. The test was carried out in duplicate. To simulate a two-stage stationary screen separator, we used two screens with mesh sizes of 12.7 mm (Sep 1) and 0.25 mm (Sep 2). The acid addition test consisted of three treatment options: (1) no acidification (control); (2) acid added before Sep 1; and (3) acid added before Sep 2 (Figure 2). According to previous work [20], we used chemical flocculation for efficient solid-liquid separation of fine dairy manure solids through the 0.25-mm screen (Sep 2). Consistent with Figure 2, we added the flocculant to the manure slurry after it passed through Sep 1 screen in all three treatments. The flocculant was a cationic polyacrylamide (PAM) (Nalco Co., Naperville, IL, USA) applied at a single rate of 330 mg PAM L−1 [19].
  • Experiment 3: Phosphorus Recovery
According to steps 2 and 3 of the Quick Wash process (Figure 1), we conducted this experiment to estimate the liquid lime required for P precipitation and recovery from the acidified extract obtained in experiment 2. In duplicate, we dispensed 40 mL of acidic liquid extract obtained from experiment 2 into 50-mL centrifuge tubes and adjusted the pH to 6, 7, 8, 9, and 10 using a 10% Ca(OH)2 suspension. Following, we added 0.5 mL of a 0.5% solution of anionic polymer (Magnafloc 120L, Basf Corp., Suffolk, VA) to enhance the formation of a P-rich precipitate according to Szogi et al. [21]. After centrifuging the tubes at 2000× g for 10 min, we decanted the supernatant (effluent).

2.3.2. Use of Recovered Manure Solids as a Soil Organic Amendment

We performed a laboratory soil incubation experiment to evaluate the RMS as a source of soil N by comparison with fresh scraped dairy manure. The incubation test included measurements of ammonia gas losses (NH3), and accumulation of soil NH4+-N because of mineralization of the organic N applied to soil surface or incorporated into soil with fresh manure and the RMS. We also included measurements of soil NO3-N levels due to nitrification of soil NH4+-N.
For the incubation, we used soil cores from the topsoil of a Norfolk loamy sand (Fine-loamy kaolinitic thermic Typic Kandiudults) located at the USDA-ARS Coastal Plains Soil, Water, and Plant Research Center in Florence, SC, USA. We used a soil sampler (AMS, Inc., American Falls, ID, USA) equipped with replaceable plastic cylindrical sleeves (5 cm diameter × 15 cm long) to collect the soil cores. The soil had the following properties: 0.55% C, 0.05% N, 25 mg P kg−1 (as plant available), 59 mg K kg−1, CEC (cation exchange capacity) 3.7 cmol kg−1, pH 5.3, and loamy sand texture (81% sand, 17% silt, and 3% clay).
The N application rate of both RMS and fresh manure was 89.6 mg N kg−1 soil. This N application rate is equivalent to an application of 160 kg N ha−1 to a fescue hay field, as is common in South Carolina [22]. We applied the RMS and the fresh manure to the soil surface to a set of soil cores. On another set of soil cores, we incorporated the materials about 5 cm below the soil surface. The incorporation simulated the use of an s-line cultivator (staggered) or concave disks following surface application. After application of the organic soil amendments the cores were incubated for 70 days at an average ambient temperature of 23 °C and 65% relative humidity. To optimize microbial activity during the incubation study, we added distilled water as needed to maintain a soil moisture to about 60% of the water filled pore space [23]. The soil cores were placed in 2.0-L plastic chambers made of PET (polyethylene terephthalate) and closed with a threaded polyethylene lid. The lid had a small vent to avoid pressure build-up above ambient atmospheric pressure inside the chamber. The NH3 gas was trapped as ammonium (NH4+) from the source into an 8-mL glass vial holding 5.0 mL of 0.2 M H2SO4 [24]. The 8-mL glass vial that served as an acid trap was attached to the outside wall of the soil core with a rubber band with its open end at the same level of the soil surface.

2.4. Analytical Methods

Analyses of liquid samples were performed according to Standard Methods for Examination of Water and Wastewater [25]. The pH of liquid samples was measured electrometrically using a combination pH electrode (Standard Method 4500-H+ B). The total solids (TS) of liquid samples were determined after evaporation of a sample to constant weight at 105 °C. Total P in liquid and solid samples was determined using nitric acid digestion with peroxide (EPA method 3050B) using a block digester and inductively coupled plasma analysis [26]. The TKN in liquid samples was determined by colorimetric methods using the method of Sims et al. [27], adapted to digested extracts using H2SO4 [21]. After filtration of liquid samples through a 0.45-µm membrane filter (Gelman Supor-450; Pall Corp.), soluble P and soluble TP were determined in undigested and digested samples, respectively, using the malachite green method. Soluble inorganic P (PO4-P) was measured by chemically suppressed ion chromatography (IC) using a Dionex 2000 Ion Chromatograph [28]. The manure solids recovered from the two separation screens were freeze dried and subsequently total carbon (TC) and nitrogen (TN) were analyzed by combustion with an Elementar VarioMax CN analyzer (Elementar Americas Inc., Ronkonkoma, NY, USA). Soil samples were extracted with 2M KCl, analyzed for NH4+-N and nitrate plus nitrite, hereafter called NO3-N. Analysis of both NH4+-N and NO3-N was carried out using an EL-800 microplate reader (Bio-Tek Instruments, Inc., Winooski, VT, USA) set to 650 nm [27].

2.5. Statistical Methods

We used the statistical package SAS 9.4 (SAS Institute Inc., Cary, NC, USA) to perform a paired t-test (Wilcoxon Signed Rank) to determine the differences between two mixing times at each acid concentration level using the PROC UNIVARATE procedure (p < 0.05). Other statistical analyses included descriptive statistics using PROC MEANS and analysis of variance to determine differences between acid treatments and separation screens using PROC ANOVA. We compared treatment means using the least square difference (LSD) option and considered them different when the probability values were p < 0.05. We determined recovery efficiencies of solids, N, and P using mass balances that included the sludge volume, dry matter weight, and elemental concentrations before and after treatment. The N:P ratio was estimated using the TN and TP concentrations on a dry weight basis.

3. Results and Discussion

3.1. Experiment 1: Acid Requirement and Mixing Time

To optimize acid application in Step 1 of the Quick Wash process, we tested the extraction of P at ten H2SO4 concentration levels from zero to 92 mmol L−1. Our previous reports recommended a mixing time of less 20 min to obtain stable P concentrations at pH less than 5.0 [21,29]. Table 1 presents the results of the tests that we carried out to determine if 20 min or 24 h of mixing was adequate to obtain stable P concentrations in acidified dairy manure extracts. According to Table 1, we observed an increase in PO4-P at increasing acid rates with respect to water alone (zero mmol L−1 acid). With a mixing time of 20 min, water alone shows a pH of 6.62 with only 111 mg PO4-P L−1 in the extract solution and representing only 20% of the TP (547 mg L−1) in the untreated dairy manure (UDM). We obtained a significant extraction of P (>60%) from the initial TP of the UDM slurry at pH > 5.00 (Table 1). Concentrations of PO4-P ranging from 422 to 439 mg L−1 in the acid extract matched with acid rates between 25 and 57 mmol H2SO4 L−1. These higher PO4-P concentrations represented 77 to 80% of the initial TP in the UDM.
After 24 h mixing, the water control extracted 58% of the initial TP. The use of water alone can be attractive to eliminate acid from the process, but it increases the extraction time with the risk of releasing volatilized ammonia and malodors into the air. At the lower acid rates of 6 and 12 mmol L−1 the extraction of P improved but it was not statistically different in pH or PO4-P concentration at both acid rates when mixing for 20 min or 24 h according to a pair-difference t-test (P < 0.05). From these results, we confirmed a 20 min mixing yields a stable PO4-P concentration during the acid extraction process.
On average, dairy manure has the lowest TP concentration with most of the P in inorganic forms as compared to manure from monogastric animals (poultry litter and swine manure) [30]. For an optimal acid application, we considered the near four-fold increase in PO4-P concentration (422 mg PO4-P L−1) with respect to water alone obtained at an acid rate of 25 mmol L−1 and pH of 5.42 with 20-min stirring. This PO4-P concentration represents 77% P extraction of the initial TP content in the UDM. However, the percent of TP as PO4-P in the acid extract improves very little at higher acid rates. For instance, increasing the acid rate to 78 mmol L−1 lowers the pH to 3.98 but the increase of PO4-P (463 mg L−1) is equivalent to a P extraction rate of 85%. From these results, we concluded that a pH below pH 5.0 may not needed to obtain good P extraction from dairy manure slurries as required by the original Quick Wash method [16]. All subsequent experiments used the 25 mmol H2SO4 L−1 rate and 20 min mixing prior to the P extraction step (Step 1 of the Quick Wash).

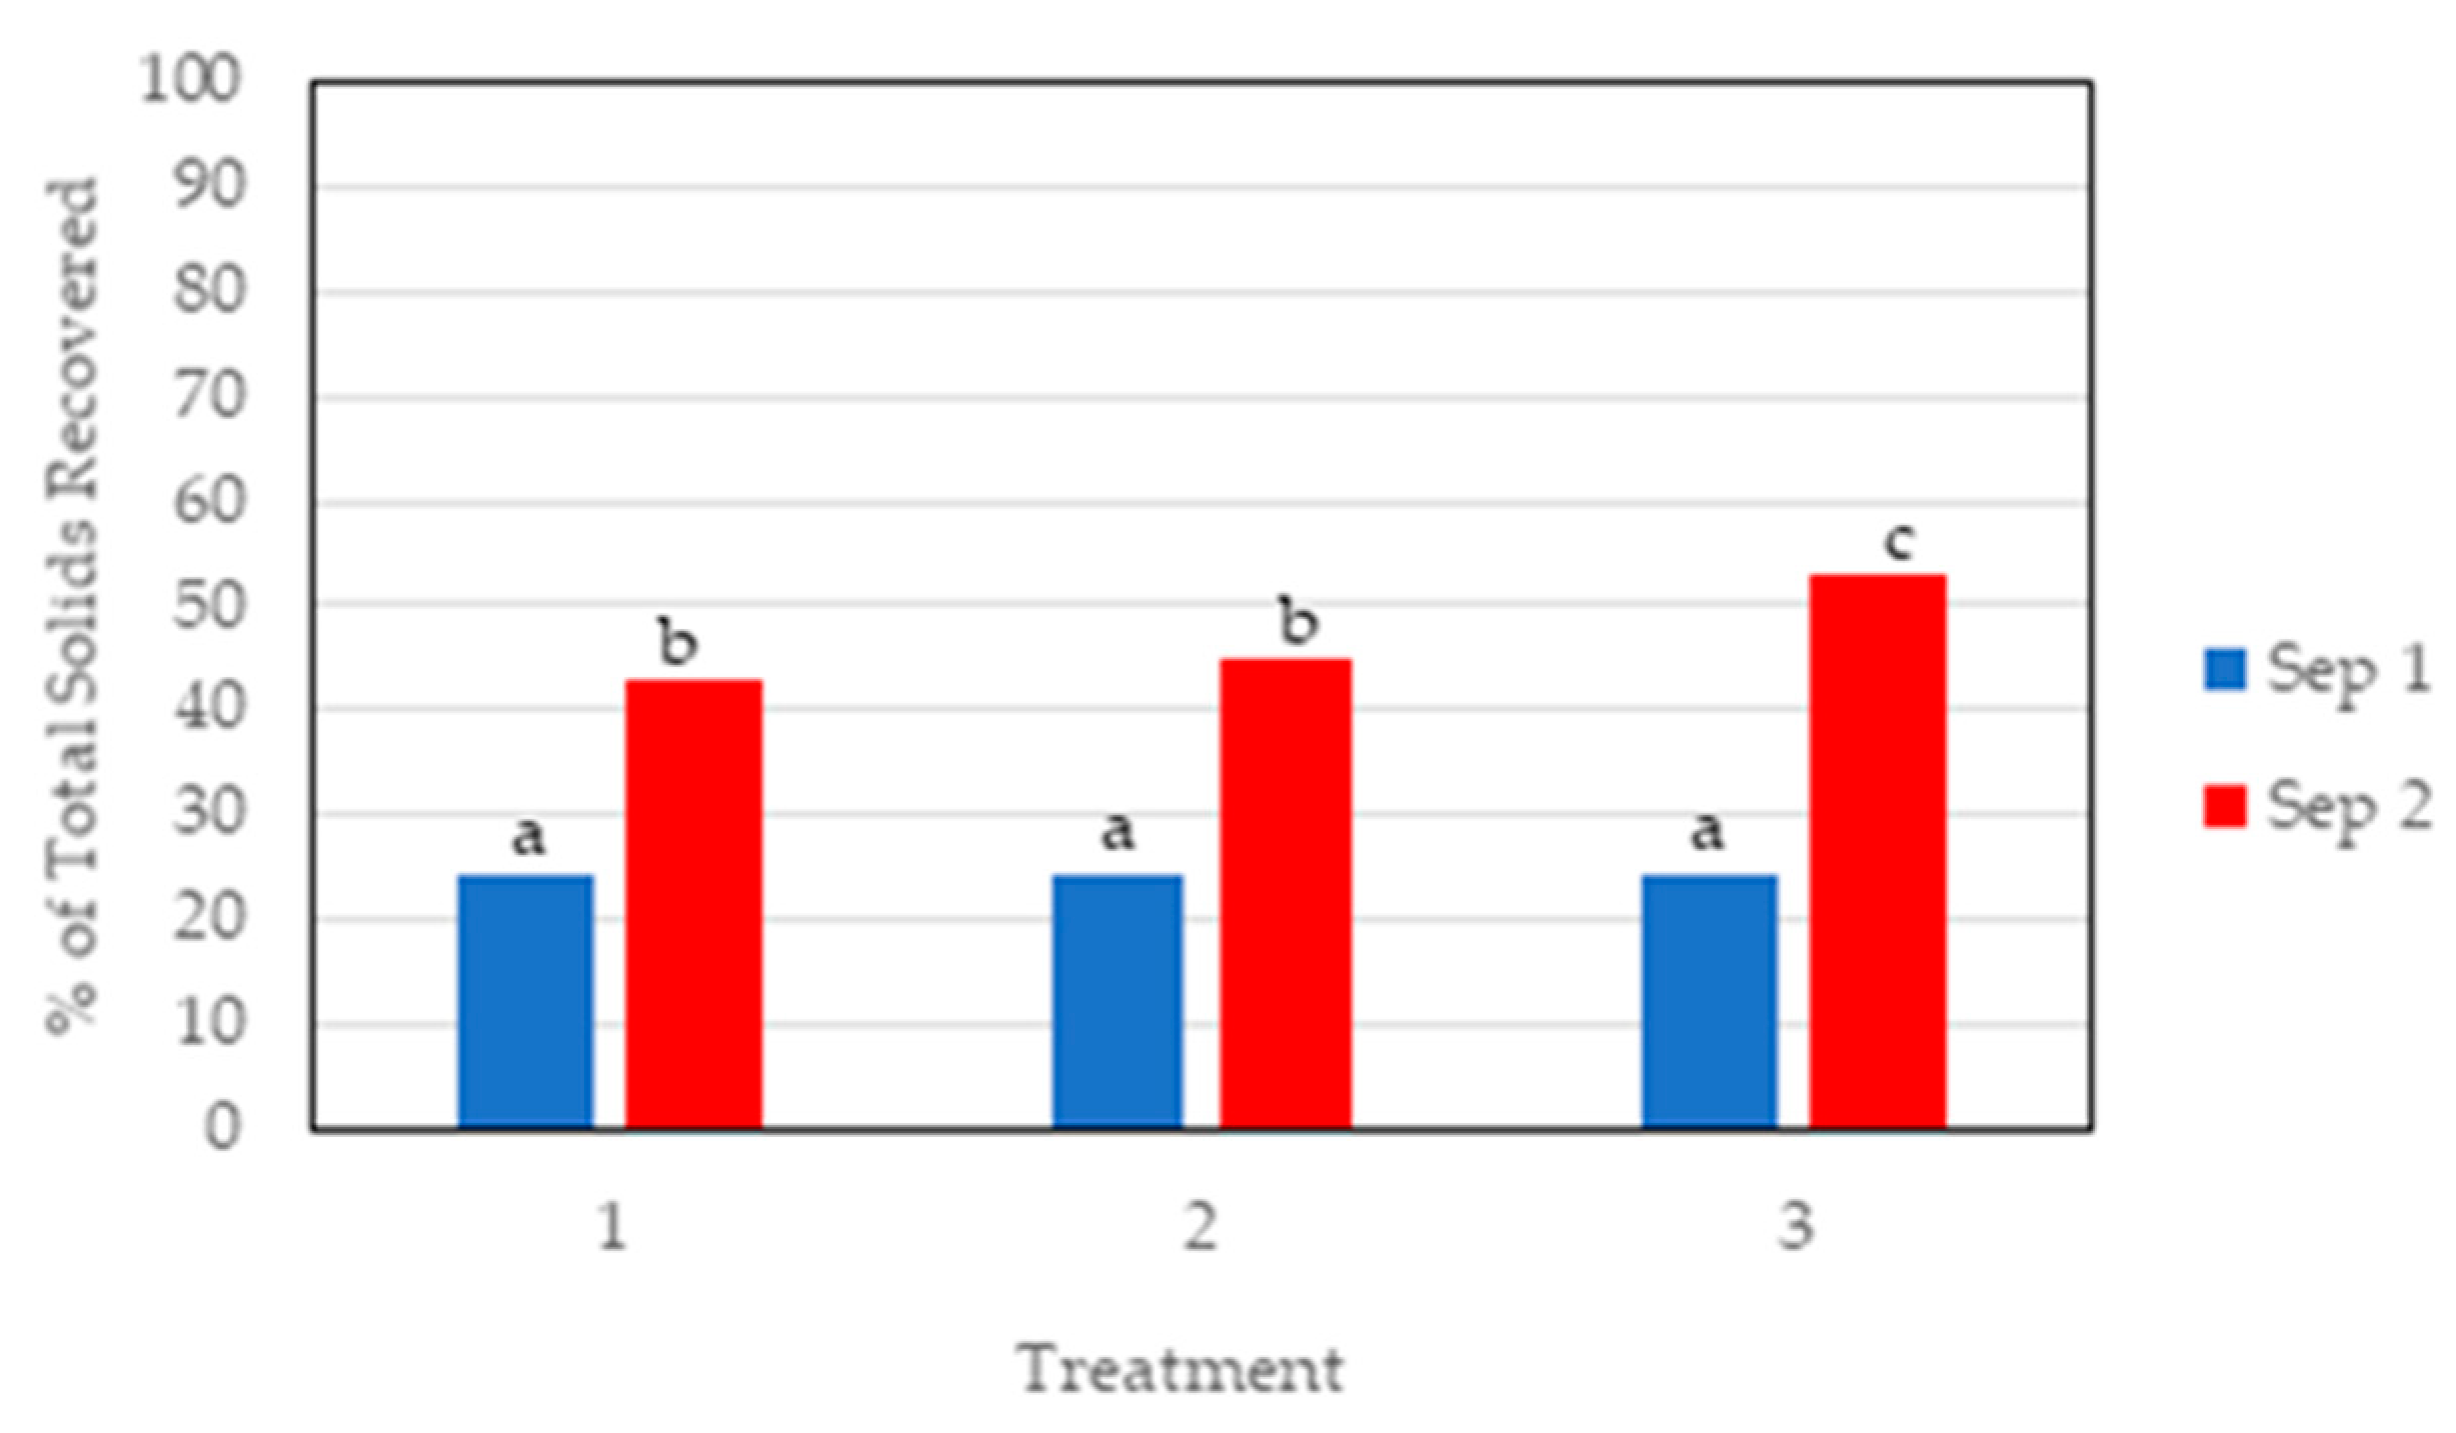
3.2. Experiment 2: Solids Recovery

First, we determined the effectiveness of the two-stage separation screening by the percent difference between the mass of dried solids retained in each screen with respect to the initial TS content of the UDM. In the first separation stage (Sep 1), we compared our results to other studies on separation of dairy manure solids using screens without flocculant addition. On a preliminary trial to select the screen size (data not shown), we included a 2.00 mm screen commonly used for solids separation of dairy manure [31]. We selected a 12.7 mm screen for the first separation stage (Sep 1) because it simplified the removal of the large manure particles with less problems of clogging the screen observed with smaller screen size. On a mass basis, differences in percent of dry matter recovered from Sep 1 screen for the non-acid control, and treatments 2 and 3 were not statistically different (Figure 3). The 24% of dry matter recovered in Sep 1 in all three treatments was similar to the 23% recovery of dairy manure solids in a first separation screen with a 0.508 mm mesh size reported in a two-stage solid-separation system study [18].
In the second stage (Sep 2), solid separation improved significantly because of the addition of cationic flocculant and smaller screen size (0.25 mm). Other reports showed the positive effect of manure acidification on solid-liquid separation using flocculants [21,32]. As expected, the percent of dry matter we recovered from Sep 2 screen was significantly higher than in Sep 1 for all three treatments (Figure 3). Treatment 3 had the highest percentage of solids recovered in this second stage of the solid separation system (53%). We estimated the overall efficiency of the two-stage screening by adding the percentage of recovered solids in Sep 1 plus Sep 2 using data from Figure 3. On average, the two-stage separation recovered 67% of the solids in the untreated slurry with the non-acid control, 69% with acid added before Sep 1, and 77% with acid added before Sep 2. The highest solids recovery of 77% obtained with treatment 3 is comparable to the efficiency of 76% solids separation obtained by gravity settling of dairy flushed manure for 60 min after application of 300 mg PAM L−1 reported by Chastain et al. [33].
The acidification step of the Quick Wash process influenced the total C, N, and P contents of the recovered washed solid fraction with respect to the original composition of the UDM slurry. The immediate separation of the manure solids from the slurry prevented C and organic N oxidation and digestion. The C:N ratio of the coarser solids from Sep 1 was > 25.0 for all three treatments (Table 2). This high C:N ratio indicates that N can be immobilized by microbes when used as a soil amendment, providing little available N for plant growth [24]. In contrast, the C:N ratio of the finer solids recovered from Sep 2 for all three treatments was <15.0. This lower C:N ratio indicated that the finer solids have the potential of a rapid N mineralization with release of inorganic N for crop growth when used as an organic soil amendment.
In previous studies [21,29], we found that acid treatment of poultry litter or swine manure slurries at pH < 5 promoted rapid hydrolysis reactions, converting insoluble P into soluble P. This selective dissolution of P increased the N:P ratio of the separated manure solids [16]. Here, all three acidification options presented in Figure 2 provided a significant removal of P that resulted in an increase of C contents and the N:P ratio of the recovered solids with respect to the initial UDM slurry. Water alone extraction in the control treatment increased the N:P ratio of solids recovered from Sep 1 (N:P 7.3) and Sep 2 (N:P 6.5) versus the initial UDM slurry (N:P 5.5) (Table 2). However, N:P ratio in non-acidified manure can significantly decrease because of ammonia volatilization losses [34]. In our study, acidification treatment did not increase the N:P ratio of coarser solids recovered from Sep 1 as compared to the control (water alone) probably because most solubilized P was associated with finer solids. On the other hand, the finer solids recovered from Sep 2 with acid treatment had higher TN contents with lower concentrations of TP due to dissolution of inorganic P associated to the finer manure solids. Therefore, the acidified fine solids recovered in Sep 2, had much higher N:P ratios (13.6 and 11.3) than the fine solids in the non-acidified control (6.5) or over 2-fold higher N:P ratios than the initial UDM slurry (N:P 5.5).

3.3. Experiment 3: Phosphorus Precipitation and Recovery
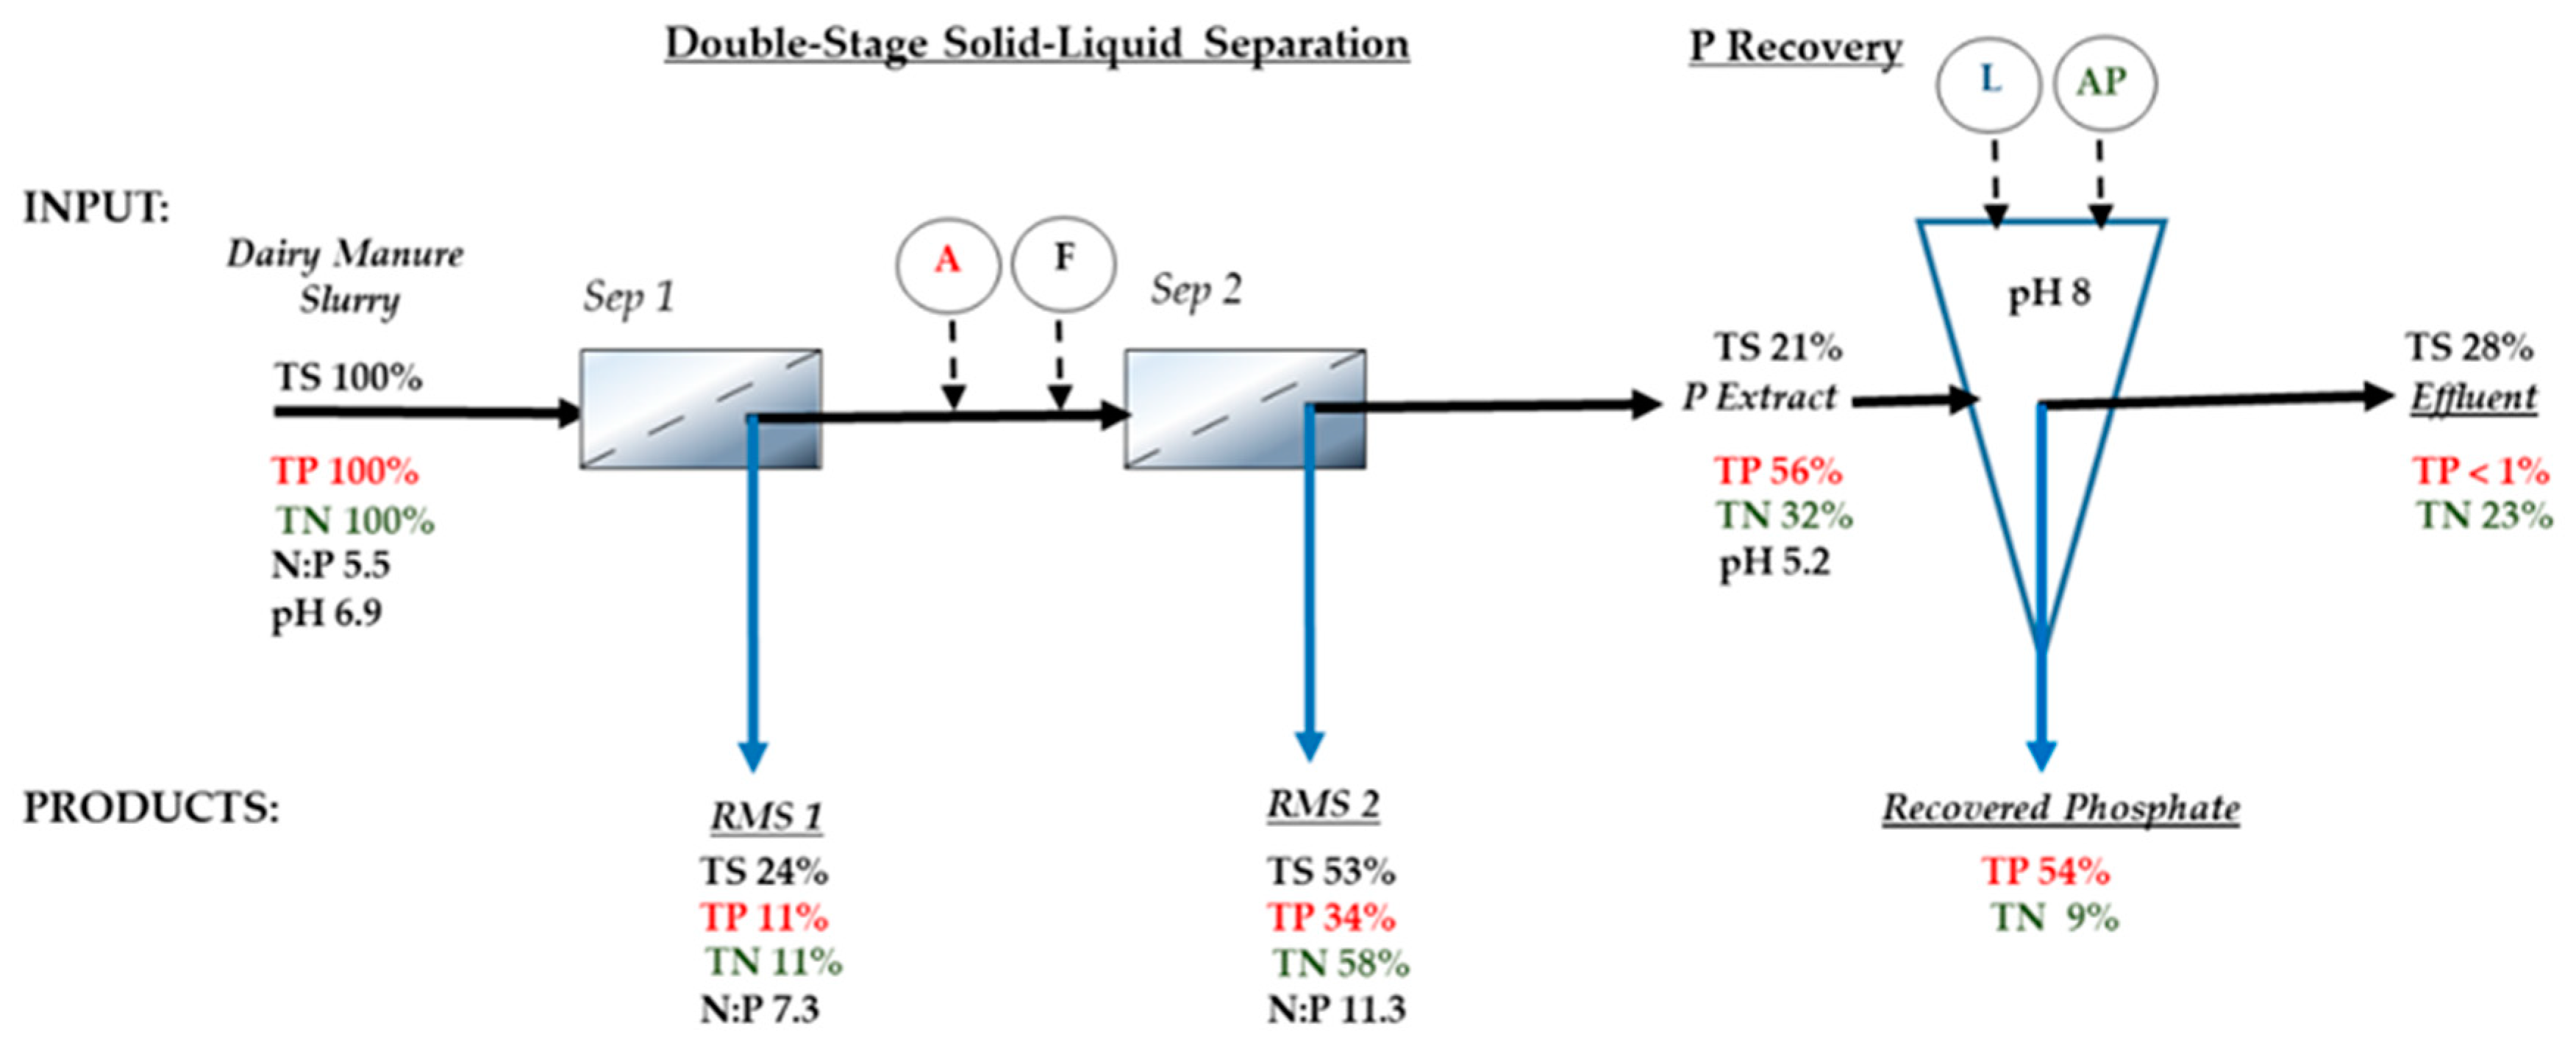
To evaluate the P recovery efficiency of the Quick Wash process, we used the acid extract collected after the double-stage solids separation in Treatment 3 (Figure 2). The results presented in Table 3 show that 89% (282 mg L−1) of the total soluble P (320 mg L−1) in the acid extract was removed at pH 8.0 by addition of liquid lime (10% Ca(OH)2). This P removal is equivalent to 54% of the initial TP mass of the manure slurry recovered in the P precipitate (Table 3). Further addition of liquid lime increased the pH above 8.0 but did not improve the percent P mass recovery in the precipitate (Table 3). Furthermore, the P precipitate had the highest P content at pH 8.0 (16.2% P2O5) whereas at pH higher than 8.0 the precipitate had lower P content (Table 3). These results are consistent with other reported studies on P extraction and recovery from poultry litter and swine manure using the Quick Wash process [21,29]. For instance, the Quick Wash process recovered 61% of the initial TP in poultry litter at pH 8.0 with a P content in the precipitate of 17.6% P2O5 [29].

3.4. Mass Balance

The mass balance for the Quick Wash Process shown in Figure 4 includes the percent of both recovered solids using Treatment 3 (Figure 3) and recovered P (Table 3) with respect to total mass of solids and P of the UDM slurry. Most of the total solids (77%) recovered in the double stage solid-liquid separation were the suspended solids fraction (24% TS recovered from Sep 1, and 53% TS recovered from Sep 2). The remaining mass of solids (21%) were dissolved solids in the acid P extract before the P recovery steps. The higher percent mass of TS in the effluent resulted from the addition of liquid lime during the P recovery. The final effluent is an additional third byproduct of the Quick Wash with value as a source of both irrigation water and liquid N for crop production. The mass balance showed that >23% of the N was in the final low-P effluent with a concentration of 854 mg TN L−1 of which, 67% was inorganic N in the form of NH4-N (574 mg L−1).

3.5. Utilization of Recovered Solids

3.5.1. Dairy Cattle Bedding

All the RMS obtained from the control and the two acid treatments in Sep 1 appear suitable for use as bedding for dairy cows (Table 2, Figure 5a,b). Still, the use of RMS solids for dairy cow bedding requires further drying of the material to reduce bacterial counts of common environmental bacteria such as mastitis pathogens [35,36]. Other studies reported acidification of dairy cattle bedding to reduce the growth of environmental bacteria by maintaining pH < 4.4 [37,38]. From the results of our study, we speculate that acidifying RMS before Sep 1 as shown in Treatment 2 (Table 2) may be a plausible management practice to maintain low microbial counts in dairy cow beddings. According to Table 1, we show that acidification of manure solids to a pH < 4.4 is possible with an acid rate of at least 67 mmol H2SO4 L−1. The acid pH required to reduce microbial counts in the RMS can be consistently attained with the Quick Wash process by including a pH controller to inject the acid [16].

3.5.2. Organic Soil Amendment

Application of dairy manure to soils adds organic N along with organic C and stimulates mineralization of organic N and C with production of NH4+ and NO3 through microbial ammonification and nitrification [39,40]. However, high NH3 volatilization losses from standard surface-broadcast application of dairy manure slurry limits N availability for plants and fosters air pollution concerns [41,42]. Other field application techniques such as surface-banded applications and soil incorporation by shallow injection of dairy manure slurry managed to reduce NH3 emissions in the range of 25 to 40% [39,41]. However, data reported on acidification of cattle manure slurry showed decreased field NH3 emissions in the range of 15 to 80% [32].
To evaluate the RMS as a source of N, we performed a 70-day laboratory incubation trial to compare NH3 emissions and N mineralization after surface application or incorporation into soil of UDM and acidified RMS (Table 4). The trial consisted of applying UDM and acidified RMS (N:P 11.3) on surface or incorporated into soil at a single N application equivalent to 160 kg N ha−1. On average, we observed significant differences in cumulative NH3 gas emissions between the control and the surface soil application of either UDM or acidified RMS (p < 0.05). In addition, we observed significant differences between the means of cumulative NH3 emissions from both surface applied materials. The mean cumulative NH3 emission from acidified RMS was almost two-fold higher than the NH3 emission from surface applied UDM (Table 4). In contrast, differences from incorporation of UDM or acidified RMS and the control were not significant. With respect to surface soil application of UDM and RMS, incorporation of UDM reduced NH3 emission by 80%, and RMS by 88%. These results are consistent with reported average reduction of NH3 emissions by 71% for shallow injection of manure, and attributed to the reduced contact of applied manure with the atmosphere [43].
Studies on soils amended with acidified manures reported lower rates of N mineralization than soils amended with non-acidified materials [24,44]. Instead, in this study we observed significant N mineralization with conversion of organic N to NH4+ from the amended soil with either UDM or RMS. Under the controlled soil moisture and temperature of our incubation study, the favorable C:N ratio of 13.4:1 for UDM and 11.1:1 for RMS allowed for N mineralization with a subsequent transformation of soil NH4+-N into NO3-N. At the end of the 70-day incubation test, most of the soil inorganic N was in the NO3-N form (Table 4). The soil with the acidified RMS incorporated had the highest NO3-N content (83.2 mg kg−1) and the lowest NH3 emission (10 µg NH3-N kg−1) of all four soil amendment treatments.
From the results of this incubation study, we concluded that the incorporation into soil of either UDM or the acidified RMS significantly reduced the NH3 emissions with respect to surface application. The shallow soil incorporation of acidified RMS had the advantage over the incorporation of UDM of a significantly higher soil NO3-N content with a potential to reduce build-up of soil P.
Since the N:P ratios of UDM and acidified RMS can affect the build-up of soil P, we made a rough estimate of their potential contribution to the build-up of P based on soil test analysis and soil fertility indices [45]. For the Norfolk soil in our study, we used the following soil fertility indices in mg P kg−1 (Mehlich 1 extraction) for South Carolina Coastal Plain soils: low < l6, medium 16–30, high 31–60, and very high > 60. Our soil test results showed the control soil had 21 mg P kg−1 with a medium P rating. At a single N application rate of 160 mg N kg−1, UDM (N:P 5.5) contributed with 15 mg P kg−1 to the initial 21 mg P kg−1 of the control for a total build-up of 36 mg P kg−1, raising the fertility index from medium to high. In contrast, the RMS (N:P 11.3) contributed with 4 mg P kg−1 for a total build-up of 25 mg P kg−1, keeping the medium soil fertility rating. Under the conditions of our incubation test we were limited to address the long-term dynamics of P forms and retention in manure-amended soils [46]. However, our results suggest that acidified RMS with a balanced N:P ratio could be part of a farm nutrient management plan to slow down the long-term build-up of soil P while reducing P losses and the risk of surface water impairment.

3.6. Economic Outlook

The manure management systems utilized by dairy farmers seldom consist of a single treatment but usually numerous treatment technologies interconnected to achieve the manure management goals of their operation [9]. Therefore, a complete economic evaluation for the use of the Quick Wash process to recover manure solids and P from dairy manure slurry requires taking into account additional annual operation costs and the annualized energy and capital or rental cost of the equipment (e.g., solid separation and polymer injection equipment, pumps, and tanks). We conducted a partial cost analysis to estimate the chemical cost to treat one m3 of dairy manure slurry. We assumed lactating Jersey cows have an average weight of 450 kg per animal with a milk production of 34 kg d−1 generating a manure volume of 0.068 m3 d−1 per animal according to USDA-NRCS [47]. A herd of 300 Jersey cows produces about 20.4 m3 d−1 of manure slurry. Table 5 shows the total cost of chemicals U$ 39.49 to treat 20.4 m3 d−1 of dairy manure slurry. Therefore, the treatment cost per unit of volume of slurry is U$ 1.93 m−3 d−1 or U$ 0.13 cow−1 d−1.
To estimate the value of the Quick Wash products, we used a cost of U$ 0.96 kg−1 N and U$ 1.08 kg−1 P2O5 for the recovered phosphate material, fine RMS, and the final liquid effluent. We used the average cost of N from urea (46% N) and P from triple super-phosphate (46% P2O5) for 2018 from the U.S. Farm Prices of Selected Fertilizers database provided by the USDA-ERS [48]. According to the mass balance in Figure 3, the total combined value of the N and P in the three products was U$ 2.66 m−3. In addition, the coarse RMS use can cut the cost of both bedding material and hauling manure with an estimated value of U$ 0.11 cow−1 d−1 [49]. A potential additional income could be environmental credit programs such as carbon credits and nutrient trading programs [15].

4. Conclusions

We proposed to treat dairy manure slurry using the Quick Wash process to recover manure solids with a more balanced N:P ratio after acid extraction of P. The dairy slurry treatment consisted of the Quick Wash process integrated with a two-stage solid-liquid separation to recover separate streams of coarse and fine manure solids. The coarser RMS appear suitable for use as bedding for dairy cows and acidification could improve the hygiene of bedding materials. The acidified finer RMS had N:P ratios between 11.3 and 13.6 that are more balanced for crop production. The use of fine RMS as an N-rich but low-P organic soil amendment can be an adequate source of N for plants while reducing the long-term build-up of soil P. Following the solid separation, we recovered up to 54% of the initial total P of the untreated slurry by precipitation at pH 8 from the acid extract. We tested previously the value of recovered P produced by the Quick Wash for its use as a source of fertilizer for crop production [50,51]. Therefore, our results suggest that the inclusion of the Quick Wash approach into a dairy manure management system could improve manure’s value, and possibly lower costs of bedding material and manure hauling while reducing the environmental impact of land spreading manure P.

Author Contributions

Conceptualization, A.A.S. and V.H.T.; methodology, P.D.S.; investigation, V.H.T. and P.D.S.; data curation, P.D.S.; writing—original draft preparation, A.A.S.; writing—review and editing, P.D.S. All authors have read and agreed to the published version of the manuscript.

Funding

This research was funded by the U.S. Department of Agriculture (USDA). A fellowship funded by Agencia Nacional de Investigación e Innovación (ANII), Uruguay was awarded to V.H.T. to do research work at the USDA-ARS Coastal Plains Soil, Water and Plant Research Center, Florence, SC, USA.

Acknowledgments

The authors thank Brian Smith, Clemson University Extension, for his help with selecting dairies and manure sample collection. Mention of trade names or commercial products in this article is solely for the purpose of providing specific information and does not imply recommendation or endorsement by the U.S. Department of Agriculture.

Conflicts of Interest

The authors declare no conflict of interest.

References

  1. Milbrandt, A.; Seiple, T.; Heimiller, D.; Skaggs, R.; Coleman, A. Wet waste-to-energy resources in the United States. Resour. Conserv. Recy. 2018, 137, 32–47. [Google Scholar] [CrossRef]
  2. USEPA. NPDES Permit Writers’ Manual for Concentrated Animal Feeding Operations. Available online: https://www.epa.gov/npdes/npdes-permit-writers-manual-concentrated-animal-feeding-operations (accessed on 29 October 2020).
  3. Penuelas, J.; Janssens, I.A.; Ciais, P.; Obersteiner, M.; Sardans, J. Anthropogenic global shifts in biospheric N and P concentrations and ratios and their impacts on biodiversity, ecosystem productivity, food security, and human health. Glob. Chang. Biol. 2020, 26, 1962–1985. [Google Scholar] [CrossRef] [PubMed] [Green Version]
  4. McDowell, R.; Dodd, R.; Pletnyakov, P.; Noble, A. The ability to reduce soil legacy phosphorus at a country scale. Front. Environ. Sci. 2020, 8, 1–12. [Google Scholar] [CrossRef] [Green Version]
  5. Maguire, R.O.; Brake, J.T. Managing Soils and Terrestrial Systems; CRC Press: Boca Raton, FL, USA, 2020; pp. 459–462. [Google Scholar]
  6. Lory, J.A. Managing Manure Phosphorus to Protect Water Quality; MU Extension; University of Missouri: Columbia, MO, USA, 2018; Volume G, p. 9182. [Google Scholar]
  7. Szogi, A.A.; Vanotti, M.B.; Ro, K.S. Methods for treatment of animal manures to reduce nutrient pollution prior to soil application. Curr. Pollut. Rep. 2015, 1, 47–56. [Google Scholar] [CrossRef]
  8. Chen, M.; Graedel, T.E. A half-century of global phosphorus flows, stocks, production, consumption, recycling, and environmental impacts. Glob. Environ. Chang. 2016, 36, 139–152. [Google Scholar] [CrossRef]
  9. Oliver, J.P.; Schueler, J.E.; Gooch, C.A.; Lansing, S.; Aga, D.S. Performance quantification of manure management systems at 11 northeastern US dairy farms. Appl. Eng. Agric. 2018, 34, 973–1000. [Google Scholar] [CrossRef]
  10. Vanotti, M.; Garcia-Gonzalez, M.; Szögi, A.; Harrison, J.; Smith, W.; Moral, R. Removing and recovering nitrogen and phosphorus from animal manure. In Animal Manure: Production, Characteristics, Environmental Concerns and Management; Waldrip, H.M., Pagliari, P.H., He, Z., Eds.; American Society of America: Madison, WI, USA, 2020; Volume 67, pp. 275–321. [Google Scholar]
  11. House, H. Using separated manure solids for compost bedding. Factsheet Agdex 2016, 410, 721. [Google Scholar]
  12. Harrison, J.; Ndegwa, P. Anaerobic digestion of dairy and swine waste. In Animal Manure: Production, Characteristics, Environmental Concerns and Management; Waldrip, H.M., Pagliari, P.H., He, Z., Eds.; American Society of America: Madison, WI, USA, 2020; Volume 67, pp. 115–127. [Google Scholar]
  13. Tallou, A.; Haouas, A.; Jamali, M.Y.; Atif, K.; Amir, S.; Aziz, F. Smart Village Technology; Springer: Berlin/Heidelberg, Germany, 2020; pp. 341–352. [Google Scholar]
  14. Informa; Economics. National Market Value of Anaerobic Digester Products; Innovation Center for U.S. Dairy: Rosemont, IL, USA, 2013; p. 118. [Google Scholar]
  15. Vegh, T.; Murray, B. Incentivizing the Reduction of Pollution at US Dairies. J. Agric. Food Syst. Comm. Develop. 2020, 9, 1–17. [Google Scholar] [CrossRef]
  16. Szogi, A.A.; Vanotti, M.B.; Hunt, P.G. Process for Removing and Recovering Phosphorus from Animal Waste. U.S. Patent No. 8,673,046, 18 March 2014. [Google Scholar]
  17. Chastain, J.P. Solid-Liquid Separation Alternatives for Manure Handling and Treatment; USDA Natural Resources Conservation Service: Washington, DC, USA, 2013. [Google Scholar]
  18. Chastain, J.P. Field evaluation of a two-stage liquid-solid separation system at a California dairy. In Proceedings of the American Society of Agricultural and Biological Engineers, Reno, NV, USA, 21–24 June 2009; p. 12. [Google Scholar]
  19. Garcia, M.C.; Szogi, A.A.; Vanotti, M.B.; Chastain, J.P. Solid-liquid separation of dairy manure with PAM and chitosan polymers. In Proceedings of the International Symposium on Air Quality and Waste Management for Agriculture, Broomfield, CO, USA, 16–19 September 2007; p. 45. [Google Scholar]
  20. Garcia, M.; Szogi, A.; Vanotti, M.; Chastain, J.; Millner, P. Enhanced solid–liquid separation of dairy manure with natural flocculants. Bioresour. Technol. 2009, 100, 5417–5423. [Google Scholar] [CrossRef]
  21. Szogi, A.A.; Vanotti, M.B.; Hunt, P.G. Phosphorus recovery from pig manure solids prior to land application. J. Environ. Manag. 2015, 157, 1–7. [Google Scholar] [CrossRef]
  22. University, C. Regulatory Services Soil Test Rating System. Available online: https://www.clemson.edu/public/regulatory/ag-srvc-lab/soil-testing/pdf/rating-system.pdf (accessed on 20 October 2020).
  23. Linn, D.M.; Doran, J.W. Effect of water-field pore space on carbon dioxide and nitrous oxide production in tilled and non-tilled soils. Soil Sci. Soc. Am. J. 1984, 48, 1267–1272. [Google Scholar] [CrossRef] [Green Version]
  24. Szogi, A.A.; Shumaker, P.D.; Ro, K.S.; Sigua, G.C. Nitrogen mineralization in a sandy soil amended with treated low-phosphorus broiler litter. Environments 2019, 6, 96. [Google Scholar] [CrossRef] [Green Version]
  25. APHA. Standard Methods for Examination of Water and Wastewater, 20th ed.; American Public Health Association: Washington, DC, USA, 1998. [Google Scholar]
  26. Peters, J.; Combs, S.; Hoskins, B.; Jarman, J.; Kovar, J.; Watson, M.; Wolf, A.; Wolf, N. Recommended Methods of Manure Analysis; University of Wisconsin Cooperative Extension Publishing: Madison, WI, USA, 2003. [Google Scholar]
  27. Sims, G.K.; Ellsworth, T.R.; Mulvaney, R.L. Microscale determination of organic nitrogen in water and soil extracts. Commun. Soil. Sci. Plant Anal. 1995, 26, 303–316. [Google Scholar] [CrossRef]
  28. ASTM. Anions in Water by Suppressed Ion Chromatography; ASTM Standard D4327-11; American Society of Testing Materials International: West Conshohocken, PA, USA, 2011. [Google Scholar]
  29. Szögi, A.A.; Vanotti, M.B.; Hunt, P.G. Phosphorus recovery from poultry litter. Trans. ASABE 2008, 51, 1727–1734. [Google Scholar] [CrossRef] [Green Version]
  30. Pagliari, P.H.; Wilson, M.; Waldrip, H.M.; He, Z. Nitrogen and phosphorus characteristics of beef and dairy manure. In Animal Manure: Production, Characteristics, Environmental Concerns, and Management; Waldrip, H.M., Pagliari, P.H., He, Z., Eds.; American Society of America: Madison, WI, USA, 2020; Volume 67, pp. 45–62. [Google Scholar]
  31. Meyer, D.; Ristow, P.; Lie, M. Particle size and nutrient distribution in fresh dairy manure. Appl. Eng. Agric. 2007, 23, 113–118. [Google Scholar] [CrossRef]
  32. Fangueiro, D.; Hjorth, M.; Gioelli, F. Acidification of animal slurry—A review. J. Environ. Manag. 2015, 149, 46–56. [Google Scholar] [CrossRef] [PubMed]
  33. Chastain, J.P.; Vanotti, M.B.; Wingfield, M.M. Effectiveness of liquid–solid separation for treatment of flushed dairy manure: A case study. Appl. Eng. Agric. 2001, 17, 343. [Google Scholar] [CrossRef] [Green Version]
  34. Hristov, A.N.; Zaman, S.; Vander Pol, M.; Ndegwa, P.; Campbell, L.; Silva, S. Nitrogen losses from dairy manure estimated through nitrogen mass balance and chemical markers. J. Environ. Qual. 2009, 38, 2438–2448. [Google Scholar] [CrossRef] [Green Version]
  35. Schwarz, M.; Bonhotal, J.; Staehr, A.E. Use of Dried Manure Solids as Bedding for Dairy Cows; Cornell Waste Management Institute: Ithaca, NY, USA, 2010; p. 9. [Google Scholar]
  36. Klaas, I.; Zadoks, R. An update on environmental mastitis: Challenging perceptions. Transbound. Emerg. Dis. 2018, 65, 166–185. [Google Scholar] [CrossRef] [Green Version]
  37. Hogan, J.; Wolf, S.; Petersson-Wolfe, C. Bacterial counts in organic materials used as free-stall bedding following treatment with a commercial conditioner. J. Dairy Sci. 2007, 90, 1058–1062. [Google Scholar] [CrossRef]
  38. Proietto, R.; Hinckley, L.; Fox, L.; Andrew, S. Evaluation of a clay-based acidic bedding conditioner for dairy cattle bedding. J. Dairy Sci. 2013, 96, 1044–1053. [Google Scholar] [CrossRef] [Green Version]
  39. Powell, J.; Jokela, W.; Misselbrook, T. Dairy slurry application method impacts ammonia emission and nitrate leaching in no-till corn silage. J. Environ. Qual. 2011, 40, 383–392. [Google Scholar] [CrossRef]
  40. Thangarajan, R.; Bolan, N.S.; Tian, G.; Naidu, R.; Kunhikrishnan, A. Role of organic amendment application on greenhouse gas emission from soil. Sci. Total Environ. 2013, 465, 72–96. [Google Scholar] [CrossRef]
  41. Pfluke, P.D.; Jokela, W.E.; Bosworth, S.C. Ammonia volatilization from surface-banded and broadcast application of liquid dairy manure on grass forage. J. Environ. Qual. 2011, 40, 374–382. [Google Scholar] [CrossRef] [PubMed] [Green Version]
  42. Thompson, R.; Meisinger, J. Management factors affecting ammonia volatilization from land-applied cattle slurry in the Mid-Atlantic USA. J. Environ. Qual. 2002, 31, 1329–1338. [Google Scholar] [CrossRef]
  43. Mohankumar Sajeev, E.P.; Winiwarter, W.; Amon, B. Greenhouse gas and ammonia emissions from different stages of liquid manure management chains: Abatement options and emission interactions. J. Environ. Qual. 2018, 47, 30–41. [Google Scholar] [CrossRef] [Green Version]
  44. Fangueiro, D.; Surgy, S.; Coutinho, J.; Vasconcelos, E. Impact of cattle slurry acidification on carbon and nitrogen dynamics during storage and after soil incorporation. J. Plant Nutr. Soil Sci. 2013, 176, 540–550. [Google Scholar] [CrossRef]
  45. Sikora, F.; Moore, K. Soil Test Methods from the Southeastern United States; Southern Cooperative Series Bulletin, No. 419; Southern Extension and Research Activity Information Exchange Group: Washington, DC, USA, 2014; pp. 11–18. [Google Scholar]
  46. Lehmann, J.; Lan, Z.; Hyland, C.; Sato, S.; Solomon, D.; Ketterings, Q.M. Long-term dynamics of phosphorus forms and retention in manure-amended soils. Environ. Sci. Technol. 2005, 39, 6672–6680. [Google Scholar] [CrossRef]
  47. USDA-NRCS. Agricultural Waste Characteristics. 2008. Available online: https://directives.sc.egov.usda.gov/viewerFS.aspx?hid=21430 (accessed on 29 October 2020).
  48. USDA-ERS. Fertilizer Use and Price. Available online: https://www.ers.usda.gov/data-products/fertilizer-use-and-price/ (accessed on 29 October 2020).
  49. Bonhotal, J.; Harrison, E.; Schwarz, M.; Staehr, A.E. Research Update: Dairy Manure Solids Cut Bedding Costs. Pro-Dairy, 24–25 June 2008. [Google Scholar]
  50. Szogi, A.A.; Bauer, P.J.; Vanotti, M.B. Fertilizer Effectiveness of Phosphorus Recovered from Broiler Litter. Agron. J. 2010, 102, 723–727. [Google Scholar] [CrossRef] [Green Version]
  51. Bauer, P.; Szogi, A.; Novak, J.; Vanotti, M. Phosphorus recovered from swine wastewater as a fertilizer for cotton grown with conservation tillage. J. Cotton Sci. 2012, 16, 97–104. [Google Scholar]
Figure 1. Quick Wash process schematic for phosphorus (P) extraction and recovery.
Agronomy 10 01725 g001
Figure 2. Schematic diagram of the three treatments tested for solids separation of manure using a double-stage stationary separator with two screens Sep 1 (12.7 mm) and Sep 2 (0.25 mm) and alternative points for acid injection for phosphorus (P) extraction.
Agronomy 10 01725 g002
Figure 3. Recovered manure solids using a two-stage solid-liquid separation screen with acid addition. Data are expressed on a dry basis as percentage of initial total solids content of untreated dairy manure slurry. Treatments: (1) no acidification (control), (2) acid added before Sep 1 (12.7 mm screen), and (3) acid added before Sep 2 (0.25 mm screen). Bars represent the mean of duplicate tests. Means with the same letter (a, b, or c) are not significantly different according to LSD0.05.
Agronomy 10 01725 g003
Figure 4. Mass flow of total solids (TS), phosphorus (TP), and nitrogen (TN) through the Quick Wash process integrated with the double stage solid-liquid separation (Sep 1 = 12.7-mm screen, Sep 2 = 0.25 mm screen). Chemical inputs: A = acid; F = flocculant; L = liquid lime; AP = anionic polymer. Data are for Treatment 3 from Figure 3, and Table 2 and Table 3. RMS = recovered manure solids.
Agronomy 10 01725 g004
Figure 5. Recovered manure solids (RMS) from Sep 1 (>12.7 mm), Sep 2 (12.5 mm–0.25 mm), and recovered phosphate material (>0.25 mm).
Agronomy 10 01725 g005
Table 1. Effect of acid addition and mixing time on extracted phosphorus from dairy manure.
Acid RateMixing Time
20 min24 h
(98% H2SO4)pHPO4-PTP Extracted 1pHPO4-PTP Extracted
mmol L−1g L−1 mg L−1% mg L−1%
006.62111206.4731558
60.576.26319586.1535264
121.145.88349645.8237569
252.455.42422775.3636567
444.334.97428785.0339873
575.554.64439804.7439272
676.534.36449824.4638771
787.683.98463854.0740975
858.333.72511933.8743379
928.993.21495913.3943980
1 Percent P extracted with respect to the initial total P of the manure slurry (547 mg P L−1).
Table 2. Concentration of total C (TC), N (TN), P (TP), and N:P ratio on a dry basis in recovered dairy manure solids using a two-stage solid-liquid separation system with and without acid addition.
Screen (Sep) 1PAM 4Slurry
pH
TC
g kg−1
TN
g kg−1
TP
g kg−1
C:N
Ratio
N:P
Ratio
Initial UDM 206.91402305.513.45.5
Treatment 3
(1)1N6.91436172.425.67.3
2Y7.14449355.412.86.5
(2)1N5.12370141.926.47.4
2Y5.17459392.811.813.6
(3)1N6.96437172.427.77.3
2Y5.10446403.611.111.3
1 Sep 1 = 12.7 mm screen; Sep 2 = 0.25 mm screen. 2 UDM = untreated dairy manure slurry. 3 Treatments: (1) no acidification (control); (2) acid added before Sep 1; and (3) acid added before Sep 2. 4 PAM = Polyacrylamide addition.
Table 3. Recovery of phosphorus dairy manure slurry using the Quick Wash process.
Extracted P
(Step 1)
P Recovery (Steps 2 and 3)
pHAcid Extract 1pHApplied Lime 2Removed from ExtractRecovered Mass 3P Content Precipitate 4
mg L−1% g L−1mg L−1%% P2O5
5.6320606.00.6311.4
7.01.31843415.0
8.02.02825416.2
9.02.62815415.5
10.04.52955712.9
1 Acid extract (25 H2SO4 mmol L−1) collected after the double-stage screen solid separation (Treatment 3, Figure 2). 2 Application of hydrated lime [Ca (OH)2] plus anionic polymer for enhanced P precipitation. 3 Percent mass recovered in the precipitate with respect to the initial TP mass in the UDM slurry (520 mg P L−1) 4 % P2O5 = %P × 2.29 where %P is the dry content of P in the precipitated material (g TP per 100 g of precipitate).
Table 4. Cumulative ammonia emissions and soil ammonium and nitrate contents after a 70-day incubation of Norfolk soil amended with untreated dairy manure and acidified recovered manure solids. Means with the same letter (a, b, or c) are not significantly different according to LSD0.05.
Soil Amendment
Treatment 1
Cumulative Ammonia Production
(µg NH3-N kg−1)
Soil NH4+-N
mg kg−1
Soil NO3-N
mg kg−1
Control 210 c3.9 ab14.5 c
UDM Surface64 b2.2 b53.1 b
RMS Surface114 a5.2 a63.0 ab
UDM Incorporated13 c1.9 b 58.5 b
RMS Incorporated10 c2.4 b83.2 a
1 UDM = untreated dairy manure; RMS = acid treated recovered dairy manure solids; Surface = amendment applied on soil surface; Incorporated = applied below soil surface. 2 The control treatment contained 19.5 mg NH4+-N kg−1, and 3.5 mg NO3-N kg−1 at the onset of the soil incubation.
Table 5. Costs of chemicals for treating dairy manure slurry produced by 300 lactating cows (20.4 m3) using the Quick Wash process.
ItemUnit CostRateVolume 3Total
U$ kg−1kg m−3m−3 d−1 U$ d−1
Sulfuric Acid 10.322.45 118.214.27
Cationic Polymer3.000.3318.218.02
Anionic Polymer4.000.0417.30.28
Lime 20.202.00 217.36.92
Total chemical cost 39.49
1 Rate of sulfuric acid to attain a pH of about 5.1, Sep 2 screen (Table 2). 2 Rate of lime to attain a pH of 8.0 (Table 3). 3 Estimated from the solid/liquid volume fraction of 0.89 for Sep 1 screen and 0.95 for Sep 2.
Publisher’s Note: MDPI stays neutral with regard to jurisdictional claims in published maps and institutional affiliations.

