Abstract
In this research, direct band gap polymer composites with amorphous phase, which are imperative for optoelectronic devices applications were synthesized. The solution cast technique was used to produce polyethylene oxide (PEO)/calcium titanate (CaTiO3) nanocomposite (NC) films. The X-ray diffraction (XRD) confirms the growth of amorphous nature within PEO with CaTiO3 addition. The optical band gaps of pure PEO and PEO/CaTiO3 NC films were calculated using analysis of ultraviolet–visible (UV-Vis) spectra. The change in absorption edge toward lower photon energy is evidence of polymer modification. The dispersion behavior of the refractive index of PEO was manipulated to a higher wavelength upon doping with CaTiO3. Upon adding CaTiO3 to the pure PEO polymer, the dielectric constant and refractive index were considerably modified. The band gap shifts from 4.90 eV to 4.19 eV for the PEO incorporated with an optimum portion of 8 wt. % of CaTiO3. The types of the electronic transition in composite samples were specified, based on the Taucs model and the optical dielectric loss. The alteration of UV/Vis absorption spectra of the NC film was considered a suitable candidate to be applied in nanotechnology-based devices. The spherulites ascribed to the crystalline phase were distinguished through the optical microscopy (OM) study.
1. Introduction
Investigation of remarkable mechanical, electrical, and optical properties of polymer composites in specific applications, such as flexible electronics or photonics, is a highly active area of research [1]. As a principle, optical technologies, for example, light-emitting and solar cell devices, strongly rely on the interaction between advanced materials and light. It is also documented that polymer materials can be utilized in light-emitting diodes (LEDs), optical devices, and sensors. This is due to their attractive optical properties. Manipulation of polymer optical characteristics can be achieved simply by optimizing the appropriate dopant materials and concentrations. Several optical properties are mentioned herein, such as extinction coefficient, energy gaps, optical loss, and dielectric constants. These can be determined based on the significant optical parameters of polymeric film absorbance, transmittance, and reflectance.
Based on the literature, the calculation of the absorption coefficient, refractive index, extinction coefficient, and real and imaginary parts of the dielectric constant can easily be performed [2]. Polymer-based materials have desired optical and electrical properties. These materials have taken positions as materials of choice for various applications, such as batteries, solar cells, fuel cells, and capacitors [3,4,5,6]. Modifications in polymer materials involve electrical and optical properties, which, in turn, allows these materials to perform multifunctions. In principle, alteration in structure causes modification to the optical properties of polymers by fabricating nano-size materials. The dopant addition that causes the mechanism of electron transitions to change and reduces the energy band gap, is included in this structural modification [7]. From the analysis of optical properties, one can gain insight into the transition of electrons between conduction and valence bands in polymers. Furthermore, a comprehensive understanding of the charge transport phenomenon in polymers is gained from the electrical conduction property [8,9]. Based on previous works, polymers’ optical and electrical properties can be enhanced by incorporating metals and semiconductor particles [10,11,12,13]. The addition of fillers influence host materials are diverse; therefore, it is crucial to add proper fillers with optimum quantity [14]. The PEO consists of a linear structure that possesses semicrystalline polymer that contains a crystalline phase and amorphous phase at ambient temperature; however, it has a crystalline structure in its pure form [15]. PEO-based materials are promising polymer candidates because of their relatively high thermal stability [15]. It has several desired characteristics, such as satisfactory dimensional stability, good conductivity in the amorphous structure, cost-effectiveness, and sufficient corrosion resistance [3]. Moreover, it has a strong tendency to form a complex. All these factors make PEO an appropriate polymer electrolyte [16]. Furthermore, the PEO can be used as a host material for solid polymer electrolytes without solvents [1]. However, the ionic conductivity of PEO is not as high as required because of the abundance of crystalline phase in the structure, which is a challenging factor to reach the desired DC conductivity [2,15]. In general, the superiority of polymers comes from the transparency, cost-effectiveness, light weight, ease of processing, and robust mechanical property. Nevertheless, the PEO is the most suitable candidate to be applied in the optics area. One of the drawbacks of utilization this material is a relatively low index of refractive [7,17].
To improve the property of polymeric materials, the CaTiO3 was used. CaTiO3 is mostly applied in specific fields of electronic ceramics containing specific electronic ceramics, a positive temperature coefficient, and a ferroelectric ceramic capacitor [18,19]. CaTiO3, a vital lead-free Perovskite material, has newly attracted more attention by researchers due its interesting properties and different industrial applications [20]. Muhammed et al. [21] studied the structure and optical properties of PEO doped with tin titanate (SnTiO3) nano-filler using XRD and UV-Vis spectroscopy. The authors determined that the crystalline phase of PEO was decreased using SnTiO3. They also showed that the optical parameters, such as dielectric constant, refractive index, and absorption coefficient increased, while the optical energy band gap decreased. Hussen et al. [22] prepared nanocomposite polymer of polystyrene (PS) doped with SnZrO3 nanoparticle. The author used XRD and UV–Vis spectroscopy to investigate crystallinity and optical properties of the pure PS and nanocomposite films. The author showed that the amorphous phase and optical property were enhanced.
The aim of this study was directed toward creating new band gap energy using PEO incorporated with CaTiO3 nanoparticles. Tremendous work was required to achieve the hypothesis of introducing band gap energy levels. This study used the dielectric loss plot for determining the optical energy bandgap and Tauc’s model for identifying the types of electron transition. Several theoretical principles and experimental approaches were applied to prove the effectiveness of optical dielectric loss in determining the electron transition nature from the Tauc’s model. Hence, from the investigation of the band gap, it was apparent that earlier studies could not answer the questions around this topic. Additionally, these findings can serve as the basis for developing new approaches for manipulating optical properties via band gap alteration within the area of polymers and condensed matters.
2. Experiments
2.1. Polymer Composite Preparation
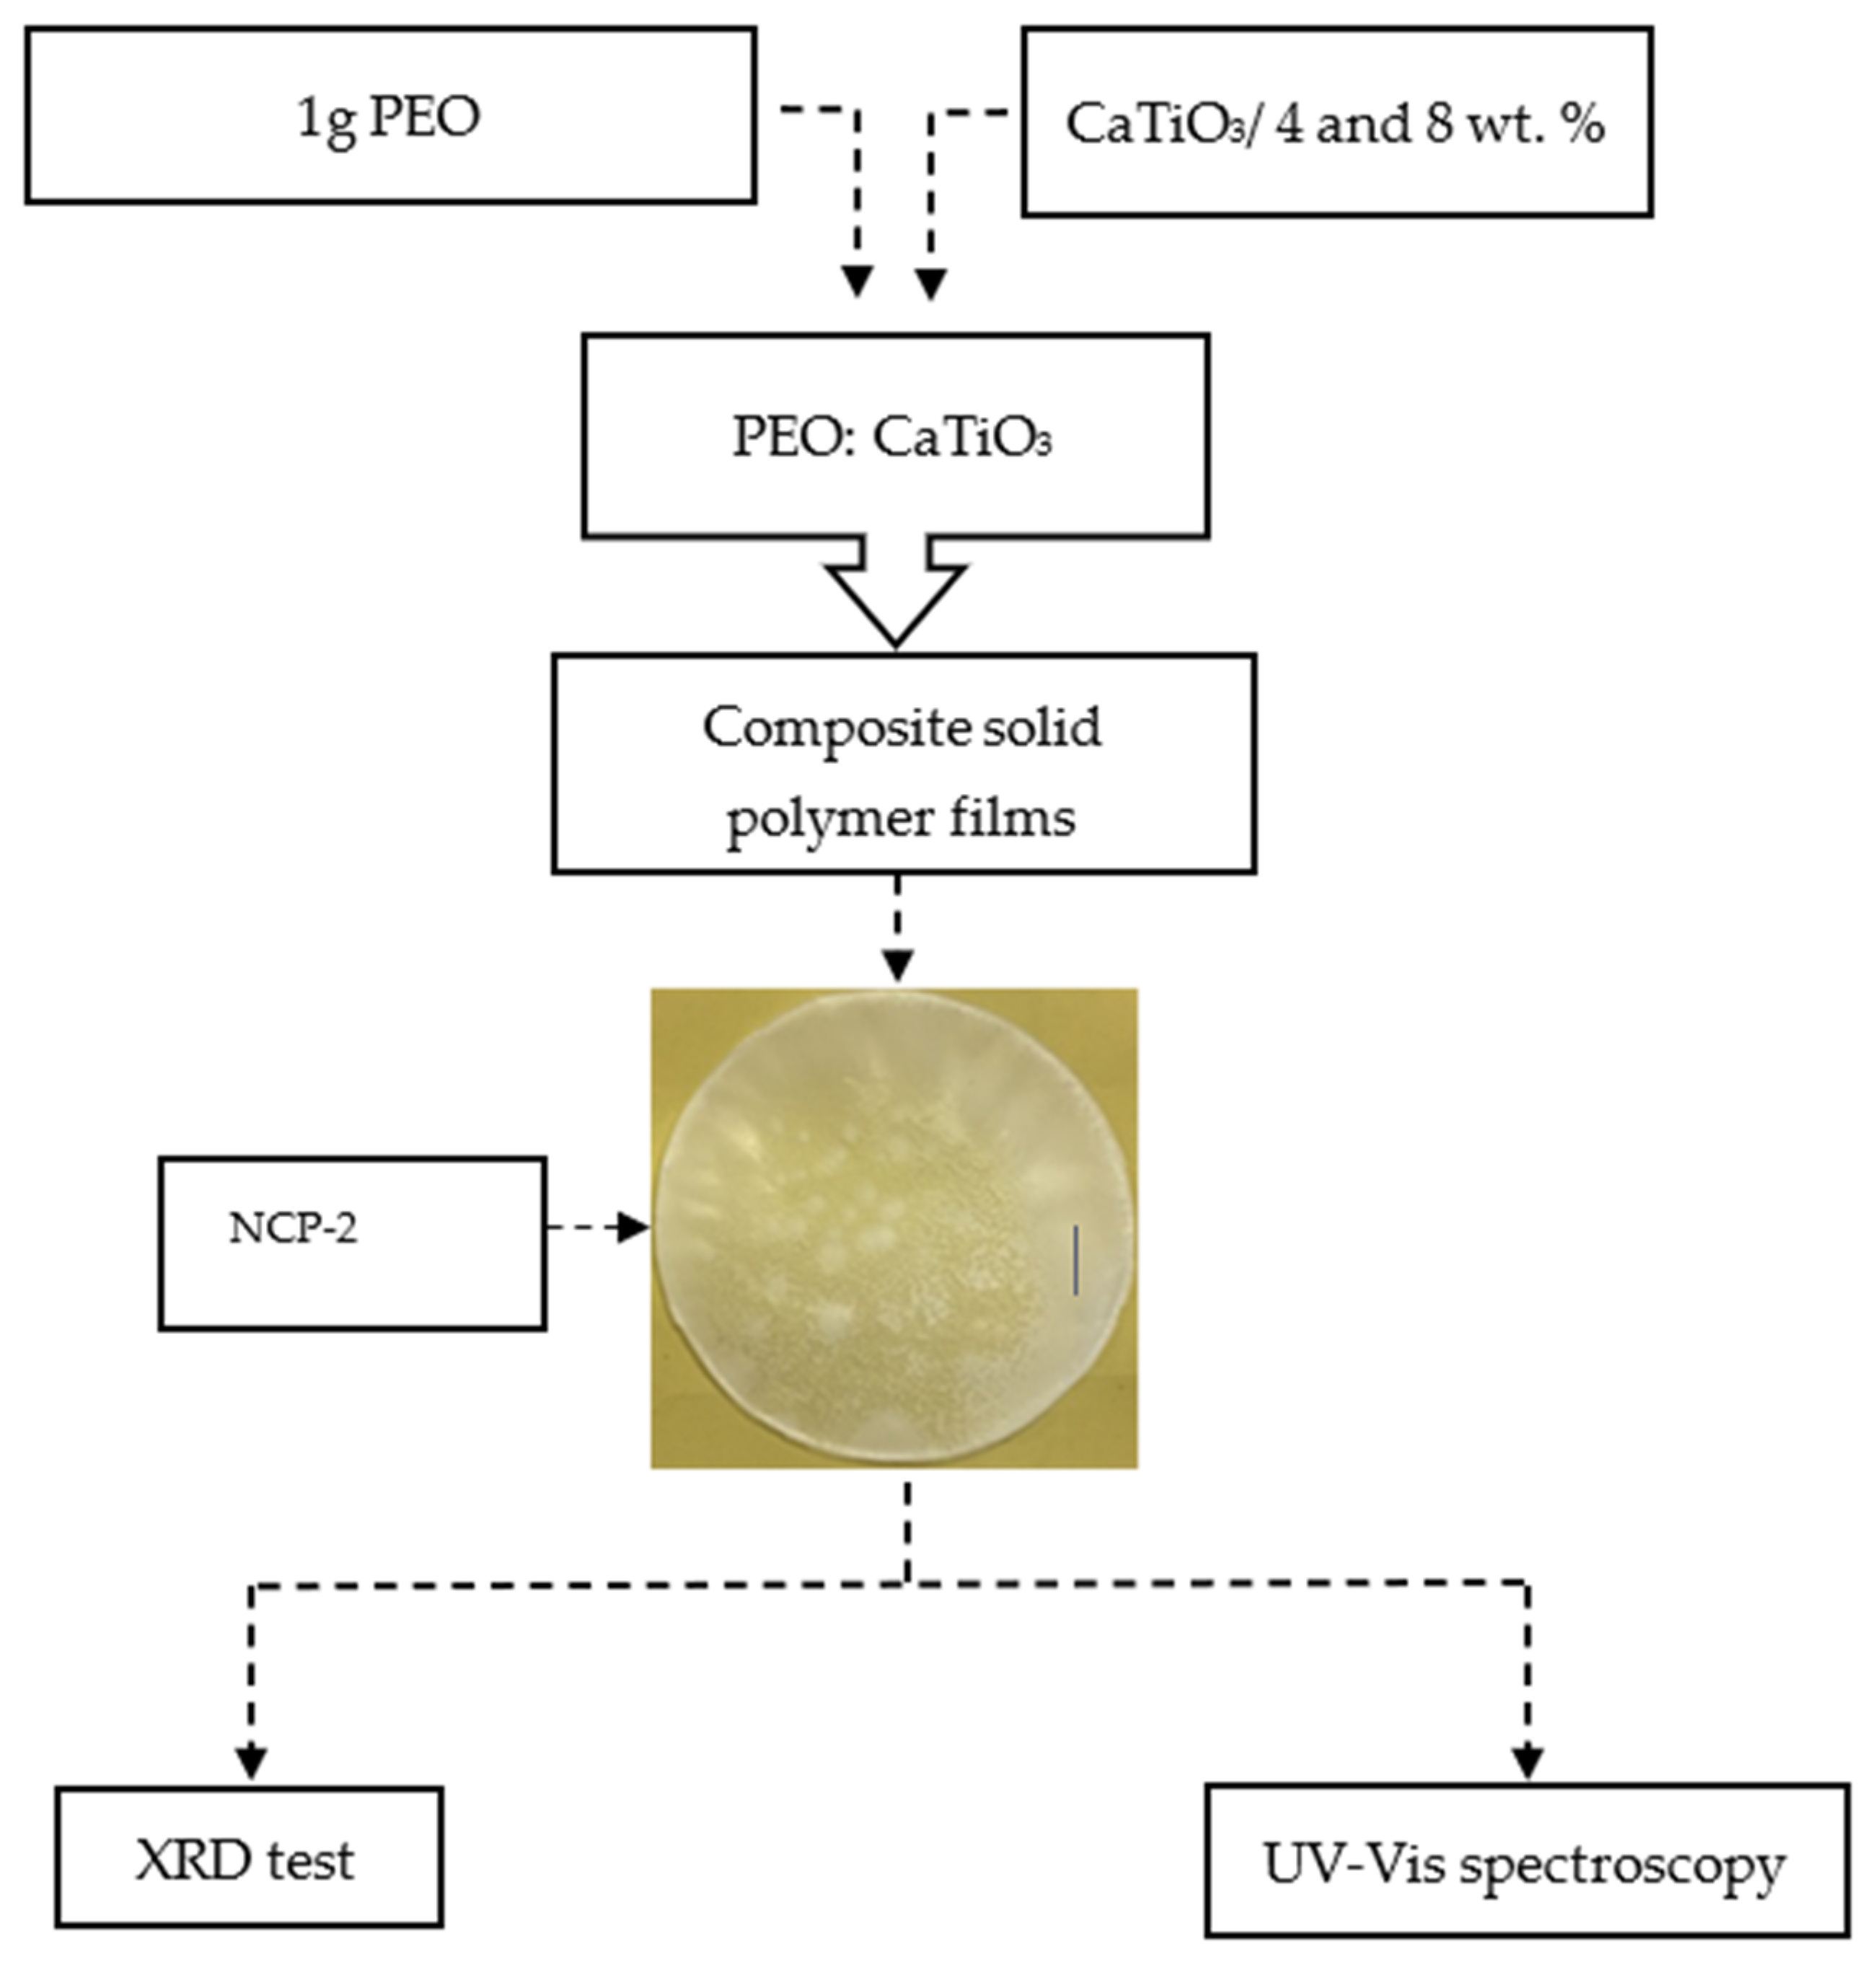
Polyethylene oxide (PEO) as a raw material in powder form was used in this work. It has a molecular weight > 5 × 10⁶ g·mol−1 and was bought from Sigma-Aldrich. The solution-casting technique was implemented in the film formation. The preparation of the solution of PEO polymer comprised the addition of 1 g of PEO powder into 50 mL distilled water. The mixture was stirred using a magnetic stirrer for five hrs at ambient temperature. When the solution of the polymer was gained as a clear viscous solution, two portions of 4 and 8 wt.% of CaTiO3 were added into two separate containers. Then, the stirring continued until the formation of the PEO/CaTiO3 polymer composite. The pure PEO and PEO-4 wt.% and 8 wt.% CaTiO3 were labelled as NCP-0, NCP-1, and NCP-2, respectively. Ultimately, plastic Petri dishes were used to cast the solutions by allowing them to dry at ambient temperature. Subsequently, the films were maintained in desiccators, enriched in silica gel for further drying. The thickness of the films used for characterization were in the range between 0.025 and 0.03 cm. A pictorial fabrication process and image of composite membranes for the fabricated composite films are shown in Figure 1.

Figure 1.
Flowchart of the composite preparation process and picture of composite membrane.
2.2. X-ray Diffraction (XRD)
The X-ray diffractometer (Empyrean XRD-Panalytical) operated at40-kV and 45-mA current, was used to gain the XRD at ambient temperature. A beam of X-ray with λ = 1.5406 A° was passed through each sample with the glancing angle ranged 10° ≤ 2θ ≤ 80°, in step size of 0.05°.
2.3. UV-Vis Measurement
A Jasco V-570 UV-Vis-NIR spectrophotometer (Japan, Jasco SLM-468) mode was employed to acquire the ultraviolet-visible (UV-vis) absorption spectra of the solid polymer films based on PEO.
3. Results and Discussion
3.1. XRD Analysis
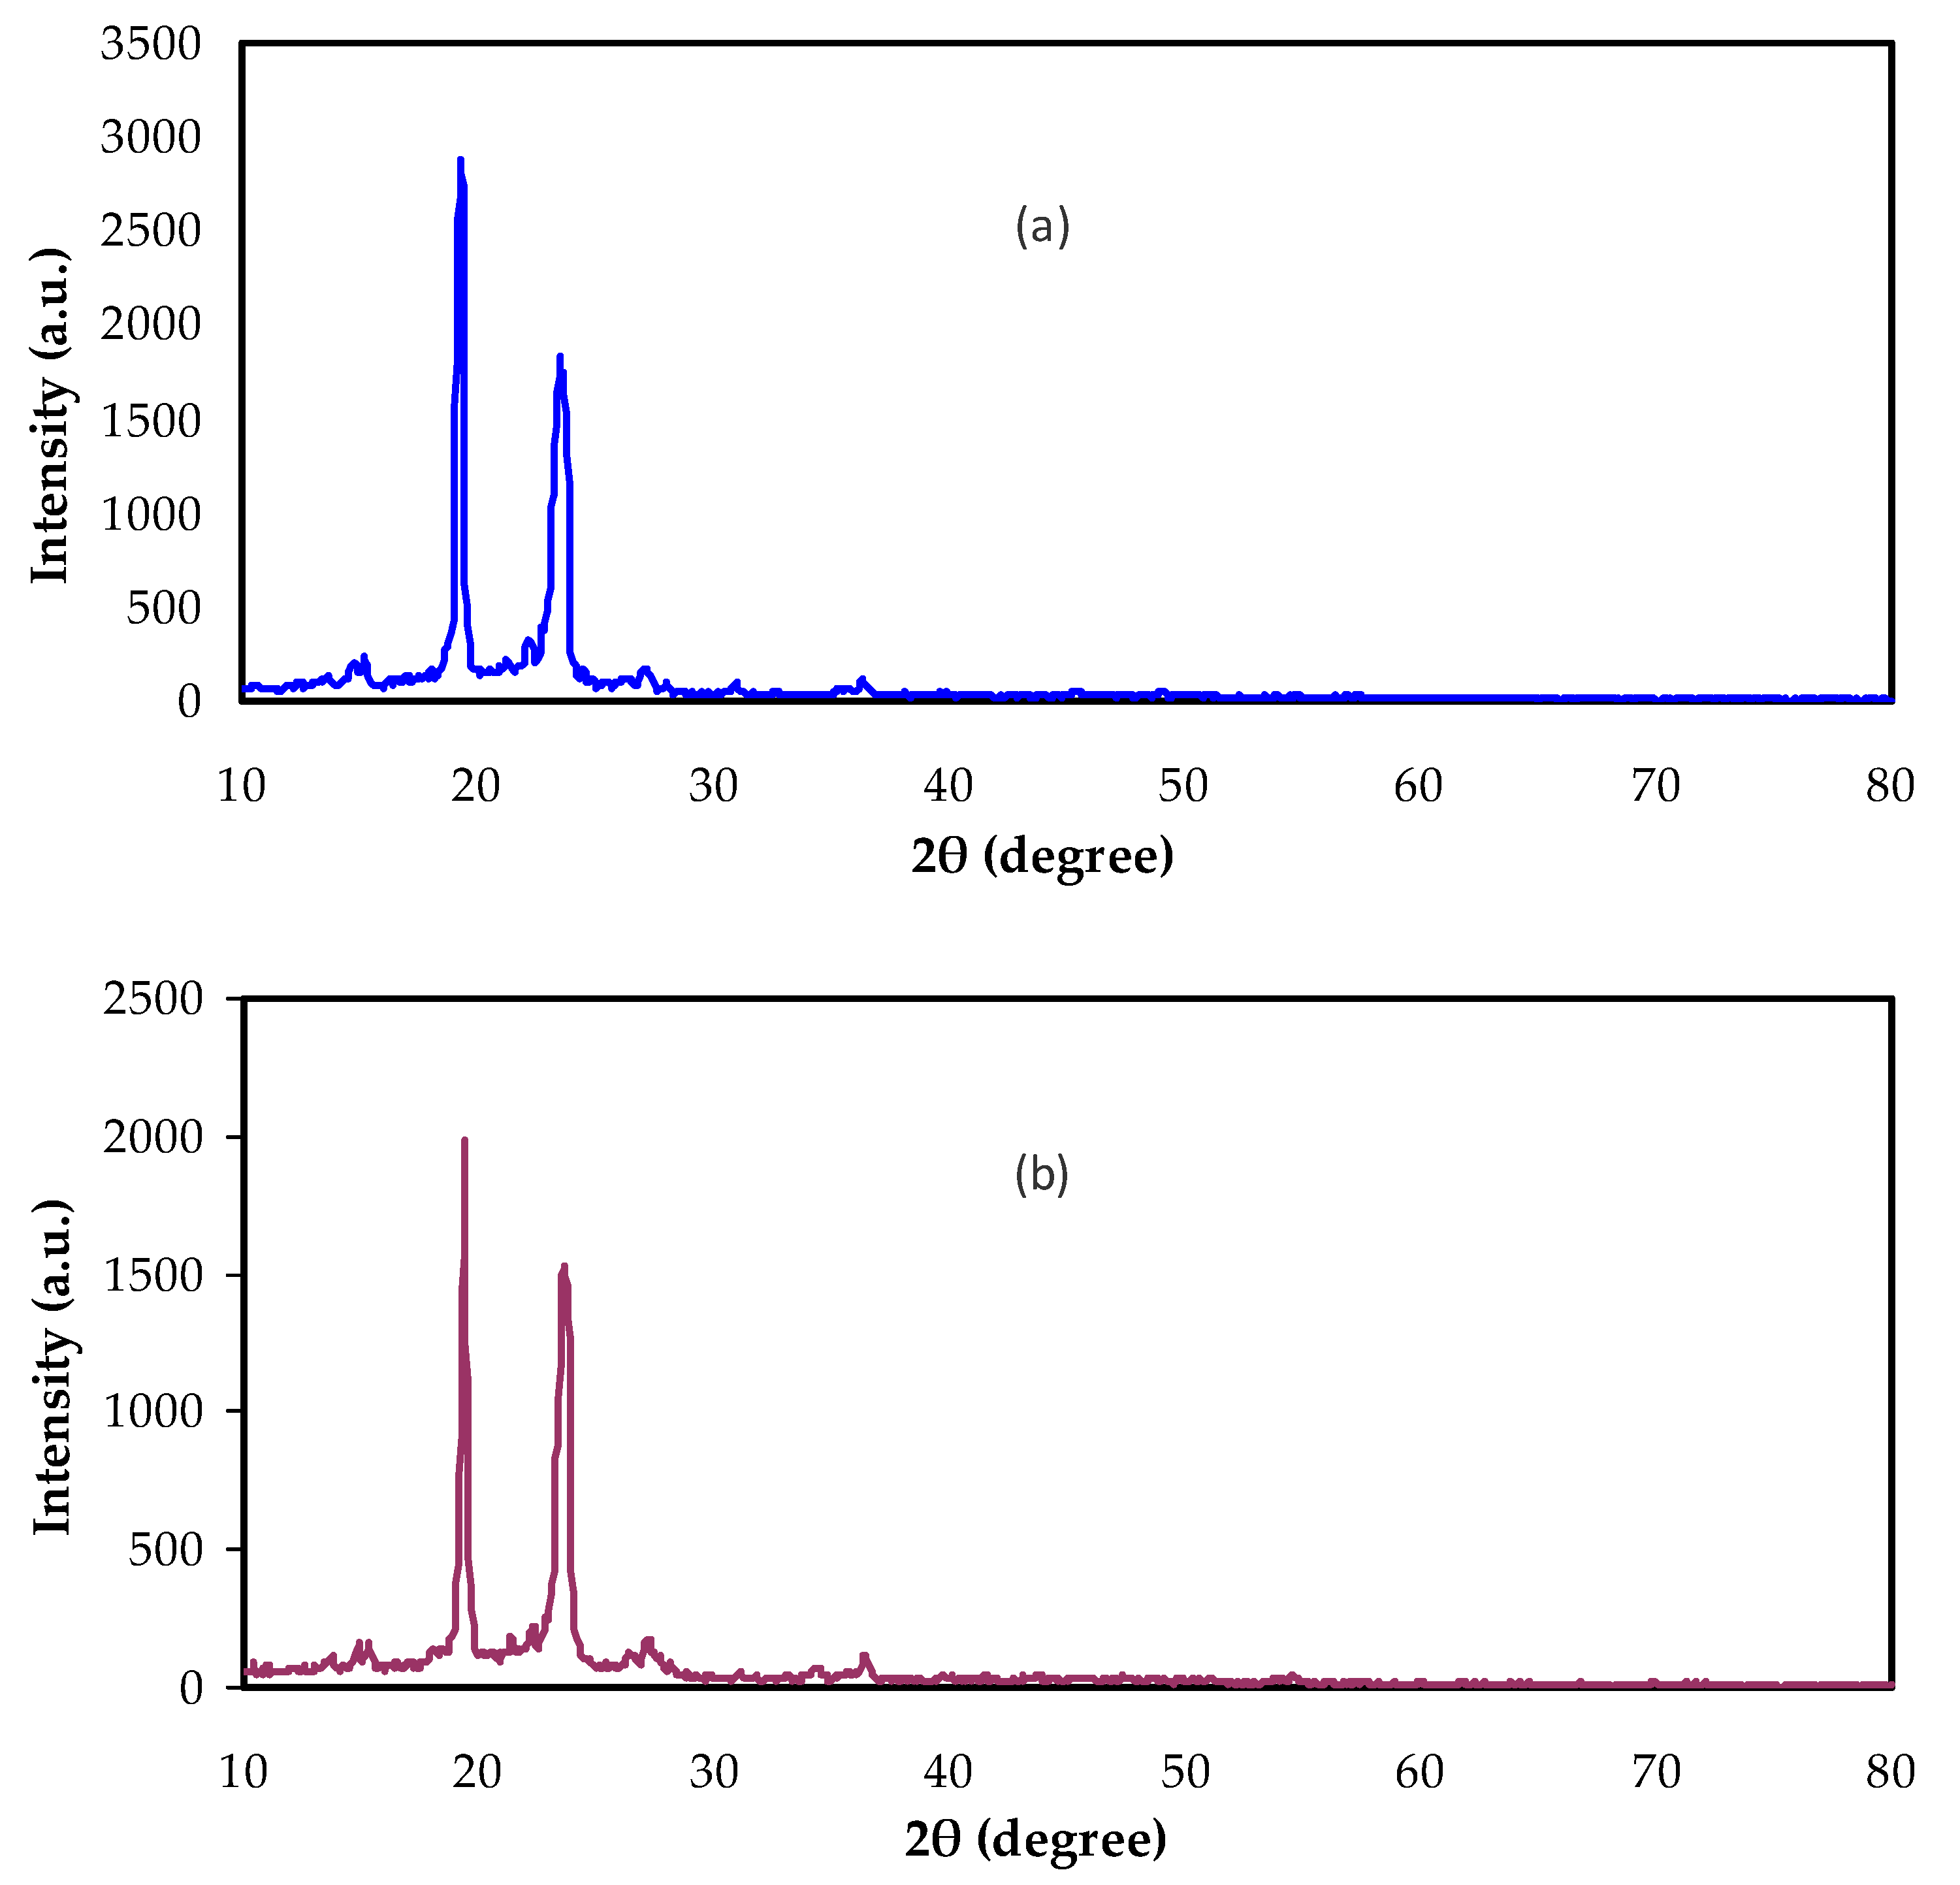
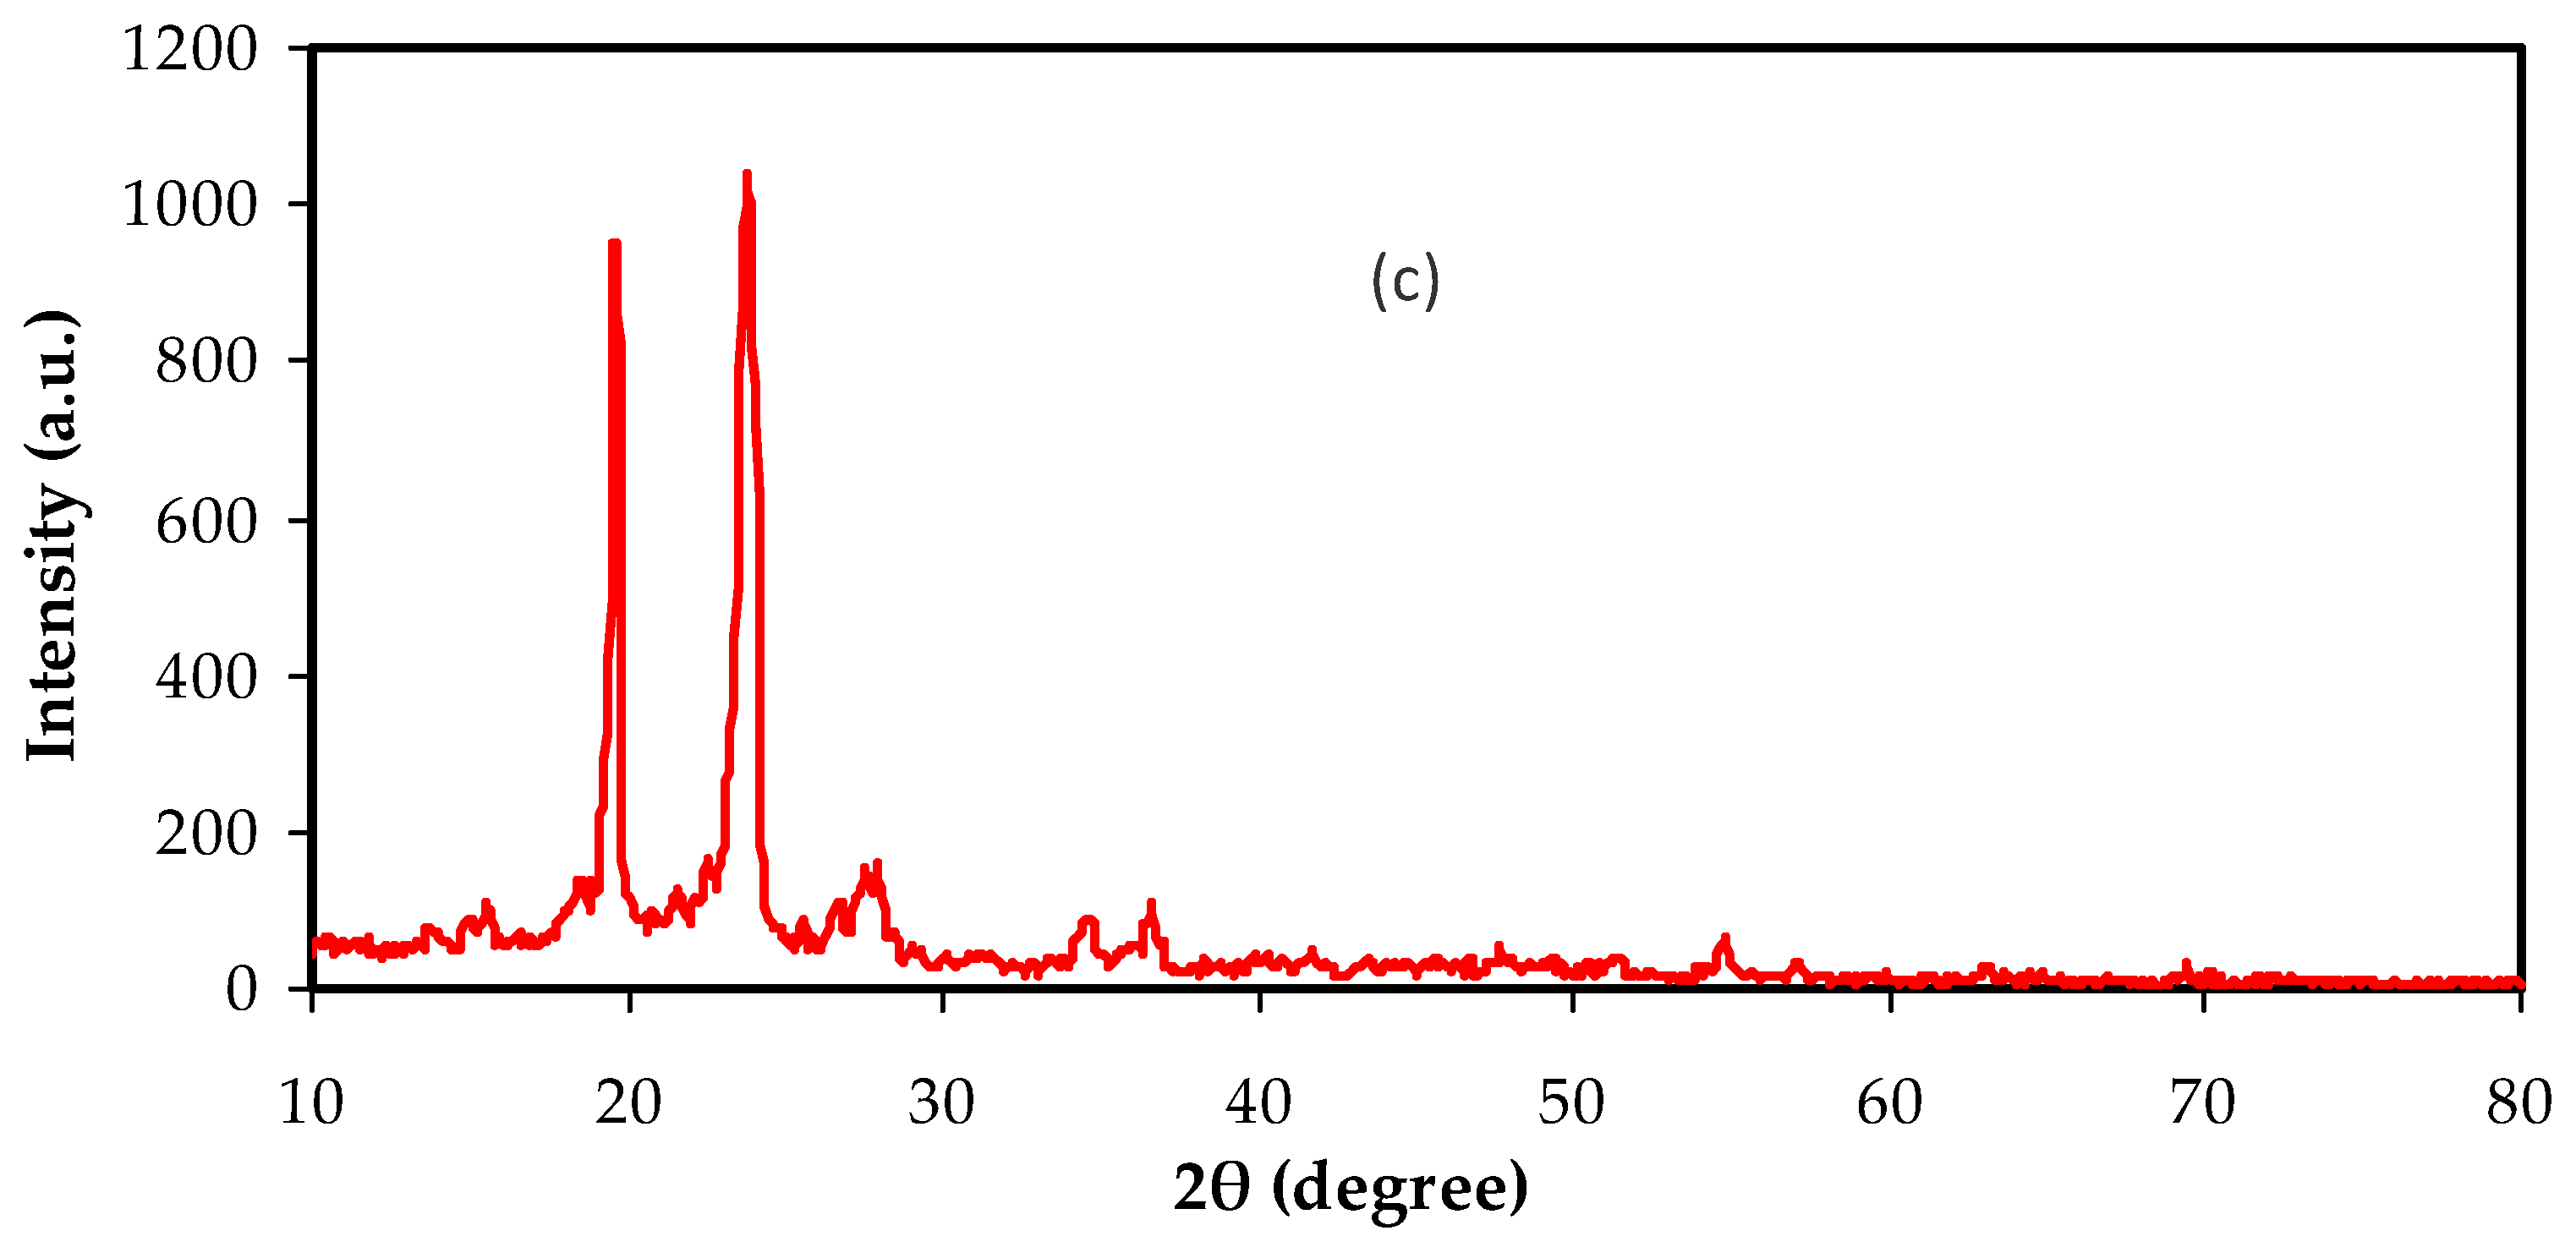
Figure 2 shows the XRD spectra for the neat PEO and composite systems. In Figure 2a, the XRD pattern of pure PEO is shown. We noticed that the crystalline phase dominates that evidenced by the presence of two narrow peaks [23]. Two main domains were seen; firstly, two essential peaks at 18° and 24°, and low-intensity peaks at the high angle appear. PEO polymers’ crystalline and semi-crystalline structures can be recognized from these different diffraction peaks [24,25,26]. The structure of PEO is identified to be both semi-crystalline and linear. The stabilization of the PEO crystalline structure, electrochemically and chemically, was the structural unit’s responsibility. The existence of C-O, C-C, and C-H bonds in PEO caused the polymer to be stable chemically and mechanically [15]. Rajeh et. al. [26], stated that the peaks at around 22° and 18° referred to (112) and (120) planes.
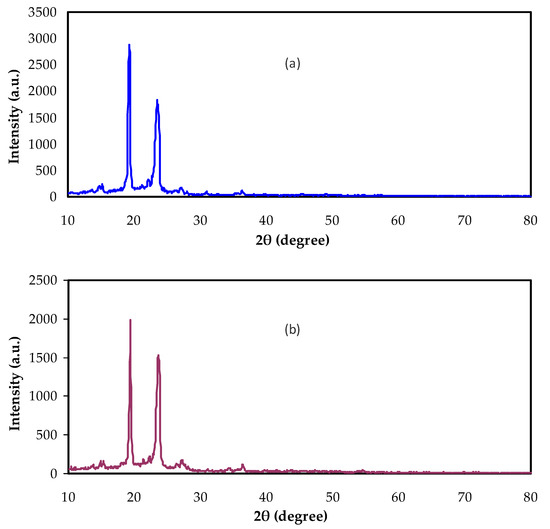

Figure 2.
XRD spectra for (a) Pure PEO, (b) NCP-1, and (c) NCP-2.
The decrease and broadening of the intensity of the XRD peaks by the addition of the nano-size CaTiO3 are seen in Figure 2b,c. This confirms the increasing amorphous region at the expense of the crystalline structure in the PEO. Additionally, the complexation between the CaTiO3 and PEO can be emphasized. Furthermore, the dominancy of the amorphous phase facilitated polymer chain segmental motions [27].
The consequence of dopant addition was the decrease in the crystalline phase, i.e., lowering the compact nature of the polymer structure [28,29]. It was documented that the chemical stability of the PEO polymer crystalline structure is related to the building block units, such as C-H, C-O, and C-C bonds [28,30].
3.2. Absorption Study
The absorption spectra of pure PEO and doped PEO with various quantities of CaTiO3 nanoparticles in the wavelength, ranged between 180 and 900 nm, as shown in Figure 3. We noticed that the intensity of absorption in the spectrum of each sample decreased with increased wavelength, while it increased with increased CaTiO3 quantity. It is observed that, the films are almost transparent at the high wavelengths. In pure PEO, the spectrum contained an absorption edge at nearly 210 nm, and a noticeable shift in the absorption edge to a higher wavelength was recorded for each film. The absorption band for each sample under study in the wavelength, ranged between 200 and 300 nm, which could be ascribed to the occurrence of electronic transition, which was to be expected for conjugated (C = O) group [31,32]. Interestingly, the vibronic shoulder appeared clear as the quantity of CaTiO3 increased. Importantly, the similarity in shape of the PEO:CaTiO3 absorption spectra showed a desirable homogeneity of the films formed.
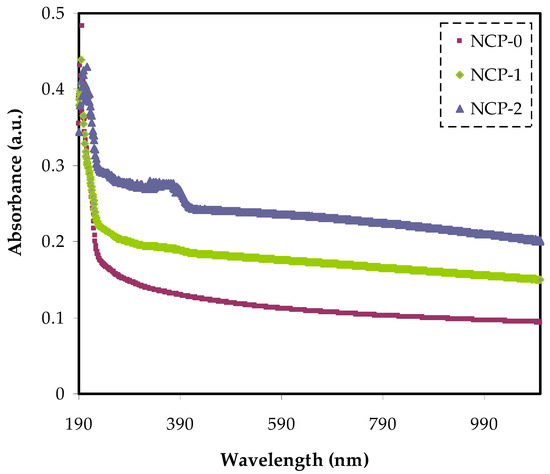
Figure 3.
Absorption spectra of NCP-0 and composite samples.
Figure 4 also shows the transmittance of neat PEO and doped PEO with various quantities of CaTiO3 particles. The pure PEO showed relatively high transparency beyond the visible region exceeding 81%. On the other hand, below the visible region, the transparency dropped due to the high absorption of the films. It is worth noting that the doped PEO with 4 and 8 wt.% CaTiO3 showed lower transparency and reached almost 0.51% at the UV region and the transparency increased to 0.63% at the visible region. This can be explained based on the scattering and relatively high refractive index of highly doped films at lower λ (nm).
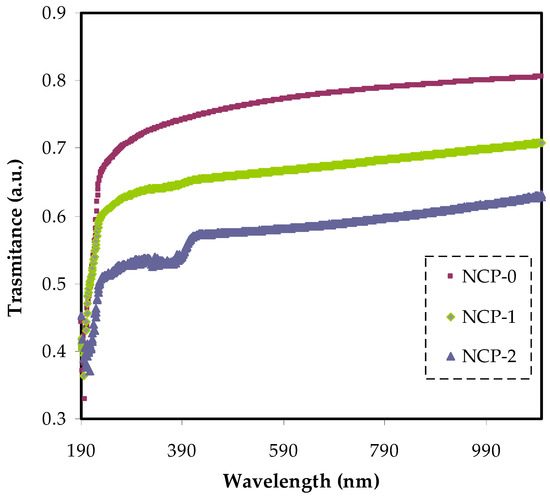
Figure 4.
The transmittance of NCP-0 and composite samples.
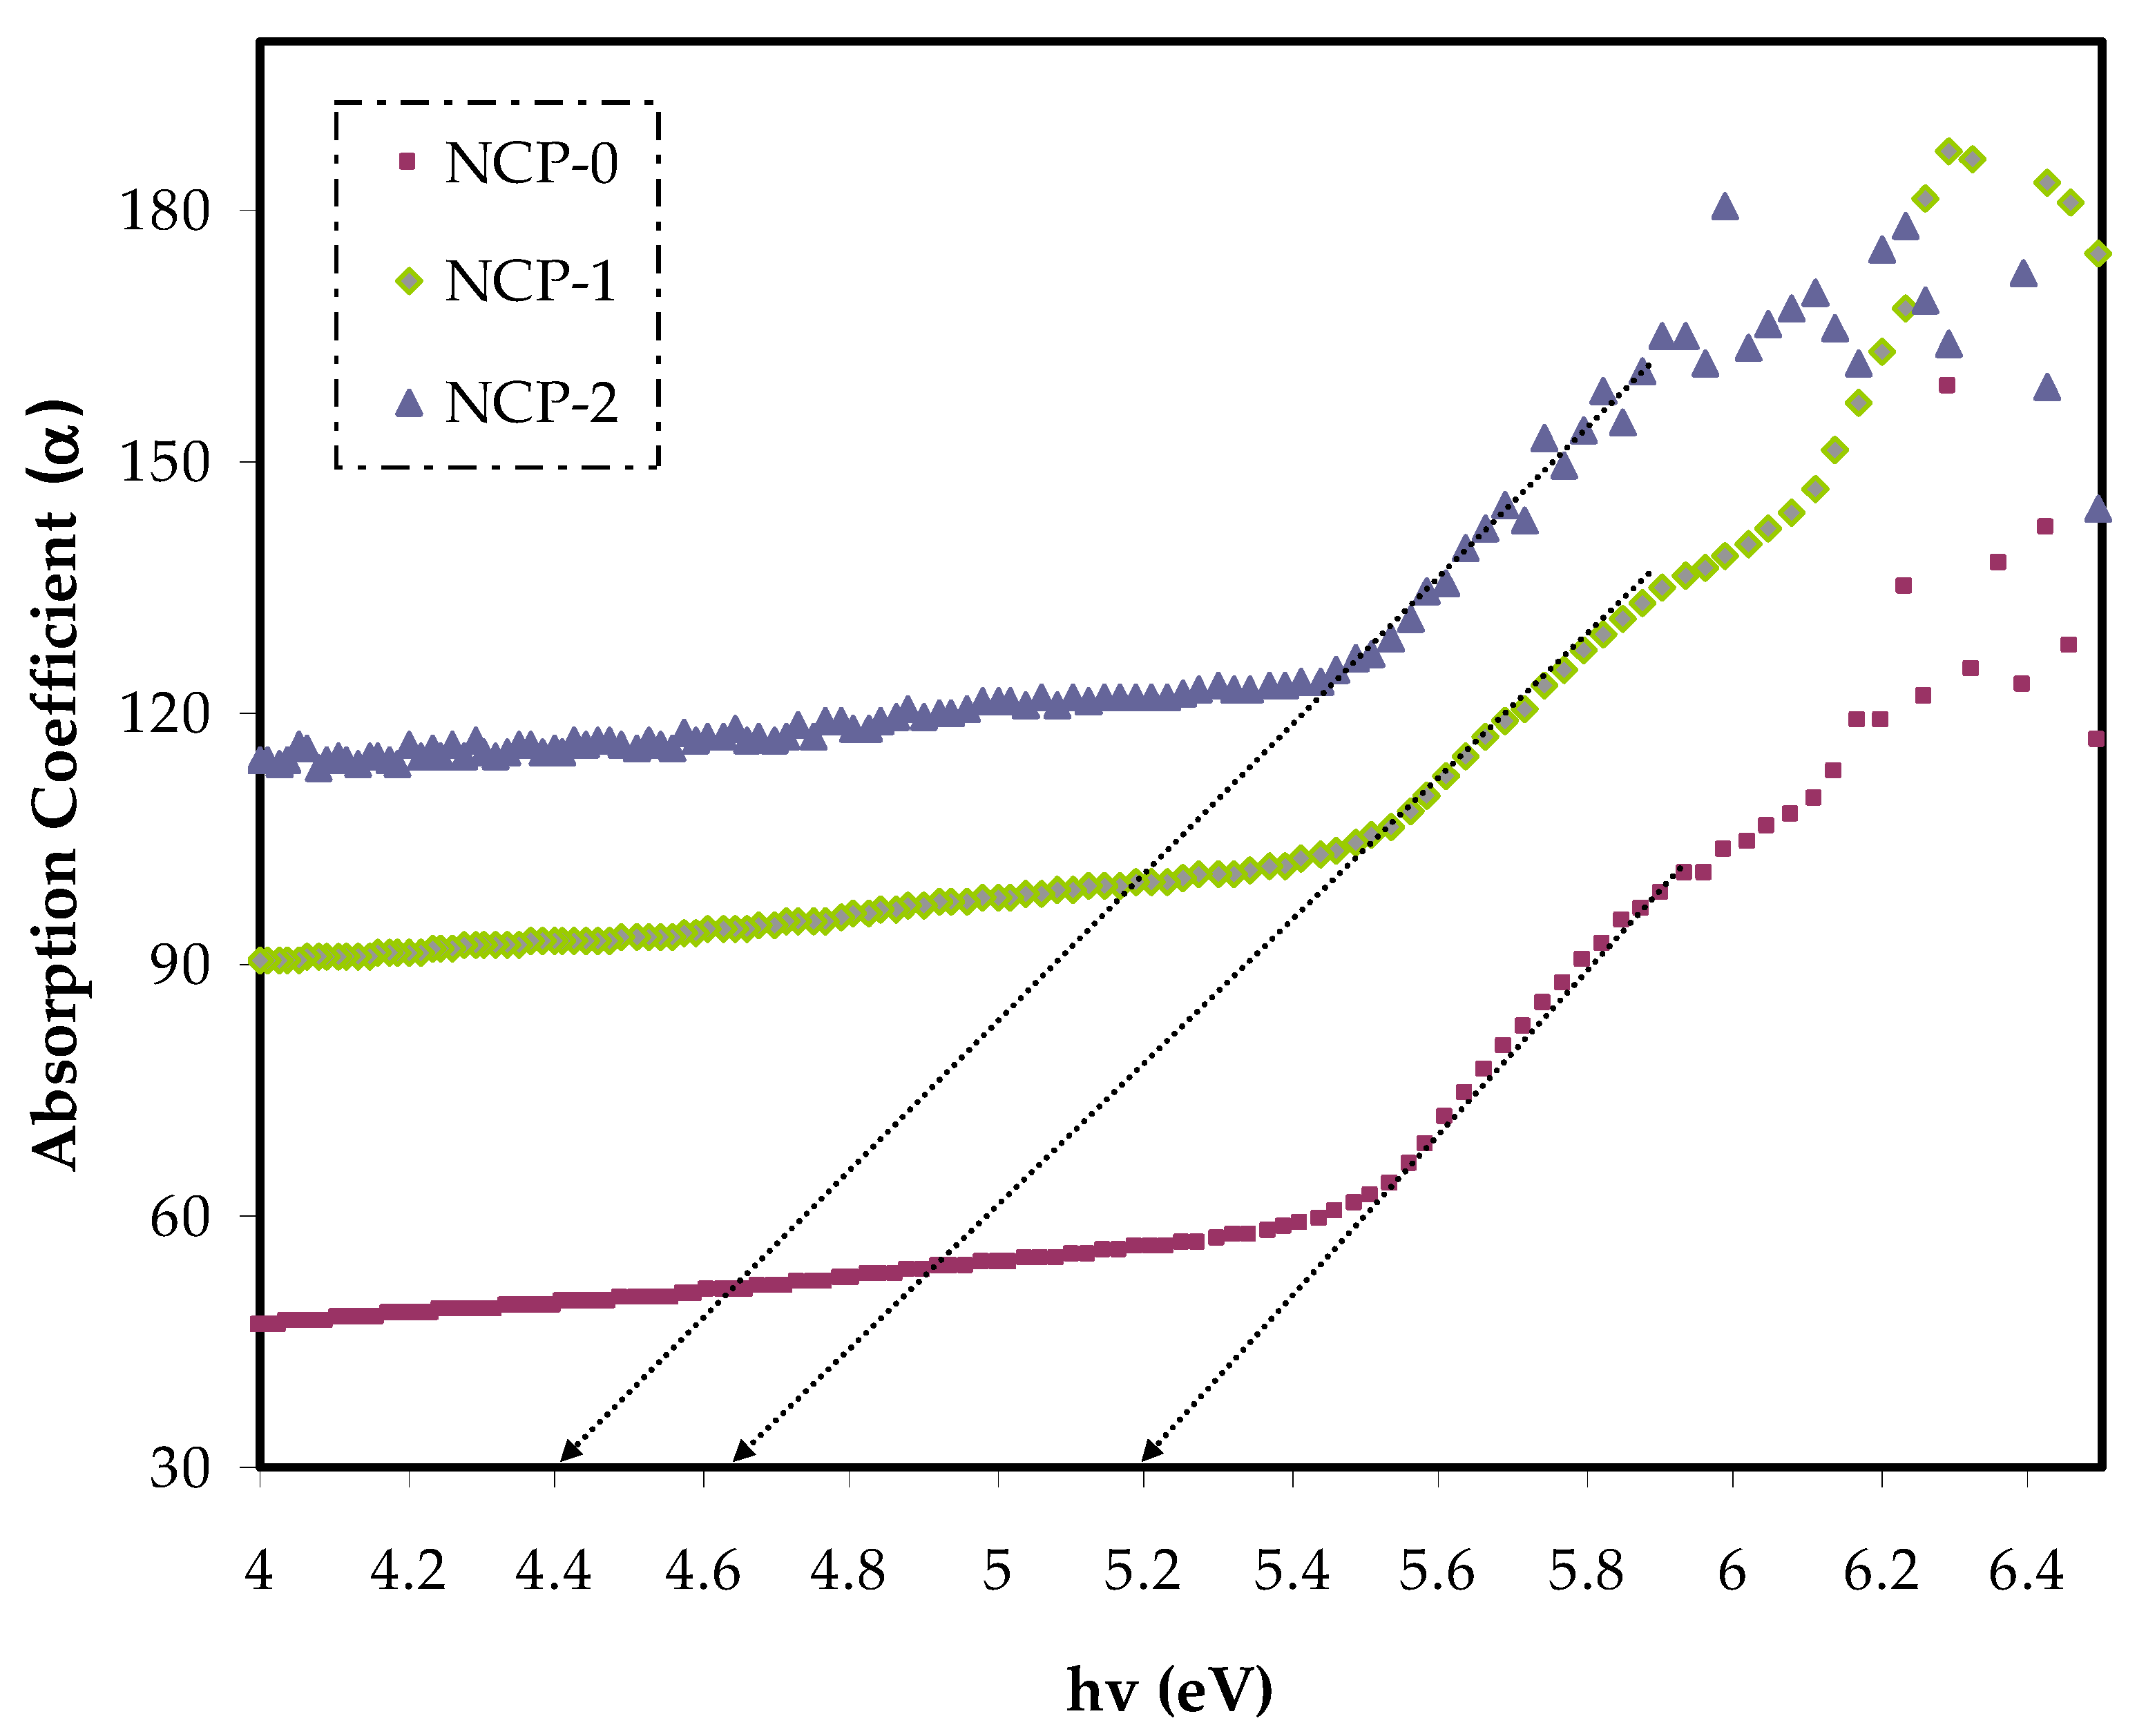
From the optical absorption spectrum, one can gain insight into the band gap energy and structure of non-crystalline and crystalline materials. One of the useful optical parameters was absorption coefficient (), which can be described as quantifying the light amount that a medium can absorb. This was obtained from the incident radiation fraction absorbed per absorbent thickness [33]. The absorption coefficient of a series of prepared films of PEO and various doped PEO with CaTiO3 are shown in Figure 5. The straightforward way of calculating the absorption coefficient was carried out using the following equation [34]:
where, t stands for the thickness of the sample and A stands for the absorbance. The cause of increasing (α) with increasing CaTiO3 content could be related to the modification of molecular configuration. In other words, it supported the process of charge transfer within metal ion complex systems, including the host polymer [35]. After extrapolating the linear part of the curves to zero absorption, we were able extract the absorption-edge value as tabulated in Table 1. In the current calculation, the absorption edge energy of pure PEO was lowered from 5.2 to 4.4 eV upon adding 8 wt.% of CaTiO3. This absorption edge lowering can be interpreted as enhancing interchain interaction between the polymer composite chains, upon increasing the dopant quantity. As a consequence, a denser conjugation stacking was produced. In other words, the formation of new effective trap levels in the optical band gap could be formed by changing the absorption edge. Therefore, electrons passed the top of the valence band to the bottom of the conduction band within these new states [36,37]. The current optical measurements were similar to those gained for PEO by Kumar et al. [38].

Figure 5.
Absorption coefficient against photon energy for NCP-0 and composite films.

Table 1.
Absorption edge for NCP-0 and composite films.
3.3. Refractive Index Study
In designing new materials, both a refractive index and optical dielectric constant were considered decisive parameters. For calculating the refractive index (n), Fresnel formulae was implemented for parent PEO film and PEO films doped with CaTiO3 using measured values of extinction coefficient (k = αλ/4π) and reflectance (R) [39]. It was imperative that the designing of optoelectronic devices relied significantly upon the accuracy of info on the refractive index parameter. In principle, the refractive index was related to both the mean polarizability and density of the medium at specific temperature and pressure [40].
Thus, the refractive index was a decisive parameter that determined the optical performance. The refractive index depended on absorption and reflectance. The complex refractive index of films was calculated by Equation (2):
where, the extinction coefficient is symbolized by k and the refractive index is referred by n. The following relationship shows the correlation between the k and n [41]:
n × (λ) = n(λ) + k (λ)
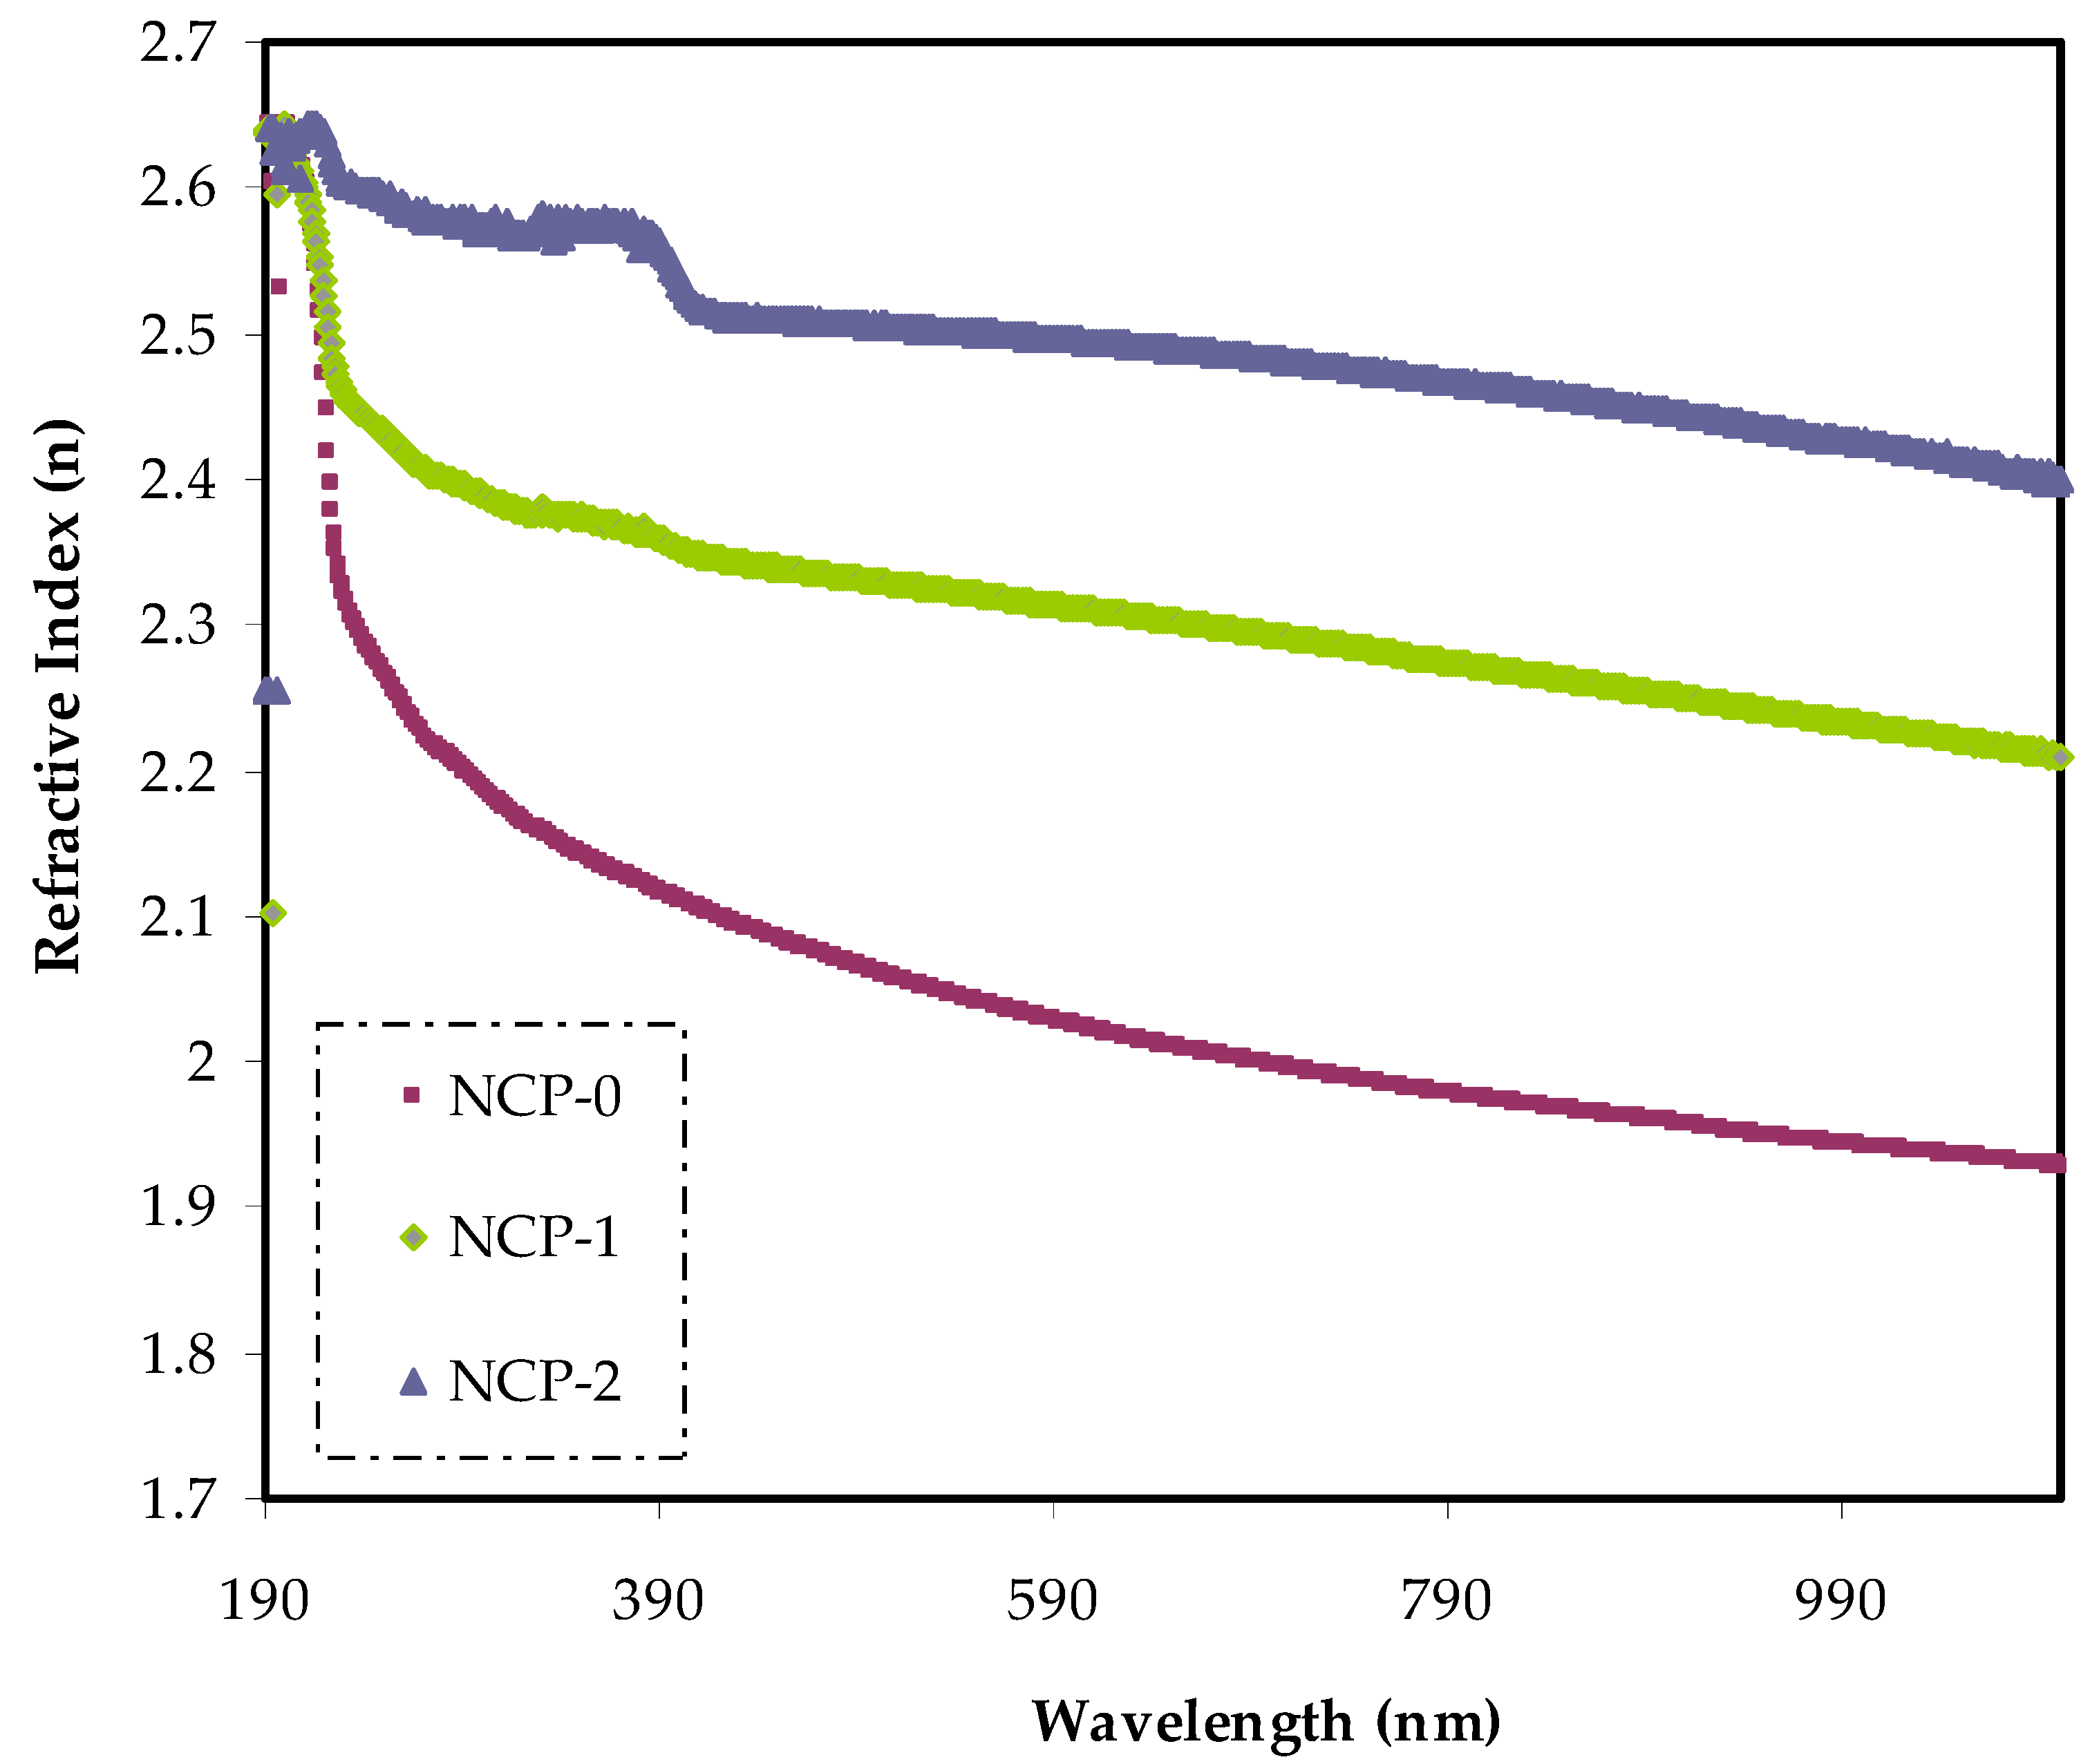
The dispersion curves of the refractive index n (λ) of the PEO and PEO loaded with CaTiO3 are exhibited in Figure 6. In the spectrum of the parent PEO film, the dispersion region lay at a wavelength of less than 300 nm. In contrast, in the case of doped PEO films with CaTiO3, the refractive index displayed a shift in dispersion to a higher wavelength region. This was mainly related to the uniform CaTiO3 distribution throughout the PEO matrix, resulting in a greater density of the nanocomposite.

Figure 6.
Refractive index v wavelength for NCP-0 and composite films.
3.4. Band Gap Study
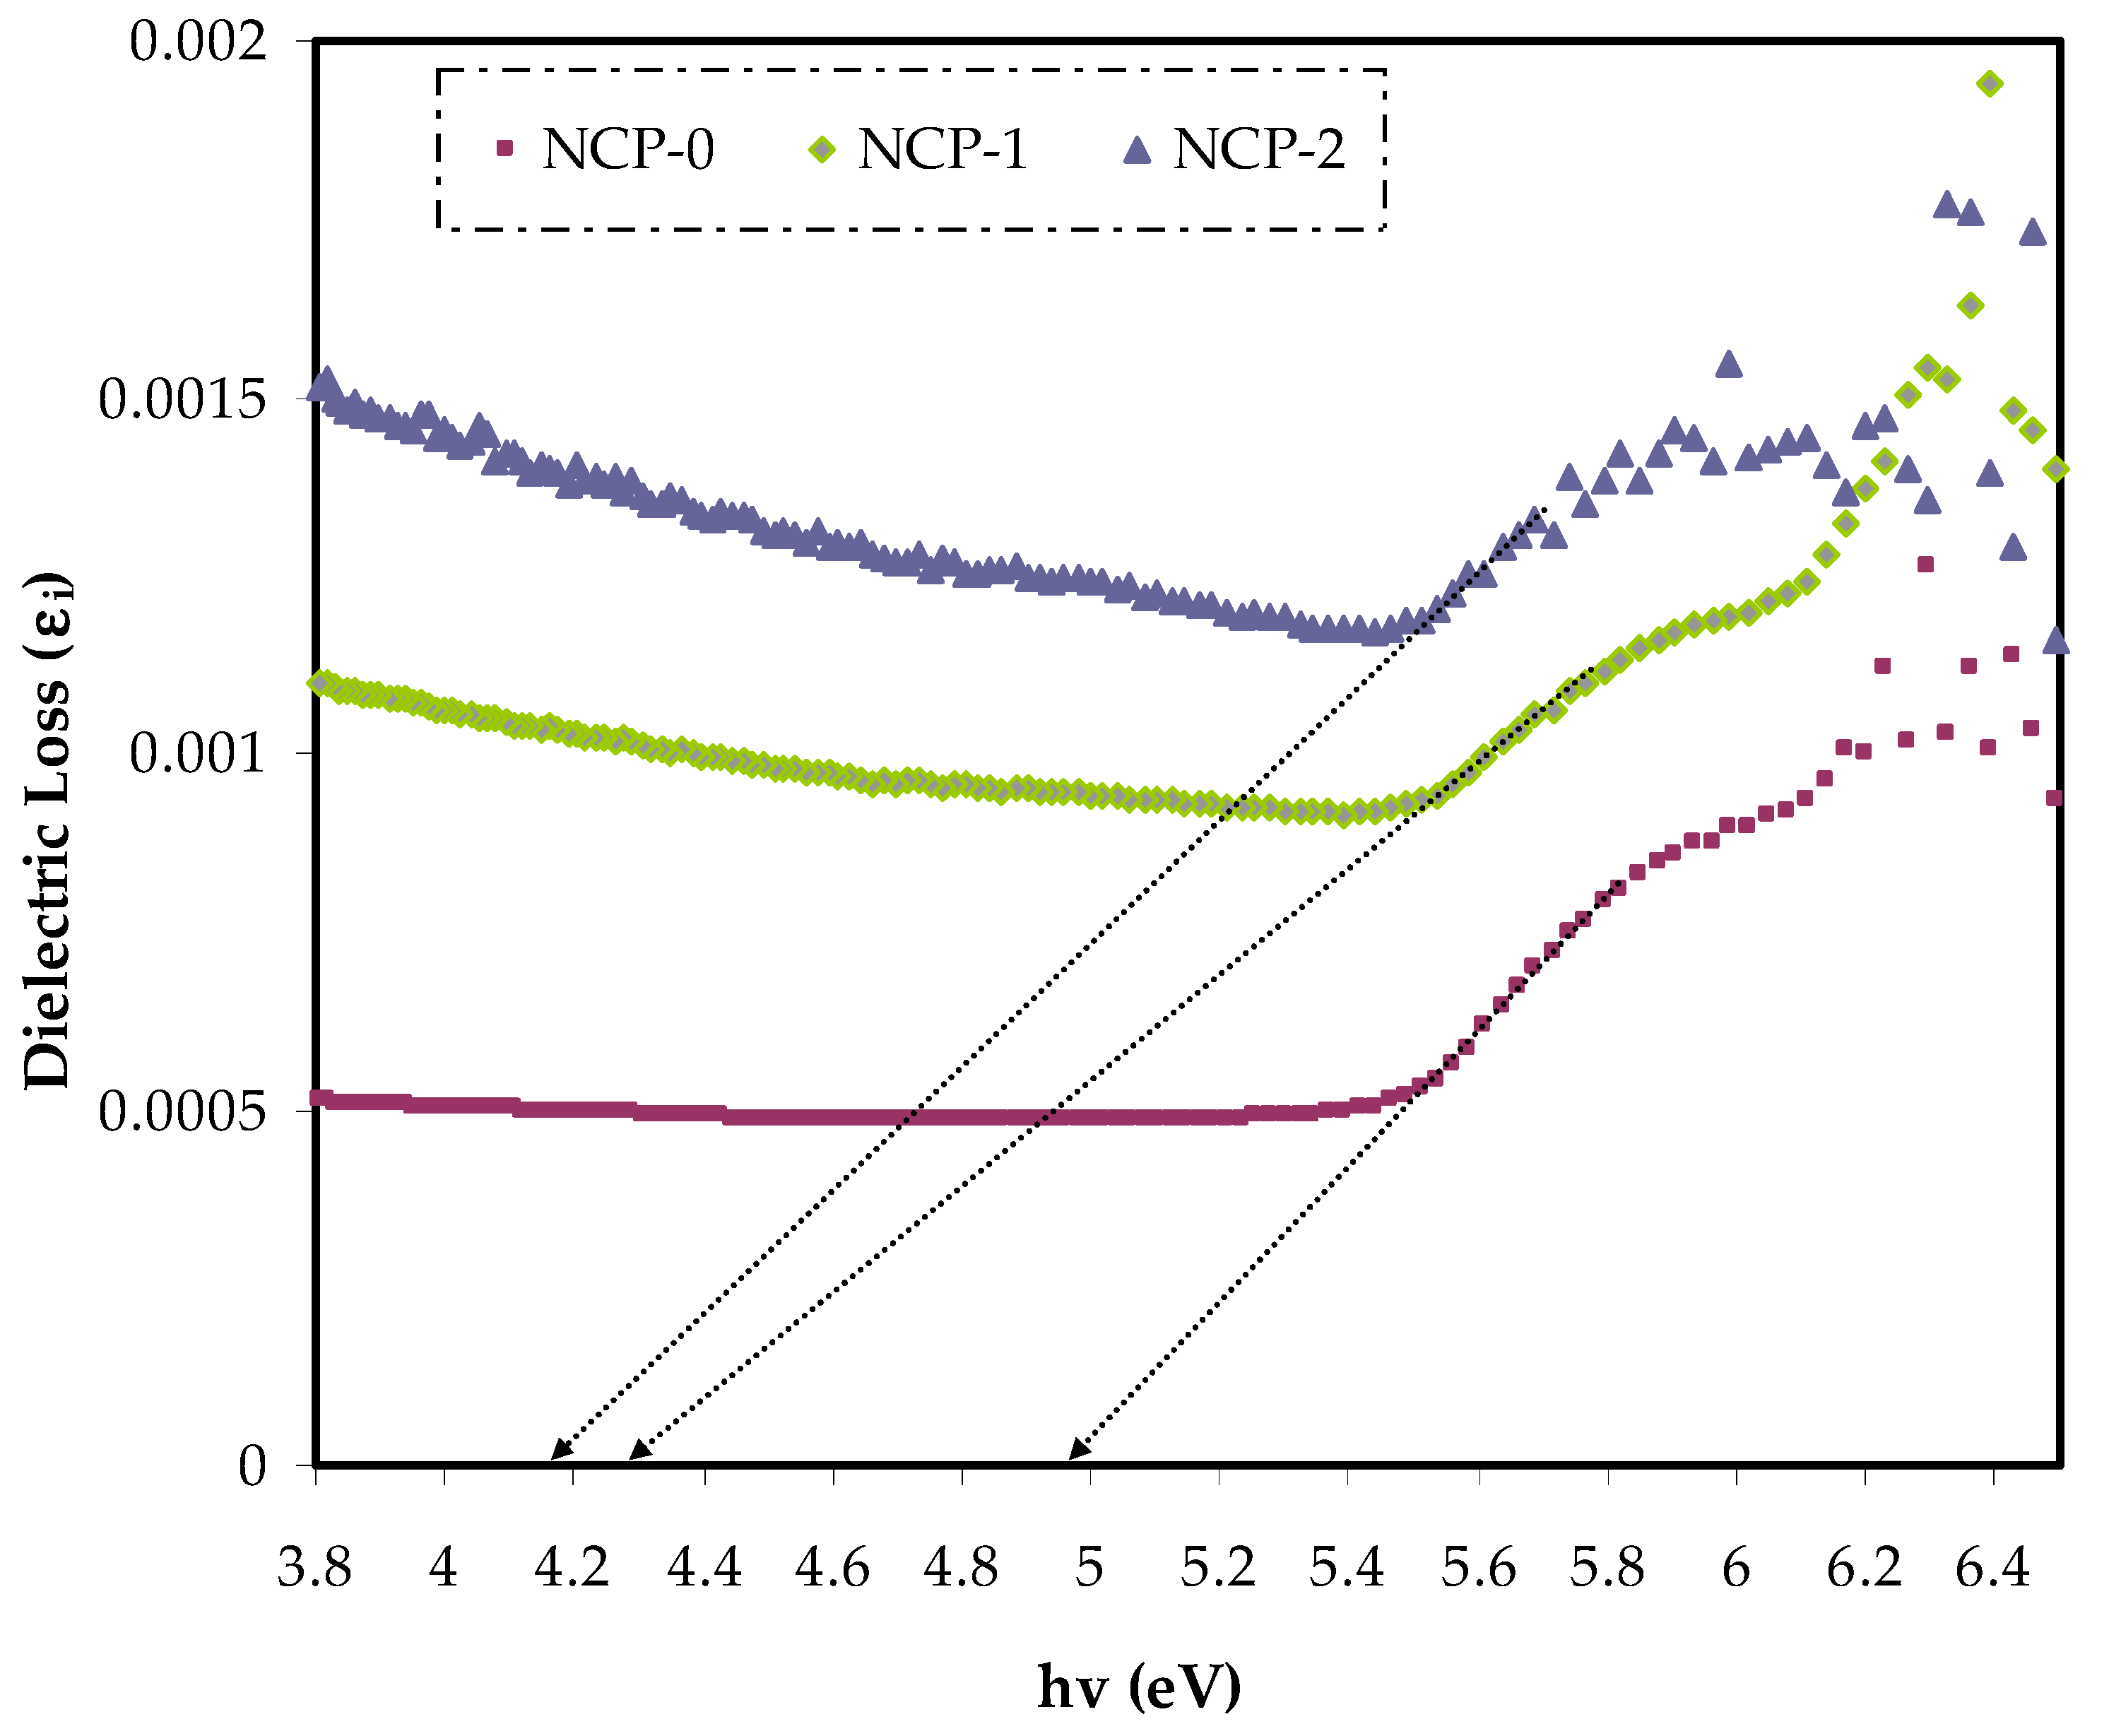
Based on the quantum view, the optical dielectric loss parameter strongly related to the unoccupied and occupied electronic levels in a material. The optical dielectric loss was also largely band gap energy dependent [42]. The optical dielectric loss (εi) and photon energy relationship of parent PEO and PEO/CaTiO3 samples are shown in Figure 7. From the curve analysis, the optical band gap was obtained from the interception of the extrapolation linear part of the diagram of εi that was plotted against the photon energy (hυ) with abscissa [43]. It is worth mentioning that Tauc’s formula could estimate the most probable electron-band-gap electron accurately. Table 2 presents the band gap values obtained from the optical dielectric loss plot.

Figure 7.
Dielectric loss spectra v wavelength for NCP-0 and composite films.
Table 2.
The Eg values from Tauc’s method and εi plot.
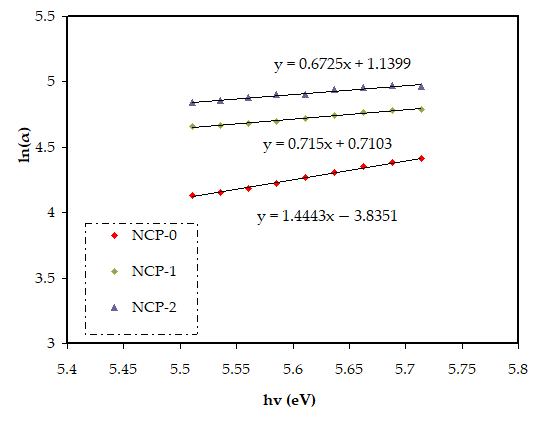
Accurate measurement of the energy band gap provided a clear insight into electron transitions in the band gap structure. Thereby, the optical band gap energy can be considered as a revealing of the optical transition in PEO/CaTiO3 nanocomposite film. The band gap energy was obtained from Tauc’s equation for the parent PEO and related nanocomposite films from the α spectra:
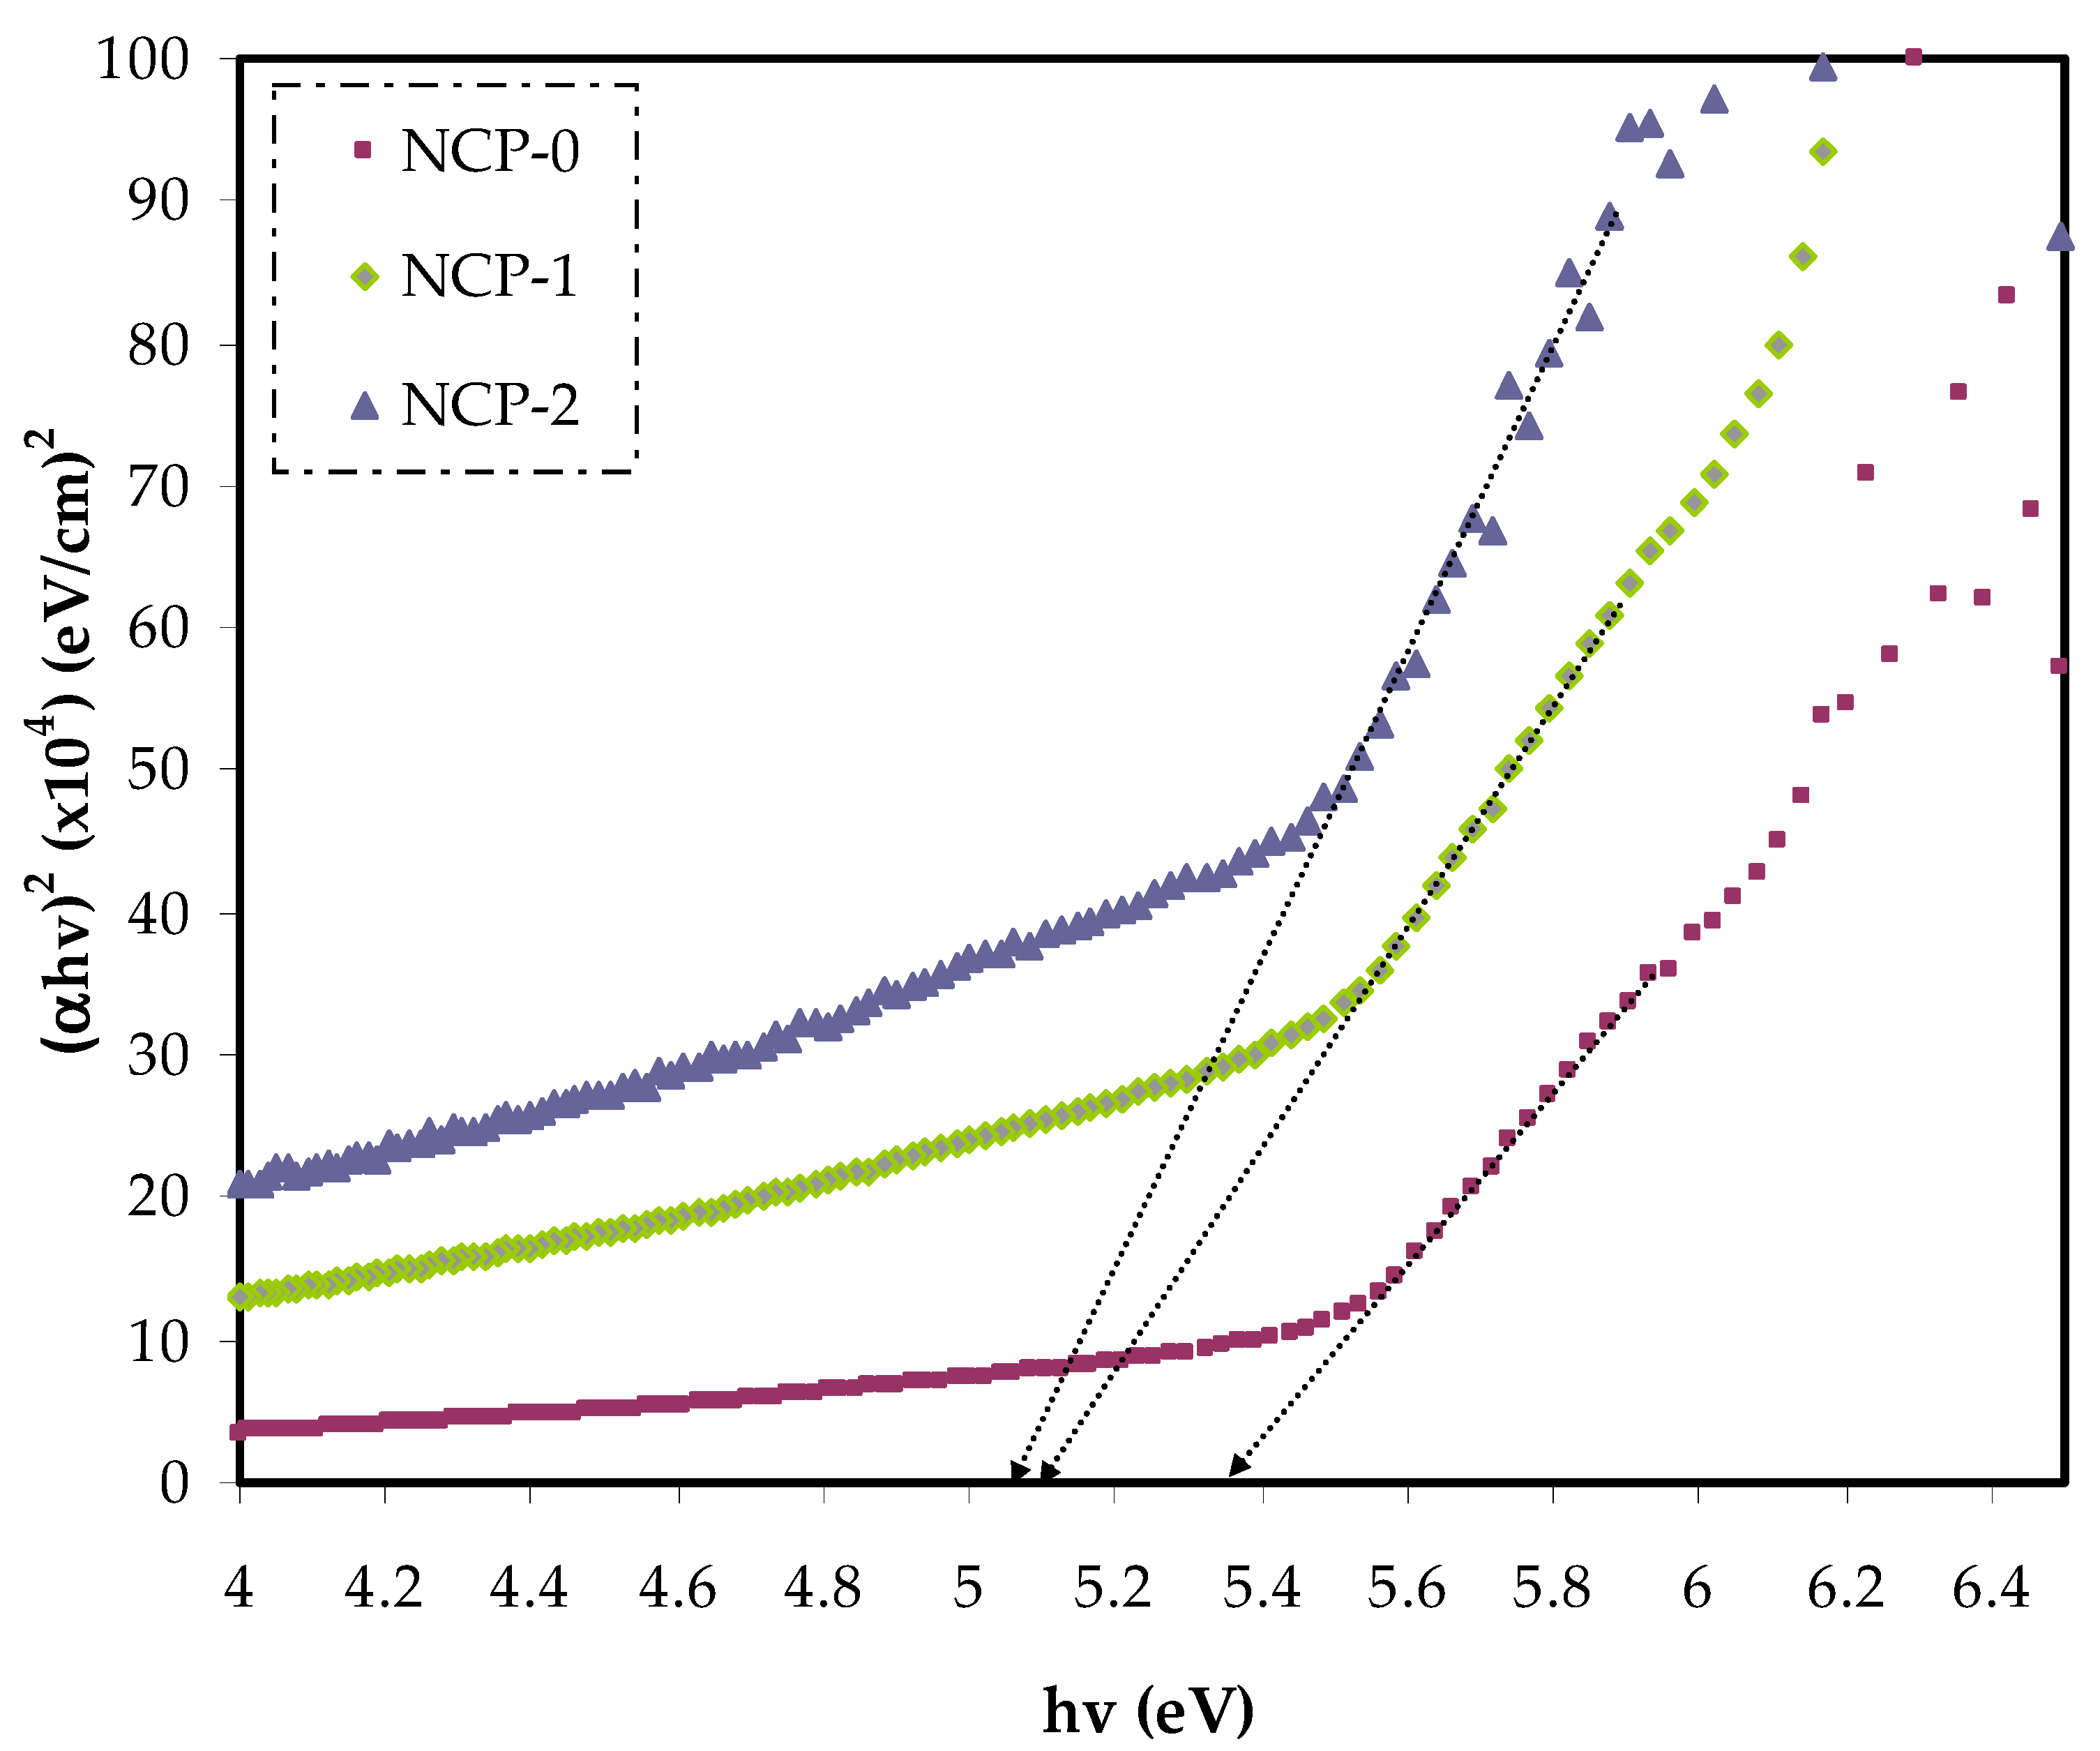
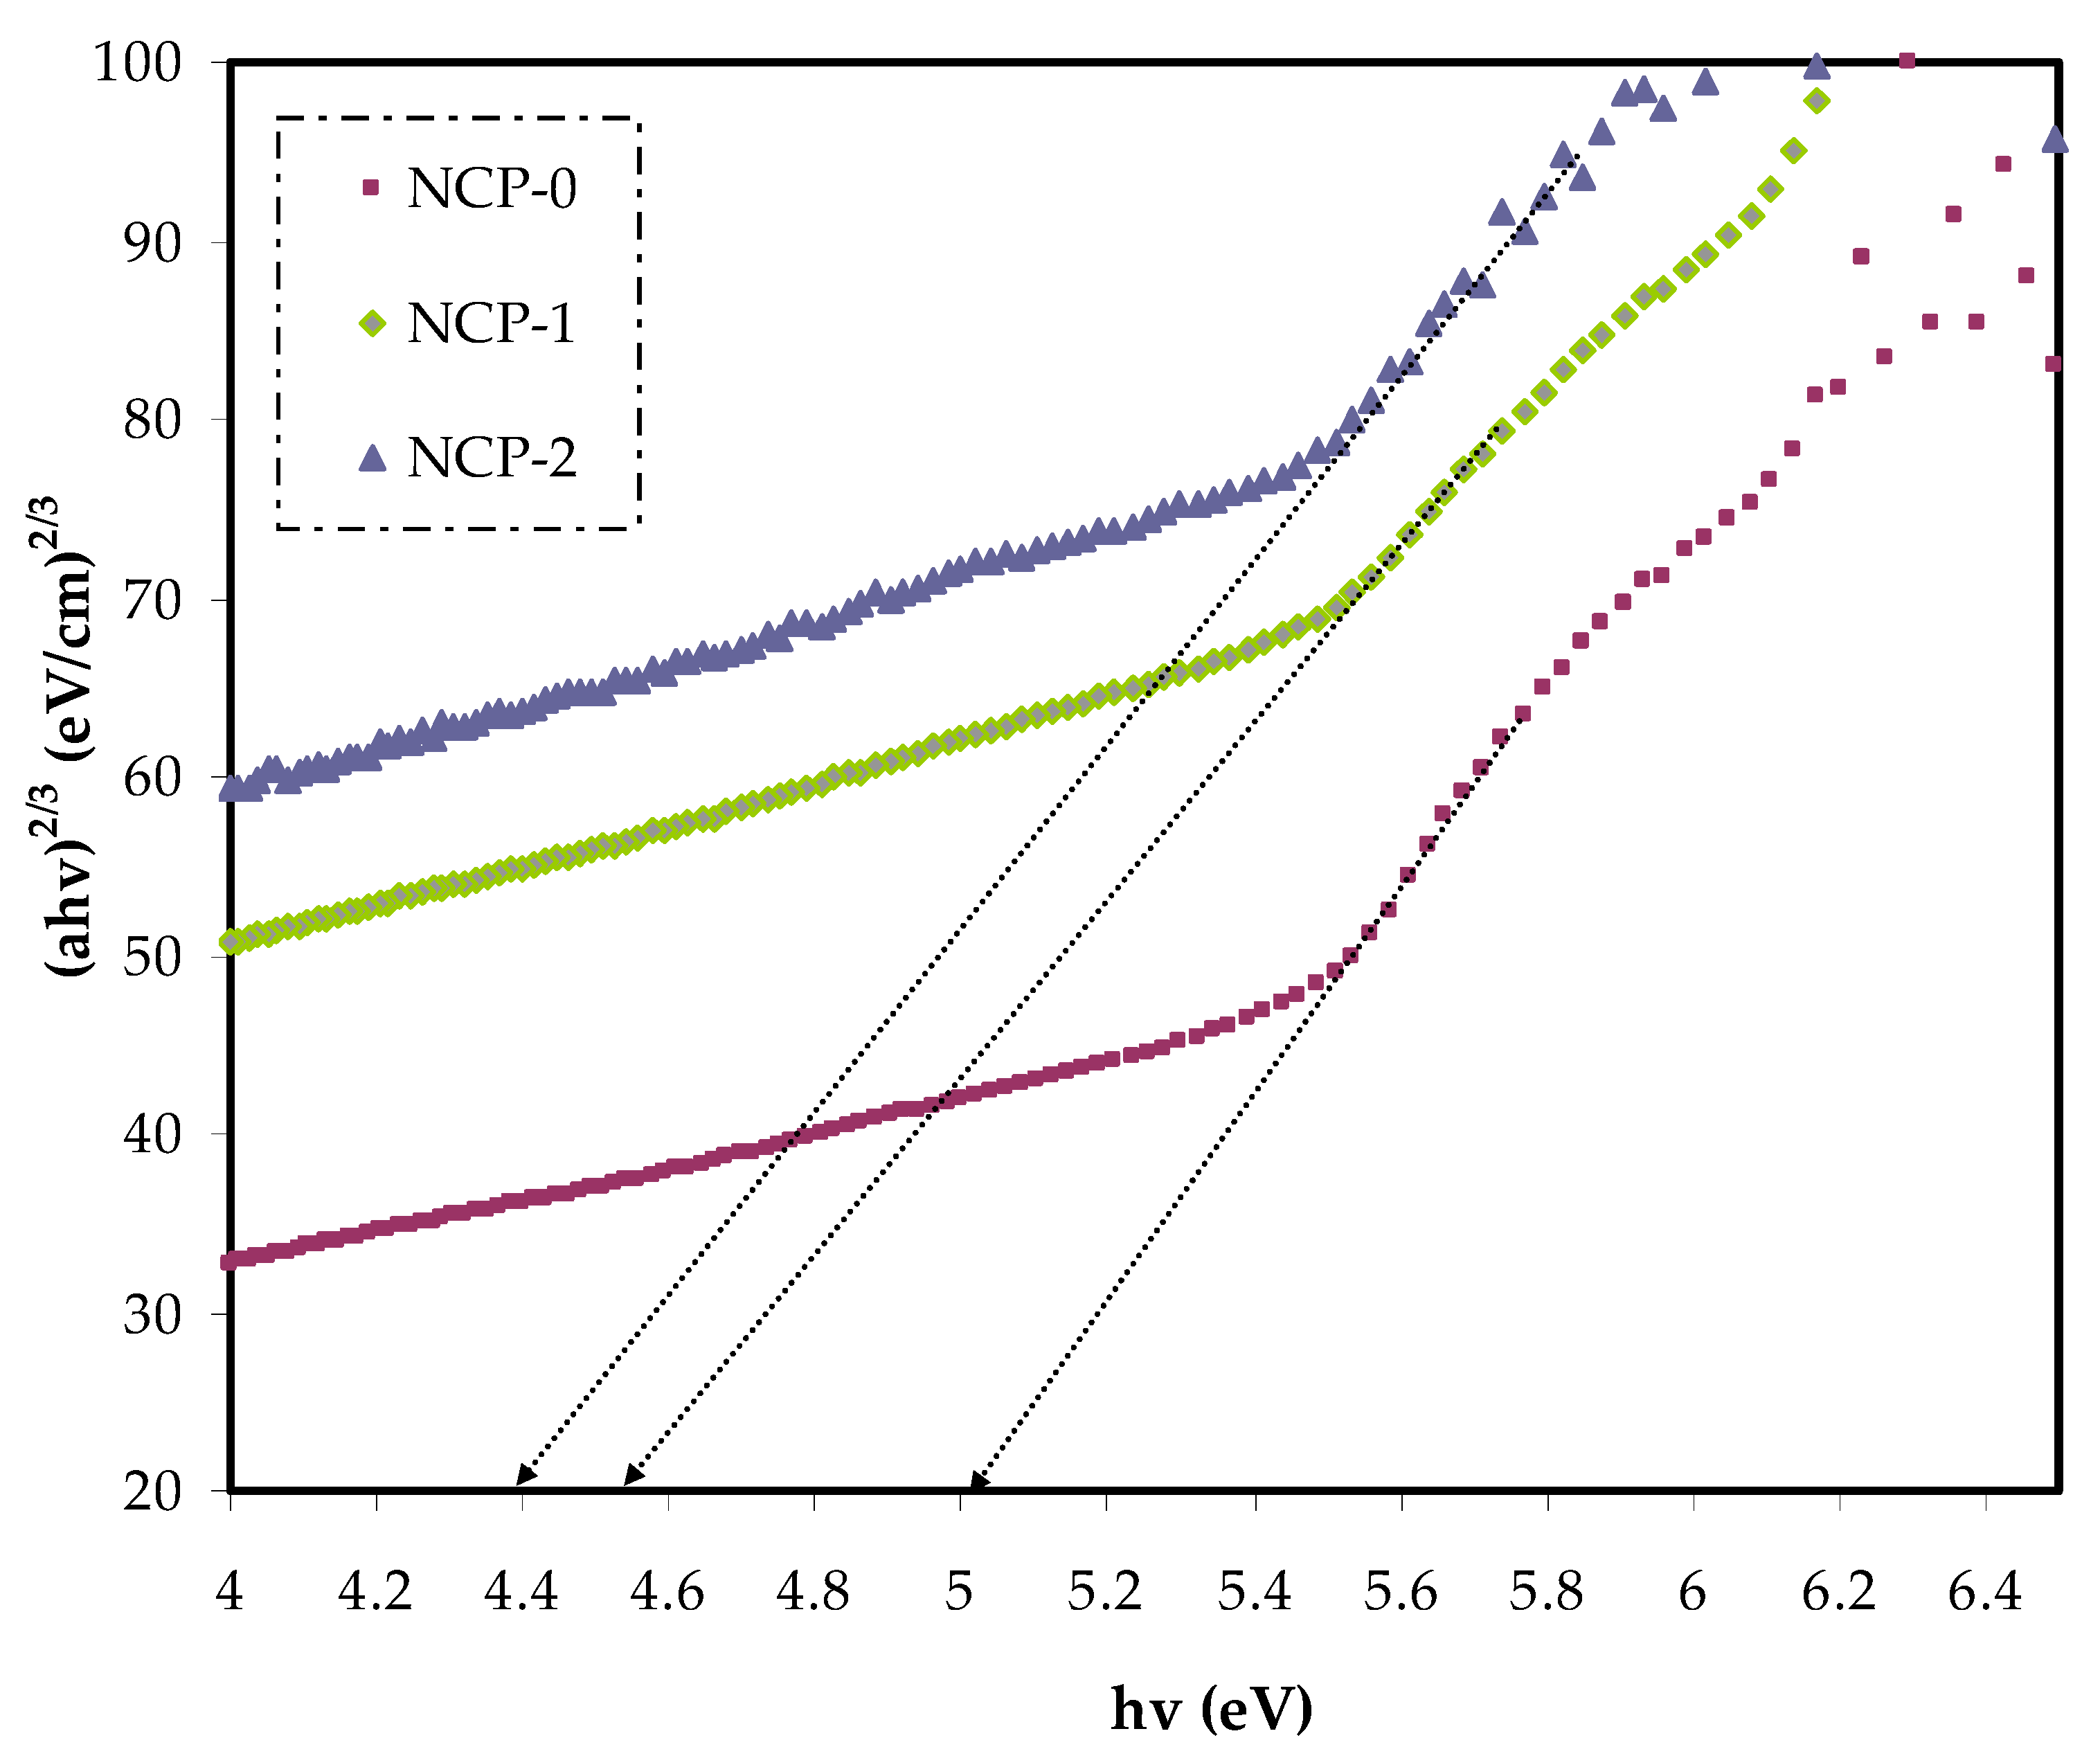
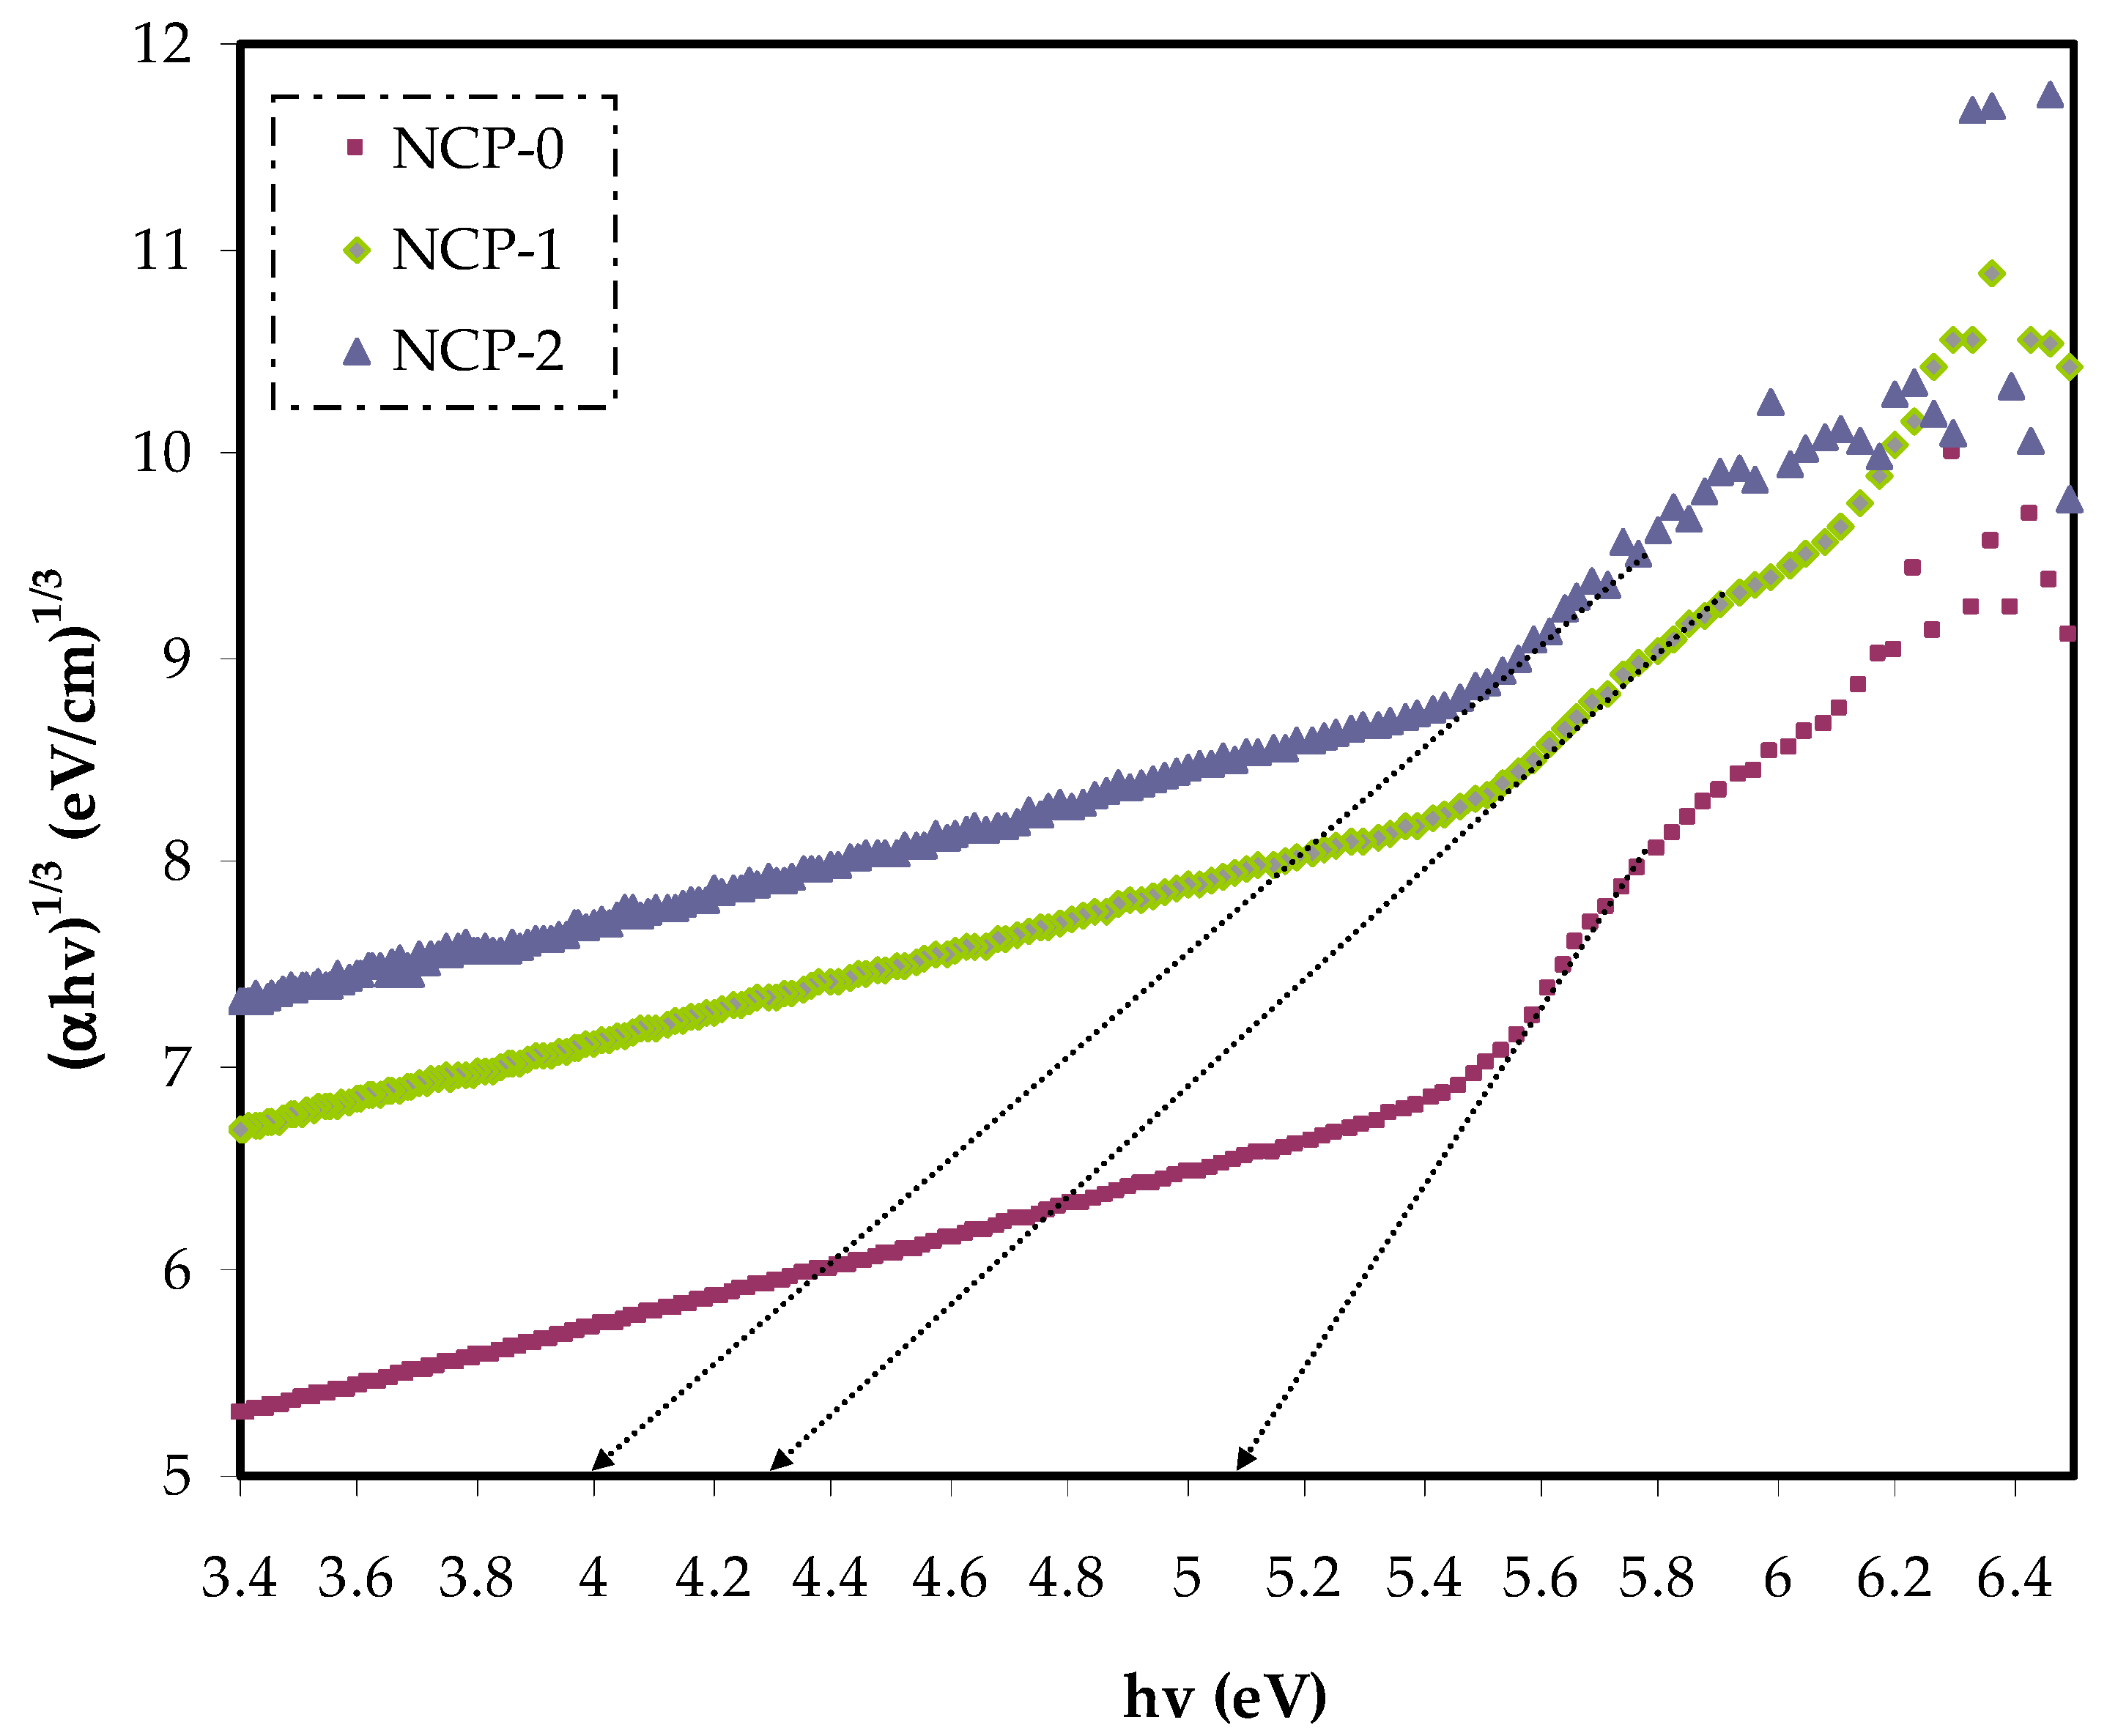
In Equation (4), the parameter reliant on the interband transition probability is B. The incident energy is expressed as hυ. Eg symbolizes the energy band gap, and the index γ defines the kind of electron transition [44]. The value of direct allowed electron transitions (γ) was ½, the γ for indirect allowed transition was 2, for direct forbidden transitions γ was 3/2, and for the indirect forbidden transitions γ was 3 [45]. For determination of Eg value, for the electronic transitions of the direct allowed (Figure 8), direct forbidden (Figure 9), indirect allowed (Figure 10), and indirect forbidden (Figure 11), the intersect of the extrapolated linear part of the diagram of (αhυ)1/γ v hυ with abscissa was used [46]. In earlier research, it was suggested that the cause of decreasing the optical energy band gap could be due to the diverse localized trap states through forbidden band gap. These localized levels were created from the loaded nanoparticles to the polymer [47,48].
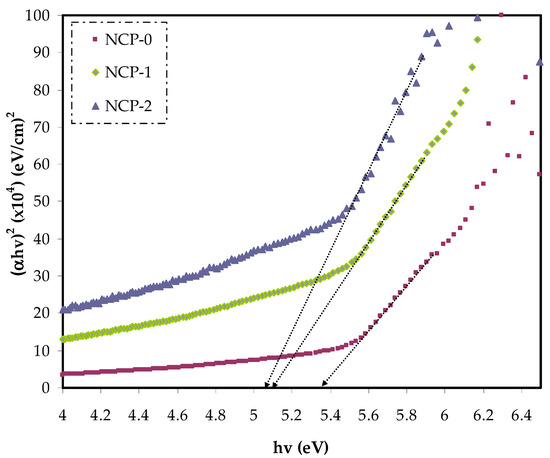
Figure 8.
(αhυ)2 v photon energy for NCP-0 and composite samples.
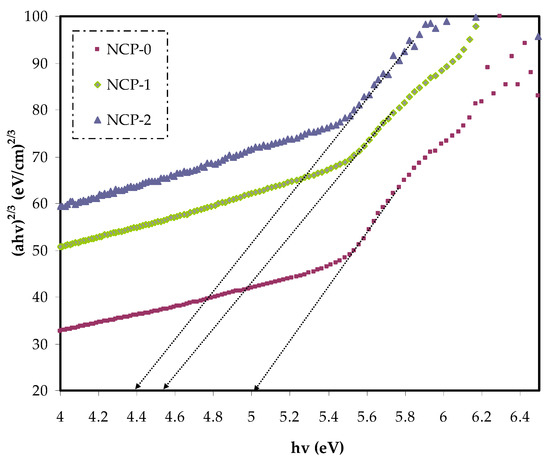
Figure 9.
(αhυ)2/3 v photon energy for NCP-0 and composite samples.
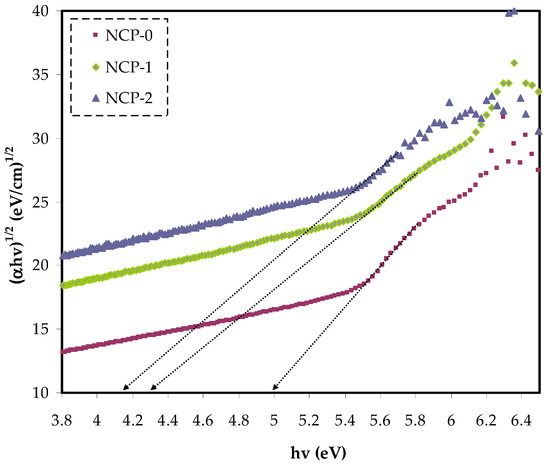
Figure 10.
(αhυ)1/2 v photon energy for NCP-0 and composite samples.
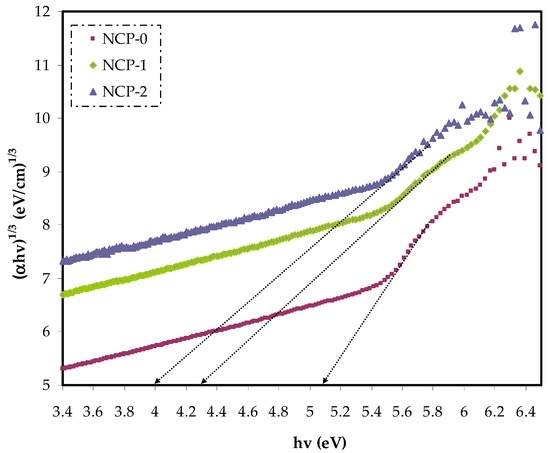
Figure 11.
(αhυ)1/3 v photon energy for NCP-0 and composite samples.
The creation of new energy states within the band gap can be developed by introducing defects (deep- and tail-localized levels). Thus, the migration of electron transition from the valence to conduction band, supported lowering band gap energy [48]. From both the cut-off energy extracted from the dielectric loss and band gap energy, we recognized the greatest possible electronic transition in each sample [49]. Based on the energy band gap values extracted from Tauc’s equation (Figure 8, Figure 9, Figure 10 and Figure 11) and cut-off energy extracted from the dielectric loss plot, the direct transition (γ = 1/2) was the most probable electron transition (see Table 2). Summarily, from comparing the value of the optical band gap derived from Tauc’s plot and that calculated from the dielectric loss diagram, the maximum probable electron transitions and the optical band gap value could be determined.
3.5. Optical Dielectric Properties
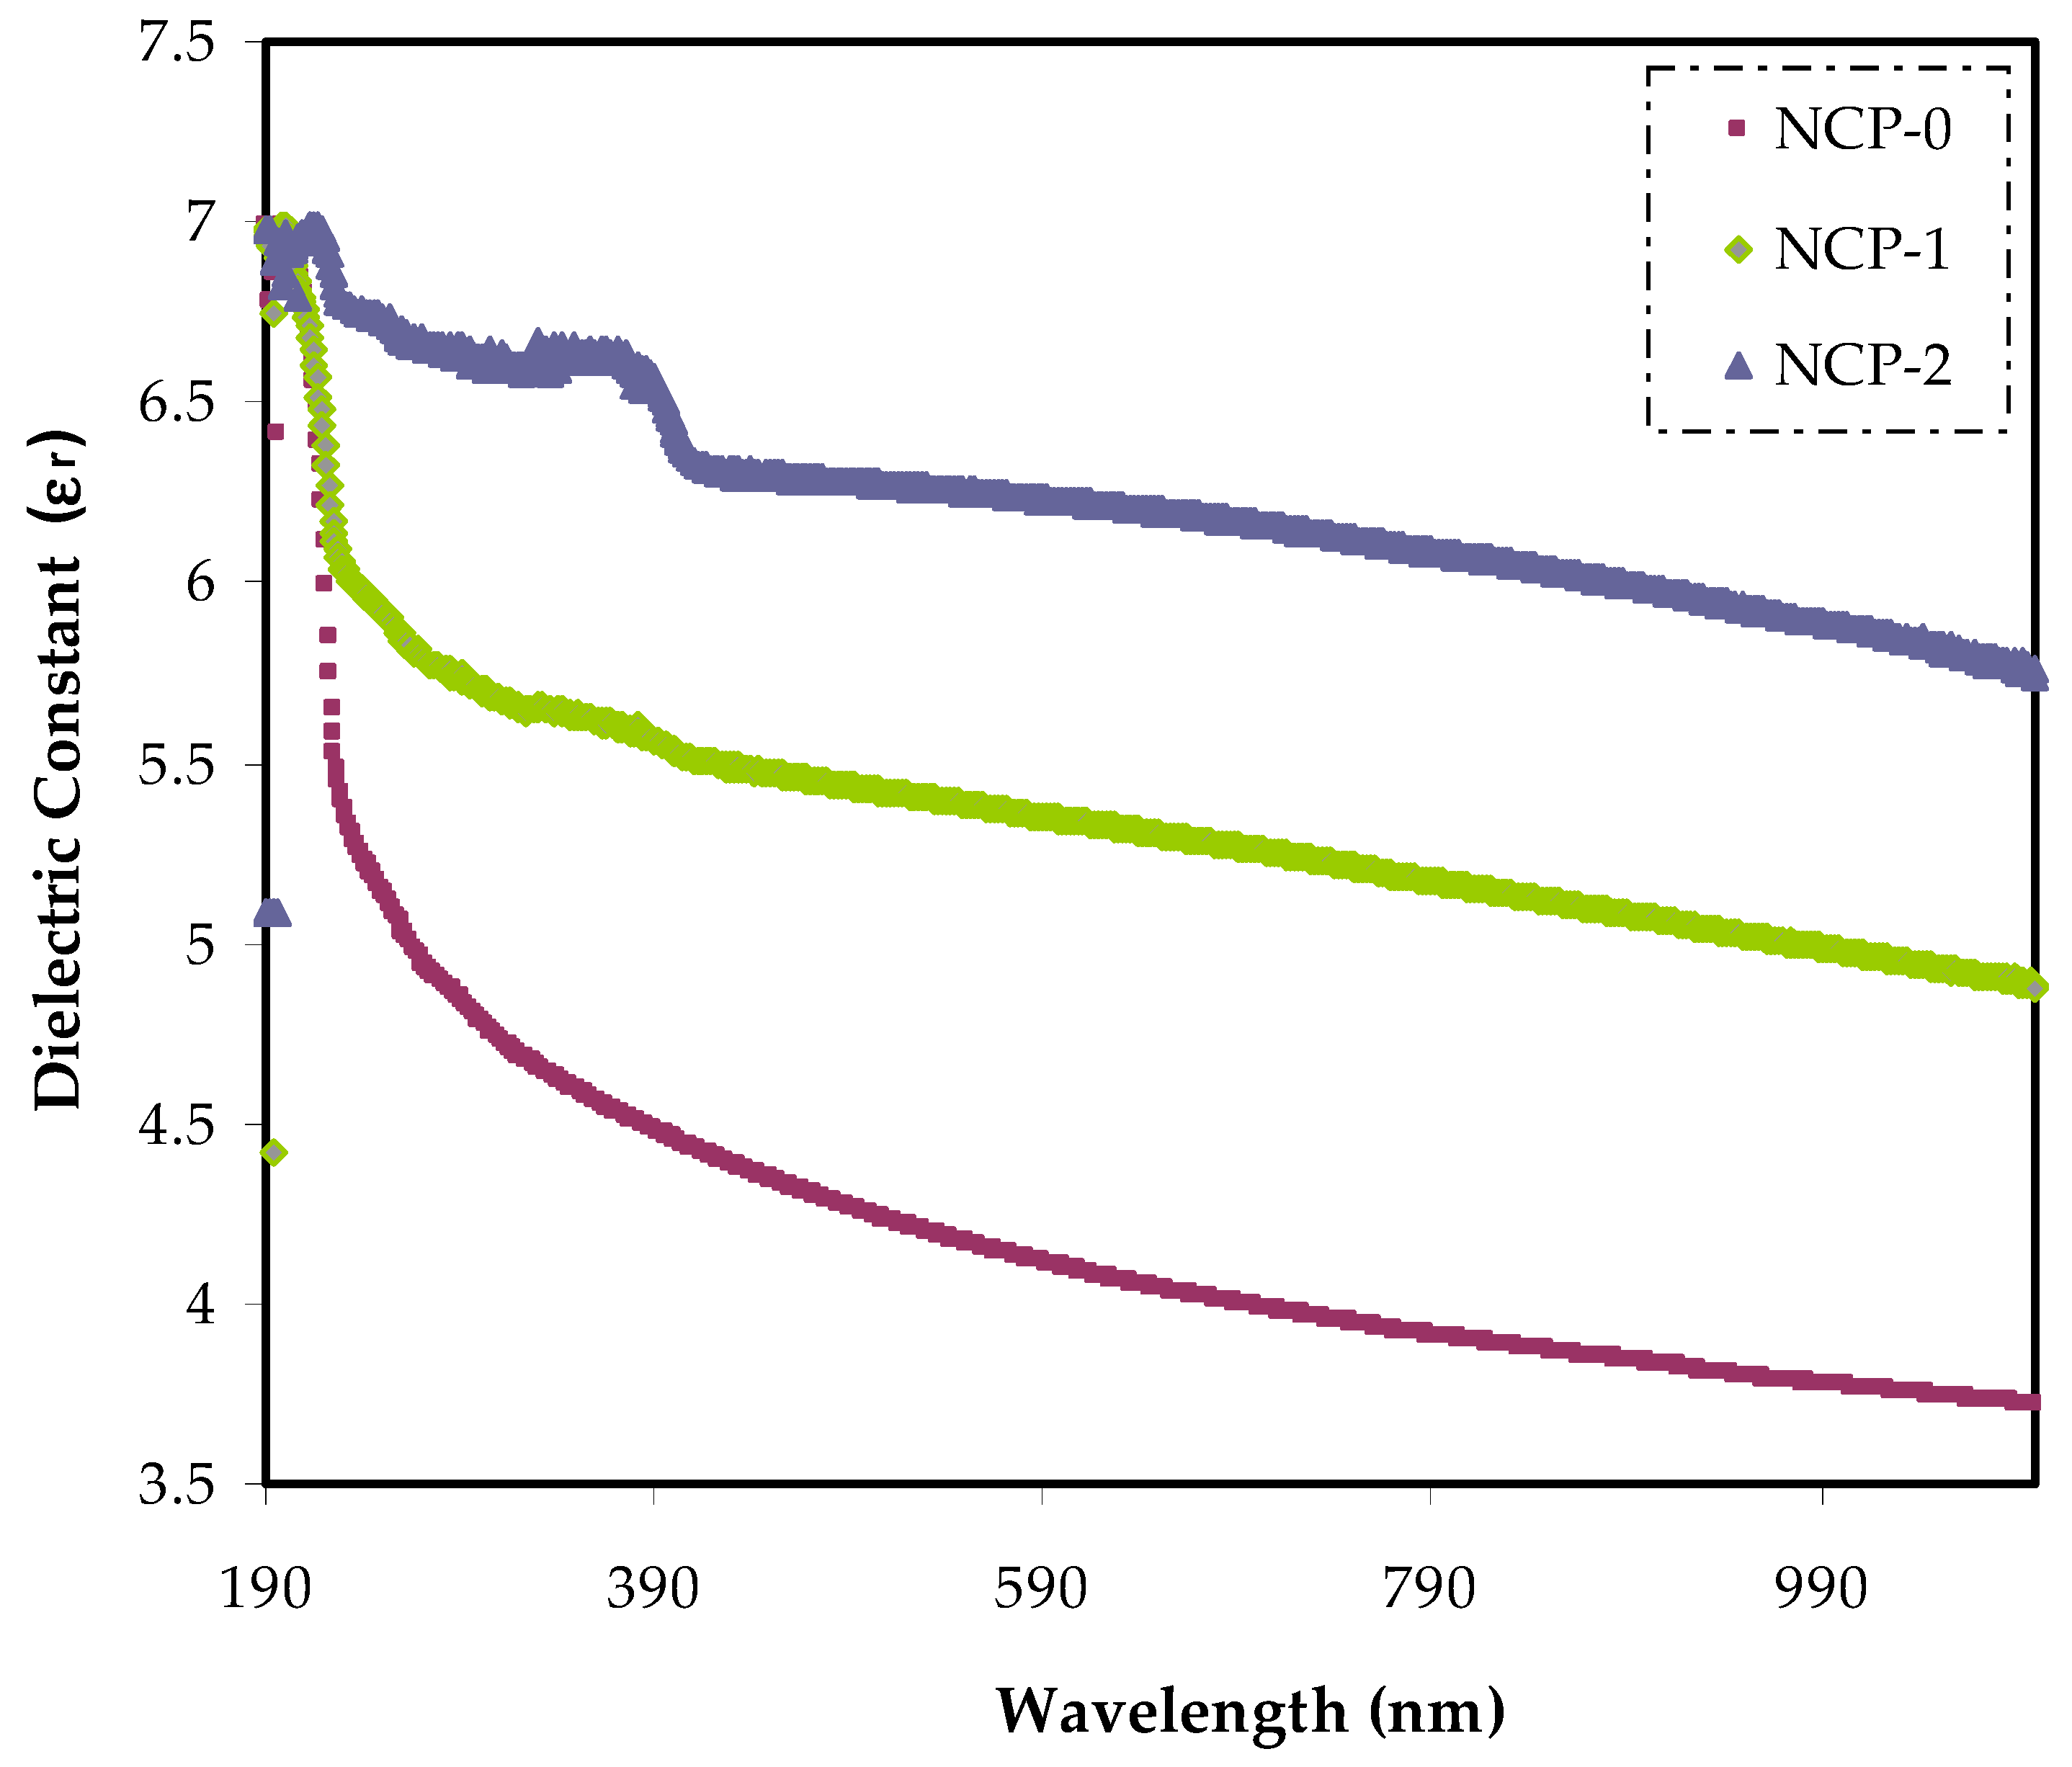
The basic meaning of dielectric characteristic is a reflection of the material’s optical property [41]. The dependence of the dielectric constant on energy indicated that definite electron–photon interaction within the energy range in the film were generated. These new interactions determined the responses in the imaginary and real parts of the dielectric spectra, appearing as peaks [50]. It was concluded that the imaginary and real parts were not only in association with the refractive index, but also dependent on the extinction coefficient by Equation (5) [51]:
where, the dielectric constant at relatively high wavelengths and the free-space dielectric constant are denoted by ε∞ and εo, respectively. The ratio between localized density state and effective mass is referred to by N/m*. The electronic charge is symbolized by e. The relaxation time is represented by τ, and the light velocity is referred to by C. The dielectric constant (ε’) spectra are displayed in Figure 12. The optical dielectric constant related to the wavelength for every sample, and it was clearly seen that increasing the CaTiO3 filler ratio caused an elevation in the ε’ value from 3.7 to 6.29. More profoundly, the main cause of increasing ε’ value was the introduction of energy states. In other words, there was a direct connection between ε’ and states density inside the forbidden gap of polymer samples [31,32].
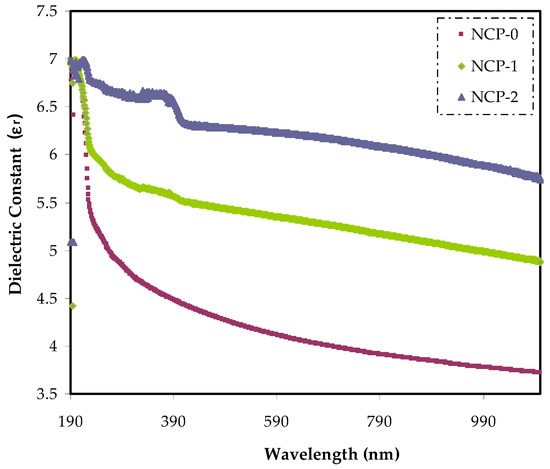
Figure 12.
Dielectric constant vs. wavelength for NCP-0 and composite films.
Using εi extrapolation at the plateau region to the Y axis was useful in extracting the εi of the PEO and 4 and 8 wt.% of PEO/CaTiO3 nanocomposite samples. Incorporating the CaTiO3 nanoparticles into PEO increased the εi value as a consequence of creating new states. In other words, there was an existence between the εi and density of states through forbidden gaps in the materials [52,53].
Optical properties can be achieved by studying conduction, dispersion, reflection, absorption, and polarization phenomena. In optoelectronics and solar cell devices, the use of direct band gap semiconductor perovskite materials is essential. The direct band gap semiconductors revealed the extent of absorbing energy (photon) by electrons moving directly to the conduction band. In the case of indirect band gap semiconductor materials, a phonon created heat influence and lowered the reliability of the devices. Furthermore, the interband transition were better than the intraband transition in the large band gap semiconductor. In former ones, there are transitions from the valence band to the conduction band, deep state, and shallow state transition [54].
3.6. Urbach Energy as a Measure of Order or Disorder
Figure 13 displays the Urbach diagram for the PEO and PEO-loaded samples. From the plot, the prediction of whether the samples were crystalline or amorphous after doping was decided. The Urbach tail was seen in amorphous and disordered materials and was vital for realizing the electronic passage property of these materials. It can be proved that the band tail levels in the amorphous structure resulted from strains in the network that were adequate to thrust the levels to the forbidden band gap. Interestingly, the tails decayed exponentially into the band gap [52,55]. At relatively low absorption levels, the absorption coefficient (α) was best described by the Urbach formula [56]:
where αo refers to a constant and ΔE denotes energy, which was obtained from the tail width of localized levels inside the forbidden gap. The resultant of state tailing at the Urbach band edges came from the disorder of the structure. These tail states indicated the contribution of the photon energy absorption below the energy band gab, i.e., the tail states were characteristic behavior of absorption in the sub-gap region [56]. As Saq’an et al. stated, the Urbach energy decrement was sufficient evidence of growing the crystalline structure. Prasher et al. emphasized that when Urbach energy increases, it indirectly indicates a growth in the amorphous portion [55]. All of this demonstrated the accuracy of Urbach energy in predicting the structure of solid materials, i.e., the structure of samples transferred from crystalline to amorphous beyond the doping. The Urbach energy of parent PEO and loaded PEO are listed in Table 3. The Urbach energy increased from 0.692 eV to 1.487 eV parent PEO and the PEO doped with 8 wt.% of CaTiO3 particles, respectively. This shift in energy revealed the growth of the amorphous region. In the present study, a lowering in intensity and increase in the broadness of the diffraction peak of pure PEO were recorded after adding CaTiO3 particles.
α = αo exp(−hω/ΔE)
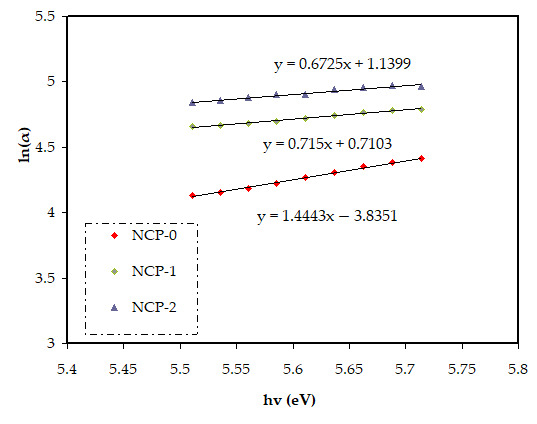
Figure 13.
Urbach plot for NCP-0 and composite films.
Table 3.
Urbach energy for pure PEO and PEO doped solid polymer films.
3.7. Optical Microscopy Study of PEO Morphology
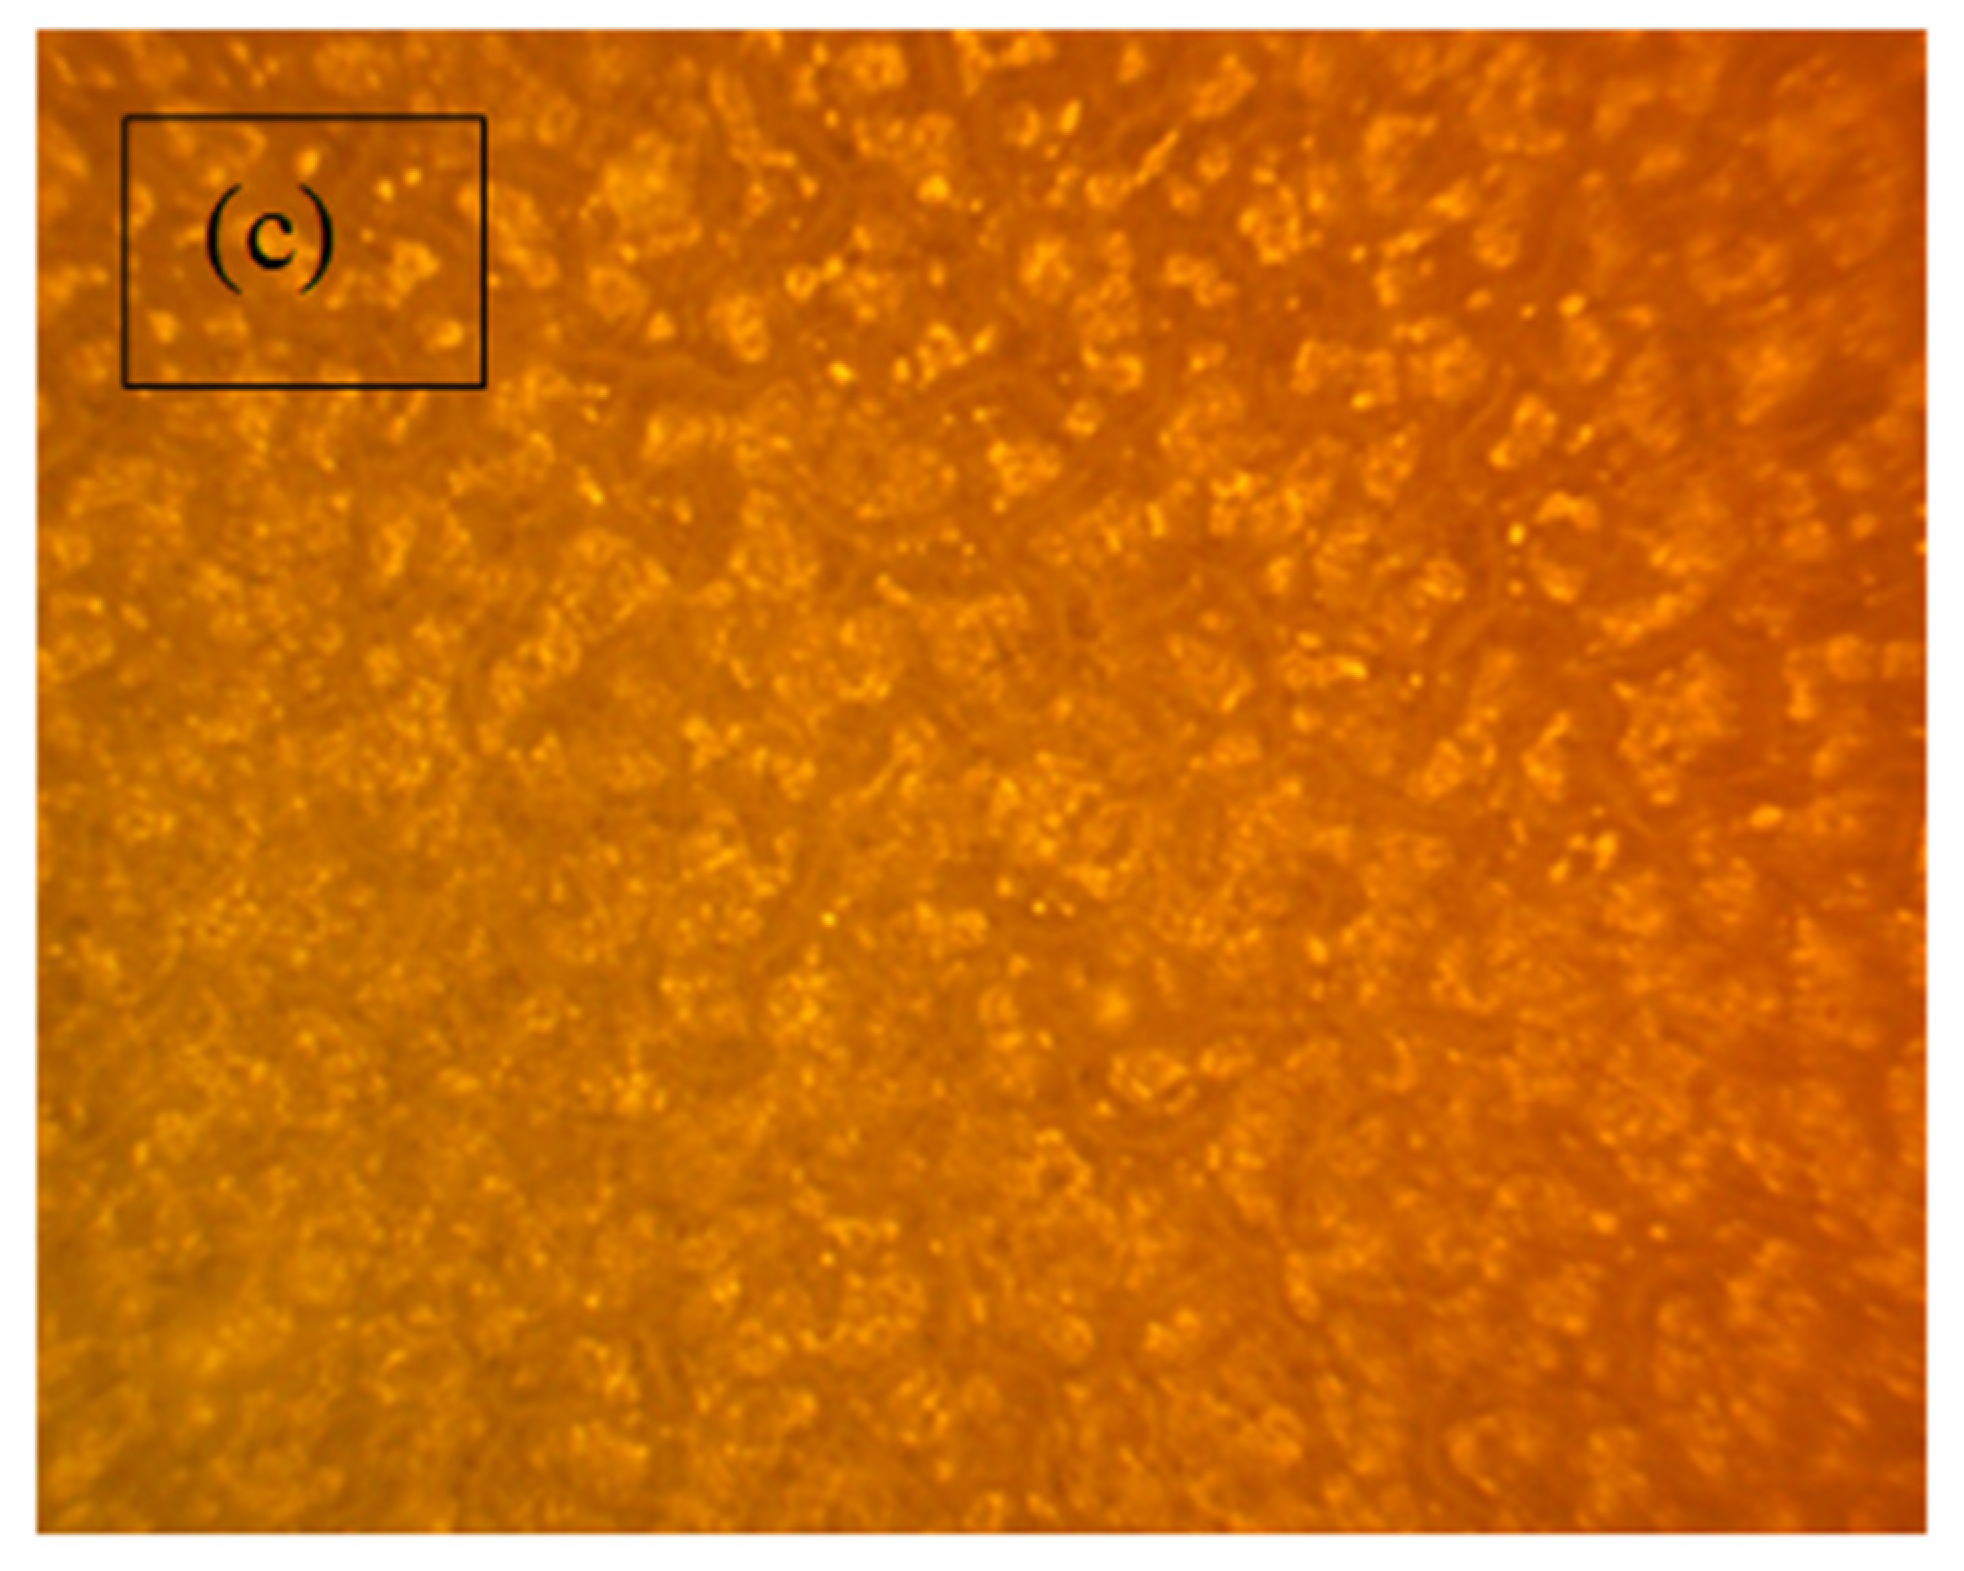
PEO-based polymer with high molecular weight and polycrystalline materials with micron-sized randomly aligned distinct domains (See Figure 14a). Each domain was made up of aligned or tangled chains characterized by a wide range of topological interactions. Physical crossings, knotting, and looping were examples of such interactions [57,58]. It is worth noting that pure PEO electrolytes contain semi-crystalline and amorphous regions and intermediate regions at the crystalline/amorphous interphase, below the melting temperature (≈ 330 K). At ambient temperature, PEO’s semi-crystalline structure resulted in both amorphous and crystalline phases [38,59,60,61]. In pure PEO samples, some spherulites of varying sizes were generated by lamellar eutectics, as seen in Figure 14a. Spherulites covered a larger surface area in pristine PEO than what was found in doped samples. Because spherulites were the crystalline phase of PEO, this was evidence of increased crystallinity relative to doped samples [62,63]. The composite film became smoother as the fraction of CaTiO3 increased, spheroids’ size decreased, and individual spheroids’ boundaries became apparent (see Figure 14b,c). The literature suggests that, spheroids form through random nucleation and develop radially until they collide at borders, as shown in Figure 14a. The morphological behavior of crystalline polymers with flexible chains was characteristic. If we closely look at one of the spheroids, one can see that it has more fiber texture (amorphous phase) than the others [64].
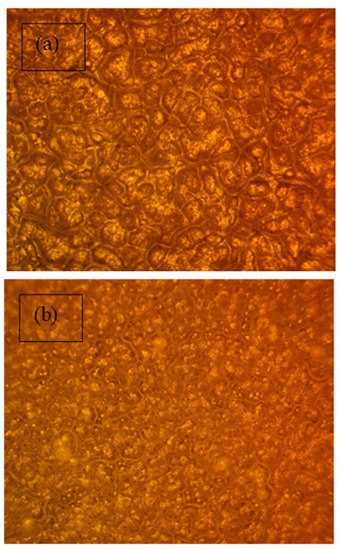
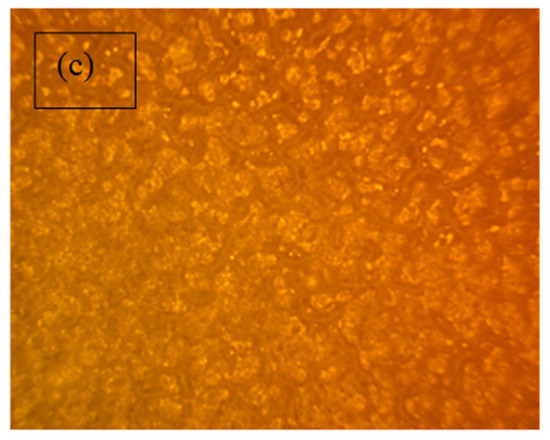
Figure 14.
Optical microscopy images for (a) Pure PEO, (b) NCP-1, and (c) NCP-2 composite films.
4. Conclusions
In conclusion, the construction of direct band gap polymer composites with improved amorphous phase showed the efficiency and eligibility of the polymer for application in optoelectronic devices. Implementation of the solution-cast technique was carried out in the construction of PEO/CaTiO3 nanocomposites. Development of amorphous nature in parent PEO with CaTiO3 was evidenced via XRD. The refractive index dispersion behavior of PEO was shifted to a greater wavelength by loading with CaTiO3. The optical properties of the PEO-based composites had a small optical energy band gap close. Both the refractive index and dielectric constant were significantly modified when an optimum quantity of CaTiO3 was added into the PEO polymer. Taucs model was successfully applied in determining the type of electronic transition within the samples. The desired optical energy band gap was achieved from the analysis of the dielectric loss parameter. The improvement in band gap and flexibility of films that were achieved, were potentially usable in optoelectronic devices. Summarily, the most significant possible electron transition type was determined from the diagram of dielectric loss. This development of UV-Vis absorption also made the prepared nanocomposite film the candidate of choice in future nanotechnology-based device utilization.
Author Contributions
Conceptualization, S.B.A.; Data curation, K.H.M.; Formal analysis, S.A.H.; Funding acquisition, M.M.N., Z.M.E.-B. and E.M.A.D.; Investigation, S.A.H.; Methodology, S.A.H., W.O.K. and A.M.H.; Project administration, S.B.A., M.M.N., K.H.M. and E.M.A.D.; Supervision, S.B.A.; Validation, M.A.B., Z.M.E.-B., W.O.K. and A.M.H.; Writing—original draft, S.B.A.; Writing—review and editing, M.M.N., M.A.B., K.H.M., Z.M.E.-B., E.M.A.D., W.O.K. and A.M.H. All authors have read and agreed to the published version of the manuscript.
Funding
This research received no external funding.
Institutional Review Board Statement
Not applicable.
Informed Consent Statement
Not applicable.
Data Availability Statement
The data presented in this study are available on request from the corresponding author.
Acknowledgments
We would like to acknowledge all support for this work by the University of Sulaimani, Prince Sultan University, and Komar University of Science and Technology. The authors would like to acknowledge the financial support of Taif University Researchers Supporting Project Number (TURSP-2020/162), Taif University, Taif, Saudi Arabia. The authors would like to acknowledge the support of Prince Sultan University for paying the article processing charges (APC) of this publication and for their financial support.
Conflicts of Interest
The authors declare no conflict of interest.
References
- Zeranska-Chudek, K.; Lapinska, A.; Wroblewska, A.; Judek, J.; Duzynska, A.; Pawlowski, M.; Witowski, A.M.; Zdrojek, M. Study of the absorption coefficient of graphene-polymer composites. Sci. Rep. 2018, 8, 9132. [Google Scholar] [CrossRef] [PubMed]
- Guggillia, P.; Chilvery, A.; Powell, R. Reducing the Bandgap Energy via Doping Process in Lead-Free Thin Film Nanocomposites. Res. Rev. J. Mater. Sci. 2017, 5, 5. [Google Scholar]
- Ngai, K.S.; Ramesh, S.; Ramesh, K.; Juan, J.C. A review of polymer electrolytes: Fundamental, approaches and applications. Ionics 2016, 22, 1259. [Google Scholar] [CrossRef]
- Li, W.; Pang, Y.; Liu, J.; Liu, G.; Wang, W.; Xia, Y. A PEO-based gel polymer electrolyte for lithium ion batteries. RSC Adv. 2017, 7, 23494–23501. [Google Scholar] [CrossRef] [Green Version]
- Mohan, V.M.; Bhargav, P.B.; Raja, V.; Sharma, A.K.; Rao, V.V.R.N. Optical and Electrical Properties of Pure and Doped PEO Polymer Electrolyte Films. Soft Mater. 2007, 5, 33–46. [Google Scholar] [CrossRef]
- Meyer, W.H. Polymer Electrolytes for Lithium-Ion Batteries, Polymer Electrolytes for Lithium-Ion Batteries. Adv. Mater. 1998, 10, 439–448. [Google Scholar] [CrossRef]
- Jin, J.; Qi, R.; Su, Y.; Tong, M.; Zhu, J. Preparation of high-refractive-index PMMA/TiO2 nanocomposites by one-step in situ solvothermal method. Iran. Polym. J. 2013, 22, 767–774. [Google Scholar] [CrossRef]
- Lee, J.-K.; Lee, Y.-J.; Chae, W.-S.; Sung, Y.-M. Enhanced ionic conductivity in PEO-LiClO4 hybrid electrolytes by structural modification. J. Electroceramics 2006, 17, 941. [Google Scholar] [CrossRef]
- Ravi, M.; Kumar, K.K.; Rao, V.V.R.N. Studies on electrical and optical properties of PVP:KIO4 complexed polymer electrolyte films. Mater. Sci. Eng. 2015, 73, 012145. [Google Scholar]
- Rama, M.K.; Achari, V.B.S.; Rao, V.V.R.N.; Sharma, A.K. Electrical and optical properties of (PEMA/PVC) polymer blend electrolyte doped with NaClO4. Polym. Test. 2011, 30, 881–886. [Google Scholar] [CrossRef]
- Aziz, S.B.; Ahmed, H.M.; Hussein, A.M.; Fathulla, A.B.; Wsw, R.M.; Hussein, R.T. Tuning the absorption of ultraviolet spectra and optical parameters of aluminum doped PVA based solid polymer composites. J. Mater. Sci Mater. Electron. 2015, 26, 8022. [Google Scholar] [CrossRef]
- Aziz, S.B.; Abdulwahid, R.T.; Rsaul, H.A.; Ahmed, H.M. In situ synthesis of CuS nanoparticle with a distinguishable SPR peak in NIR region. J. Mater. Sci. Mater. Electron. 2016, 27, 4163. [Google Scholar] [CrossRef]
- Aziz, S.B.; Abdullah, O.G.; Rasheed, M.A. A novel polymer composite with a small optical band gap: New approaches for photonics and optoelectronics. J. Appl. Polym. Sci. 2017, 134, 44847. [Google Scholar] [CrossRef]
- Ibrahim, S.; Ahmad, R.; Johan, M.R. Conductivity and optical studies of plasticized solid polymer electrolytes doped with carbon nanotube. J. Lumin. 2012, 132, 147–152. [Google Scholar] [CrossRef]
- Abdelrazek, E.M.; Abdelghany, A.M.; Badr, S.I.; Morsi, M.A. Structural, optical, morphological and thermal properties of PEO/PVP blend containing different concentrations of biosynthesized Au nanoparticles. J. Mater. Res. Technol. 2017, 44, 132. [Google Scholar] [CrossRef]
- Armand, M.B. Polymer Electrolytes. Annu. Rev. Mater. Sci. 1986, 16, 245–261. [Google Scholar] [CrossRef]
- Al-Faleh, R.S.; Zihlif, A.M. A study on optical absorption and constants of doped poly (ethylene oxide). Phys. B Condens. Matter. 2011, 406, 1919–1925. [Google Scholar] [CrossRef]
- Muhammed, S.D.; Brza, A.M.; Nofal, M.M.; Aziz, B.S.; Hussen, A.S.; Abdulwahid, T.R. Optical Dielectric Loss as a Novel Approach to Specify the Types of Electron Transition: XRD and UV-vis as a Non-Destructive Techniques for Structural and Optical Characterization of PEO Based Nanocomposites. Materials 2020, 13, 2979. [Google Scholar] [CrossRef]
- Dunyushkina, L.A.; Demin, A.K.; Zhuravlev, B.V. Electrical conductivity of irondoped calcium titanate. Solid. State Ion. 1999, 116, 85–88. [Google Scholar] [CrossRef]
- Chen, L.; Fan, H.; Zhang, M.; Yang, C.; Chen, X. Phase structure, microstructure and piezoelectric properties of perovskite (K0.5Na0.5)0.95Li0.05NbO3-Bi0.5(K0.15Na0.85)0.5TiO3 lead-free ceramics. J. Alloys. Compd. 2010, 492, 313–319. [Google Scholar] [CrossRef]
- Rostam, S.; Mustafa, D.M.T.; Aziz, S.B. Investigation of flexural and creep behavior of epoxy-based nano-sized CaTiO3 particles. Results Mater. 2021, 9, 100164. [Google Scholar] [CrossRef]
- Sarkawt, A.H. Structural and optical characterization of pure and SnZrO3 doped PS based polymer nanocomposite. Mater. Res. Express 2020, 7, 105302. [Google Scholar]
- Ibrahim, S.; Yassin, M.M.; Ahmad, R.; Johan, M.R. Effects of various LiPF6 salt concentrations on PEO-based solid polymer electrolytes. Ionics 2011, 17, 399–405. [Google Scholar] [CrossRef]
- Yang, R.; Zhang, S.; Zhang, L.; Liu, W. Electrical properties of composite polymer electrolytes based on PEO-SN-LiCF3SO3. Int. J. Electrochem. Sci. 2013, 8, 10163–10169. [Google Scholar]
- Kim, M.; Lee, L.; Jung, Y.; Kim, S. Study on Ion Conductivity and Crystallinity of Composite Polymer Electrolytes Based on Poly(ethylene oxide)/Poly(acrylonitrile) Containing Nano-Sized Al2O3 Fillers. J. Nanosci. Nanotechnol. 2013, 13, 7865–7869. [Google Scholar] [CrossRef] [PubMed]
- Rajeh, A.; Morsi, M.; Elashmawi, I. Enhancement of spectroscopic, thermal, electrical and morphological properties of polyethylene oxide/carboxymethyl cellulose blends: Combined FT-IR/DFT. Vacuum 2019, 159, 430–440. [Google Scholar] [CrossRef]
- Chandni, B.; Ram, S.; Anil, A.; Sharma, A.L. Effect of Nano-Filler on the Properties of Polymer Nanocomposite Films of PEO/PAN Complexed with NaPF6. J. Mater. Sci. Eng. B 2015, 5, 2015. [Google Scholar] [CrossRef] [Green Version]
- Devendrappa, H.; Chapi, S. Influence of Cobalt (II) Chloride Catalysed on the Thermal and Optical Characterization of PEO Based Solid Polymer Electrolytes. J. Res. Updat. Polym. Sci. 2015, 4, 205–215. [Google Scholar] [CrossRef]
- Marzantowicz, M.; Dygas, J.R.; Krok, F.; Florjańczyk, Z.; Zygadło-Monikowska, E. Influence of crystalline complexes on electrical properties of PEO:LiTFSI electrolyte. Electrochim. Acta 2007, 53, 1518–1526. [Google Scholar] [CrossRef]
- Aziz, S.B. Structural, thermal, morphological and optical properties of PEO filled with biosynthesized Ag nanoparticles: New insights to band gap study. Results Phys. 2019, 13, 102220. [Google Scholar] [CrossRef]
- Brza, A.M.; Aziz, B.S.; Anuar, H.; Hazza, A. From Green Remediation to Polymer Hybrid Fabrication with Improved Optical Band Gaps. Int. J. Mol. Sci. 2019, 20, 3910. [Google Scholar] [CrossRef] [Green Version]
- Brza, A.M.; Aziz, B.S.; Anuar, H.; Ali, F.; Dannoun, A.E.M.; Saeed, R.S.; Abdulwahid, T.R. Green coordination chemistry as a novel approach to fabricate polymer:Cd(II)-complex composites: Structural and optical properties. Opt. Mater. 2020, 44, 100067. [Google Scholar] [CrossRef]
- Fox, M. Optical Properties of Solids; Oxford University Press: London, UK, 2001. [Google Scholar]
- Muhammad, F.F.; Sulaiman, K. Utilizing a simple and reliable method to investigate the optical functions of small molecular organic films-Alq3 and Gaq3 as examples. Meas. J. Int. Meas. Confed. 2011, 44, 1468–1474. [Google Scholar] [CrossRef]
- Muhammad, F.F.; Aziz, S.B.; Hussein, S.A. Effect of the dopant salt on the optical parameters of PVA:NaNO3 solid polymer electrolyte. J. Mater. Sci. Mater. Electron. 2014, 26, 521–529. [Google Scholar] [CrossRef]
- Abdullah, O.G.; Aziz, S.B.; Rasheed, M.A. Effect of silicon powder on the optical characterization of Poly(methyl methacrylate) polymer composites. J. Mater. Sci. Mater. Electron. 2017, 28, 4513–4520. [Google Scholar] [CrossRef]
- Aziz, S.B.; Rasheed, M.A.; Abidin, Z.H.Z. Optical and Electrical Characteristics of Silver Ion Conducting Nanocomposite Solid Polymer Electrolytes Based on Chitosan. J. Electron. Mater. 2017, 46, 6119–6130. [Google Scholar] [CrossRef]
- Kumar, K.K.; Ravi, M.; Pavani, Y.; Bhavani, S.; Sharma, A.K.; NarasimhaRao, V.V.R. Investigations on the effect of complexation of NaF salt with polymer blend (PEO/PVP) electrolytes on ionic conductivity and optical energy band gaps. Phys. B Condens. Matter 2011, 406, 1706–1712. [Google Scholar] [CrossRef]
- Aziz, S.B.; Rasheed, M.A.; Ahmed, H.M. Synthesis of polymer nanocomposites based on [methyl cellulose](1-x):(CuS)x (0.02 M ≤ x ≤ 0.08 M) with desired optical band gaps. Polymers 2017, 9, 194. [Google Scholar] [CrossRef] [PubMed]
- Yakuphanoglua, F.; Arslan, M. Determination of thermo-optic coefficient, refractive index, optical dispersion and group velocity parameters of an organic thin film. Phys. B 2007, 393, 304–309. [Google Scholar] [CrossRef]
- Soylu, M.; Al-Ghamdi, A.A.; Yakuphanoglu, F. Transparent CdO/n-GaN(0001) heterojunction for optoelectronic applications. J. Phys. Chem. Solids. 2015, 85, 26–33. [Google Scholar] [CrossRef]
- Biskri, Z.E.; Rached, H.; Bouchear, M.; Rached, D.; Aida, M.S. A comparative study of structural stability and mechanical and optical properties of fluorapatite (Ca5(PO4)3F) and lithium disilicate (Li2Si2O5) components forming dental glass-ceramics: First principles study. J. Electron. Mater. 2016, 45, 5082–5083. [Google Scholar] [CrossRef]
- Aziz, S.B.; Mamand, S.M.; Saed, S.R.; Abdullah, R.M.; Hussein, S.A. New method for the development of plasmonic metal-semiconductor interface layer: Polymer composites with reduced energy band gap. J. Nanomater. 2017, 2017, 8140693. [Google Scholar] [CrossRef] [Green Version]
- Abdulwahid, R.T.; Abdullah, O.G.; Aziz, S.B.; Hussein, S.A.; Muhammad, F.F.; Yahya, M.Y. The study of structural and optical properties of PVA:PbO2 based solid polymer nanocomposites. J. Mater. Sci. Mater. Electron. 2016, 27, 12112–12118. [Google Scholar] [CrossRef]
- Bdewi, S.F.; Abdullah, O.G.; Aziz, B.K.; Mutar, A.A.R. Synthesis, structural and optical characterization of MgO nanocrystalline embedded in PVA matrix. J. Inorg. Organomet. Polym. Mater. 2016, 26, 326–334. [Google Scholar] [CrossRef]
- Abdullah, O.G.; Aziz, S.B.; Saber, D.R. Characterizations of pure and Pb2+ ion doped methylcellulose based biopolymer electrolyte films: Optical and electrical properties. Int. J.Electrochem. Sci. 2018, 13, 11931–11952. [Google Scholar] [CrossRef]
- Brza, M.A.; Aziz, S.B.; Anuar, H.; Dannoun, E.M.A.; Mohammed, S.J.; Abdulwahid, R.; Al-Zangana, S. Tea from the drinking to the synthesis of metal complexes and fabrication of PVA based polymer composites with controlled optical band gap. Sci. Rep. 2020, 10, 18108. [Google Scholar] [CrossRef]
- Abdullah, O.G.; Aziz, S.B.; Omer, K.M.; Salih, Y.M. Reducing the optical band gap of polyvinyl alcohol (PVA) based nanocomposite. J. Mater. Sci. Mater. Electron. 2015, 26, 5303–5309. [Google Scholar] [CrossRef]
- Aziz, S.B.; Abdullah, O.G.; Hussein, A.M.; Abdulwahid, R.T.; Rasheed, M.A.; Ahmed, H.M.; Abdalqadir, S.W.; Mohammed, R.A. Optical properties of pure and doped PVA:PEO based solid polymer blend electrolytes: Two methods for band gap study. J. Mater. Sci. Mater. Electron. 2017, 28, 7473–7479. [Google Scholar] [CrossRef]
- Yakuphanoglua, M.S. Determination of the optical constants of Co(II) complex of schiff base obtained from 1,8-diaminonaphthalene thin film by infrared spectra. J. Mol. Struct. 2005, 751, 200–203. [Google Scholar] [CrossRef]
- Saini, I.; Rozra, J.; Chandak, N.; Aggarwal, S.; Sharma, P.K.; Sharma, A. Tailoring of electrical, optical and structural properties of PVA by addition of Ag nanoparticles. Mater. Chem. Phys. 2013, 139, 802–810. [Google Scholar] [CrossRef]
- Aziz, S.B. Modifying Poly(Vinyl Alcohol) (PVA) from Insulator to Small-Bandgap Polymer: A Novel Approach for Organic Solar Cells and Optoelectronic Devices. J. Electron. Mater. 2016, 45, 736–745. [Google Scholar] [CrossRef]
- Aziz, S.B.; Rasheed, M.A.; Hussein, A.M.; Ahmed, H.M. Fabrication of polymer blend composites based on [PVA-PVP](1−x):(Ag2S)x (0.01 ≤ x ≤ 0.03) with small optical band gaps: Structural and optical properties. Mater. Sci. Semicond. Process. 2017, 71, 197–203. [Google Scholar] [CrossRef]
- Mahmood, Q.; BakhtiarUlHaq, Y.M.; Ramay, S.M. The first-principle study of mechanical, optical and thermoelectric properties of SnZrO3 and SnHfO3 for renewable energy applications. Solid State Commun. 2019, 11, 153. [Google Scholar] [CrossRef]
- Prasher, S.; Kumar, M.; Singh, S. Electrical and Optical Properties of O6+ Ion Beam–Irradiated Polymers. Int. J. Polym. Anal. Charact. 2014, 19, 204–211. [Google Scholar] [CrossRef]
- Saq’an, S.A.; Ayesh, A.S.; Martuscelli, E.; Ragosta, G. Physical properties of polystyrene/alum composites. Polym. Test. 2004, 23, 739–745. [Google Scholar] [CrossRef]
- Golodnitsky, D.; Livshits, E.; Ulus, A.; Barkay, Z.; Lapides, I.; Peled, E.; Chung, S.H.; Greenbaum, S. Fast Ion Transport Phenomena in Oriented SemicrystallineLiI−P(EO)n-Based Polymer Electrolytes. J. Phys. Chem. A 2001, 105, 10098–10106. [Google Scholar] [CrossRef]
- Golodnitsky, D.; Strauss, E.; Peled, E.; Greenbaumd, S. Review—On Order and Disorder in Polymer Electrolytes. J. Electrochem. Soc. 2015, 162, A2551–A2566. [Google Scholar] [CrossRef]
- Koduru, H.K.; Iliev, M.T.; Kondamareddy, K.K.; Karashanova, D.; Vlakhov, T.; Zhao, X.Z.; Scaramuzza1, N. Investigations on Poly (ethylene oxide) (PEO)–blend based solid polymer electrolytes for sodium ion batteries. J. Phys. Conf. Ser. 2016, 764, 012006. [Google Scholar] [CrossRef]
- Abdullah, R.M.; Aziz, S.B.; Mamand, S.M.; Hassan, A.Q.; Hussein, S.A.; Kadir, M.F.Z. Reducing the Crystallite Size of Spherulites in PEO-Based Polymer Nanocomposites Mediated by Carbon Nanodots and Ag Nanoparticles. Nanomaterials 2019, 9, 874. [Google Scholar] [CrossRef] [Green Version]
- Shujahadeen, B.A.; Ranjdar, M.A. Crystalline and amorphous phase identification from the tanδ relaxation peaks and impedance plots in polymer blend electrolytes based on [CS: AgNt] x: PEO (x-1)(10≤ x ≤ 50). Electrochim. Acta 2018, 285, 30–46. [Google Scholar]
- Xi, J.; Bai, Y.; Qiu, X.; Zhu, W.; Chena, L.; Tang, X. Conductivities and transport properties of microporous molecular sieves doped composite polymer electrolyte used for lithium polymer battery. New J. Chem. 2005, 29, 1454–1460. [Google Scholar] [CrossRef]
- Bandara, T.M.; Karunathilaka, D.G.; Ratnasekera, G.L.; Ajith, S.; Herath, A.C.; Mellander, B.E. Electrical and complex dielectric behaviour of composite polymer electrolyte based on PEO, alumina and tetrapropylammonium iodide. Ionics 2017, 23, 1711–1719. [Google Scholar] [CrossRef]
- Wu, C.G.; Wu, C.H.; Lu, M.I.; Chuang, H.J. New Solid Polymer Electrolytes Based on PEO/PAN Hybrids. J. Appl. Polym. Sci. 2021, 99, 1530–1540. [Google Scholar]


Publisher’s Note: MDPI stays neutral with regard to jurisdictional claims in published maps and institutional affiliations. |
© 2021 by the authors. Licensee MDPI, Basel, Switzerland. This article is an open access article distributed under the terms and conditions of the Creative Commons Attribution (CC BY) license (https://creativecommons.org/licenses/by/4.0/).