Influence of Hard Segment Content and Diisocyanate Structure on the Transparency and Mechanical Properties of Poly(dimethylsiloxane)-Based Urea Elastomers for Biomedical Applications

 ,
,  ,
, 
Abstract
1. Introduction
2. Materials and Methods
2.1. Chemicals
2.2. Determination of Molecular Weight
2.2.1. Titration
2.2.2. Size-Exclusion Chromatography
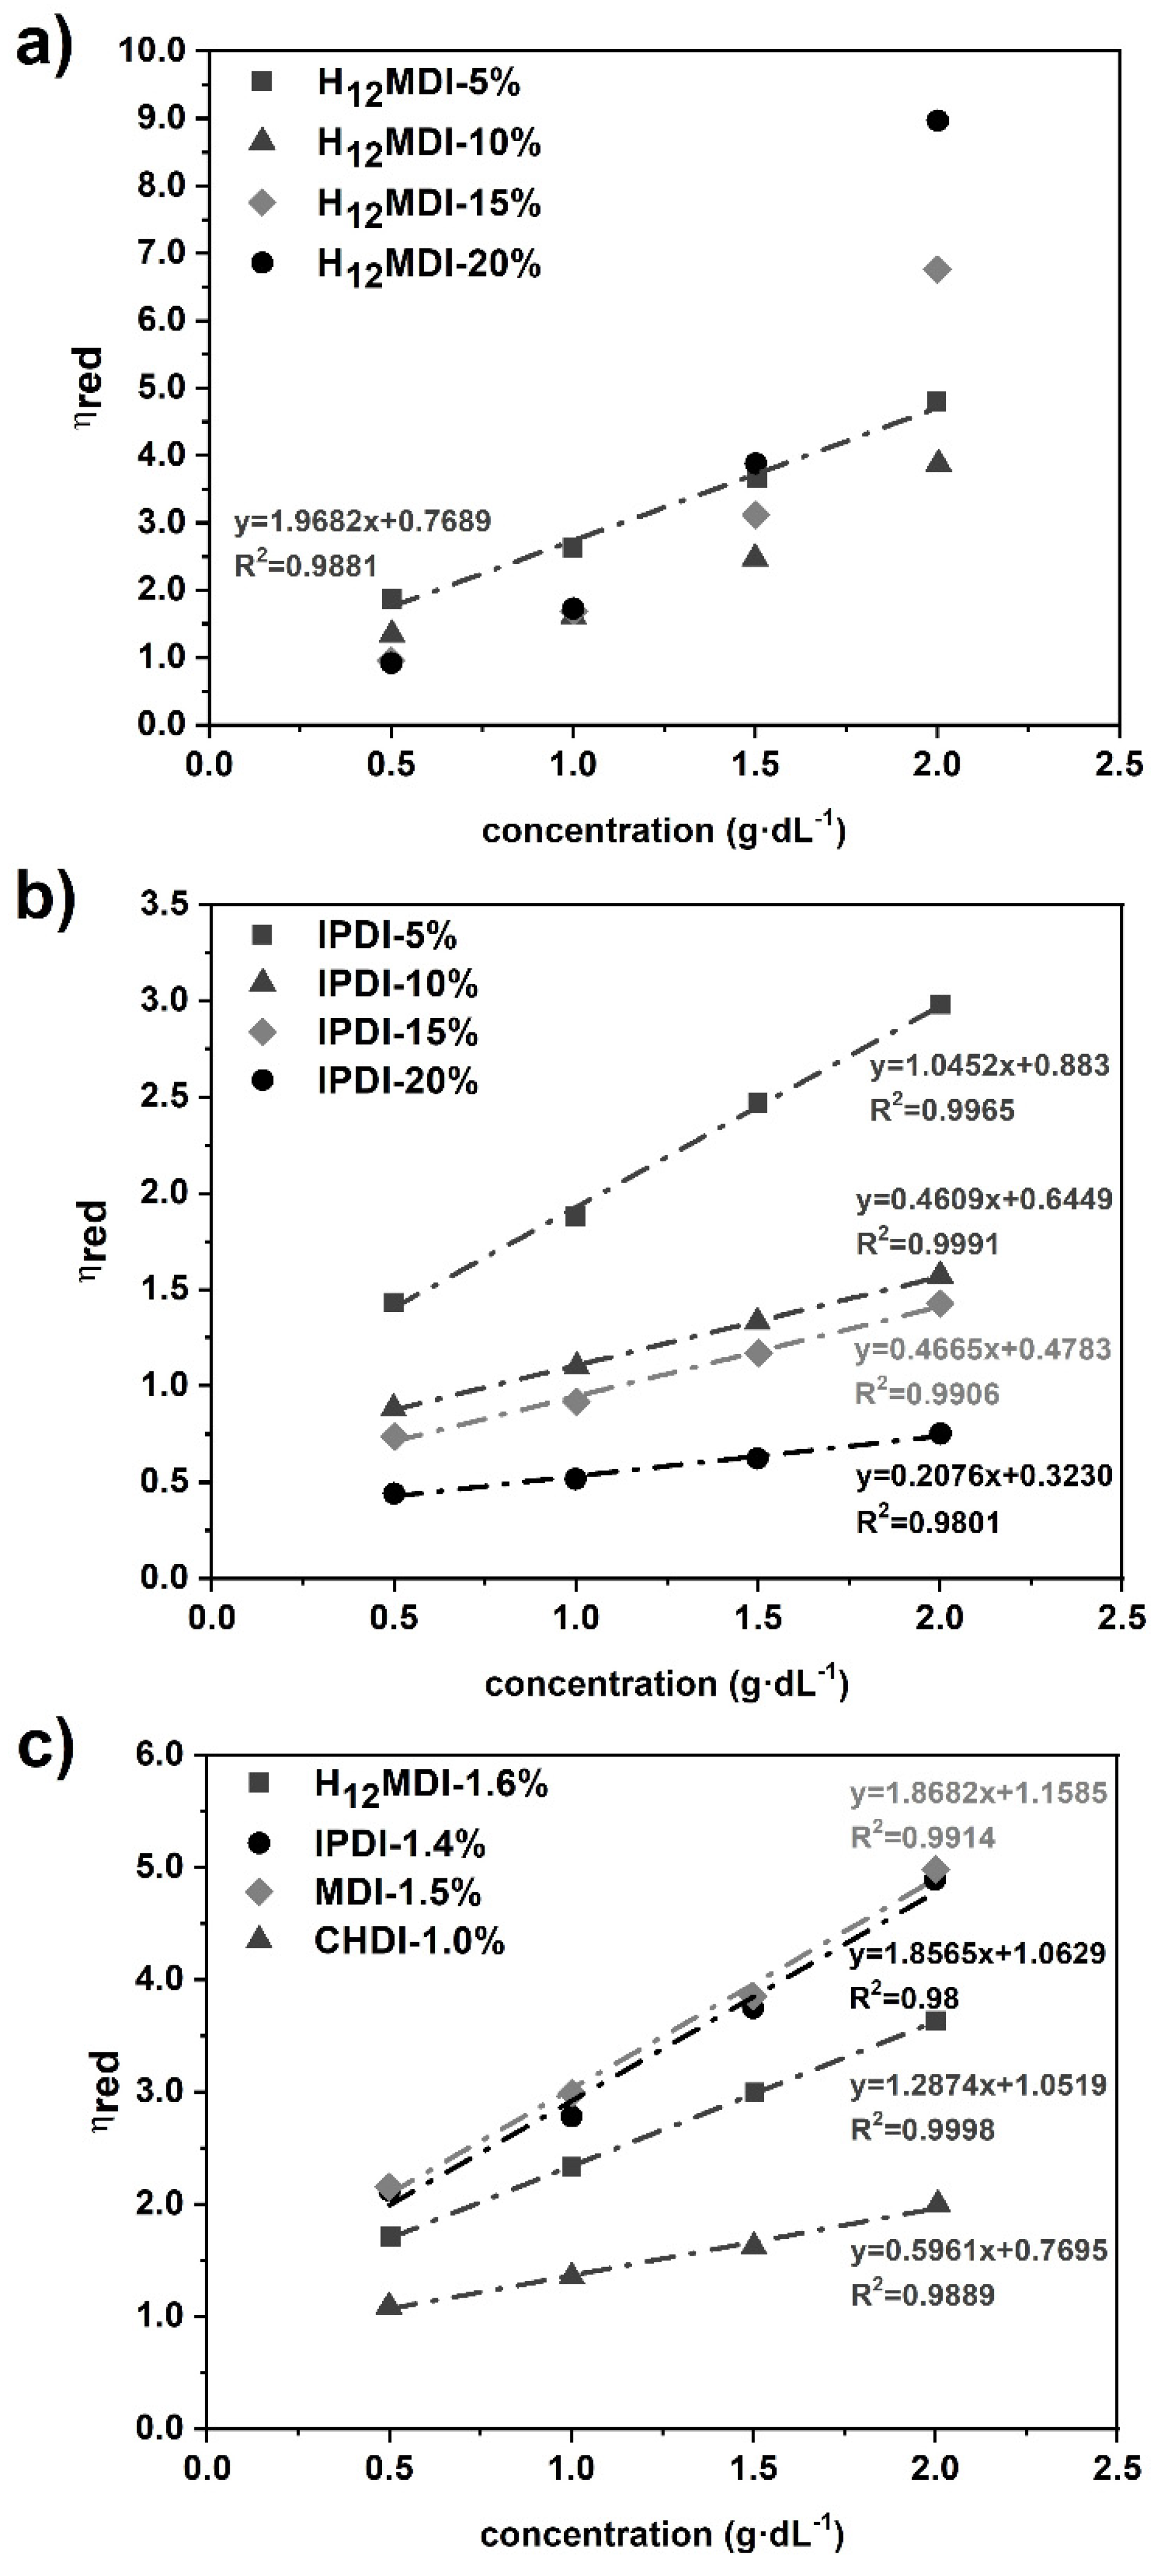
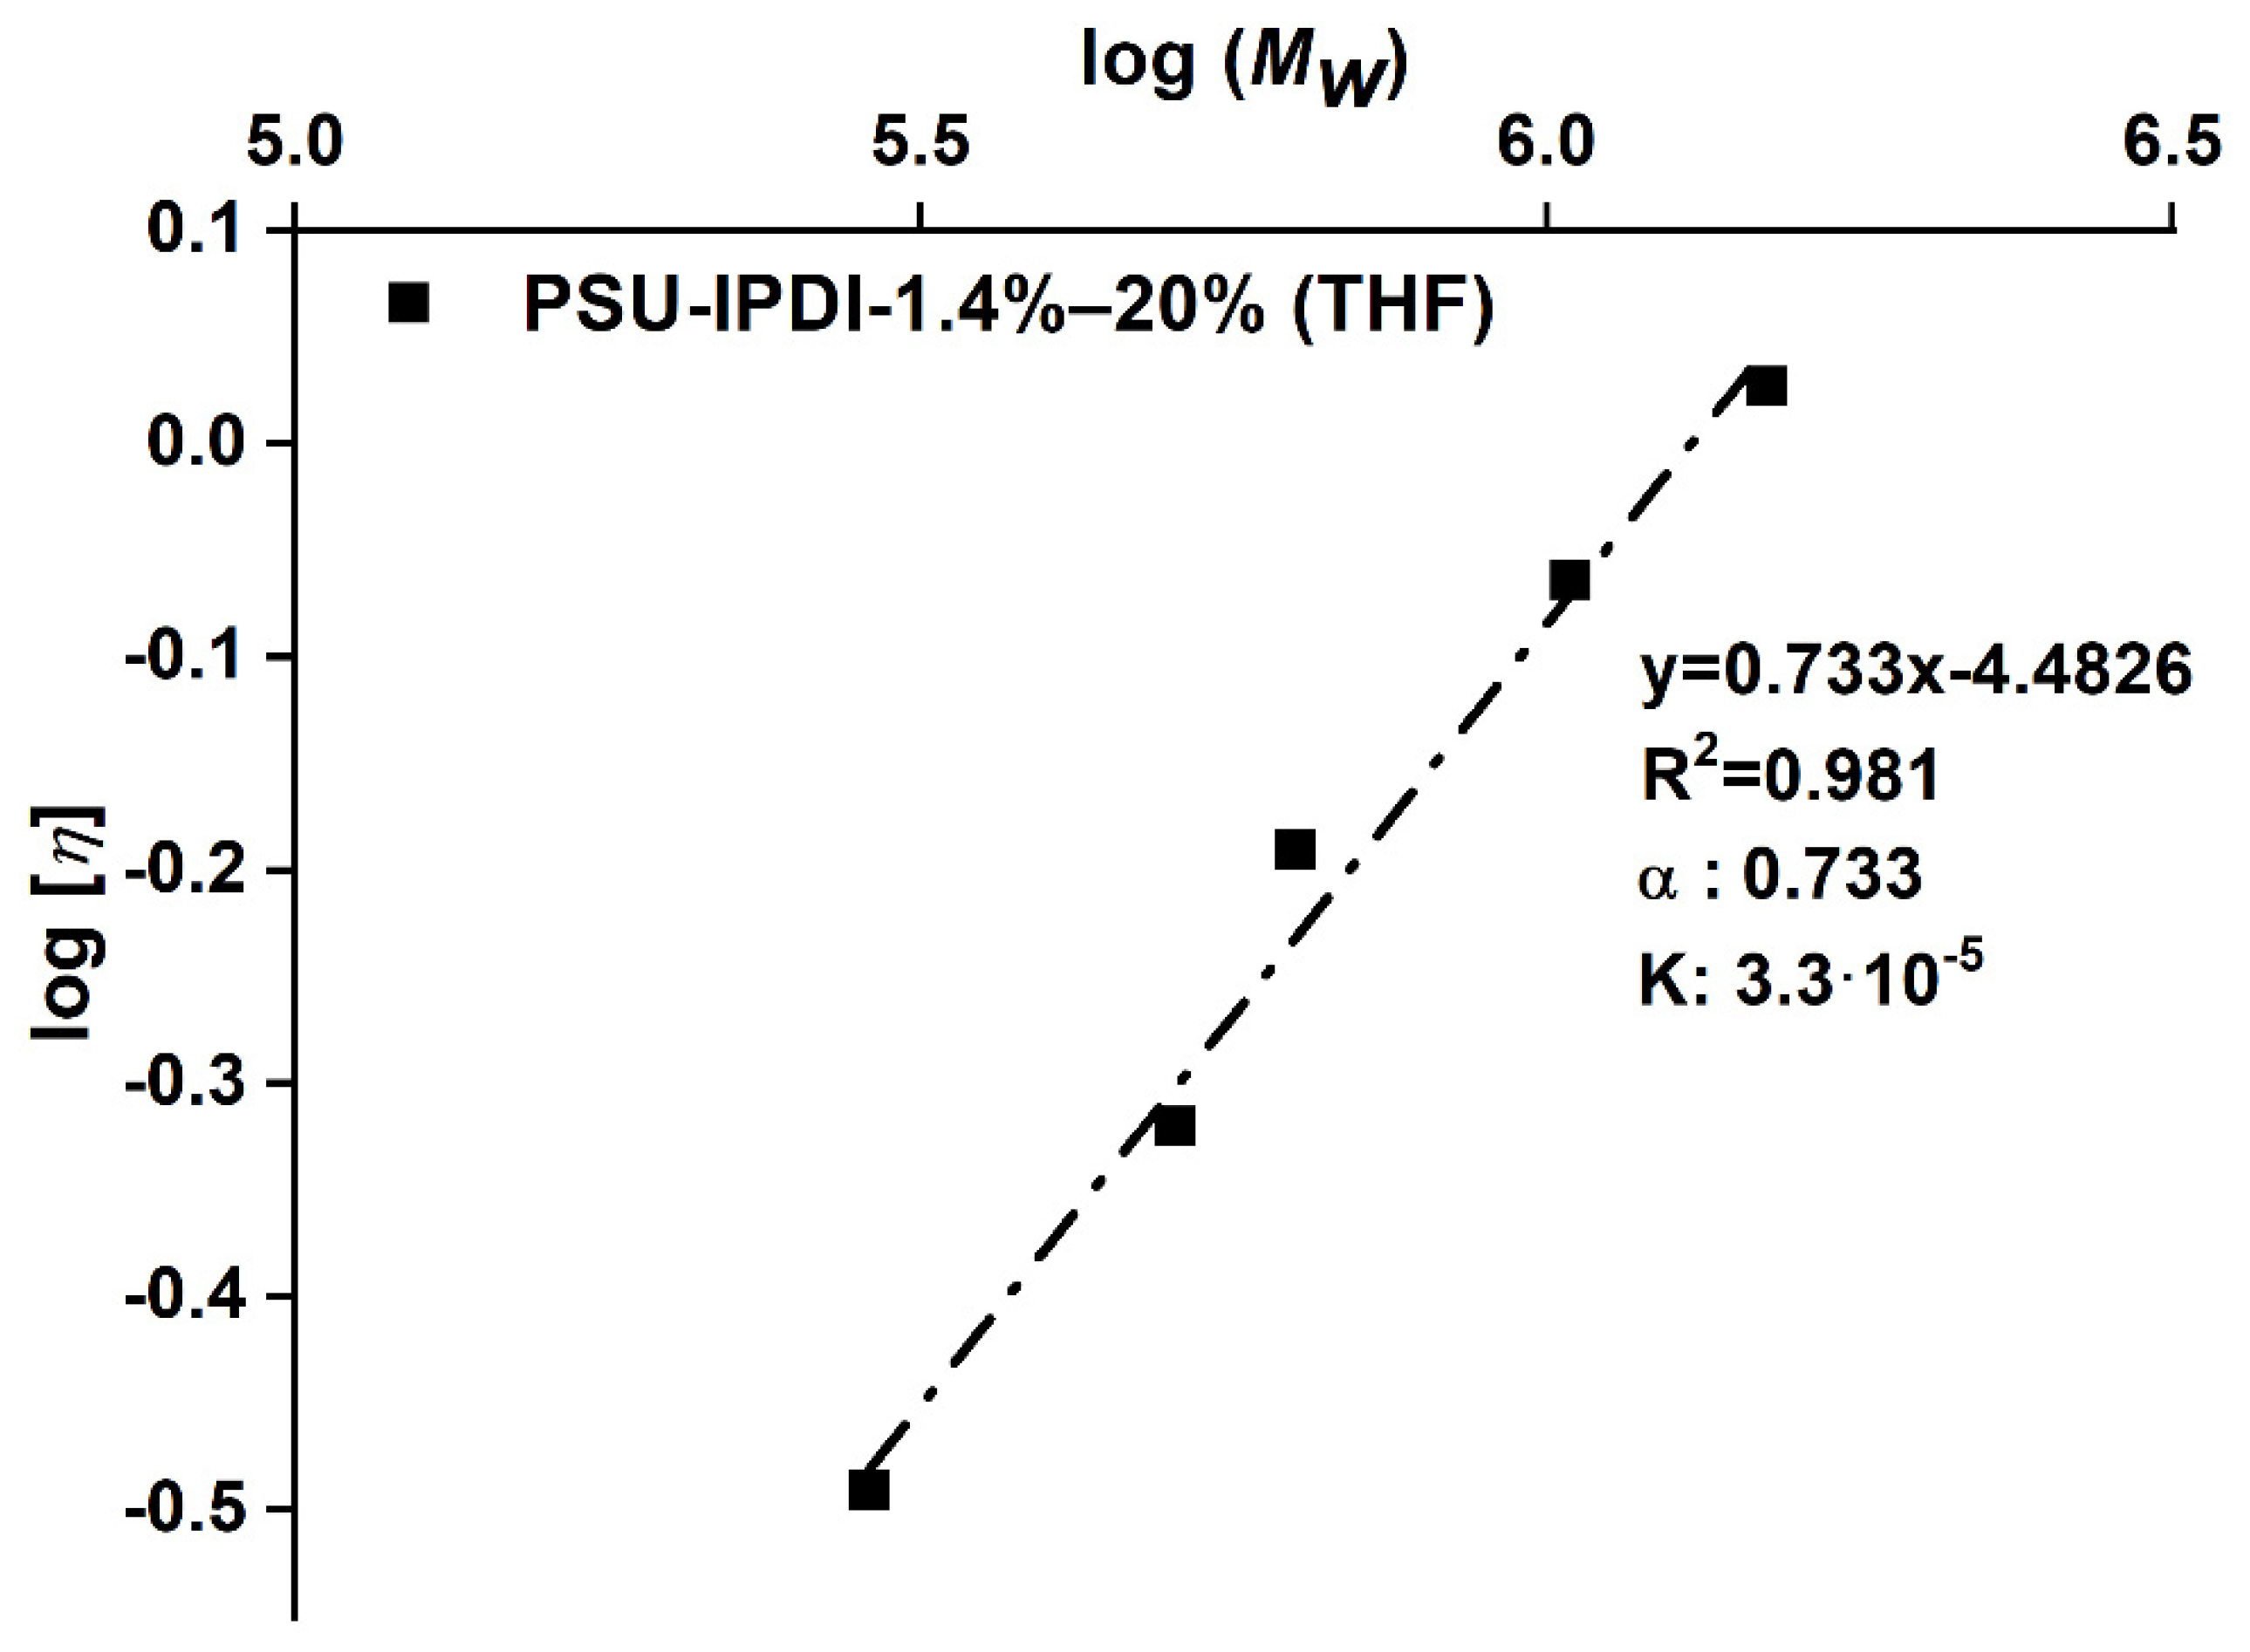
2.2.3. Determination of Intrinsic Viscosity
2.3. Characterization of Molecular Weight
2.4. Preparation of PSU Elastomer Films for Measurement of Transparency and Mechanical Properties
2.5. Measurement of Transparency
2.6. Measurement of Mechanical Properties
2.7. Measurement of In Vitro Cytotoxicity
3. Results and Discussion
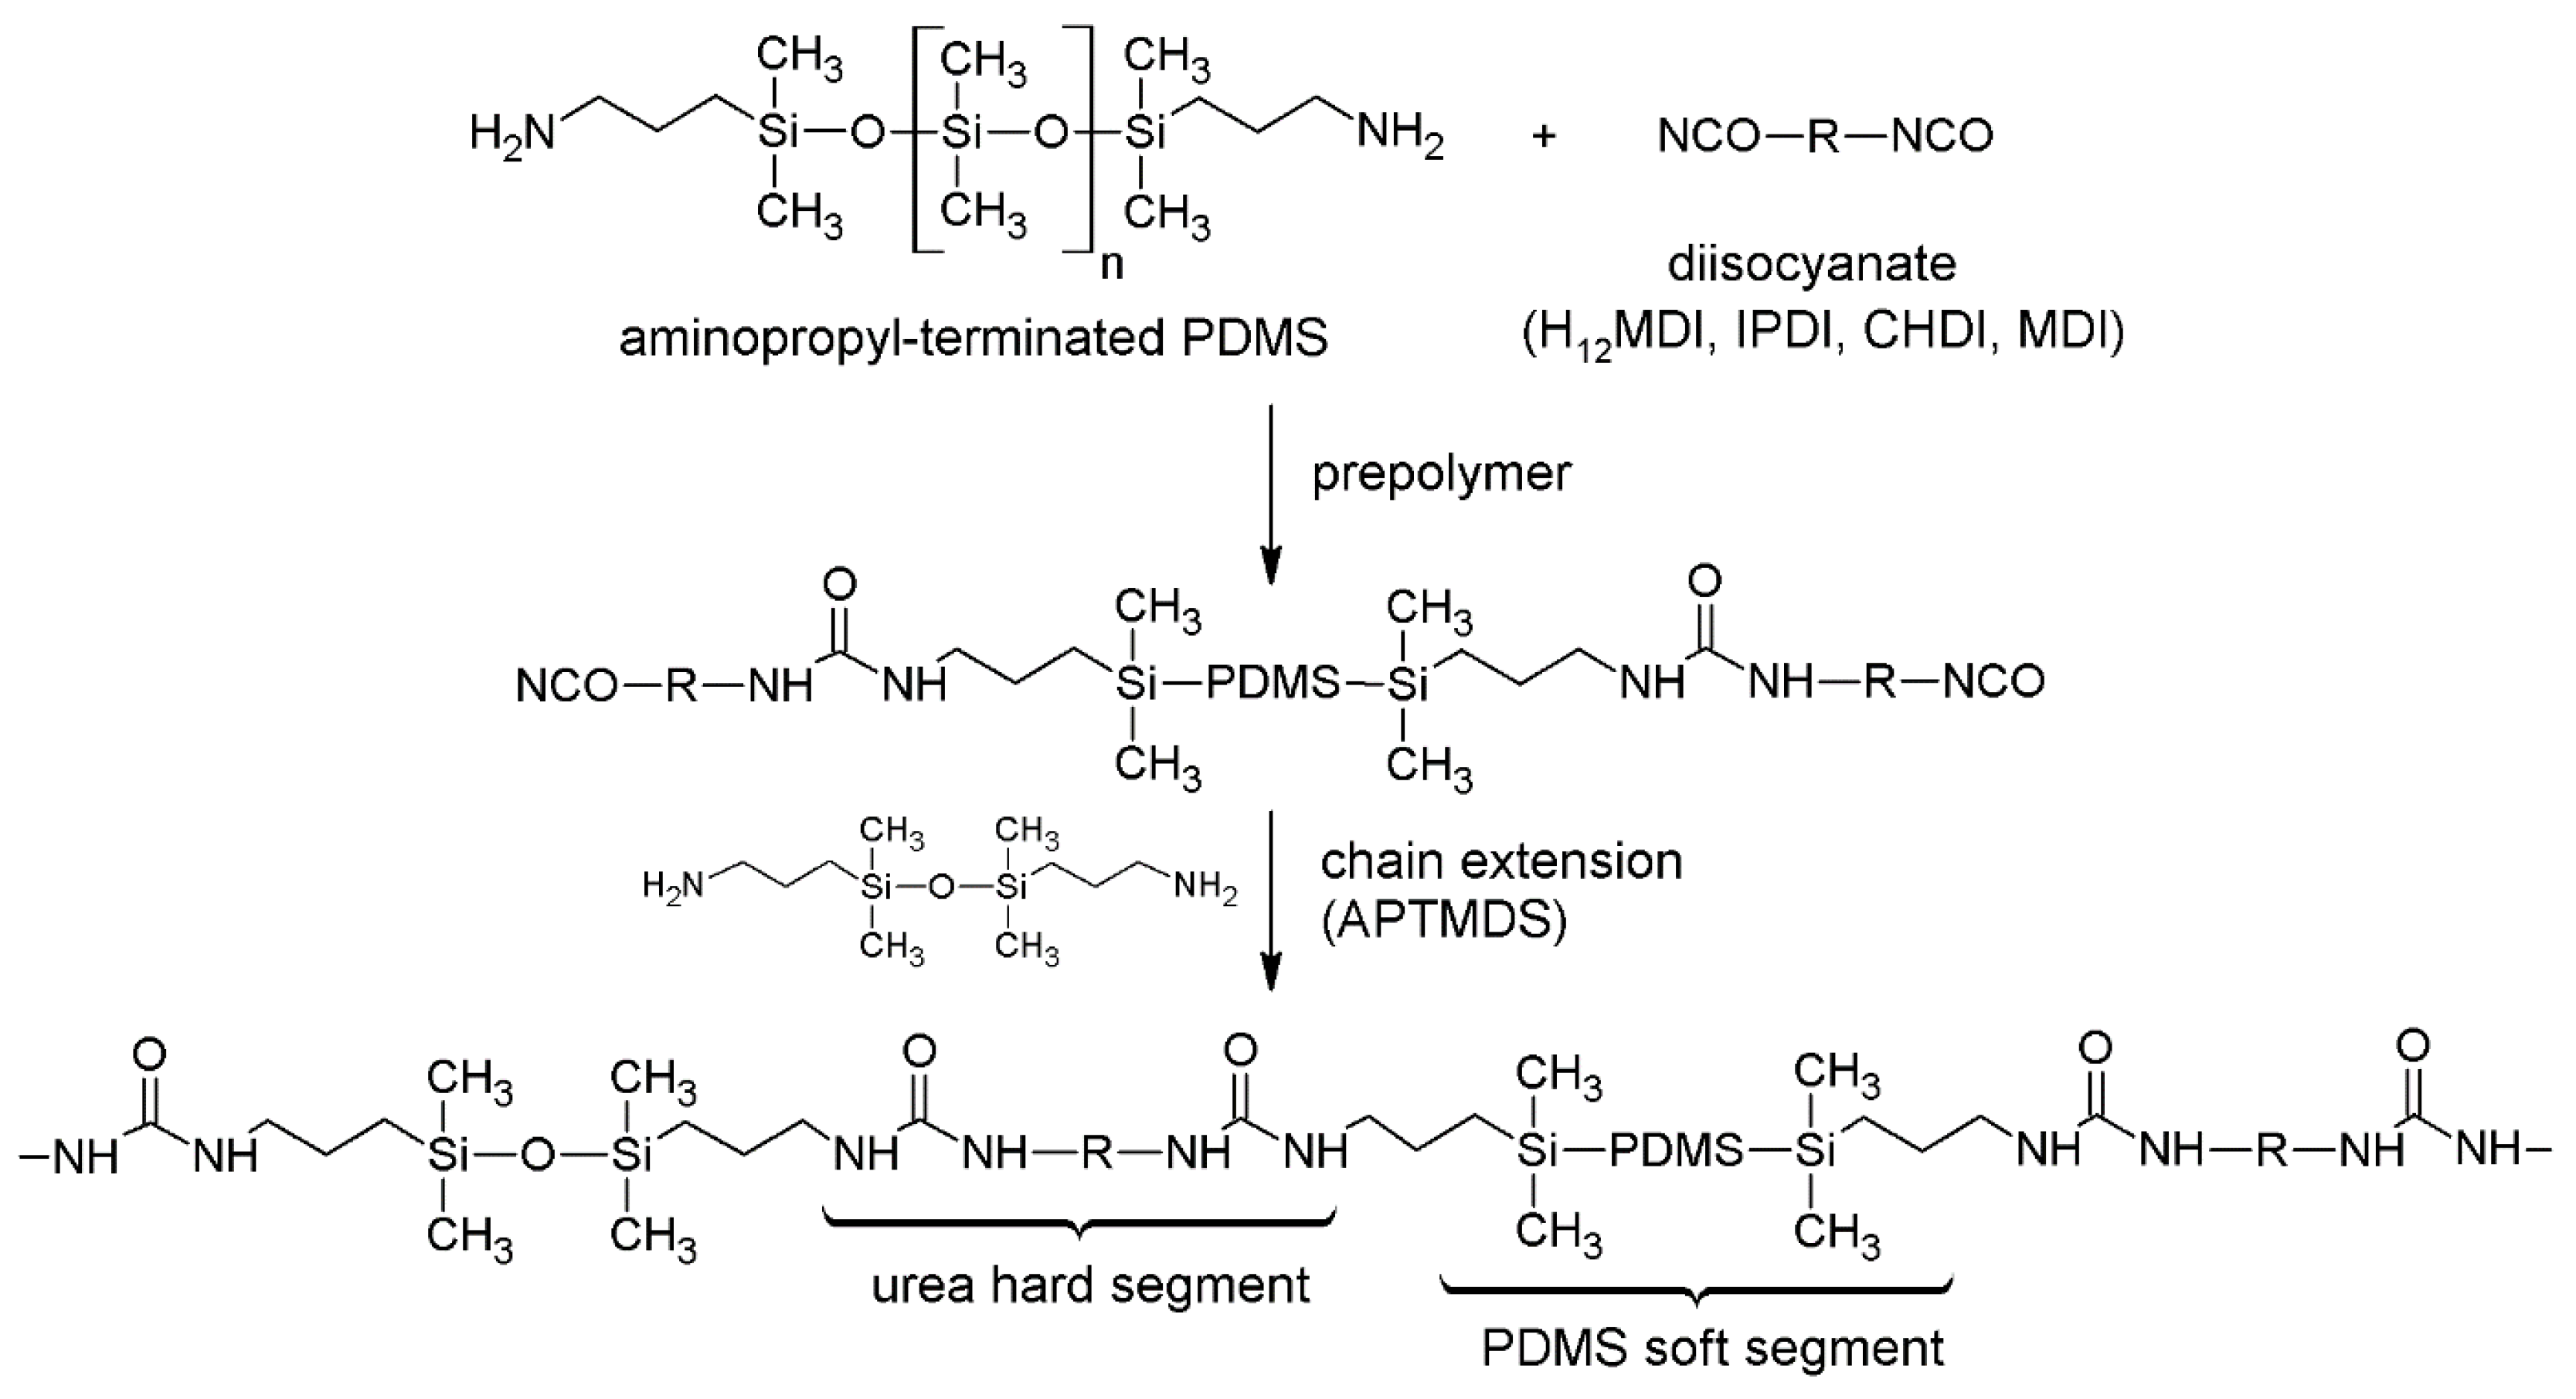
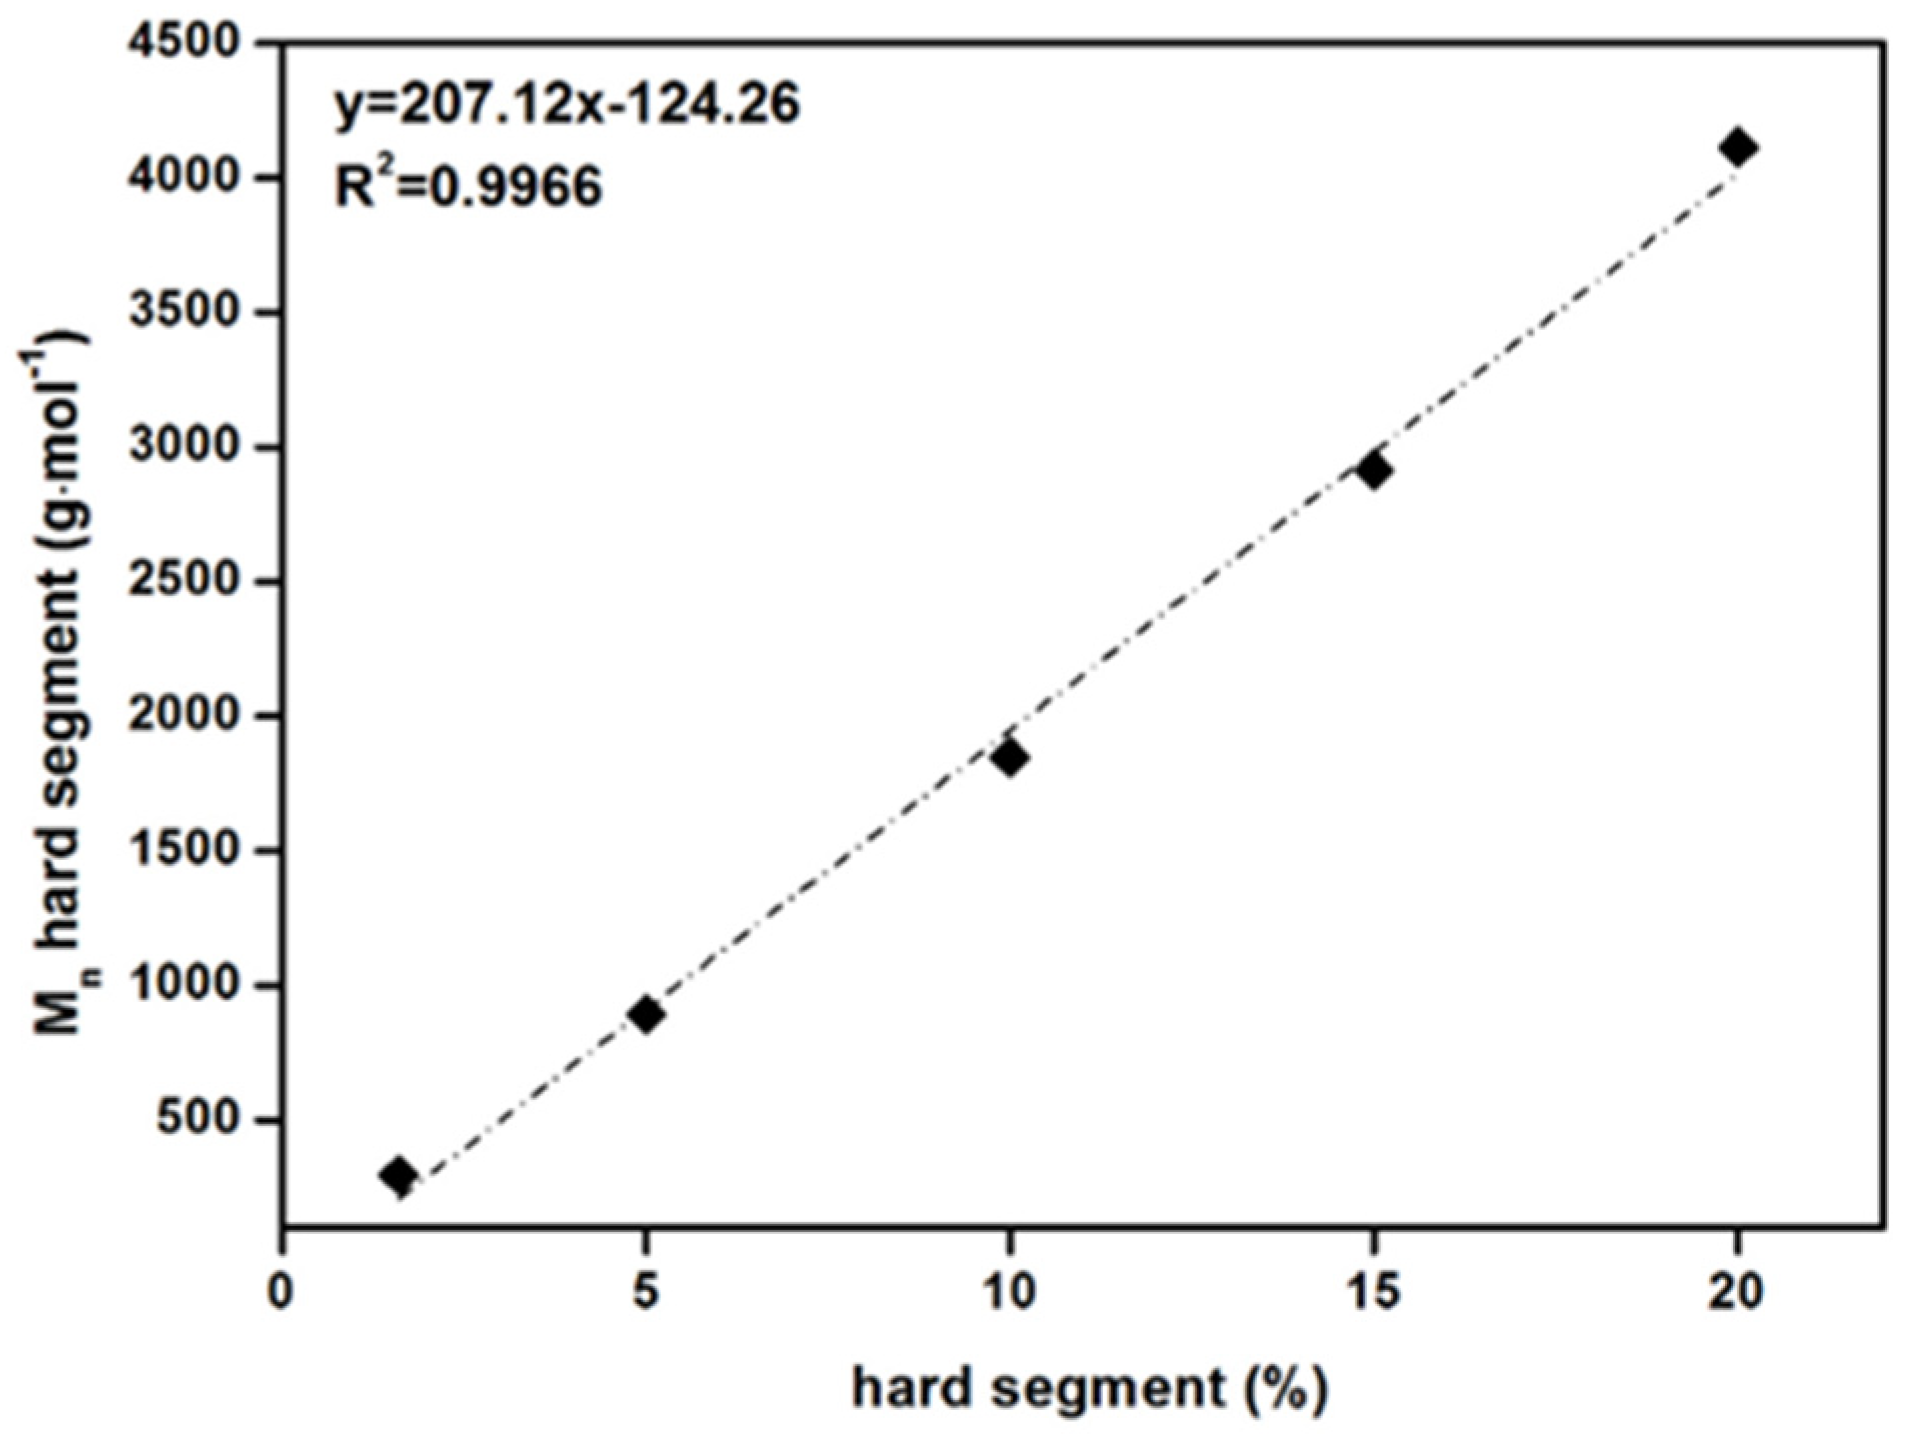
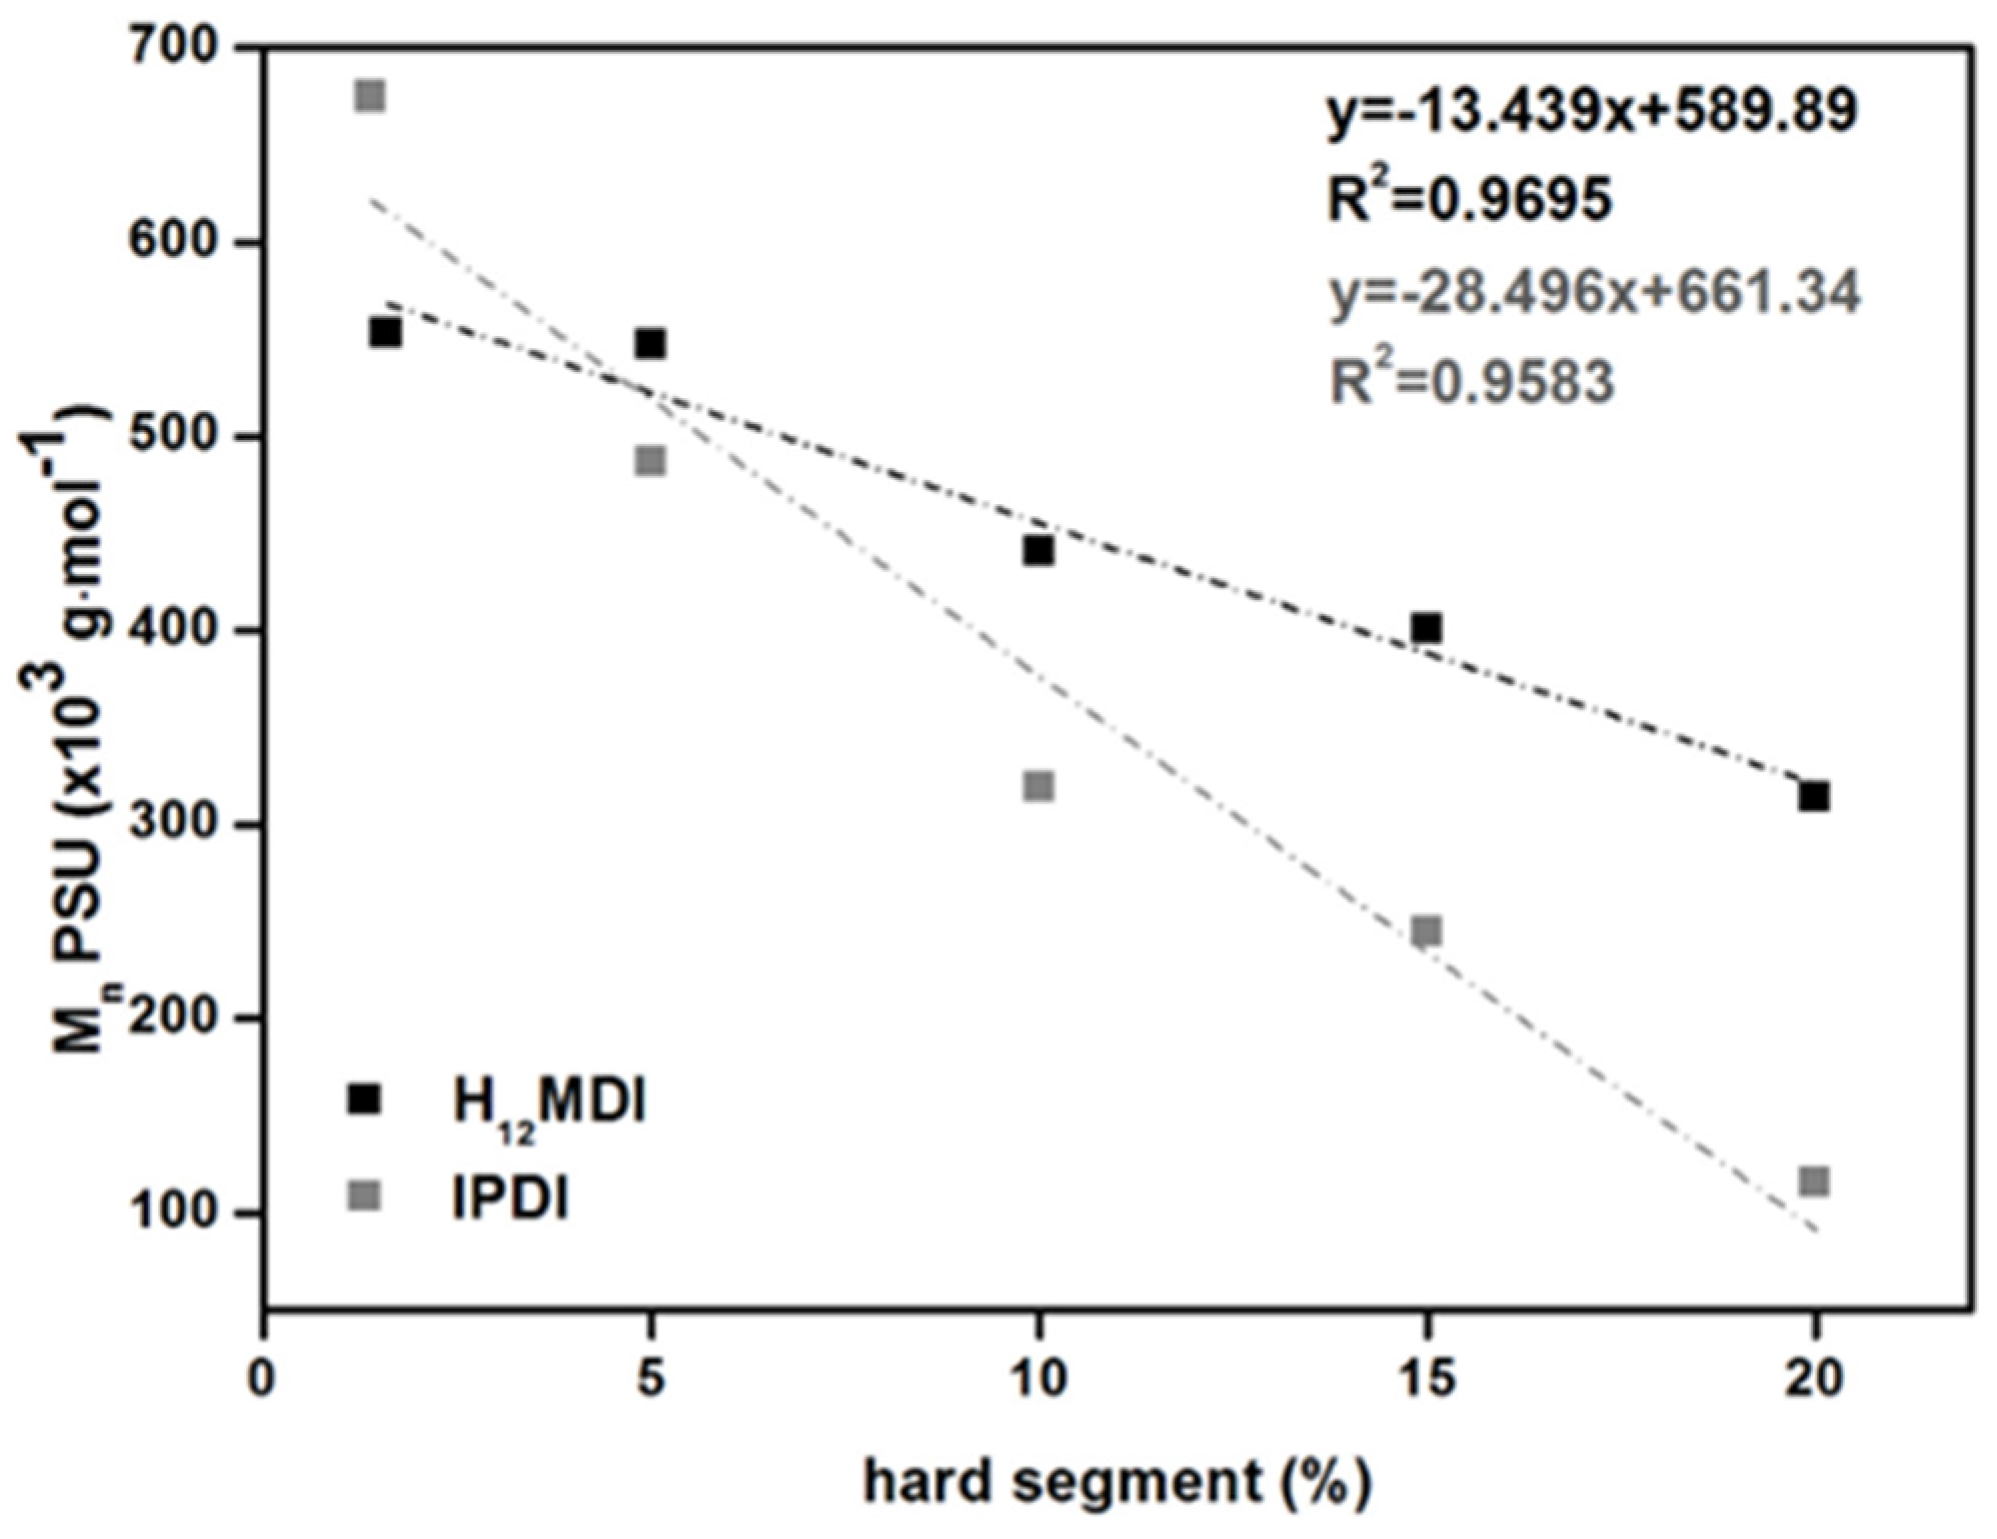
3.1. Synthesis and Characterization of PDMS-Based PUr Elastomers
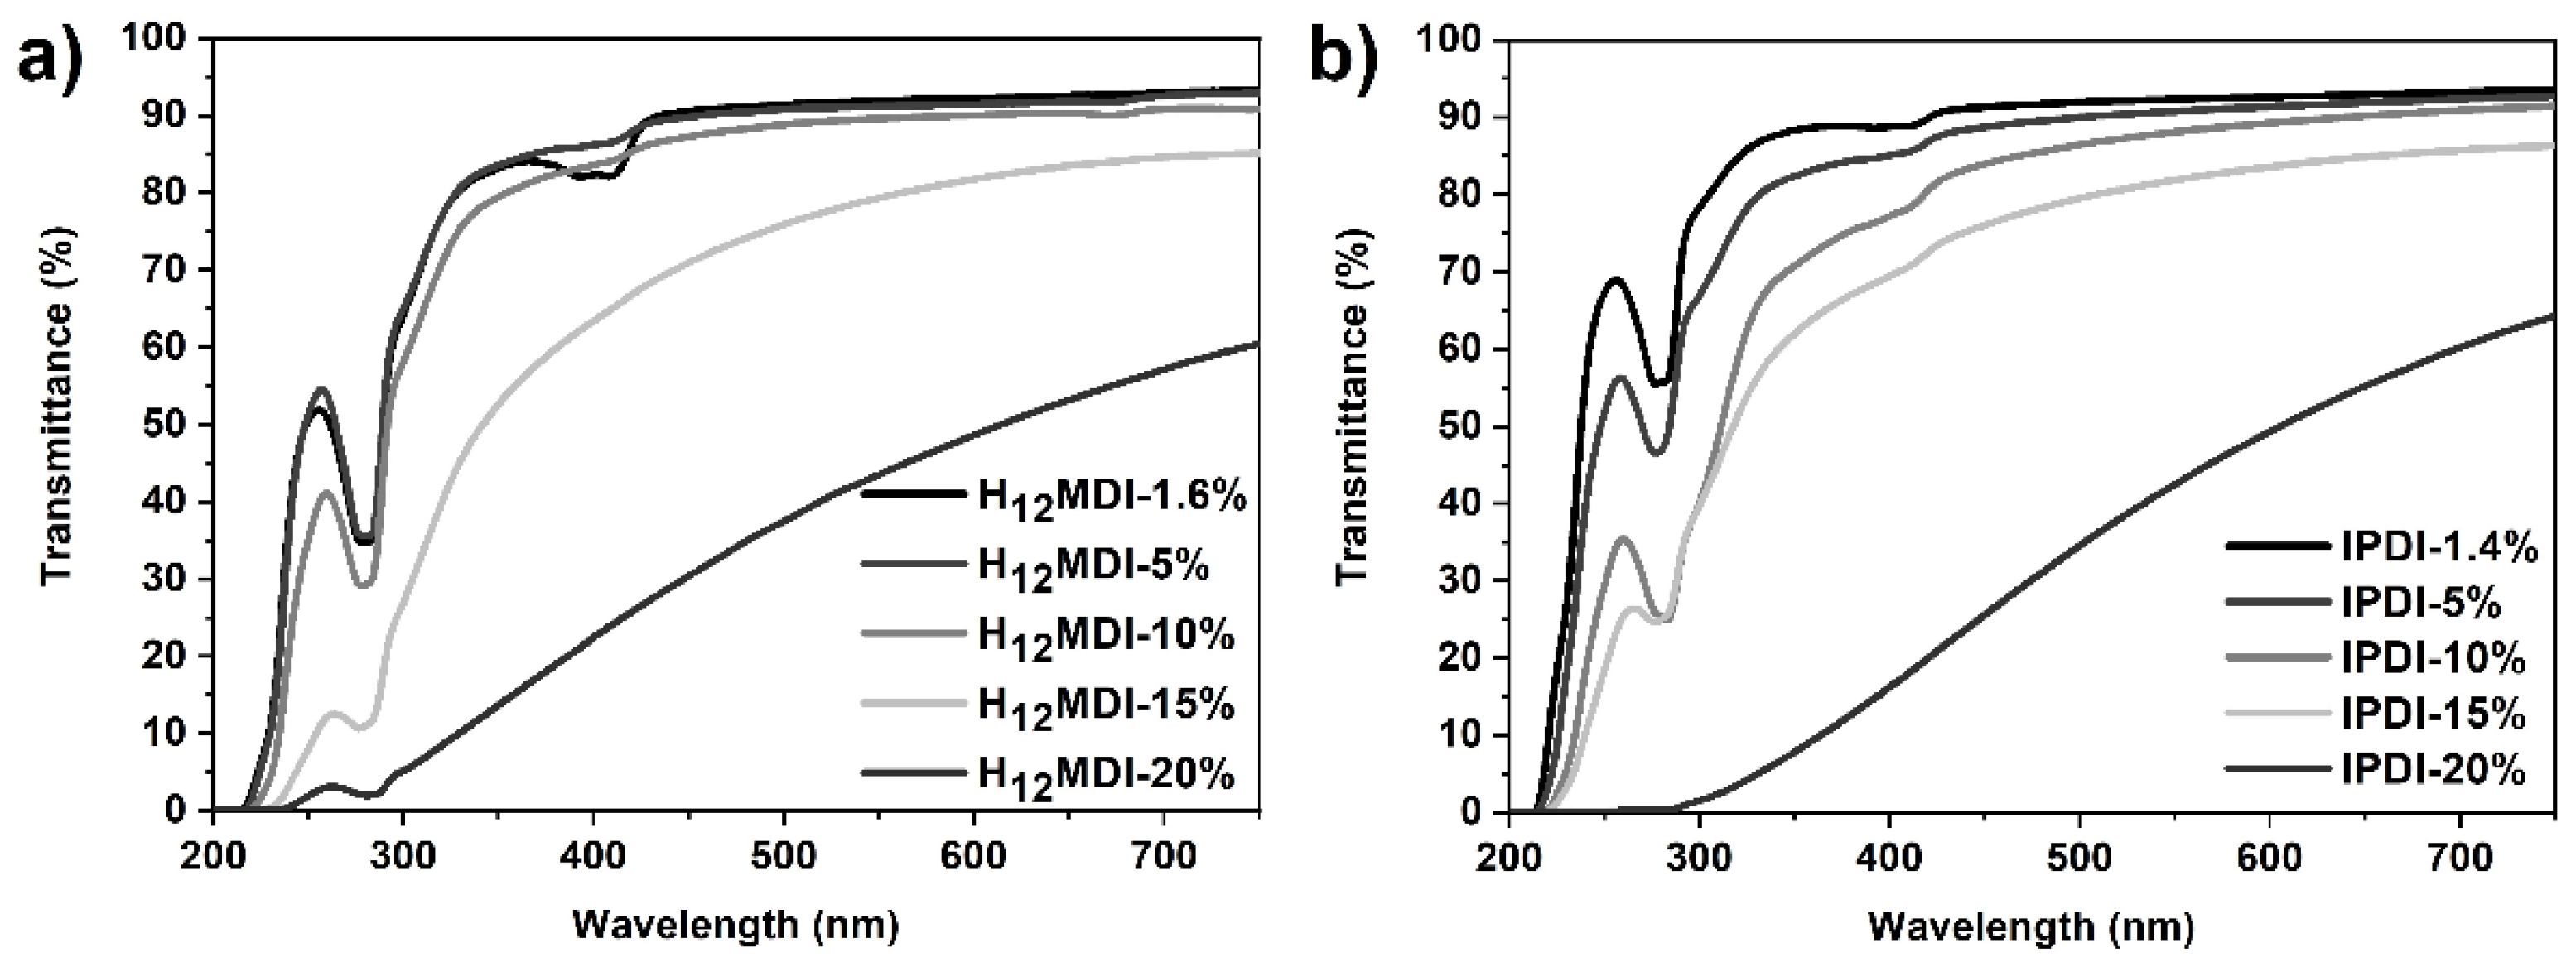
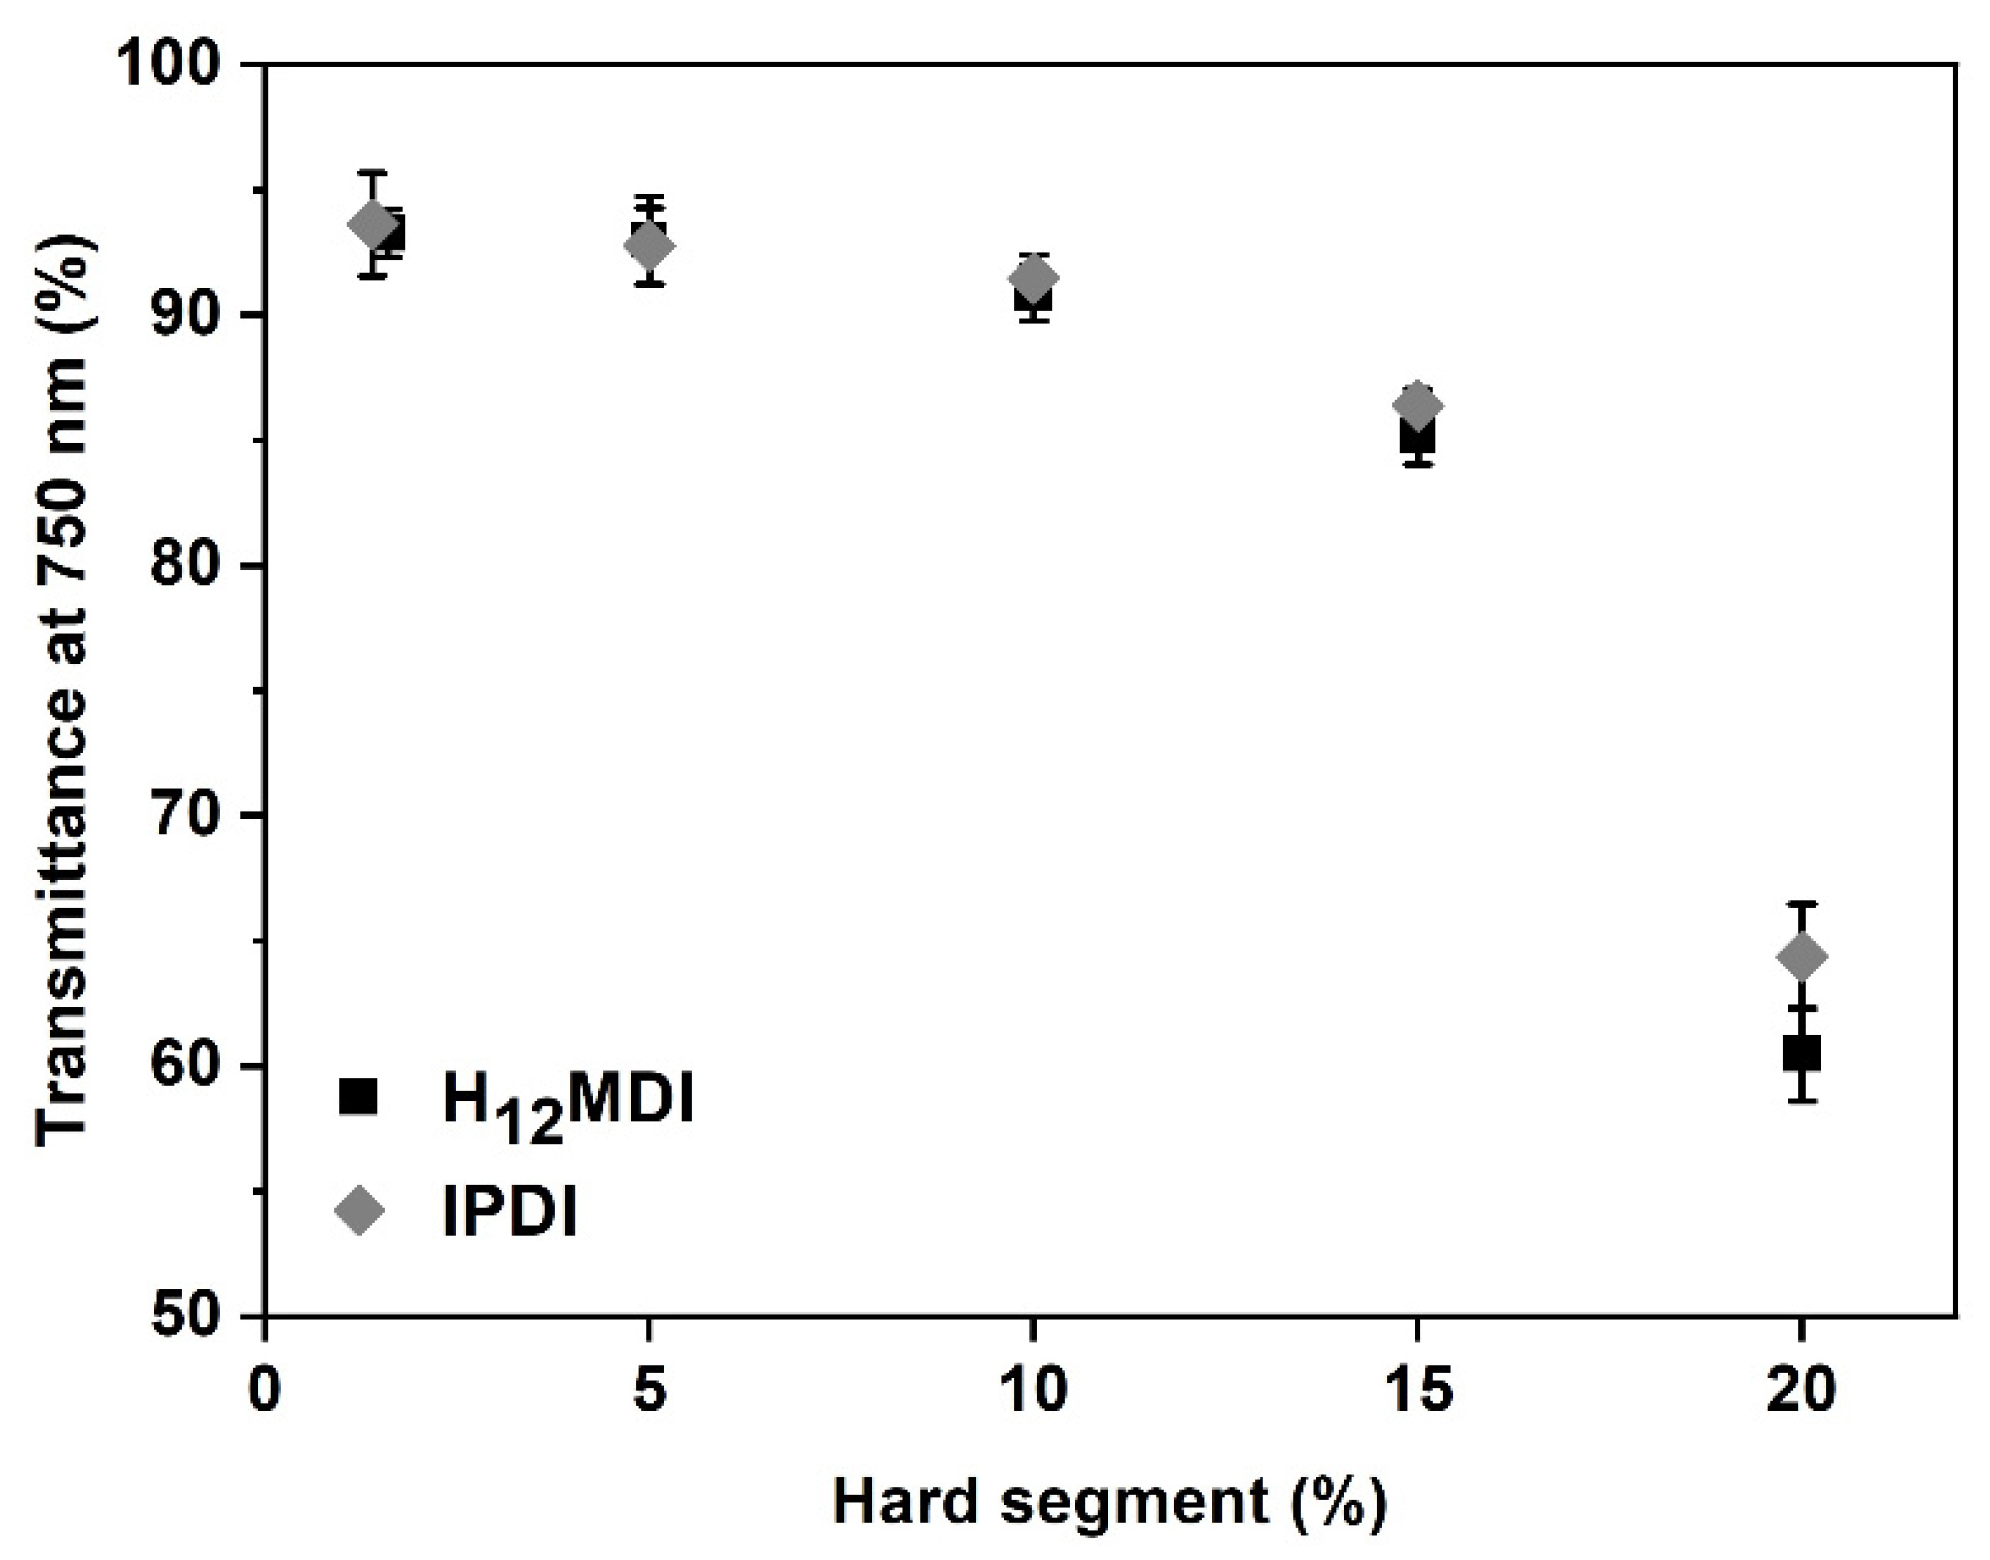
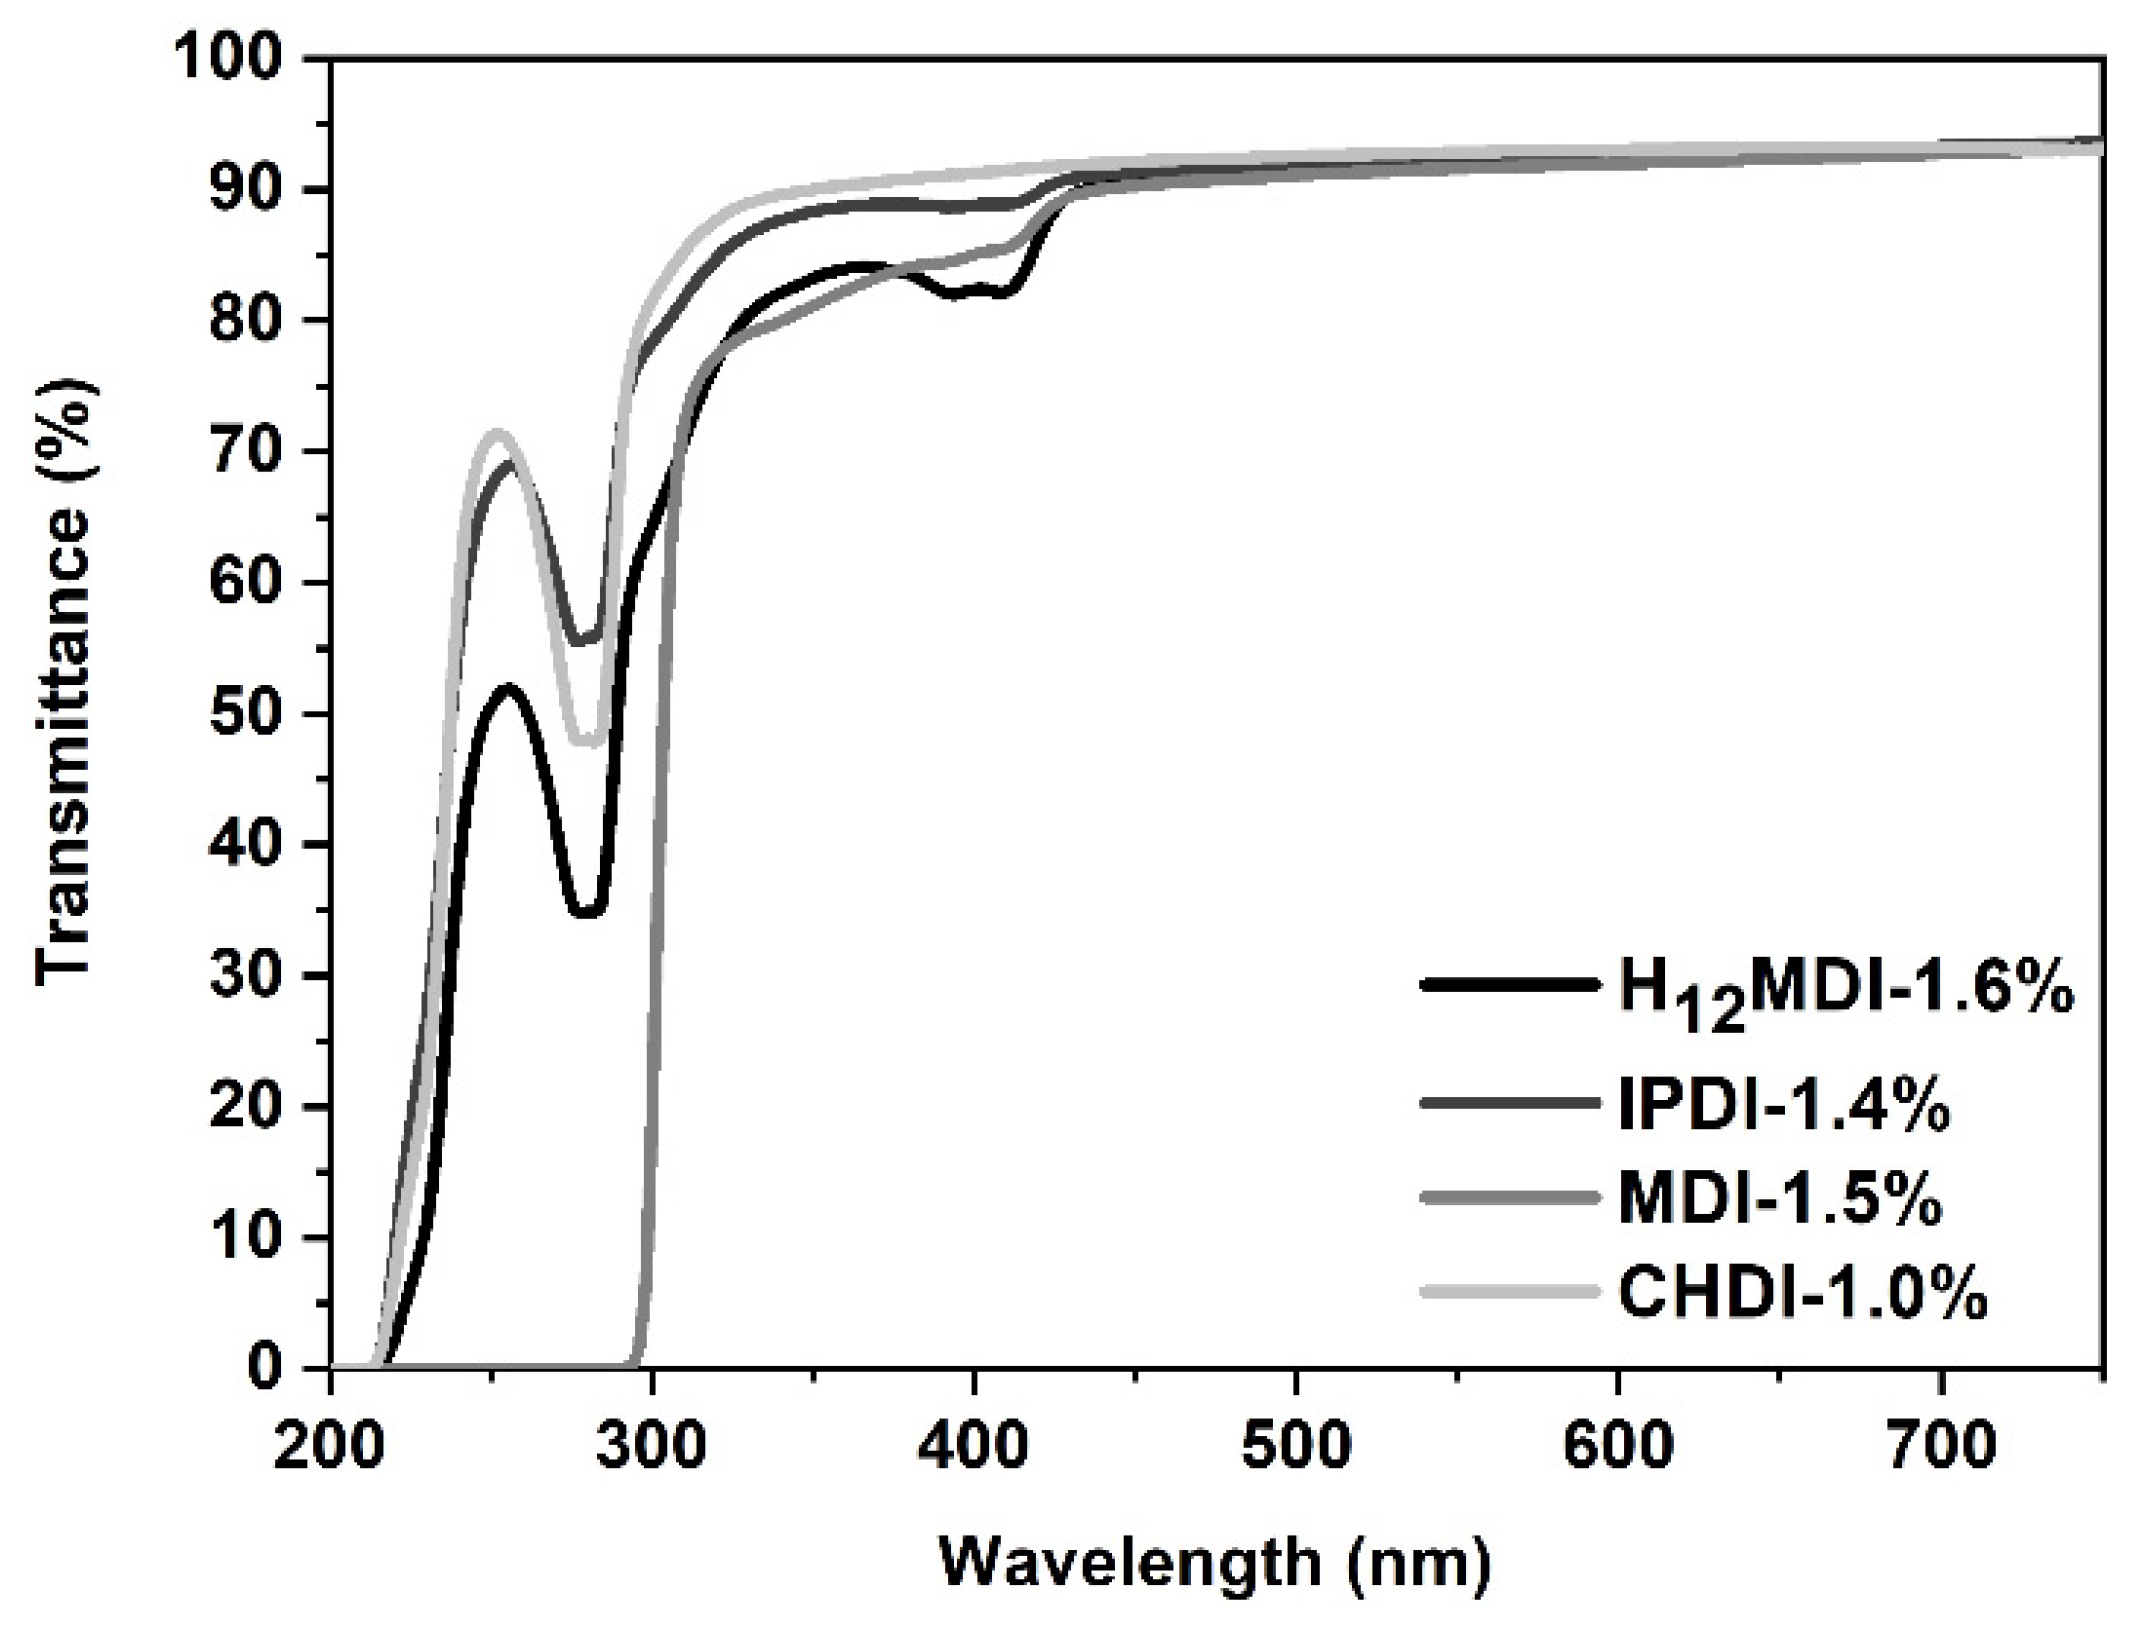
3.2. Transparency of PDMS-Based PUr Elastomer Films
3.3. Mechanical Properties
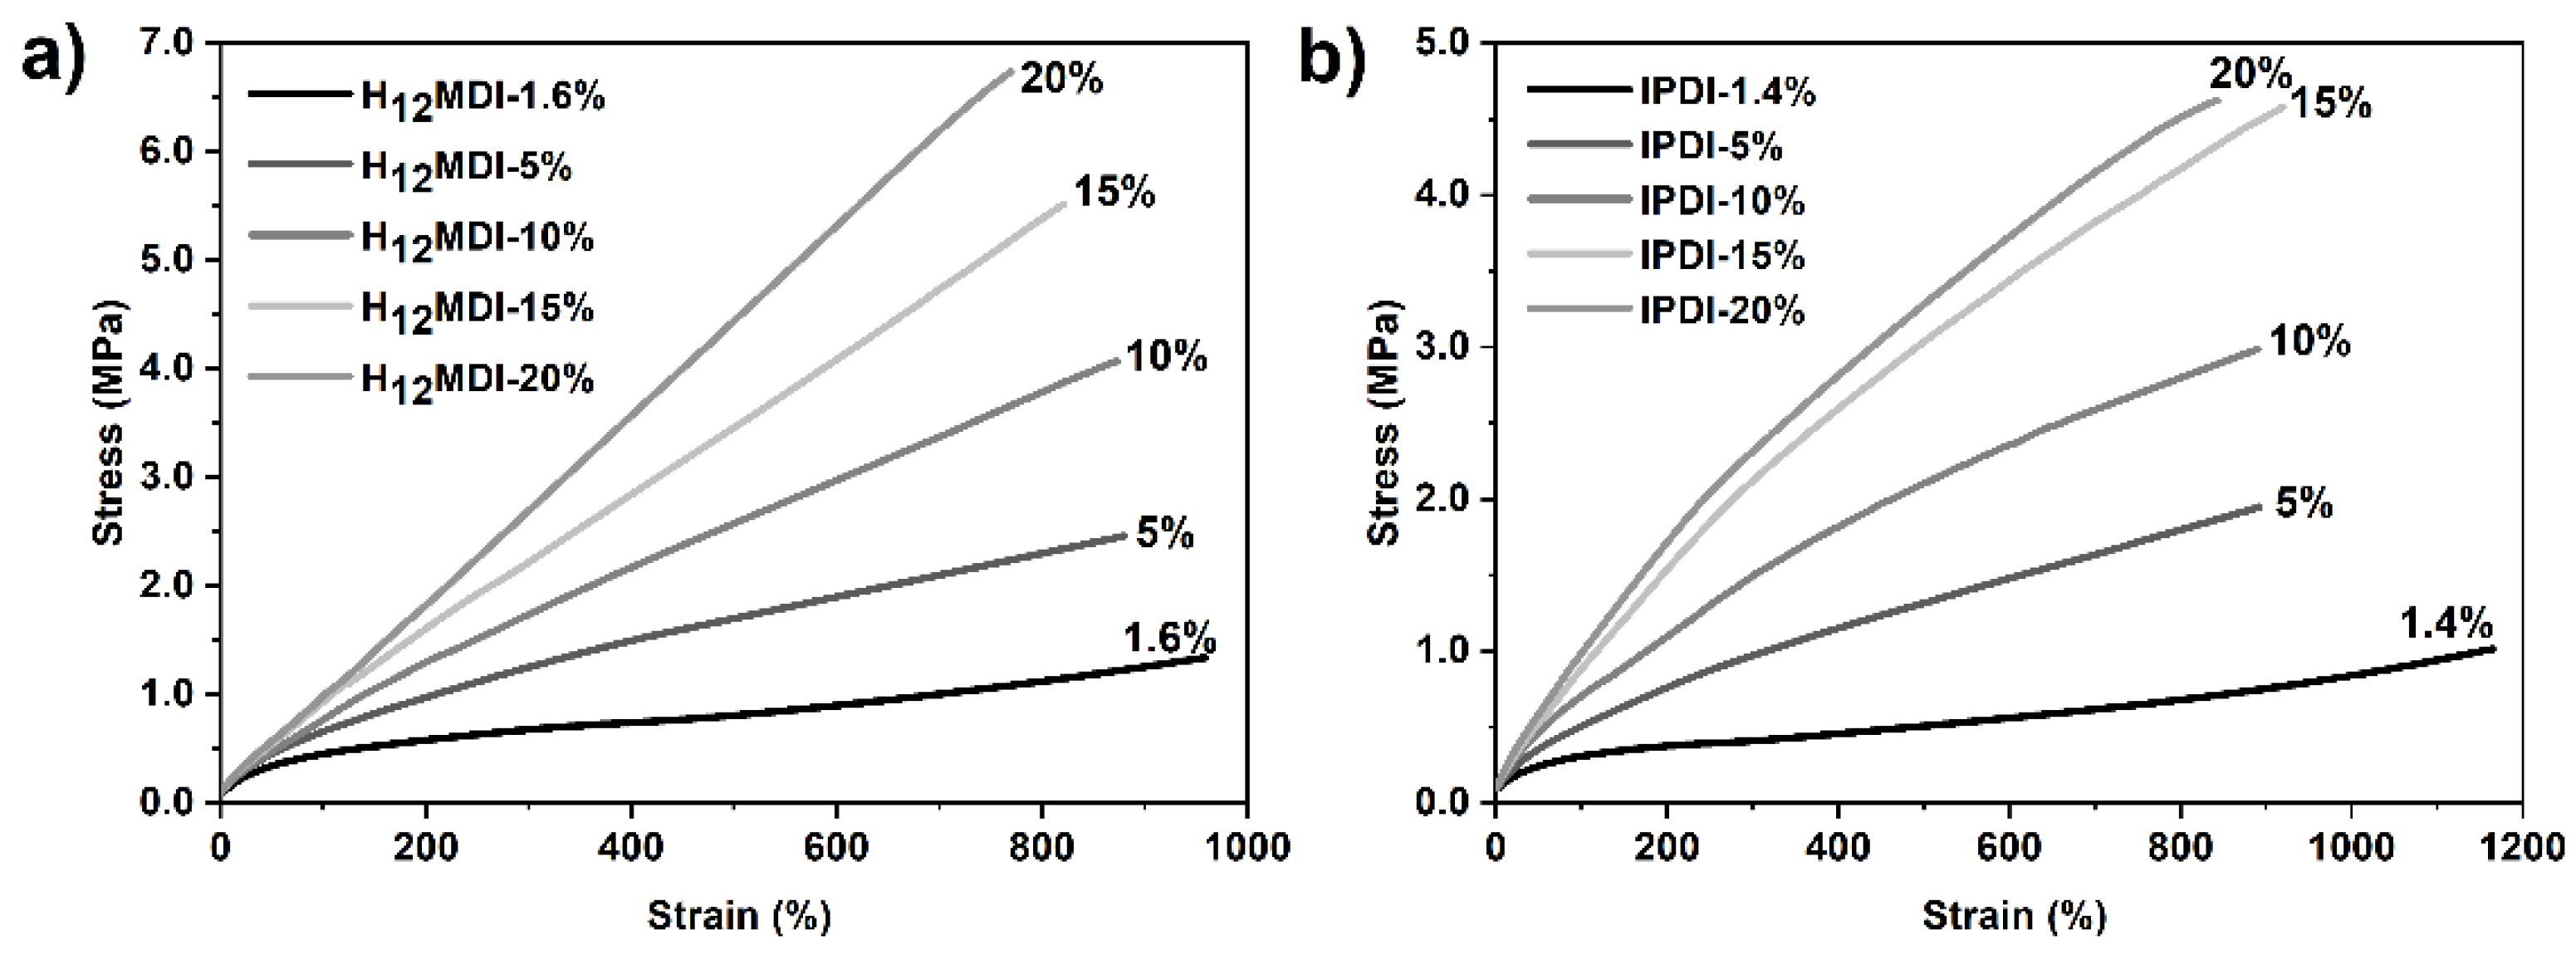
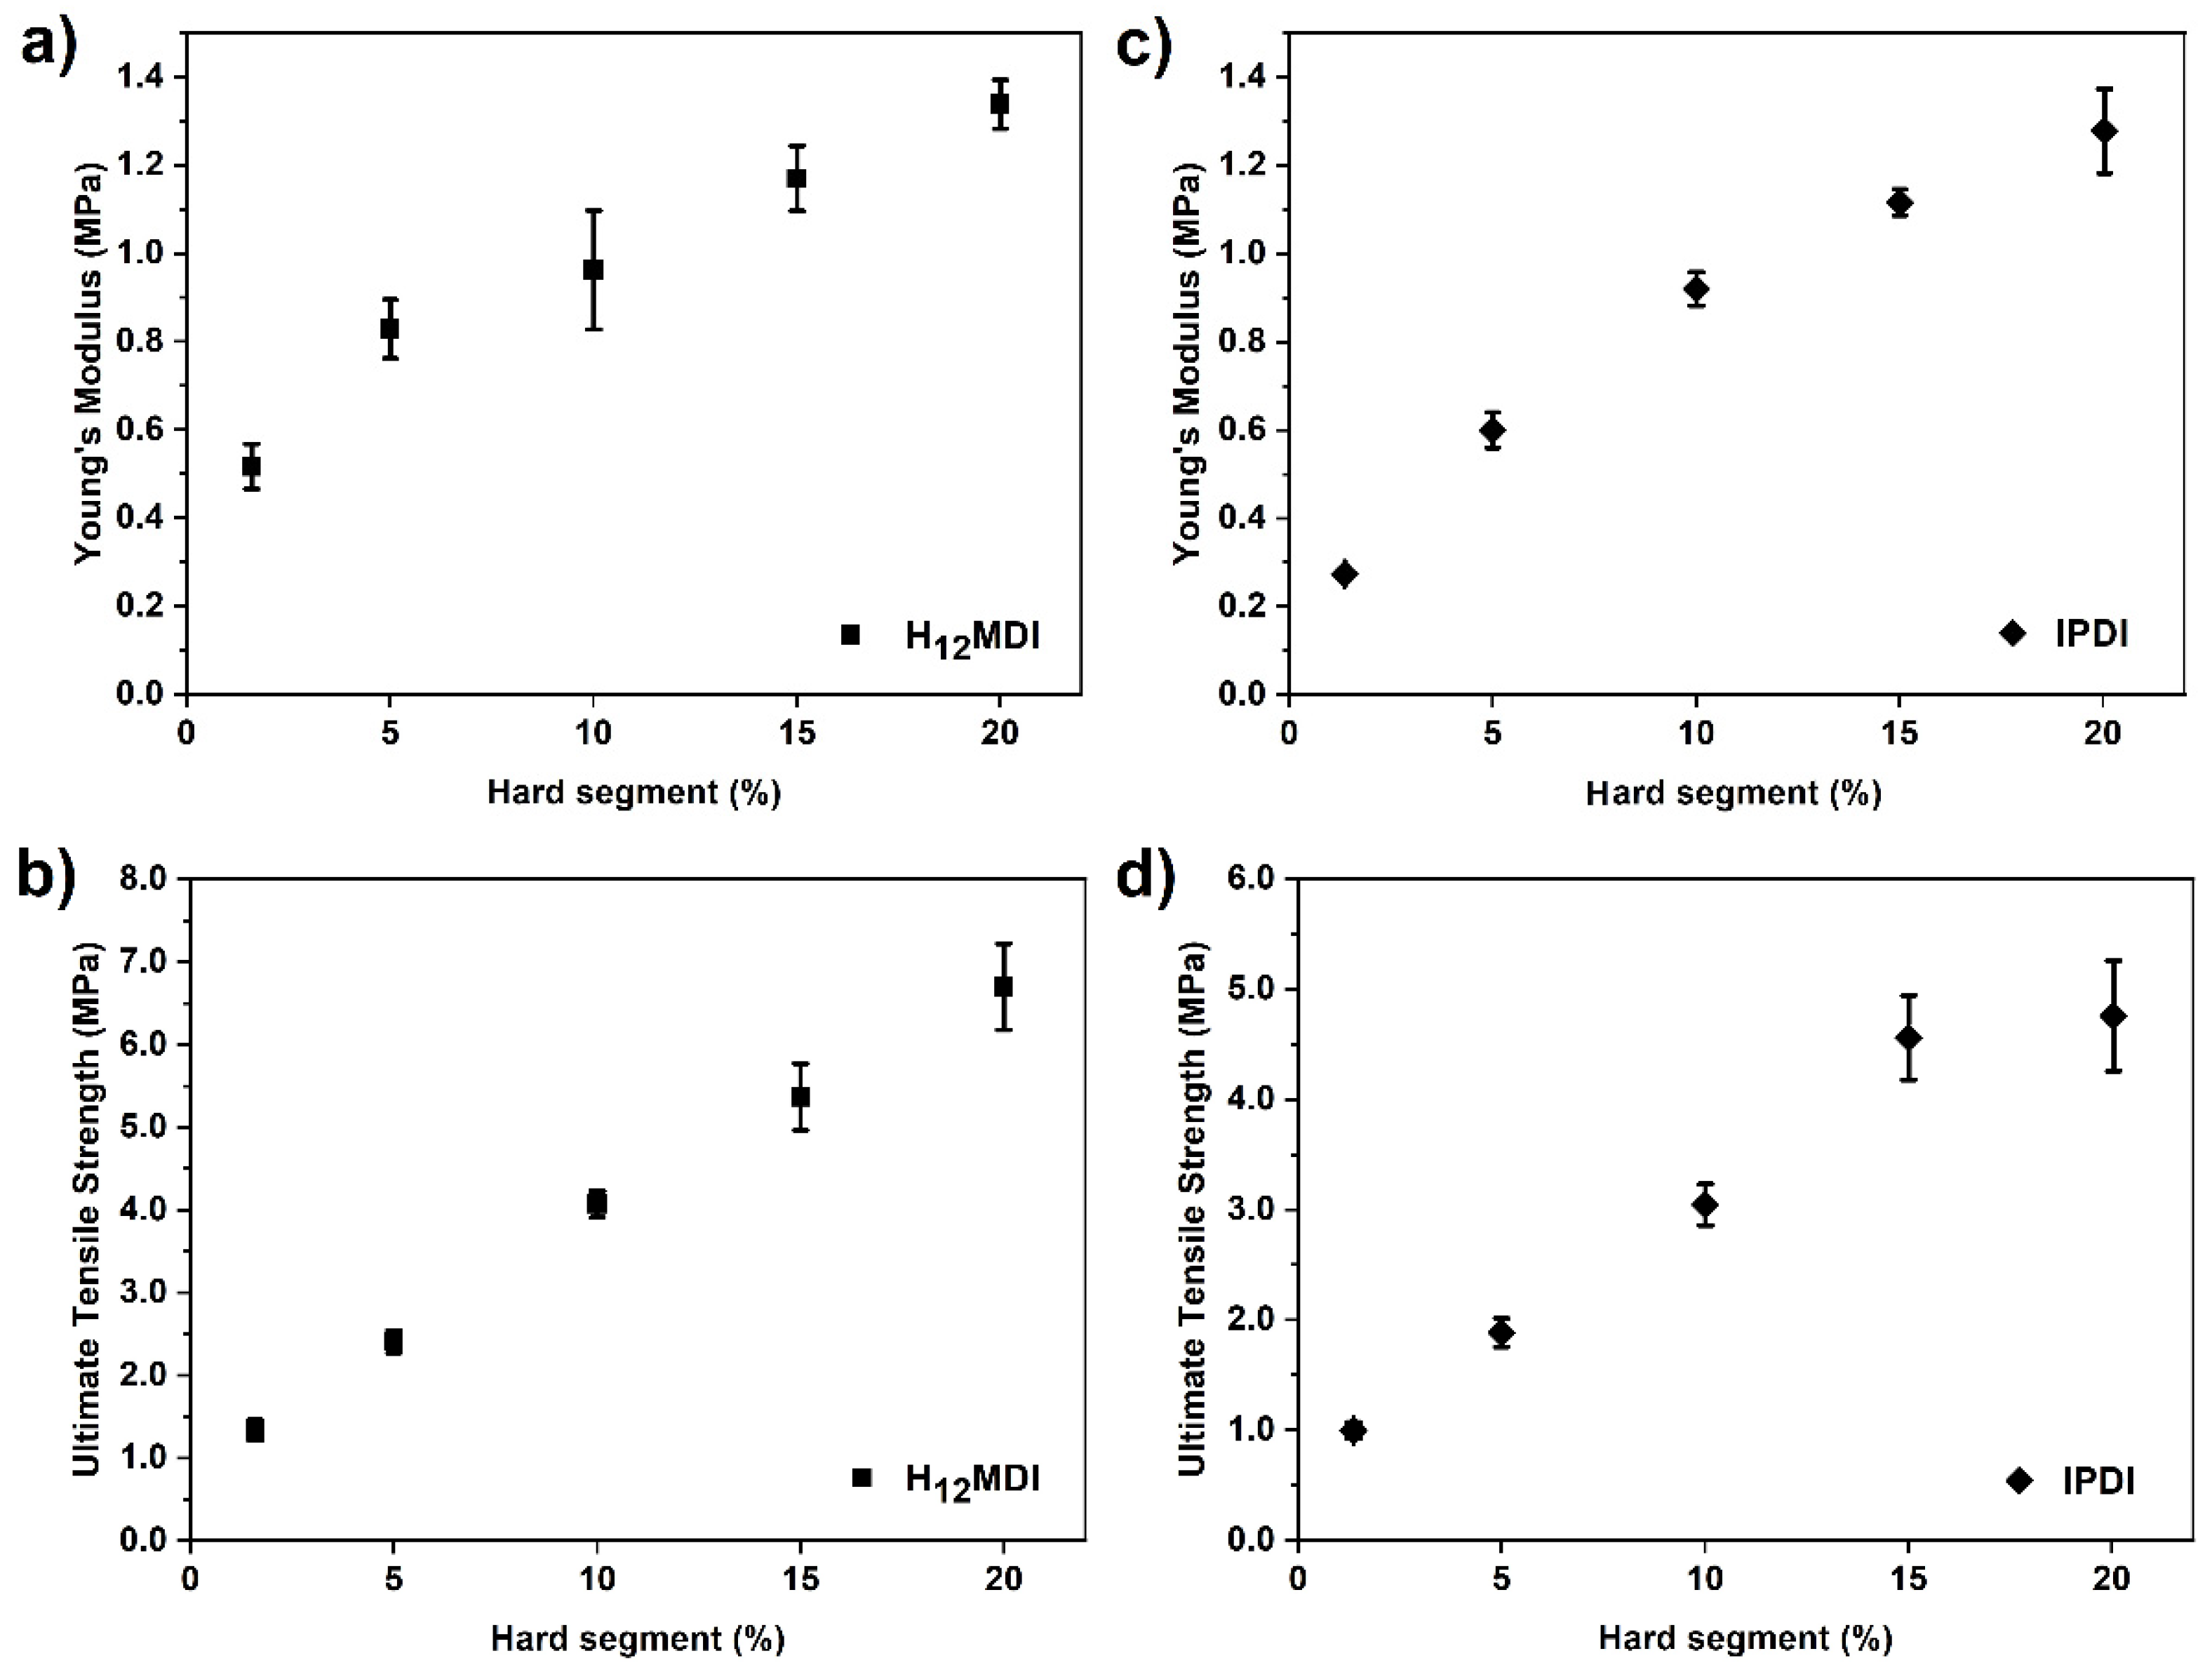
3.3.1. Influence of HS Content on the Mechanical Properties of PDMS-Based PUr Elastomers
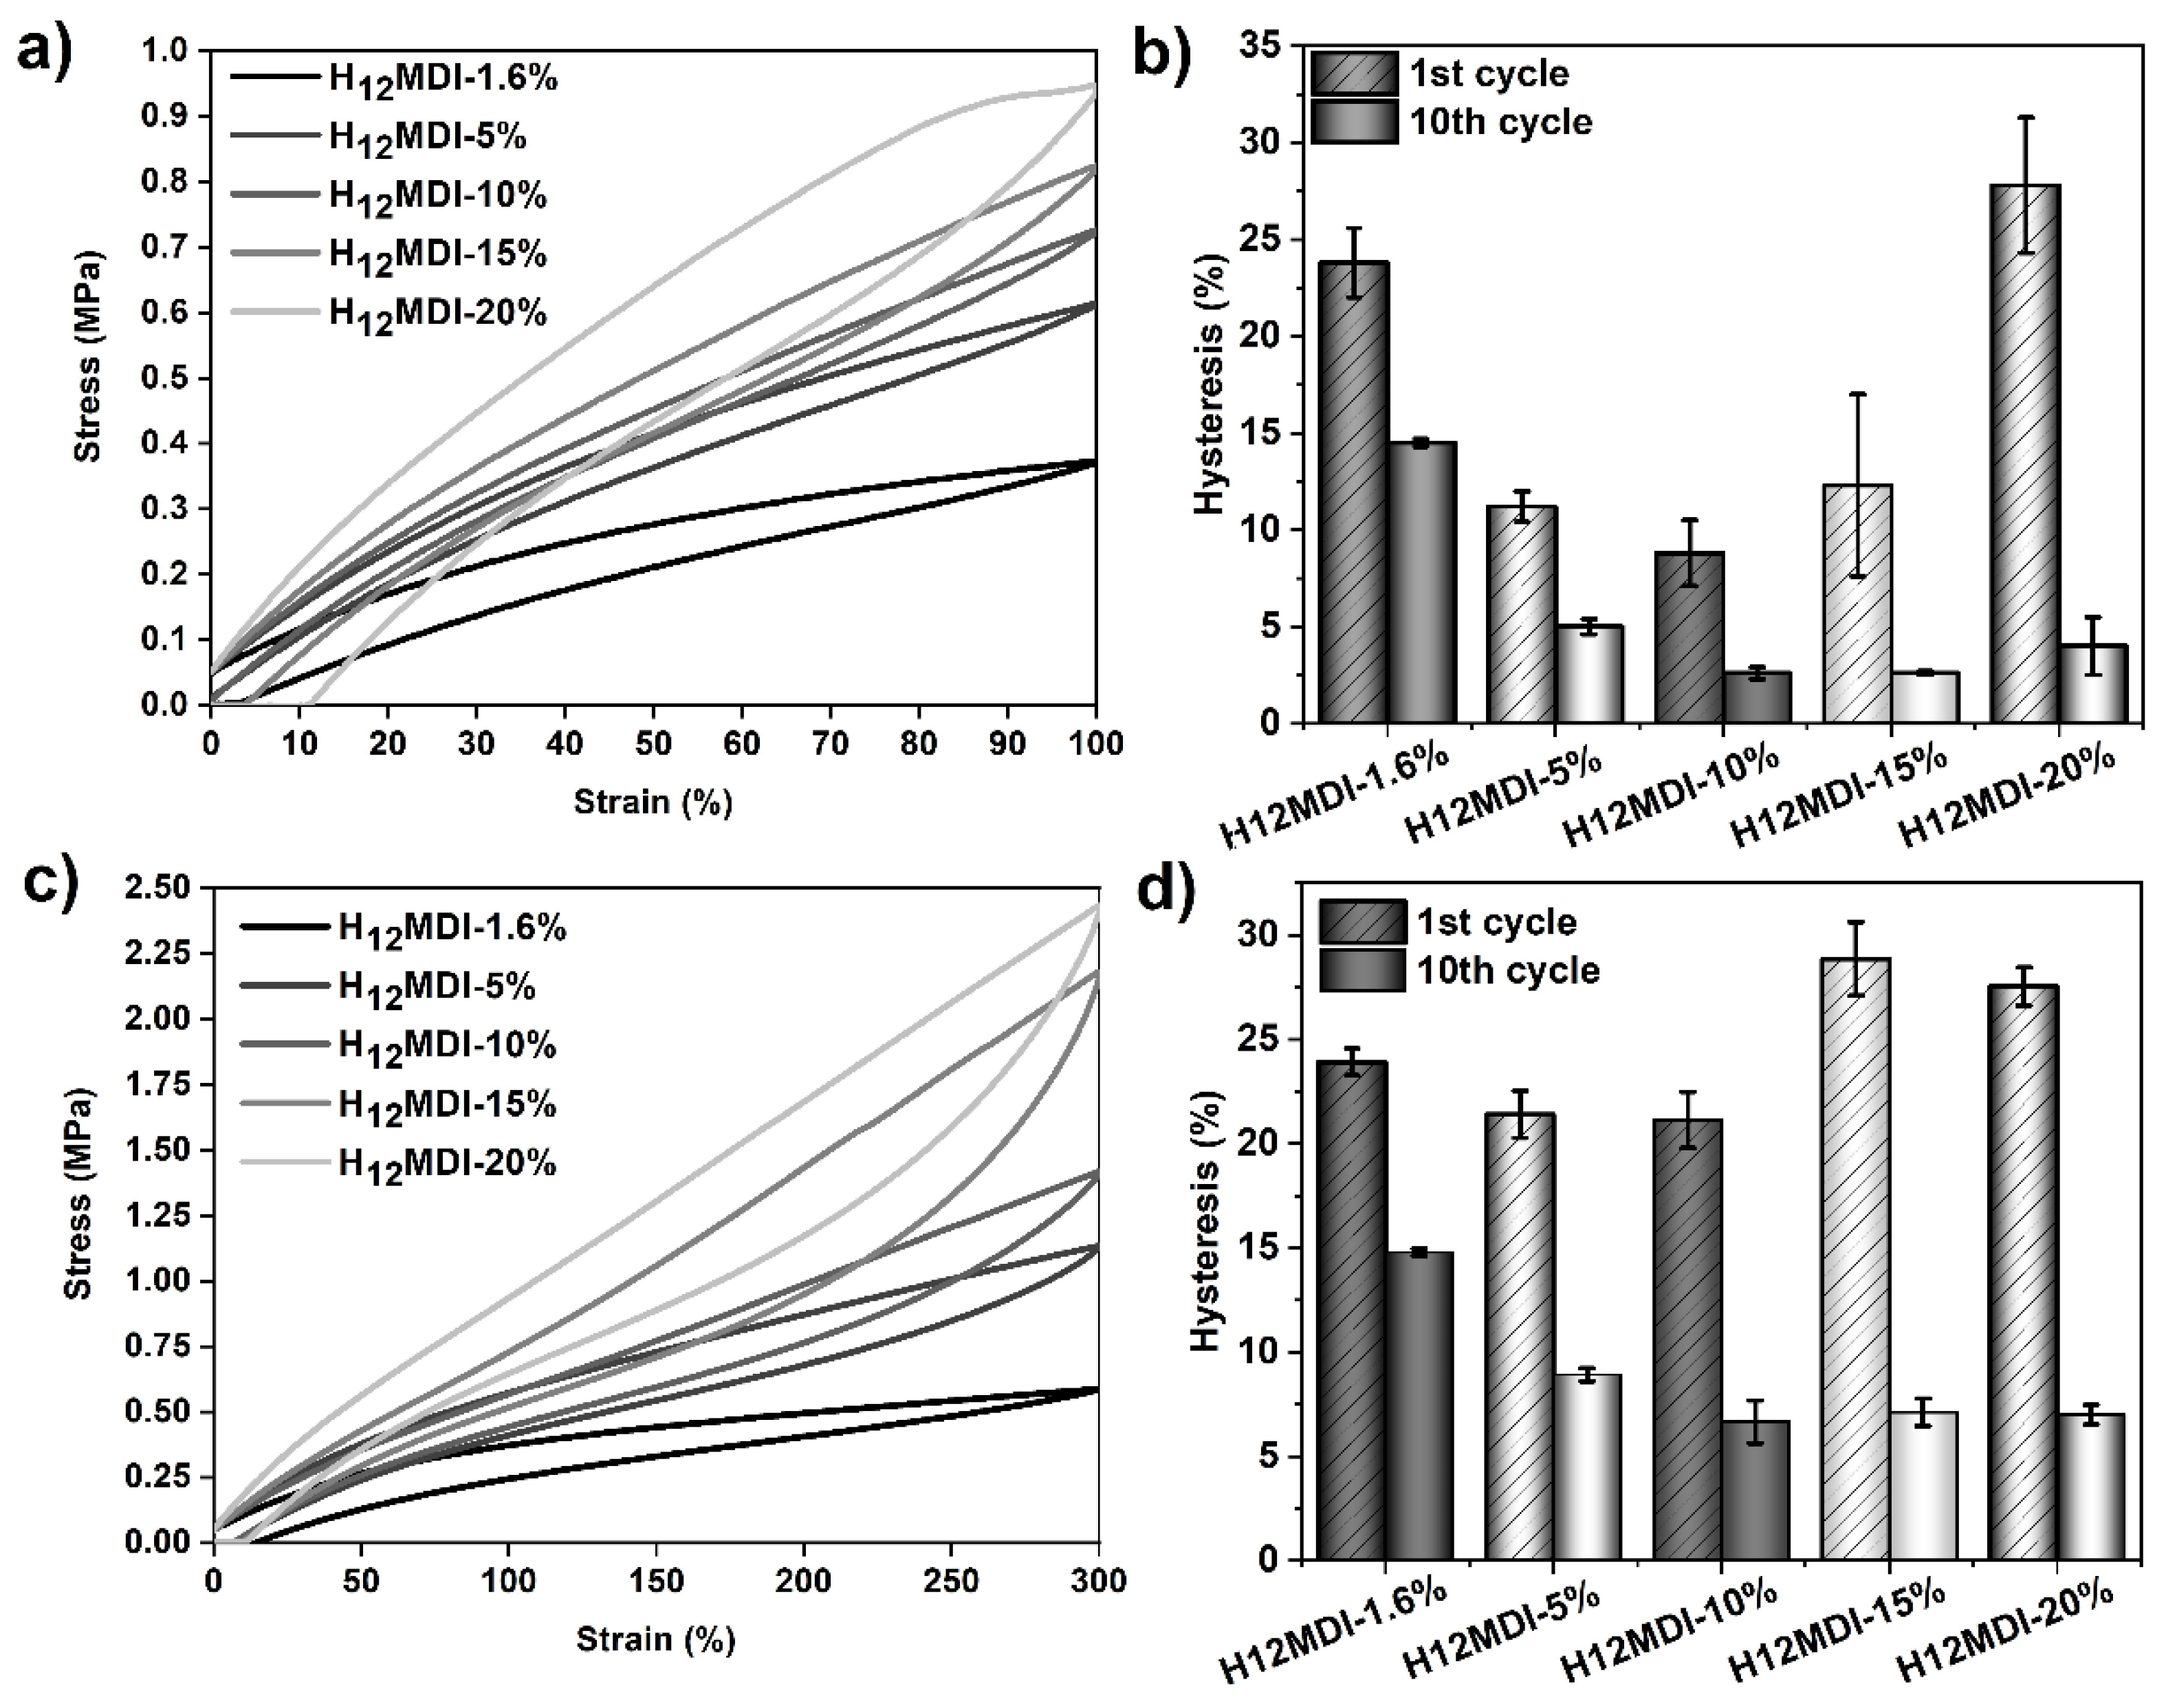
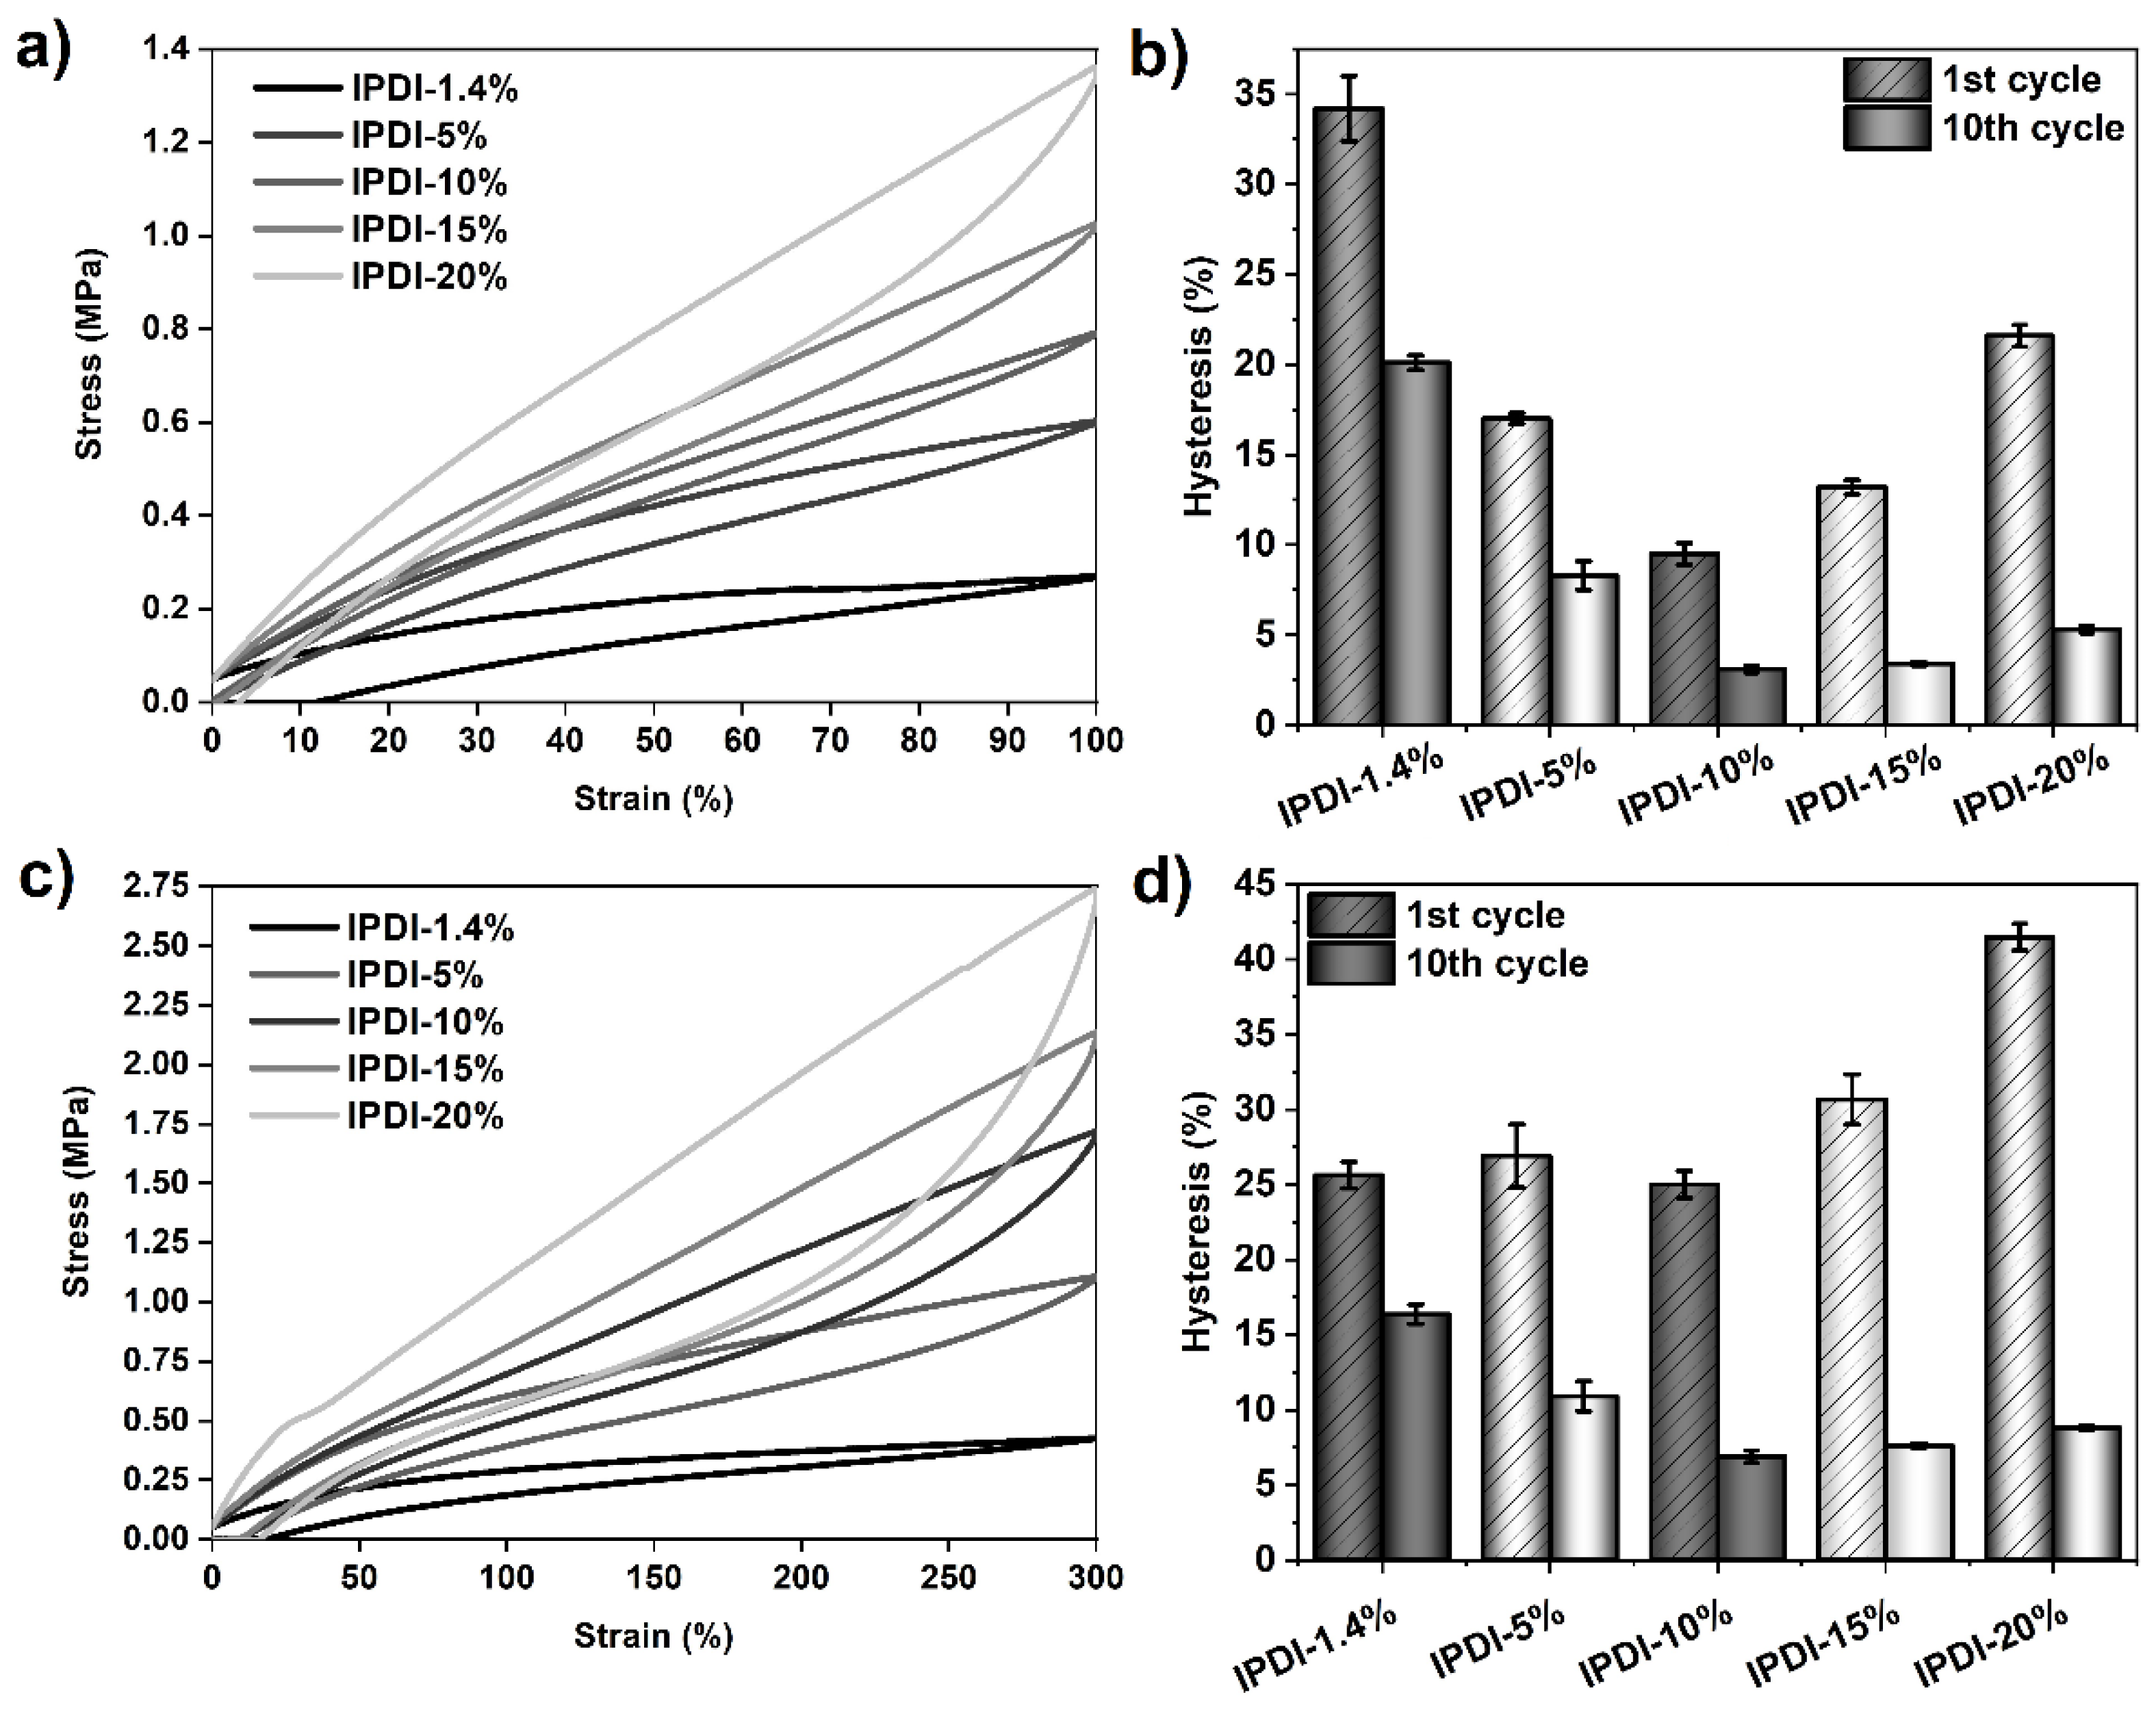
3.3.2. Influence of HS Content on Mechanical Hysteresis Behavior in PDMS-Based PUr Elastomers
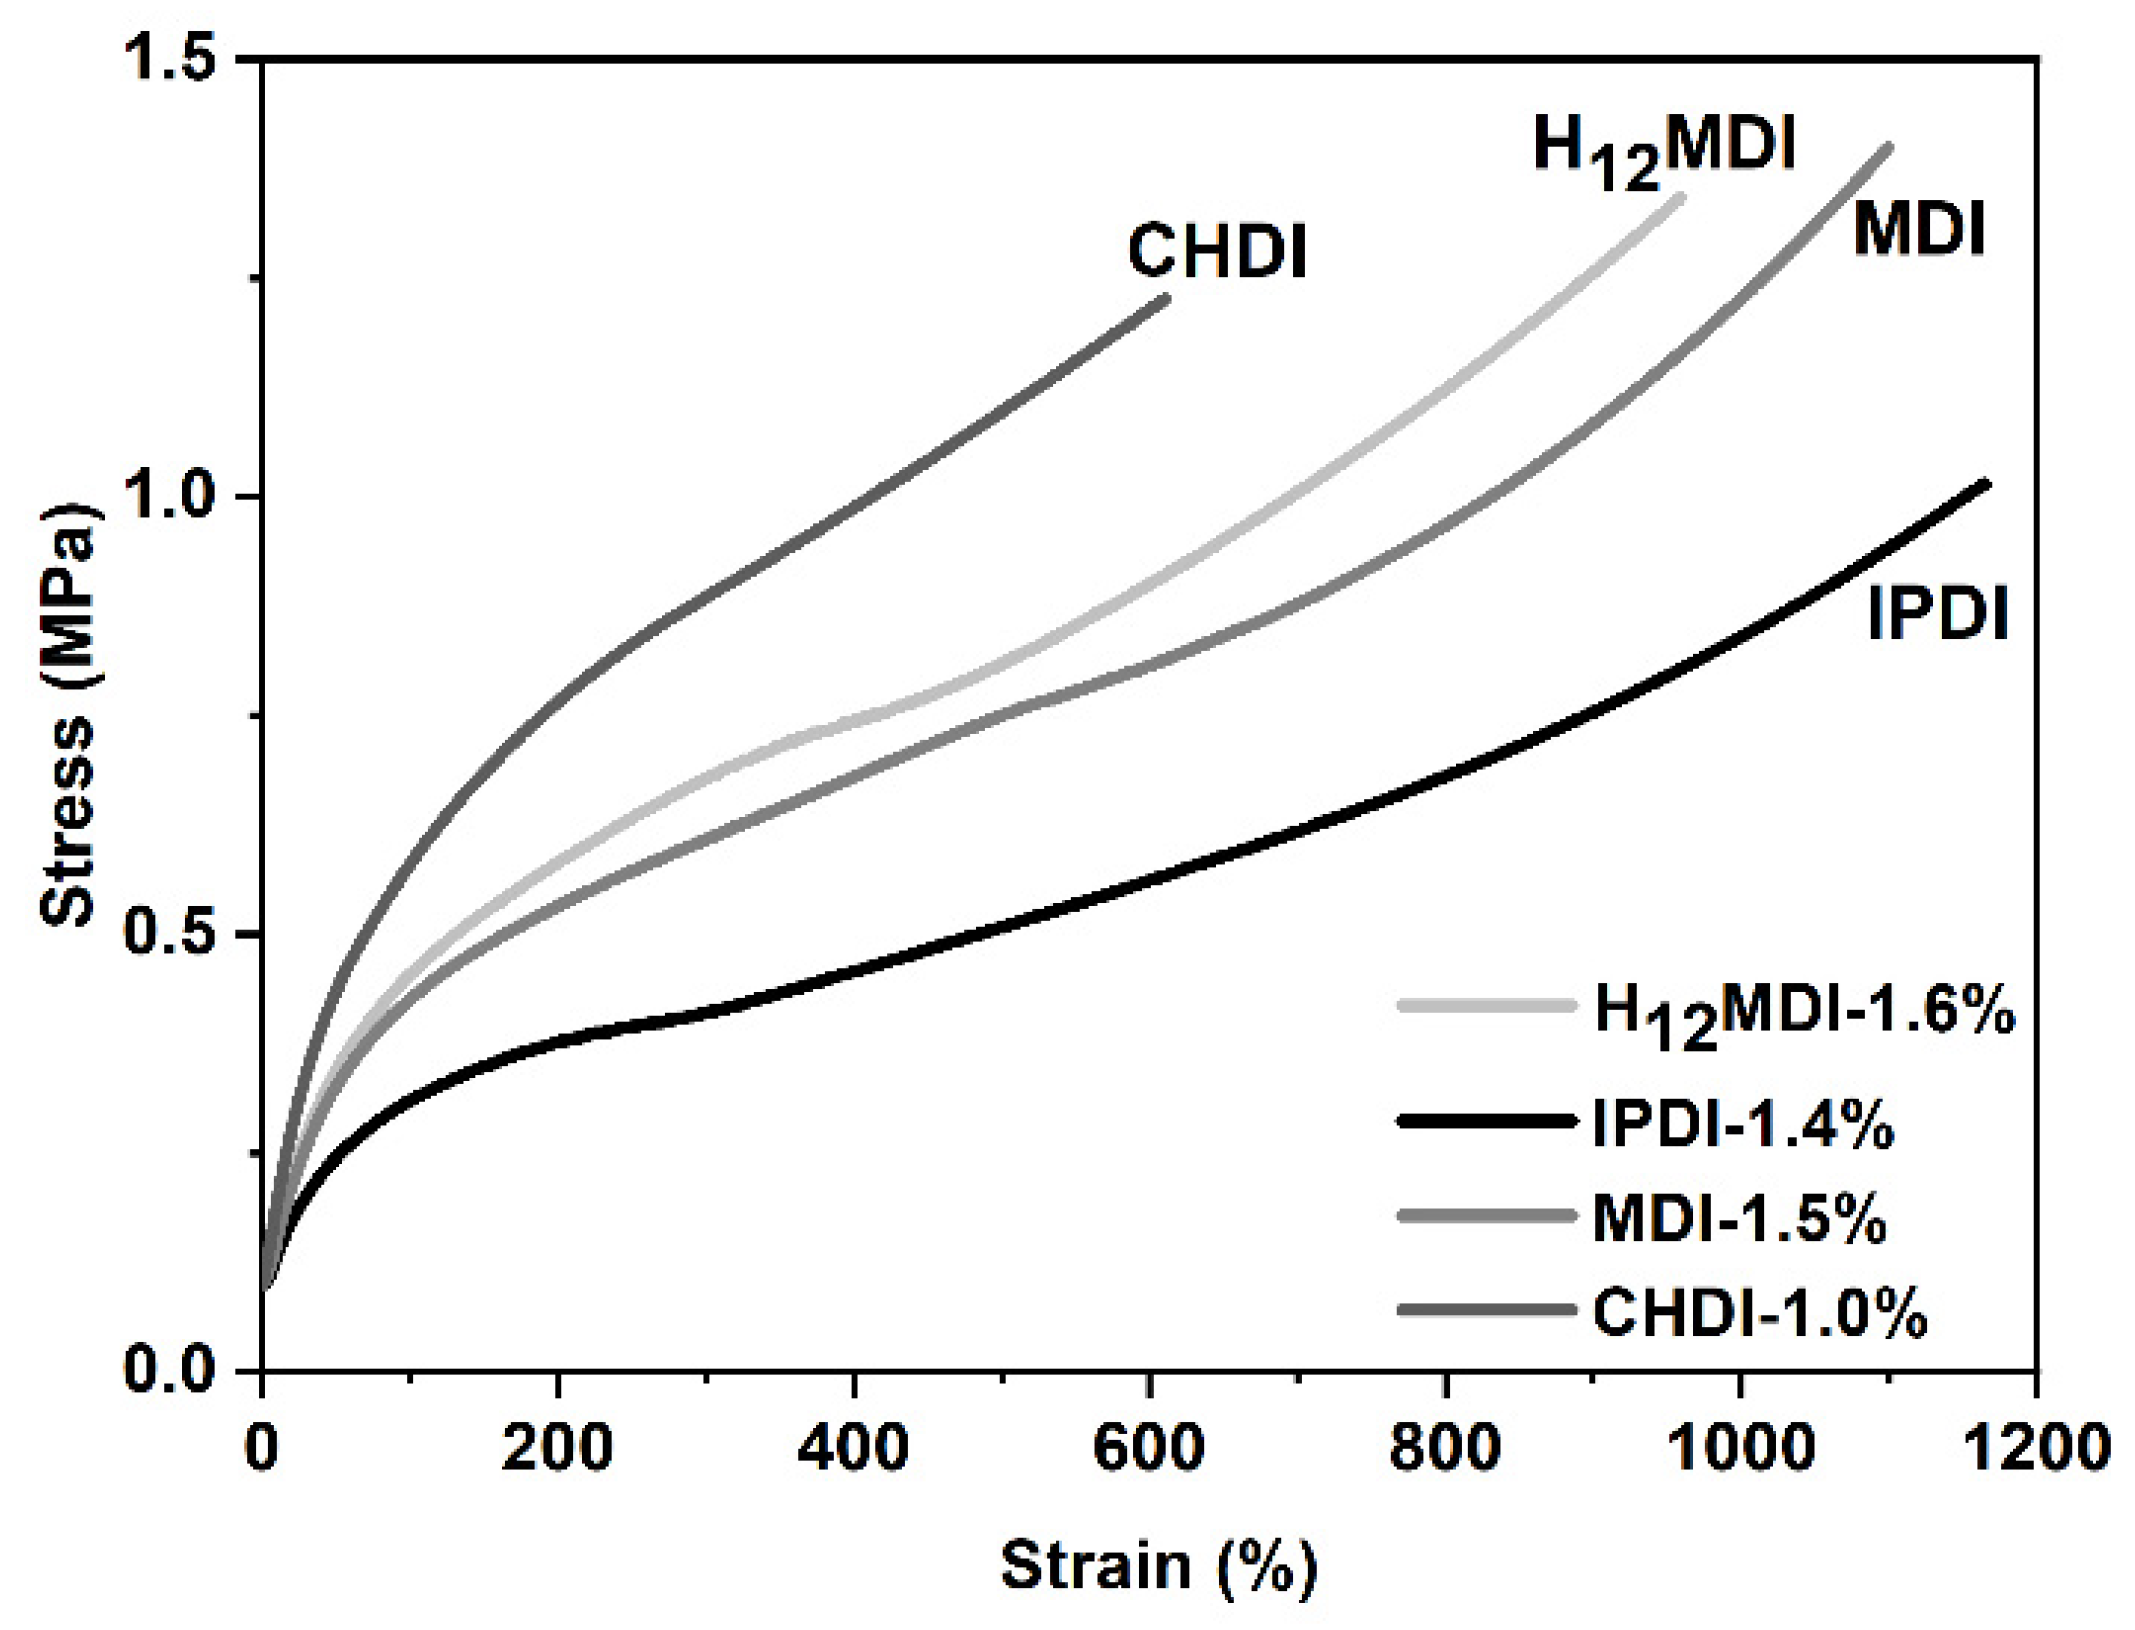
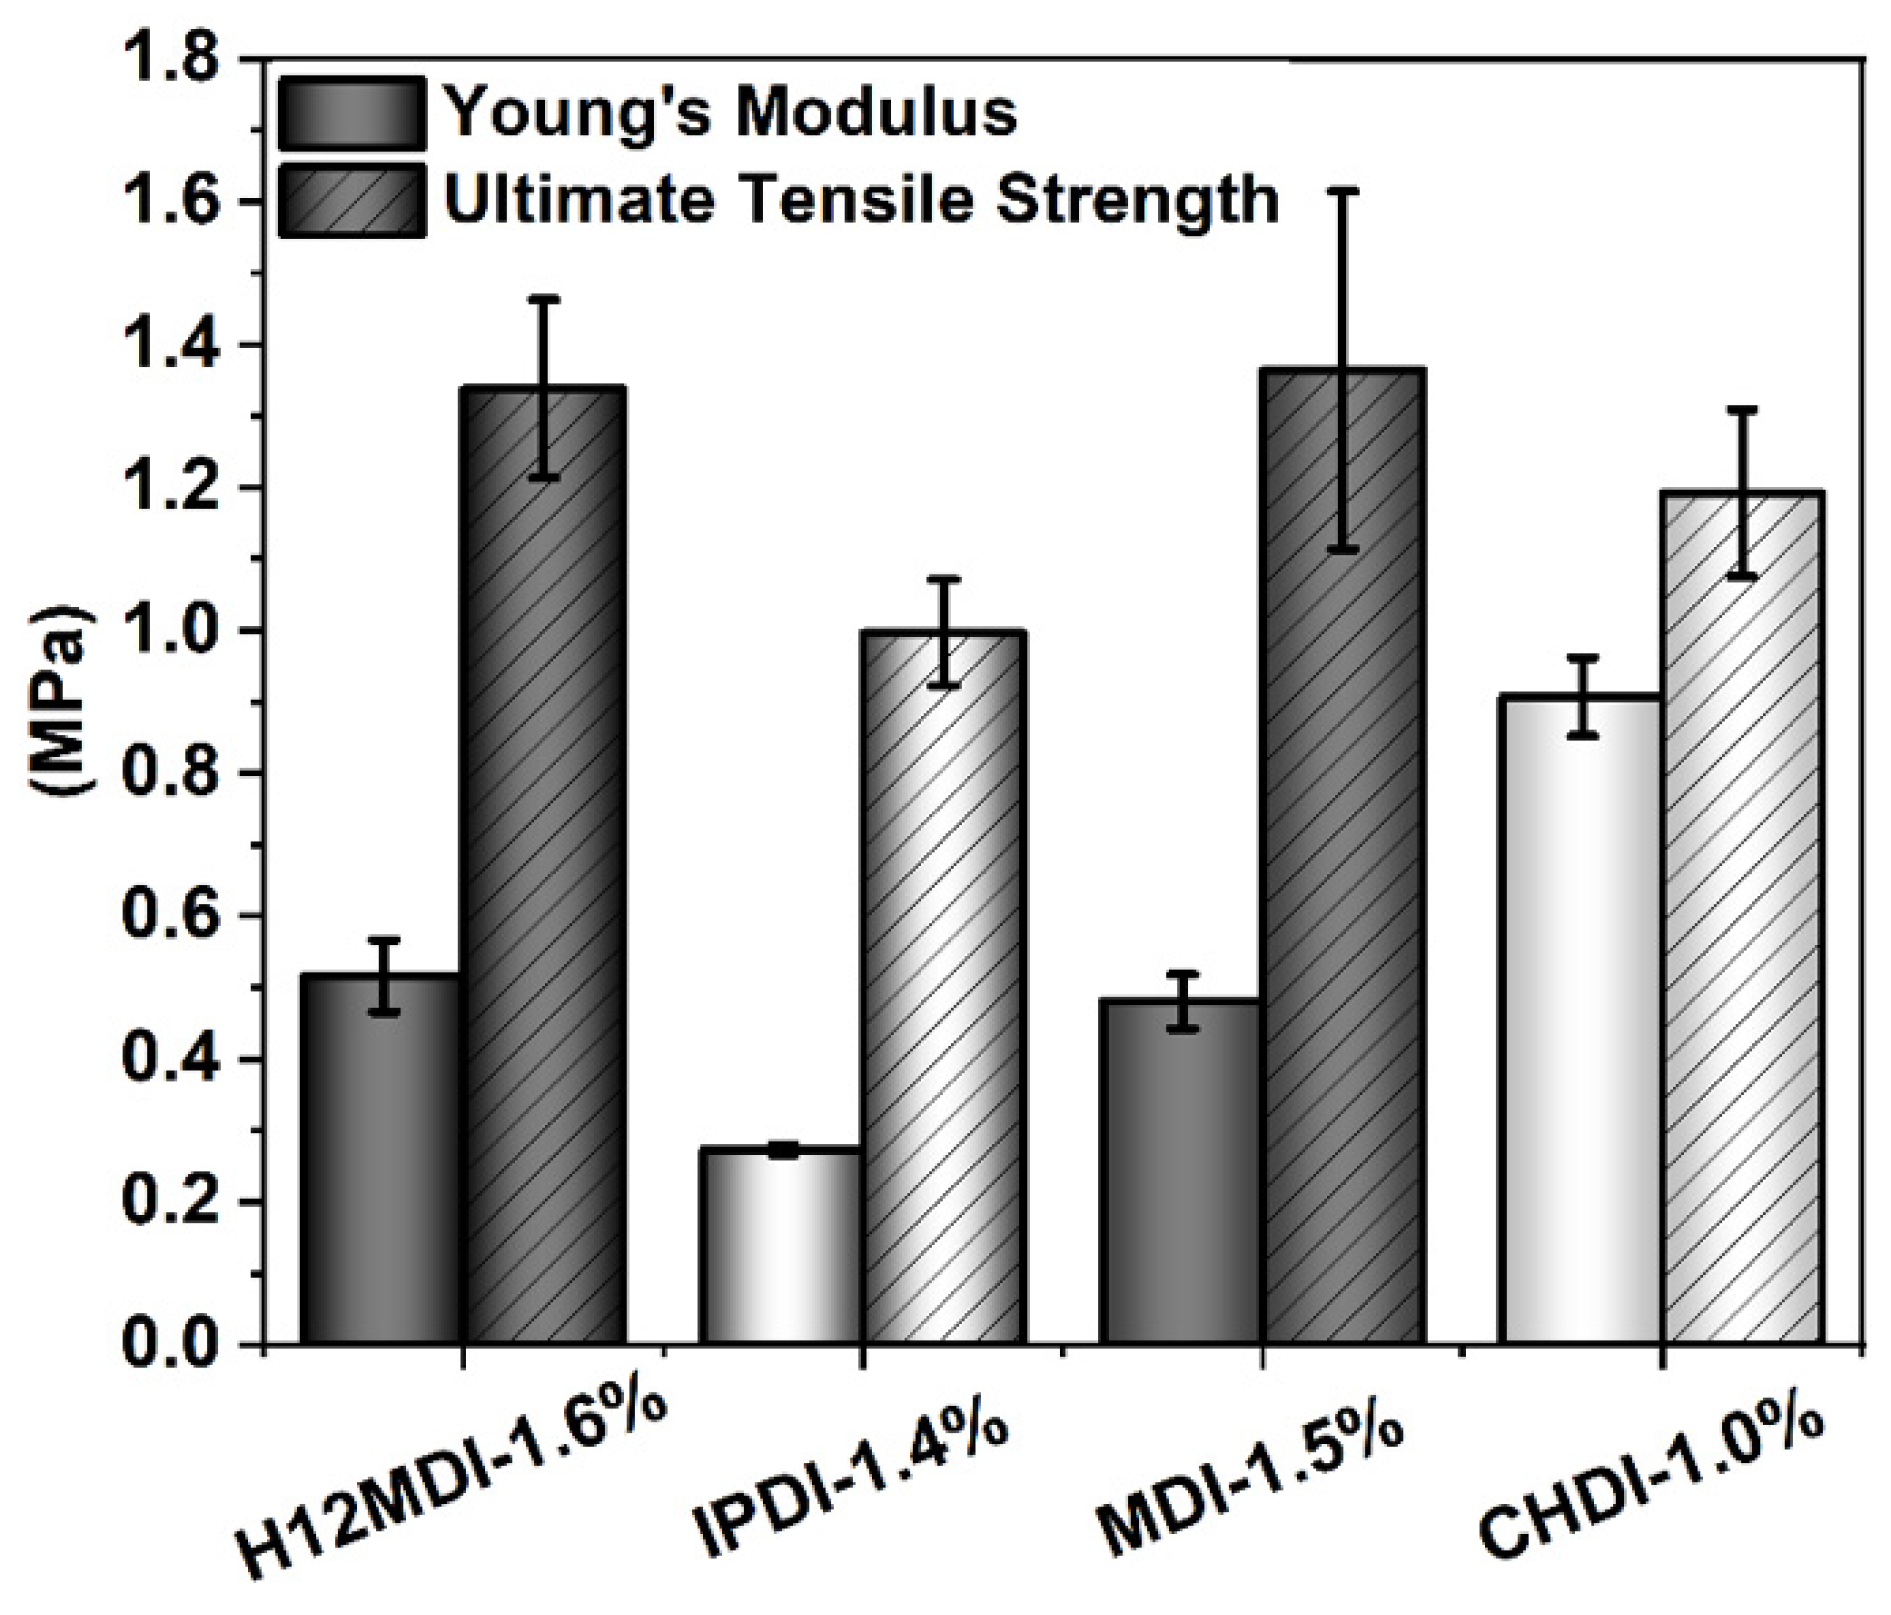
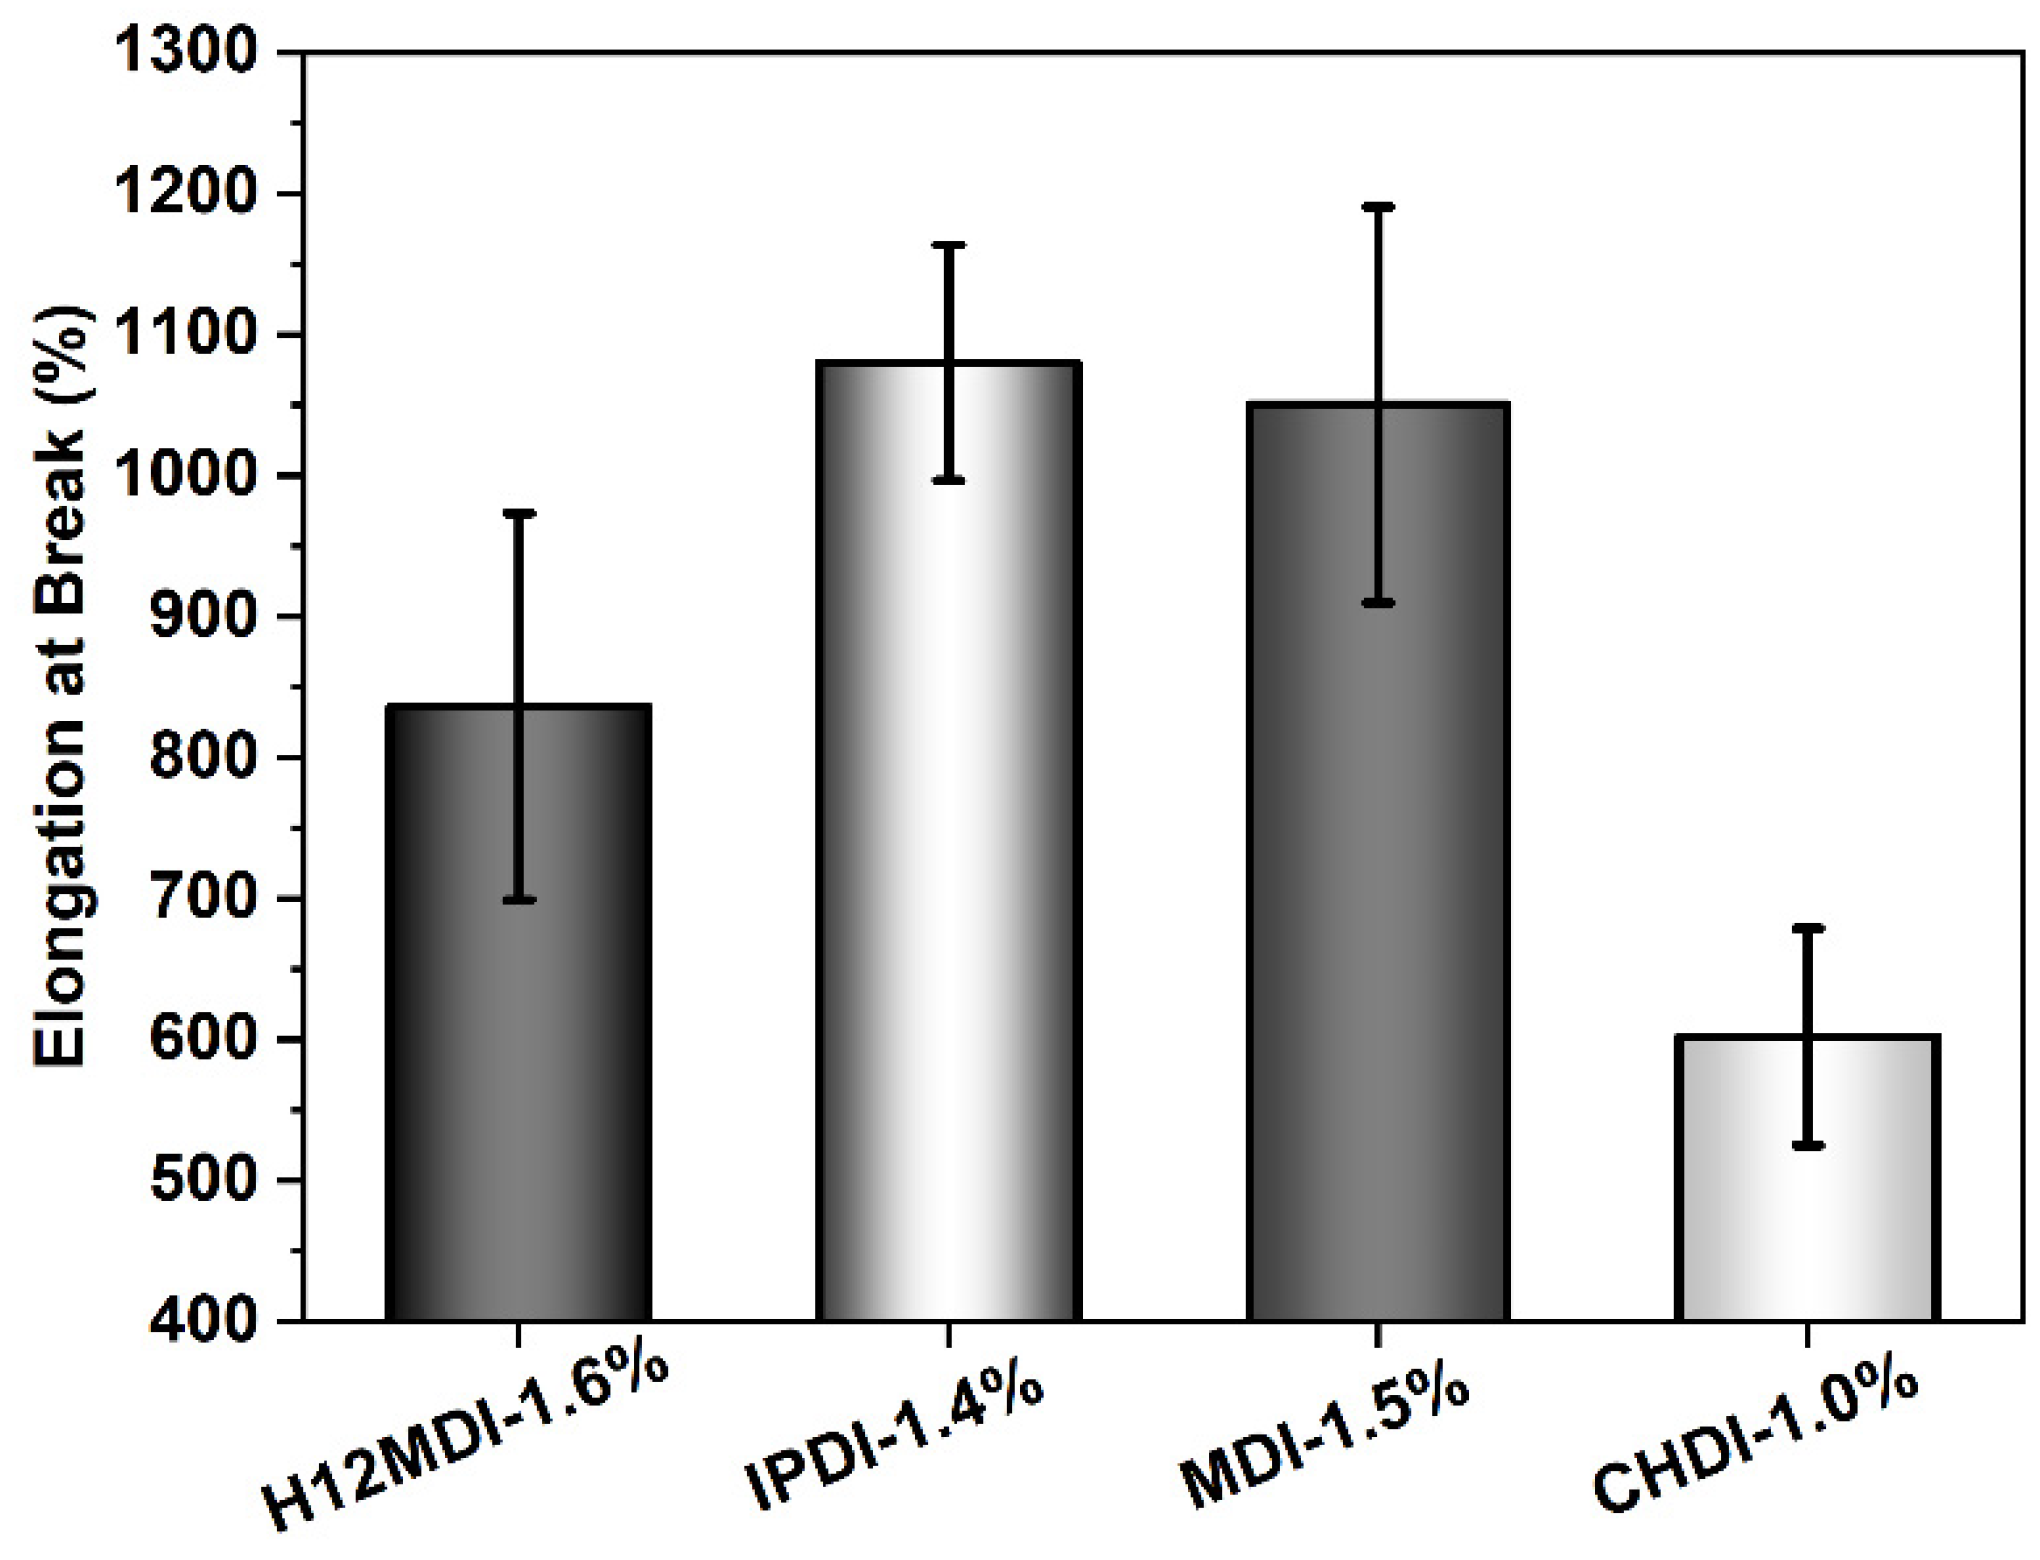
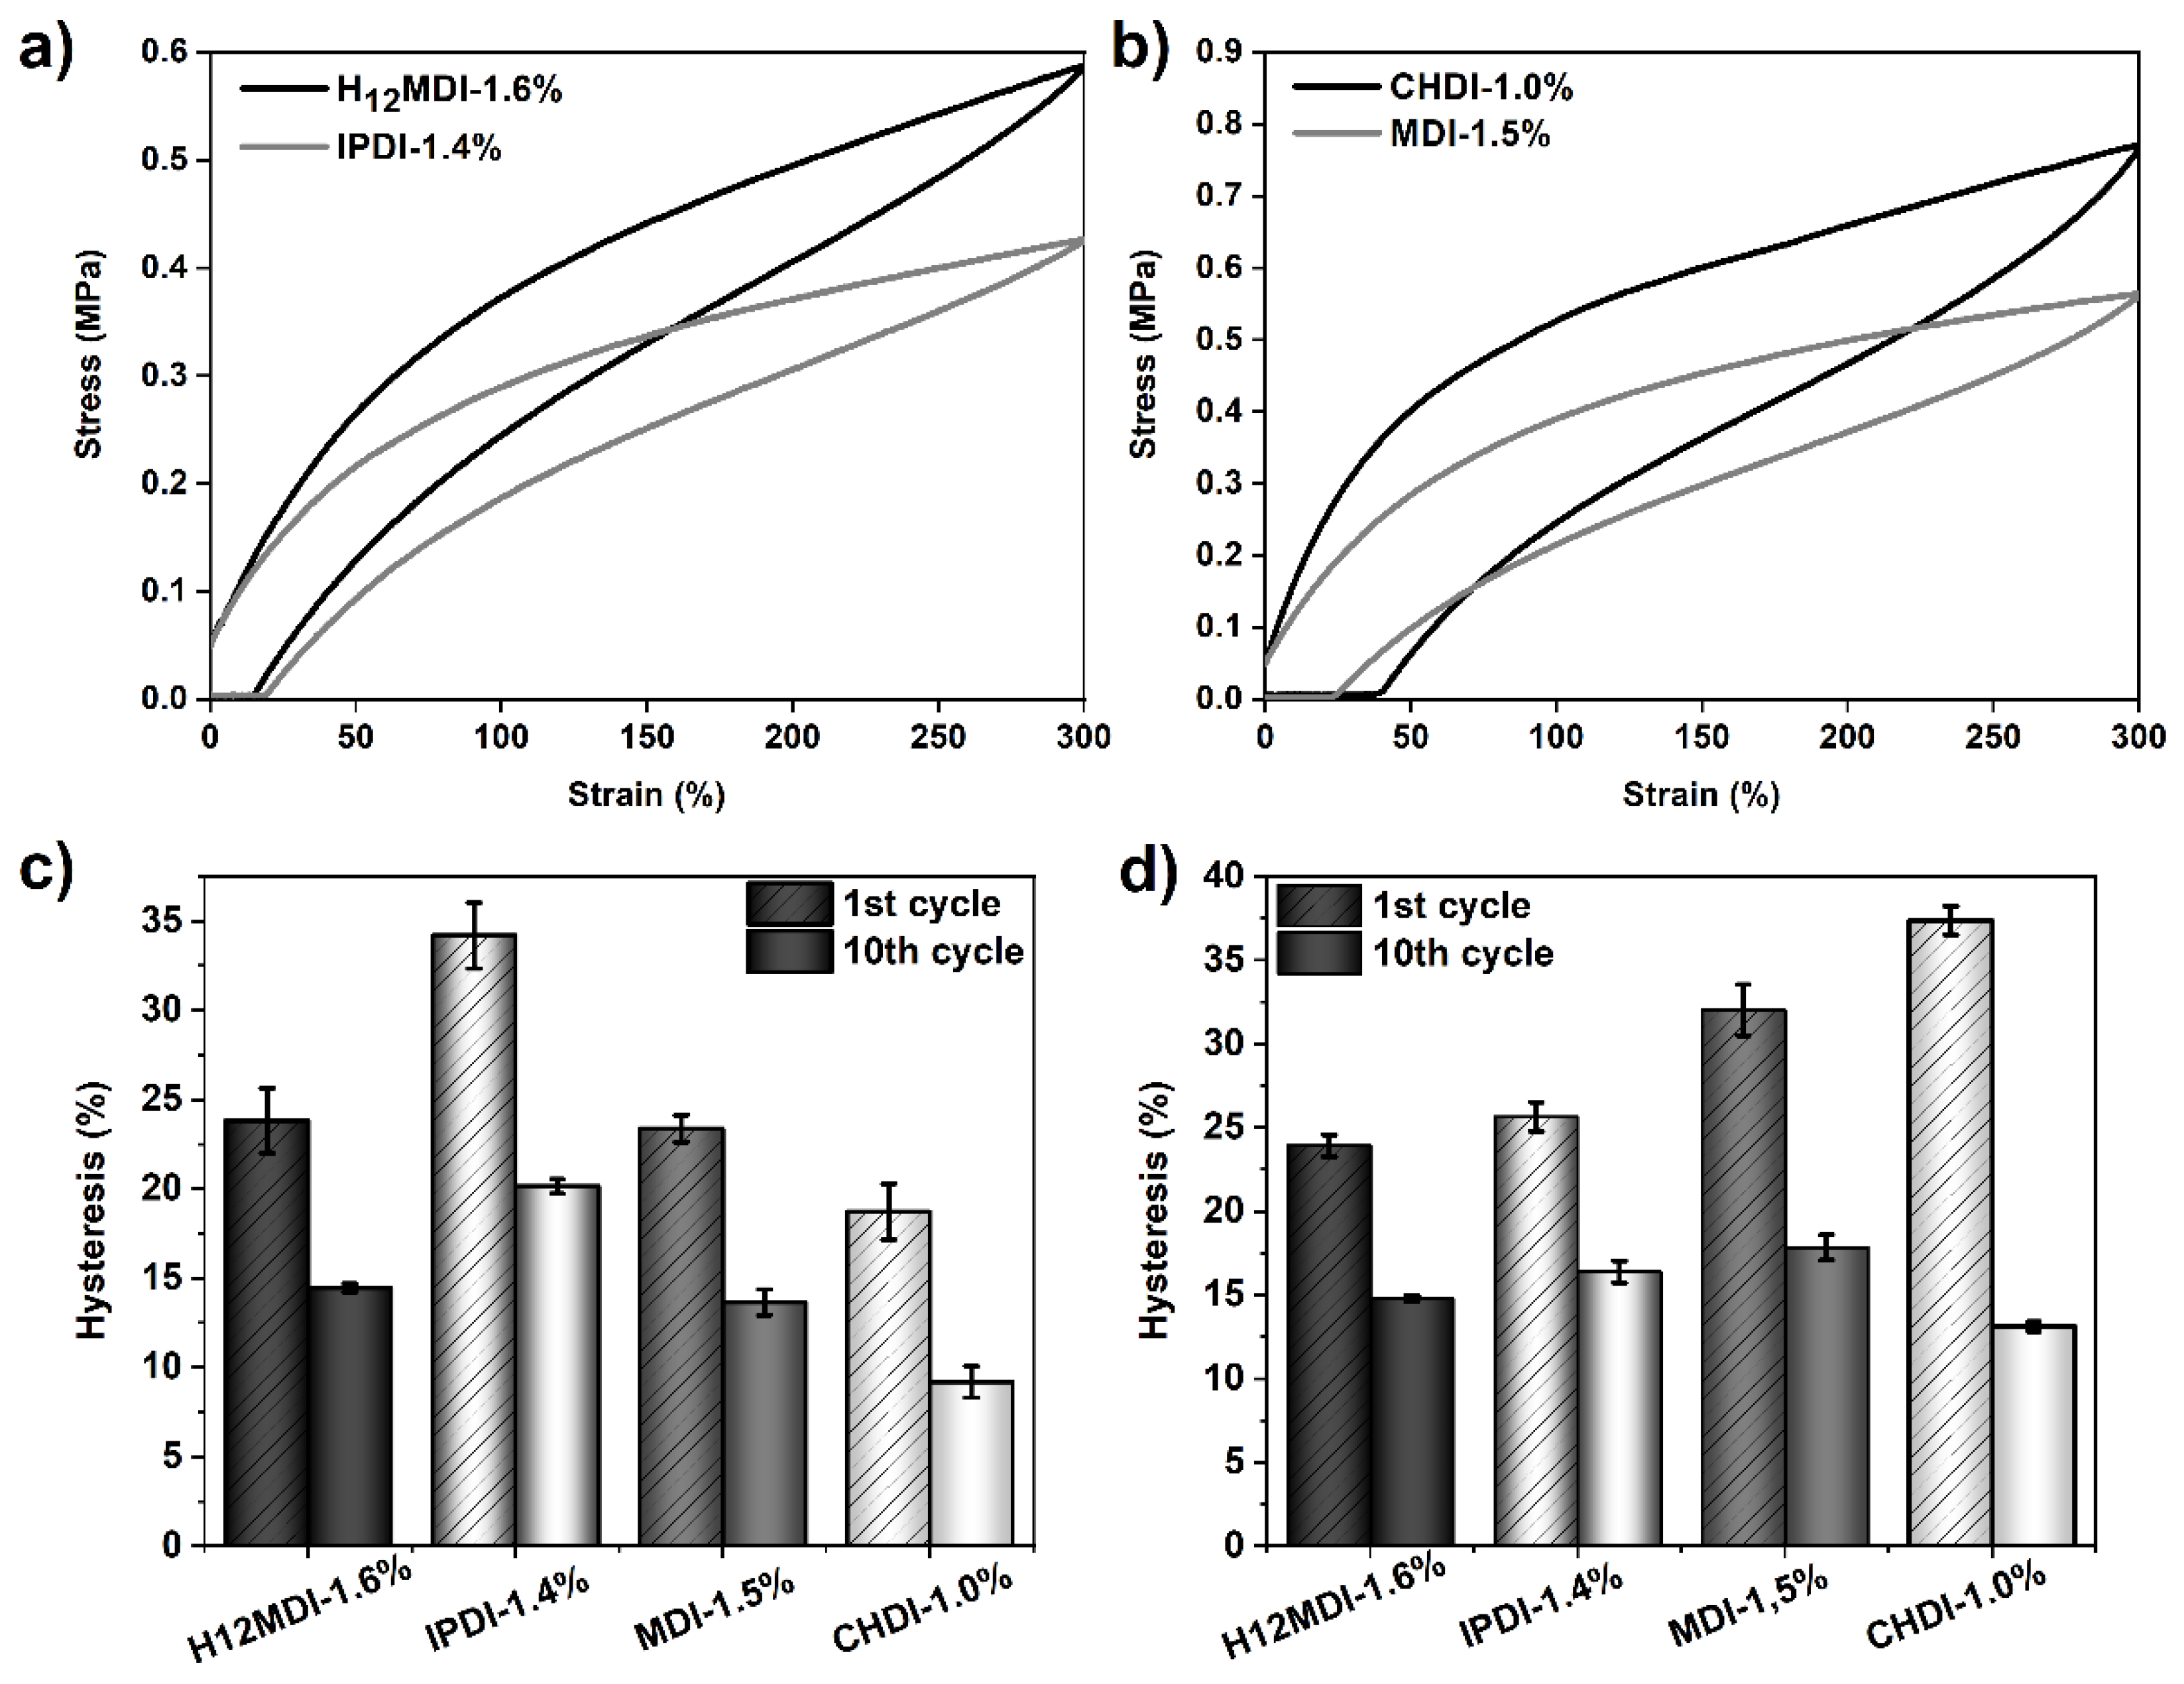
3.3.3. Influence of Diisocyanate Structure on the Mechanical Properties and Hysteresis Behavior of PSU Copolymers
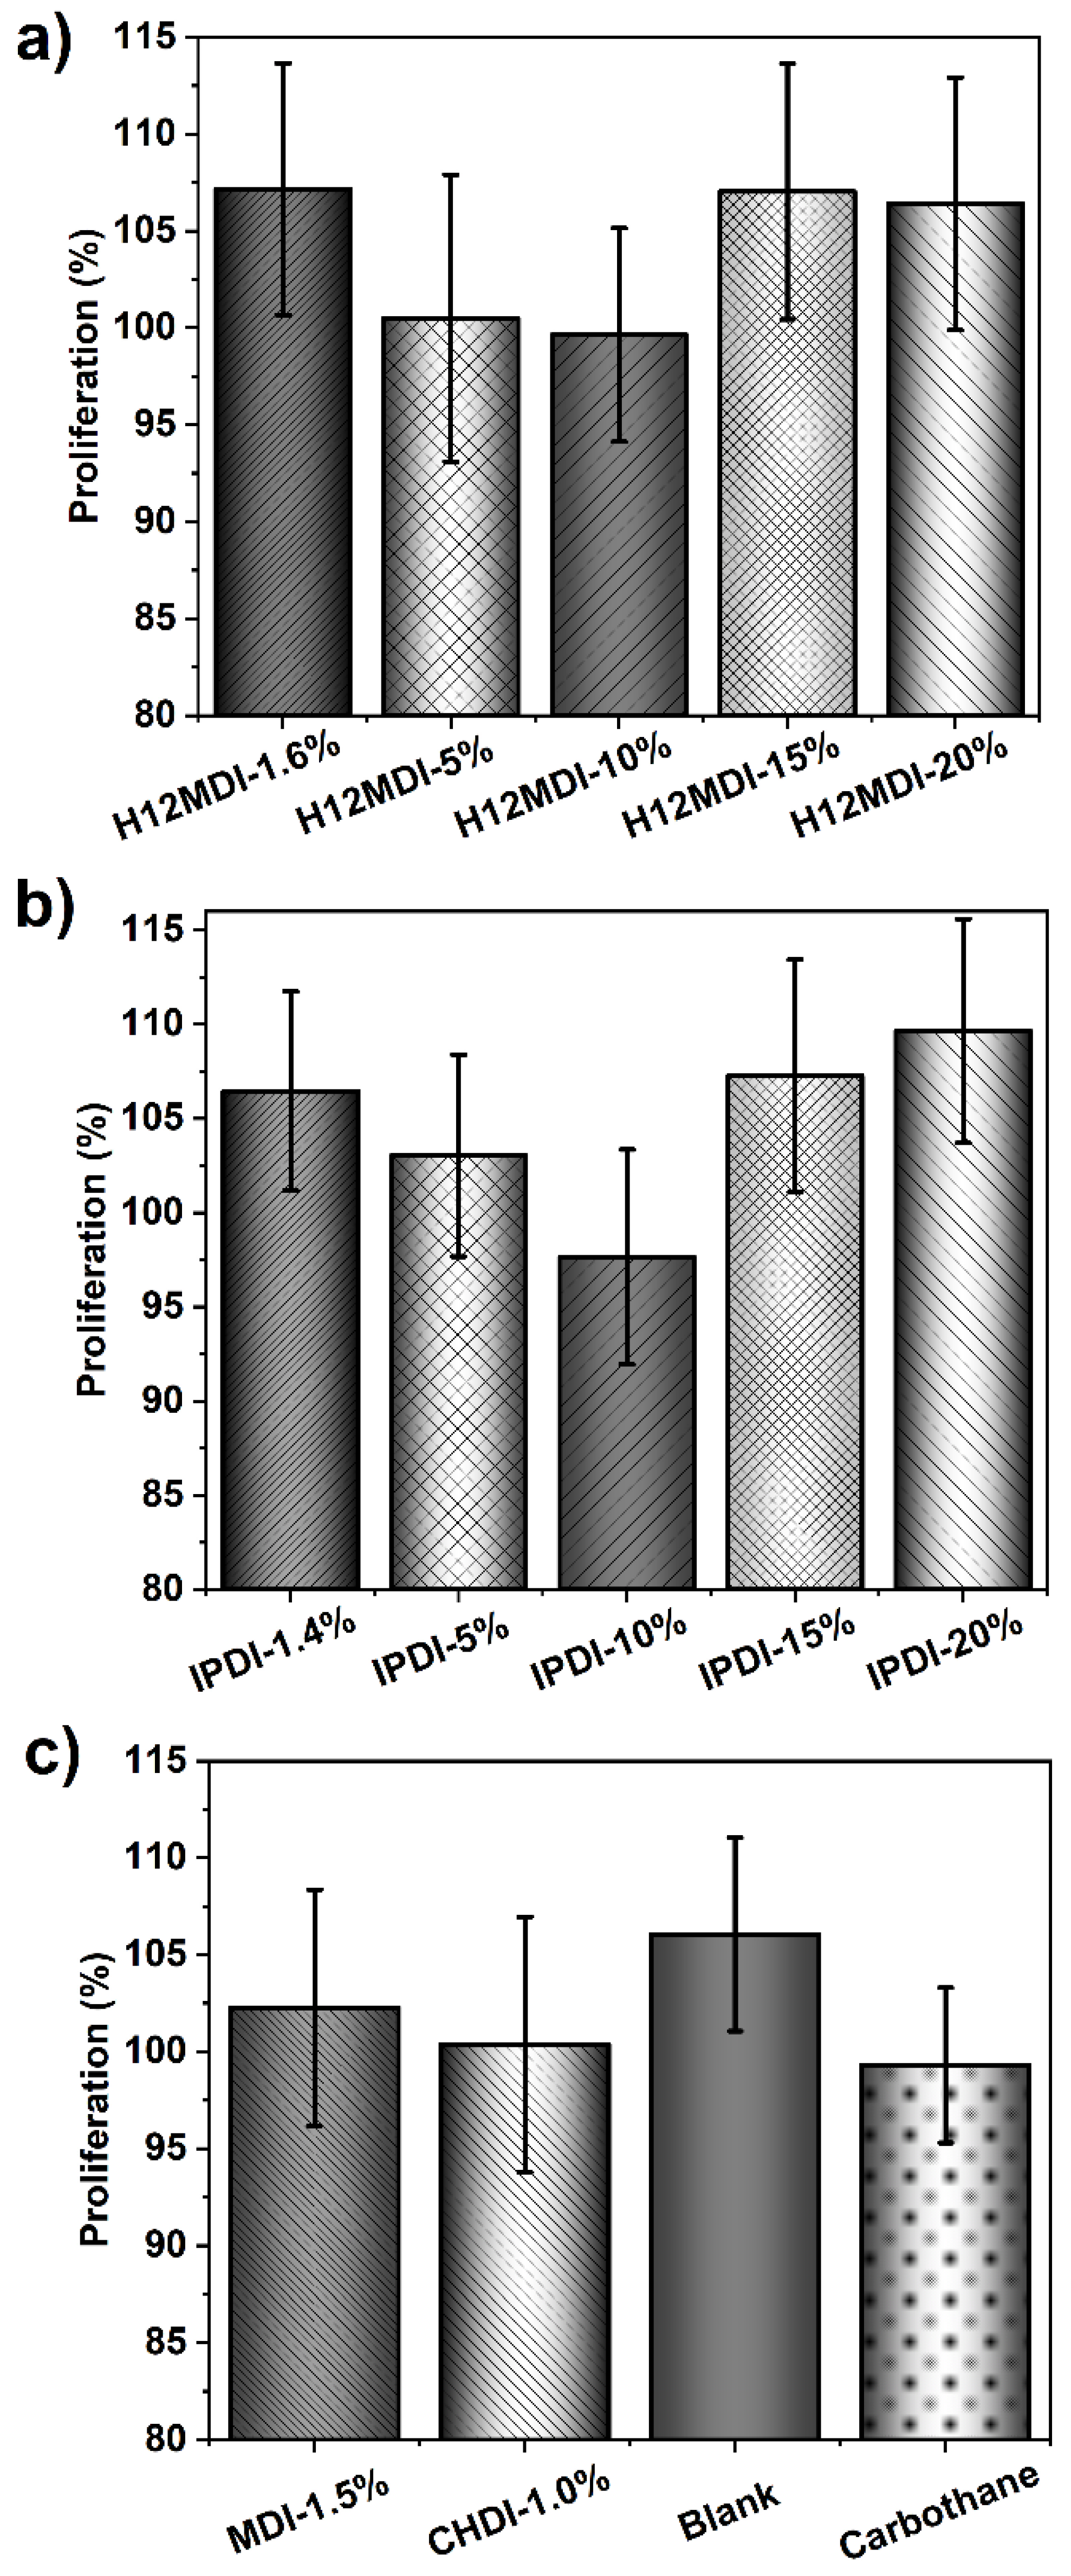
3.4. In Vitro Cytotoxicity
4. Conclusions
Author Contributions
Funding
Institutional Review Board Statement
Informed Consent Statement
Data Availability Statement
Acknowledgments
Conflicts of Interest
Appendix A. Synthesis of Polydimethylsiloxane-Based PUr Elastomers Comprising Varying Hard Segment Contents and Different Diisocyanates


Appendix B. Determination of Intrinsic Viscosity of the Polydimethylsiloxane-Based PUr Elastomers


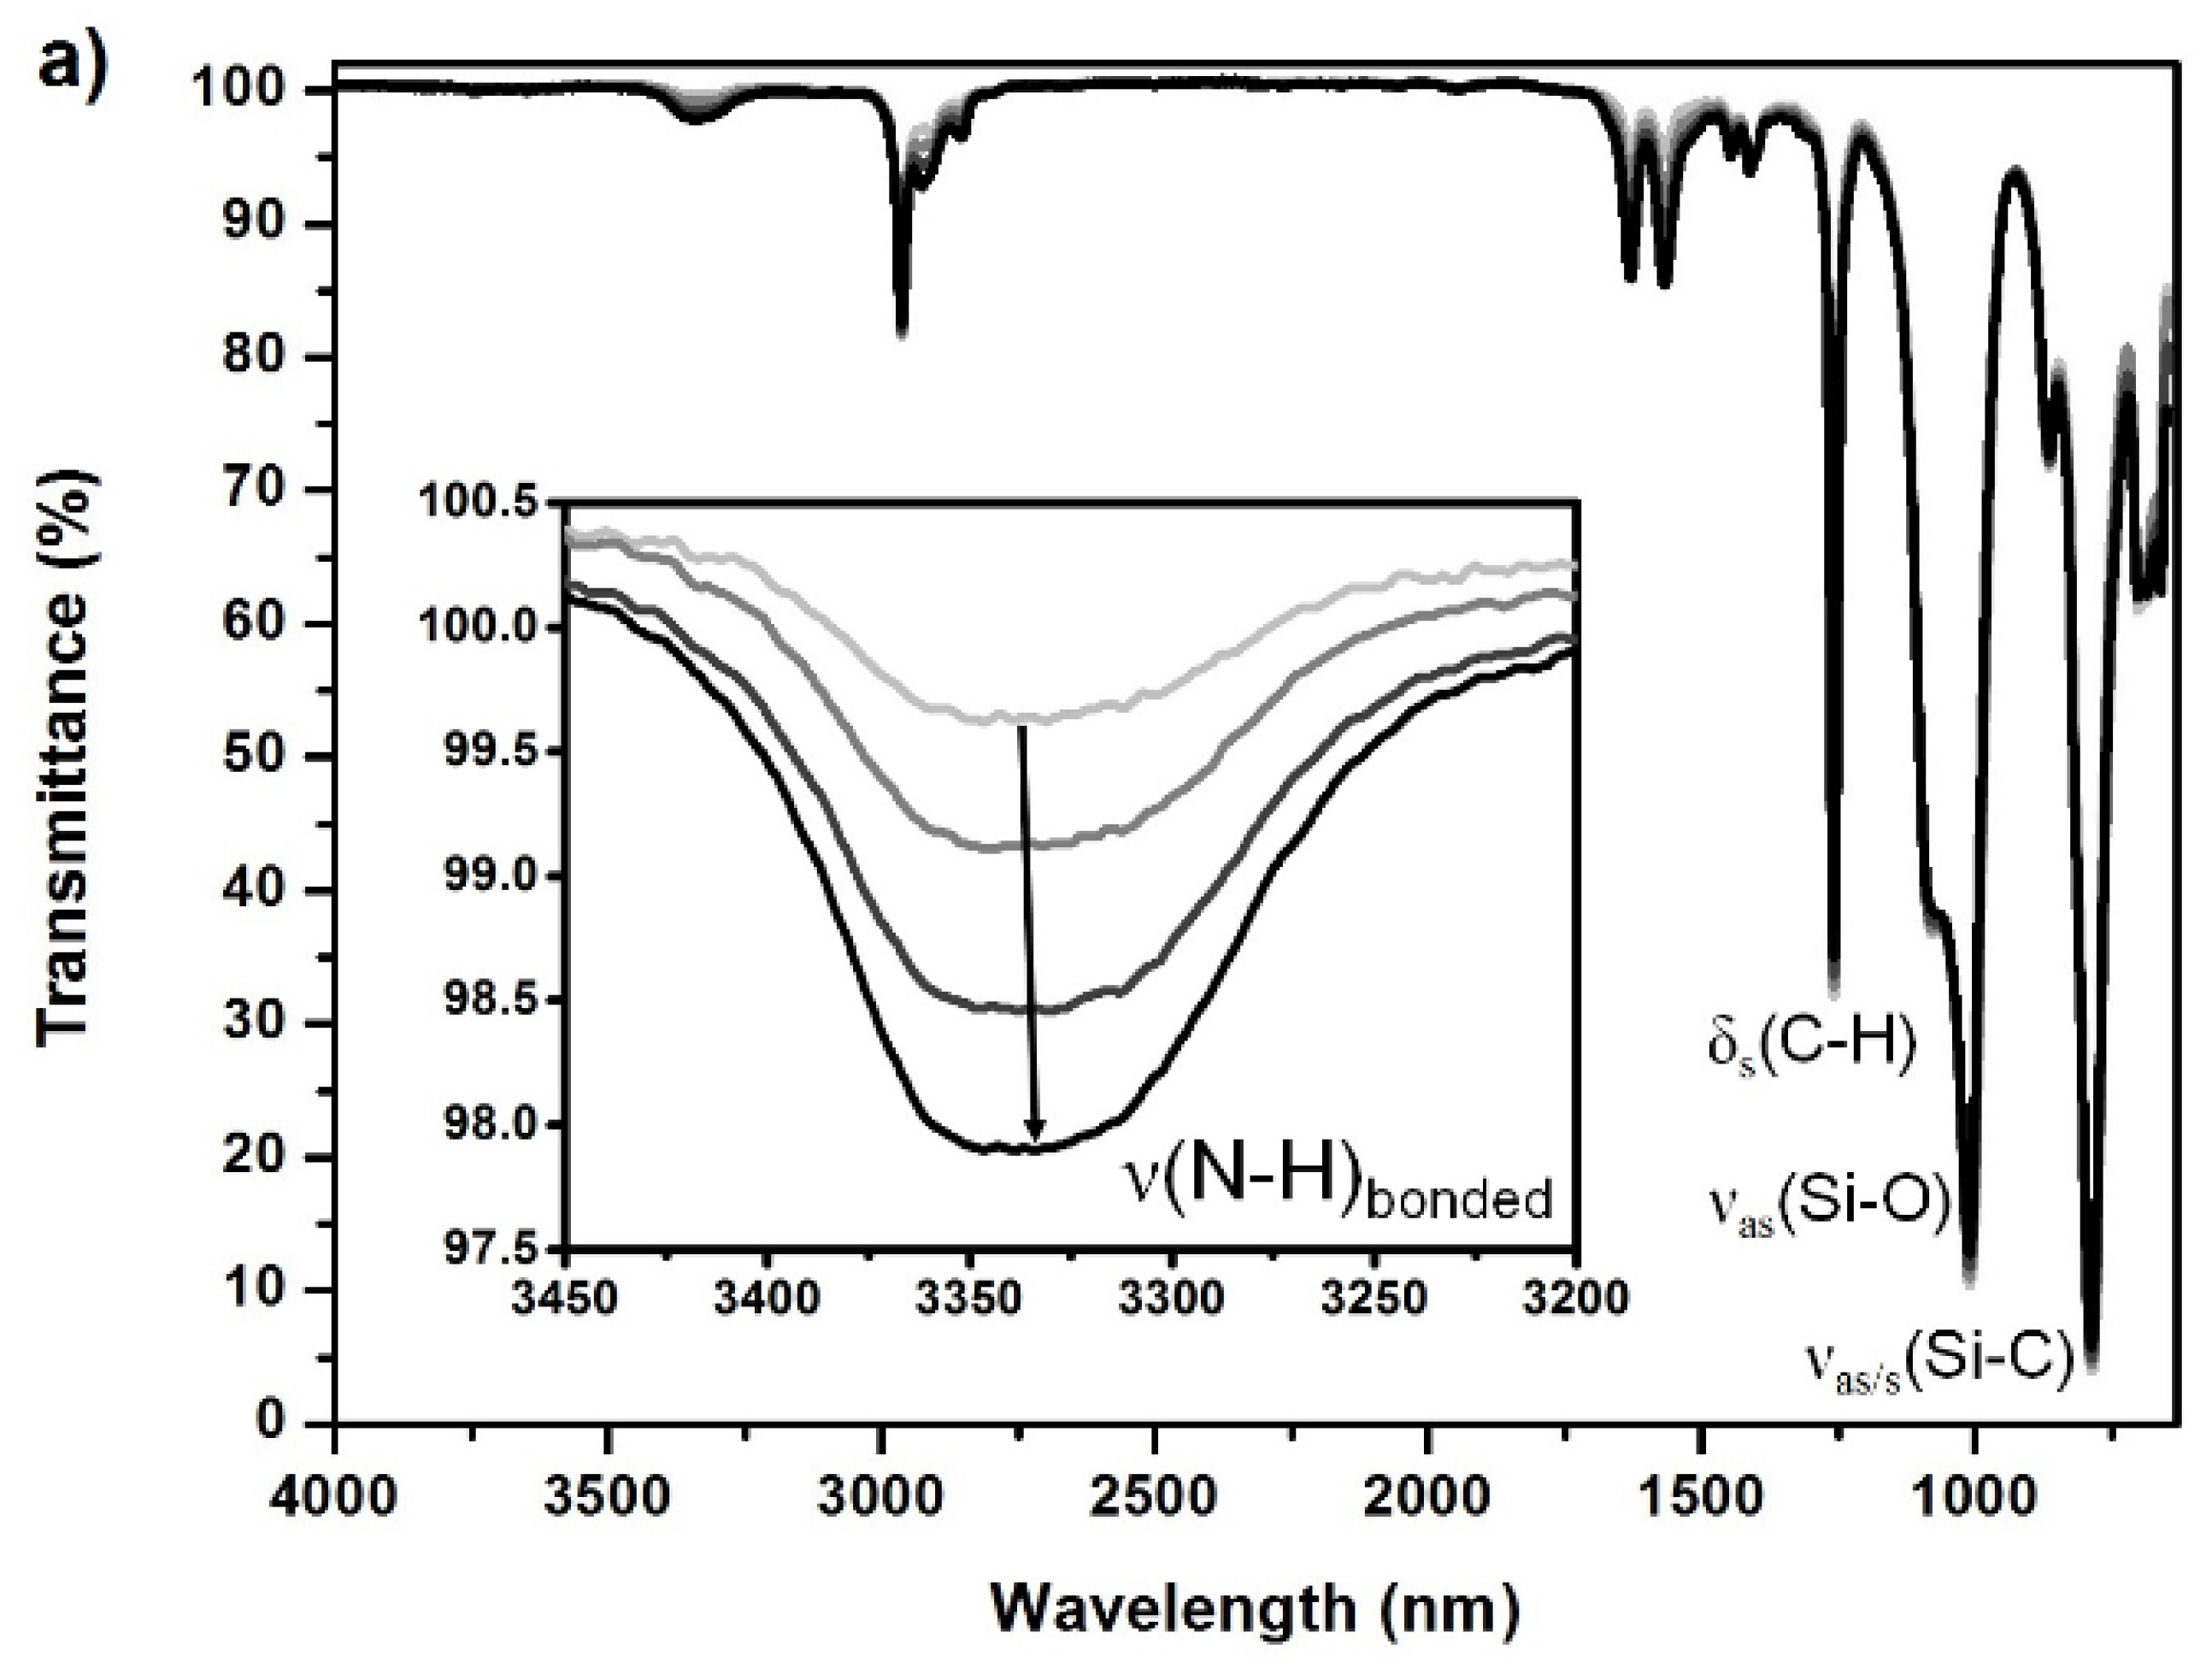
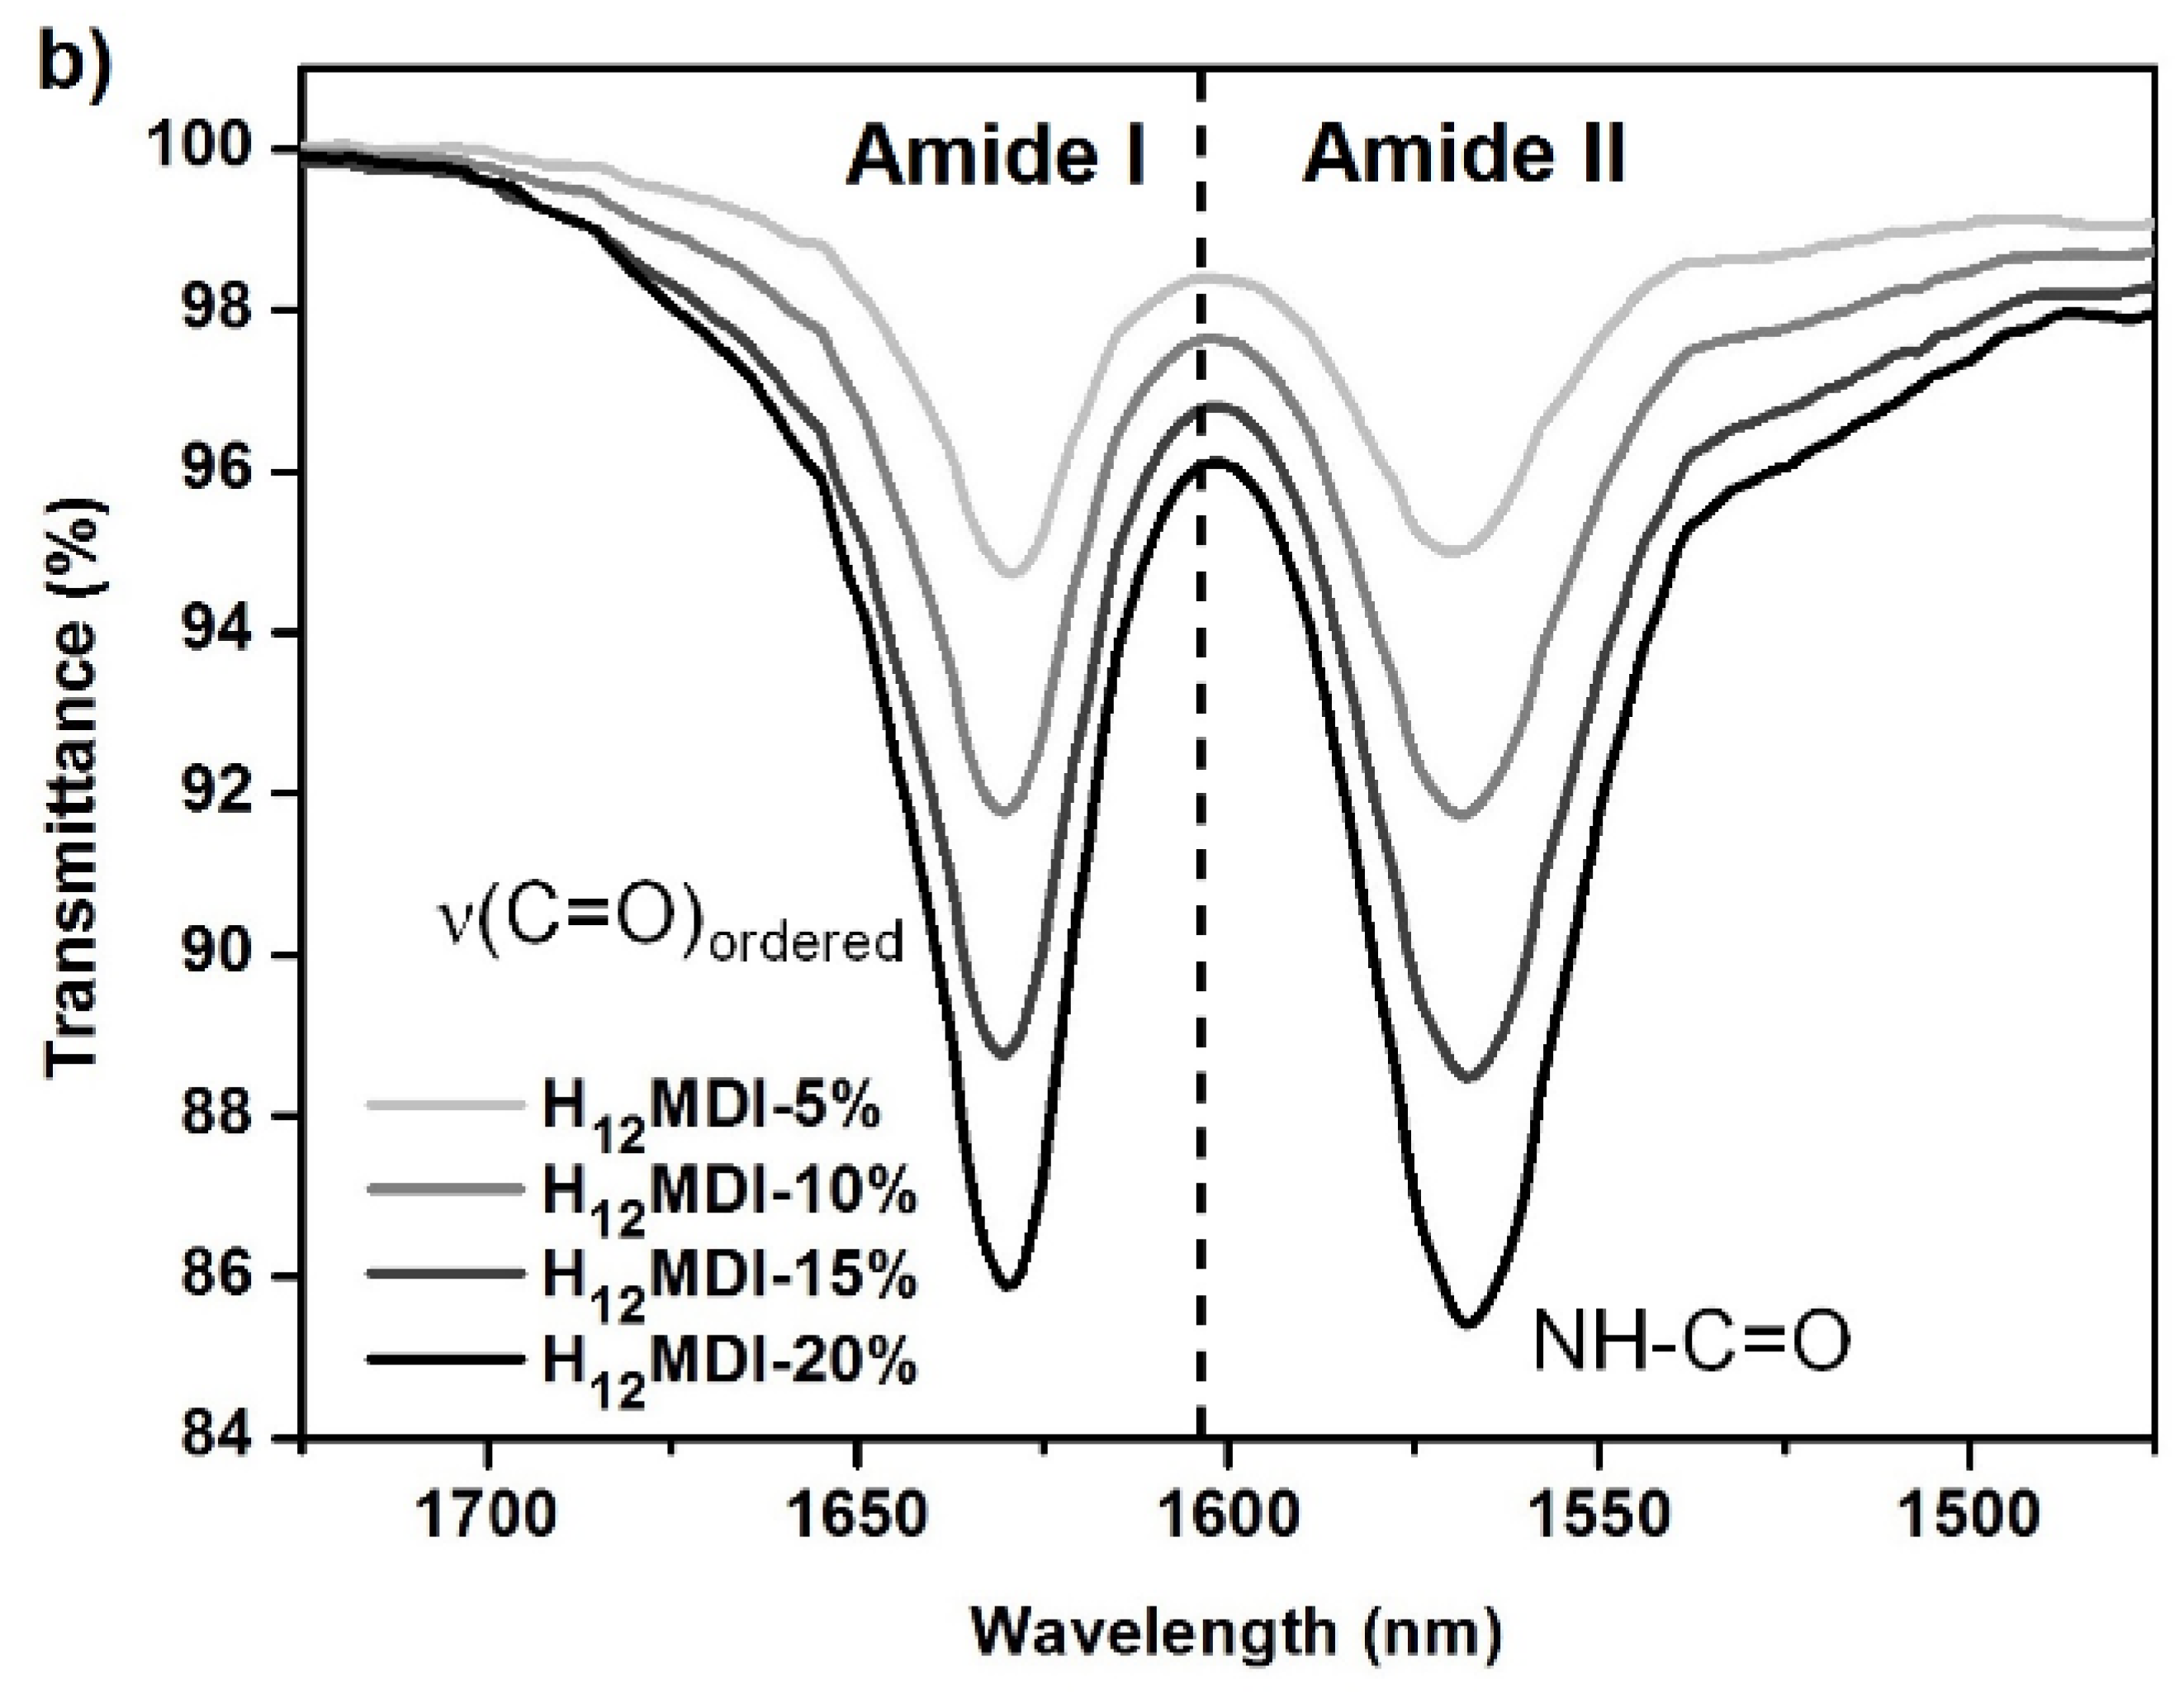
Appendix C. Synthesis of Polydimethylsiloxane-Based PUr Elastomers Followed by ATR FTIR Spectroscopy


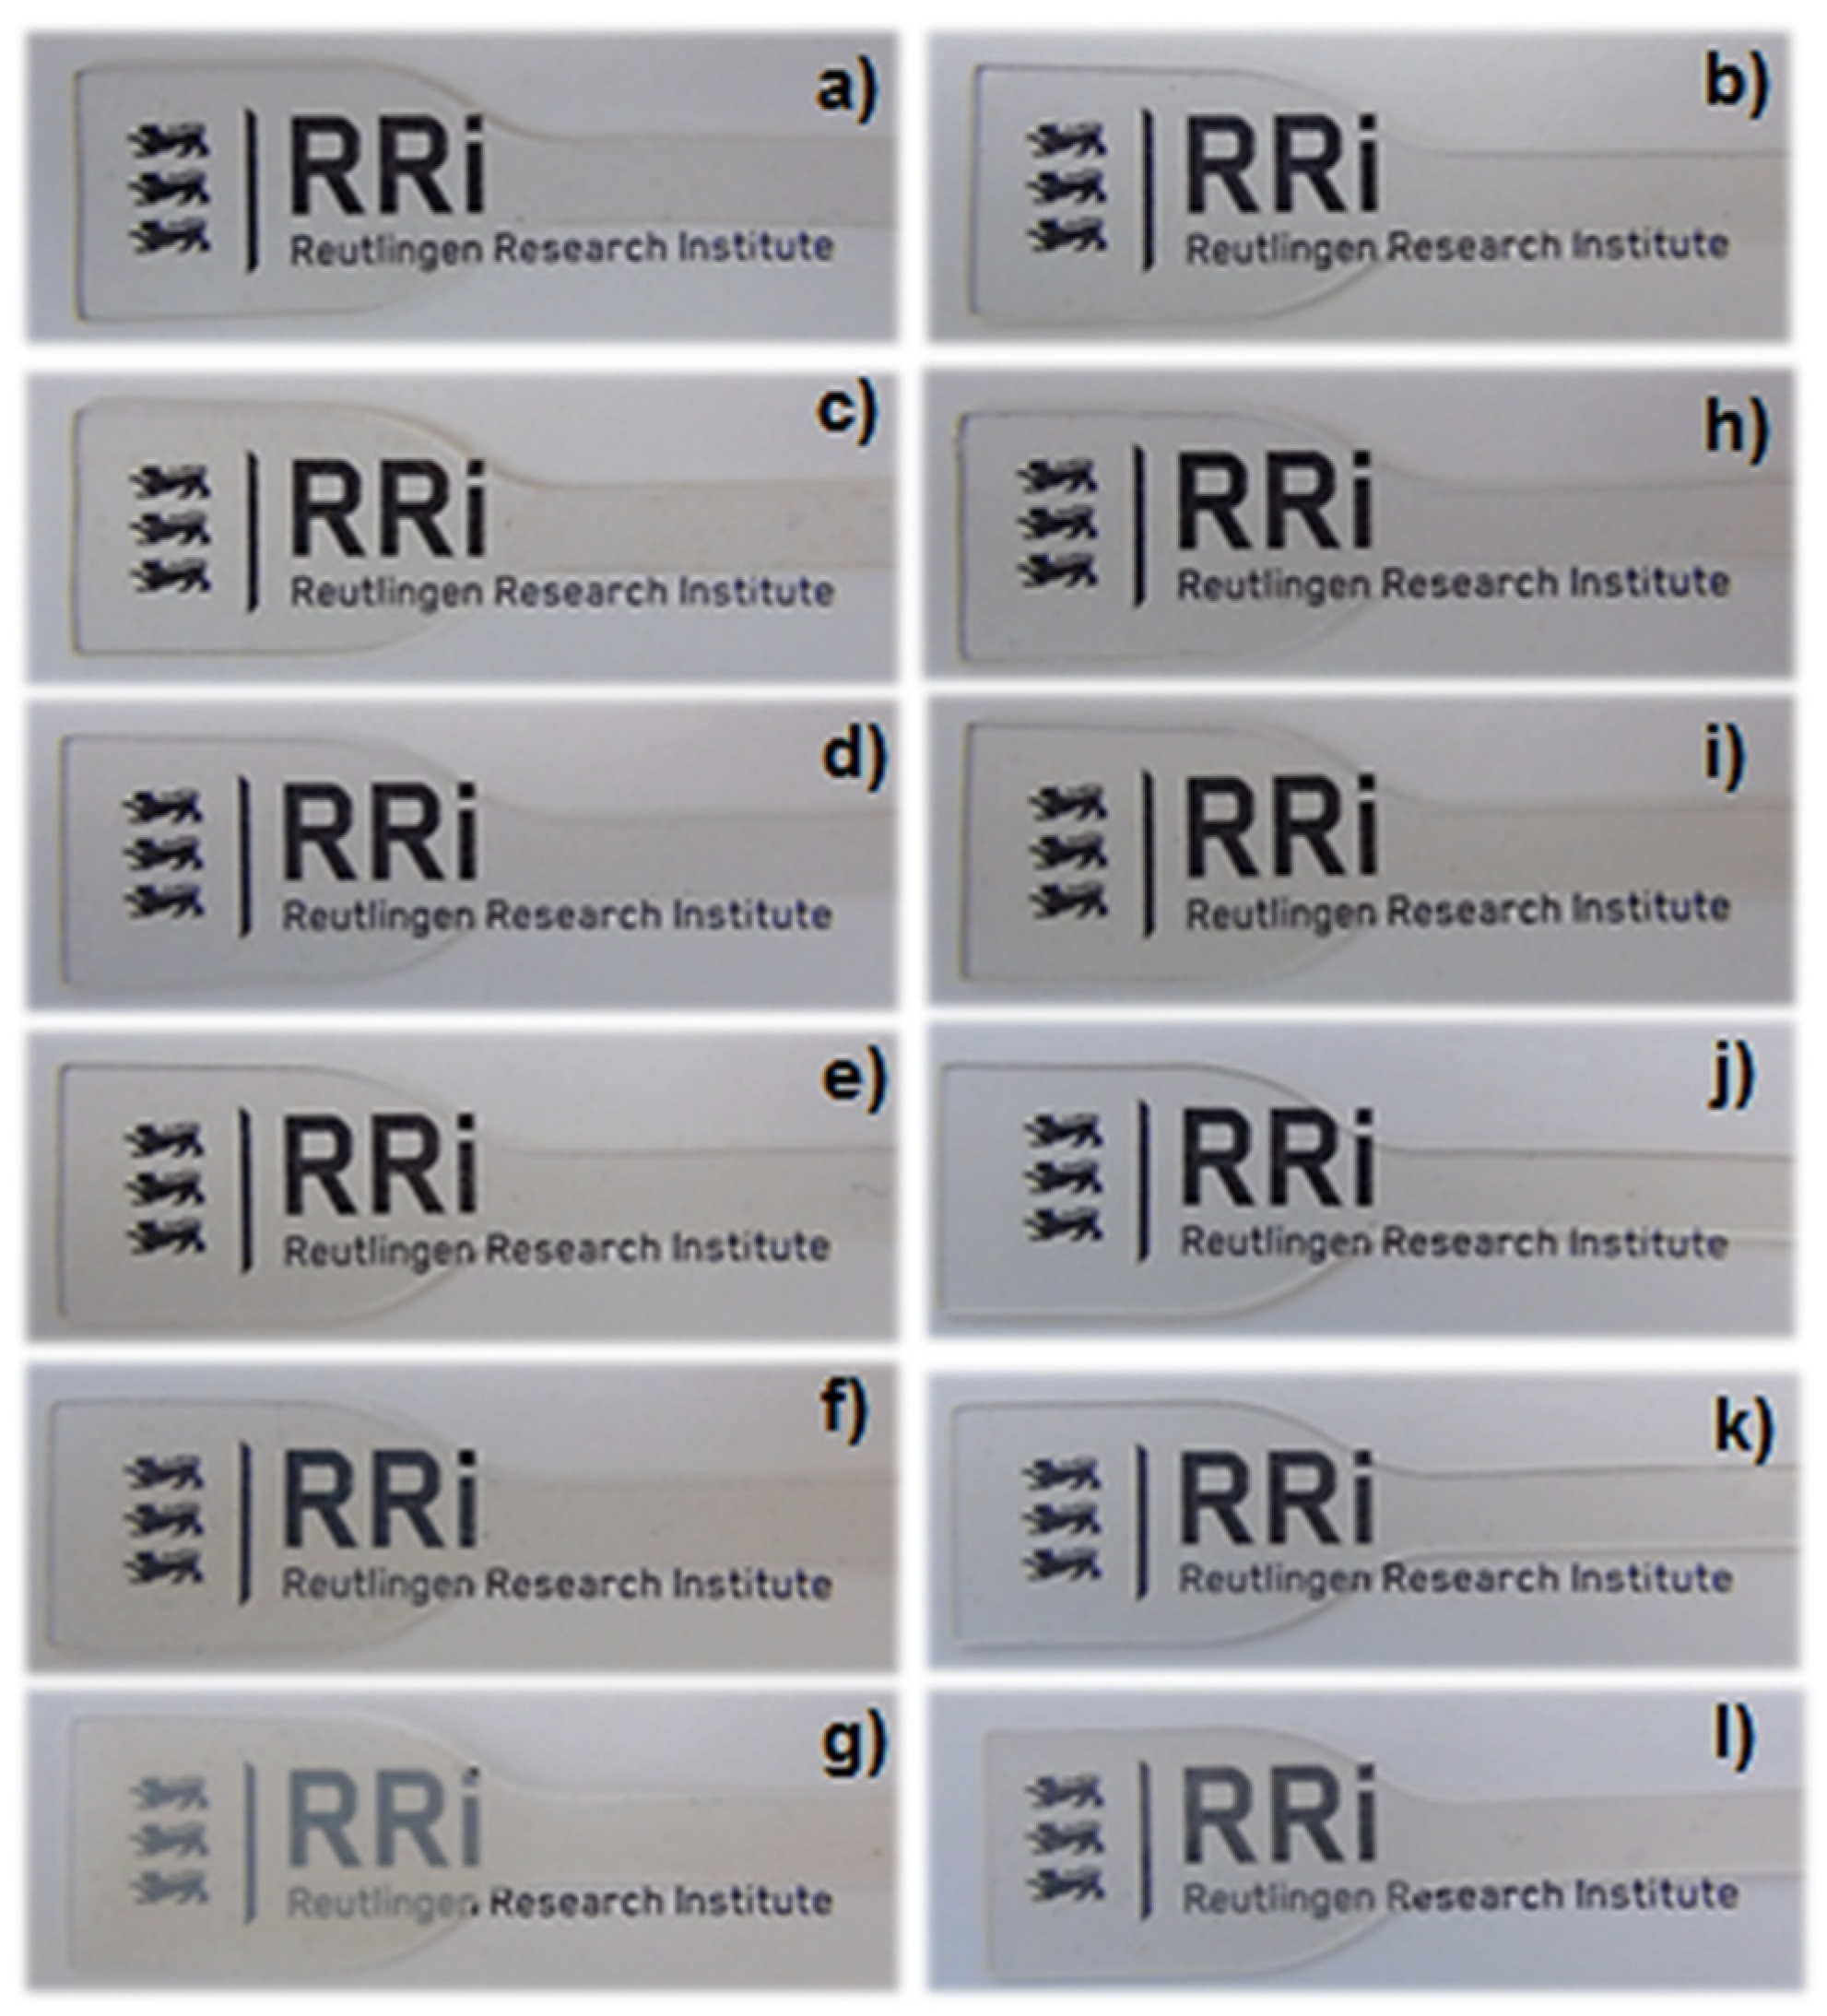
Appendix D. Transparency of Novel Films as Documented by Photographs of Polydimethylsiloxane-Based PUr Elastomer Films

Appendix E. Mechanical Properties of Polydimethylsiloxane-Based PUr Elastomers Comprising Varying HS Contents and Different Diisocyanates

| PSU | Young’s Modulus (MPa) | Ultimate Tensile Strength (MPa) | Elongation at Break (%) |
|---|---|---|---|
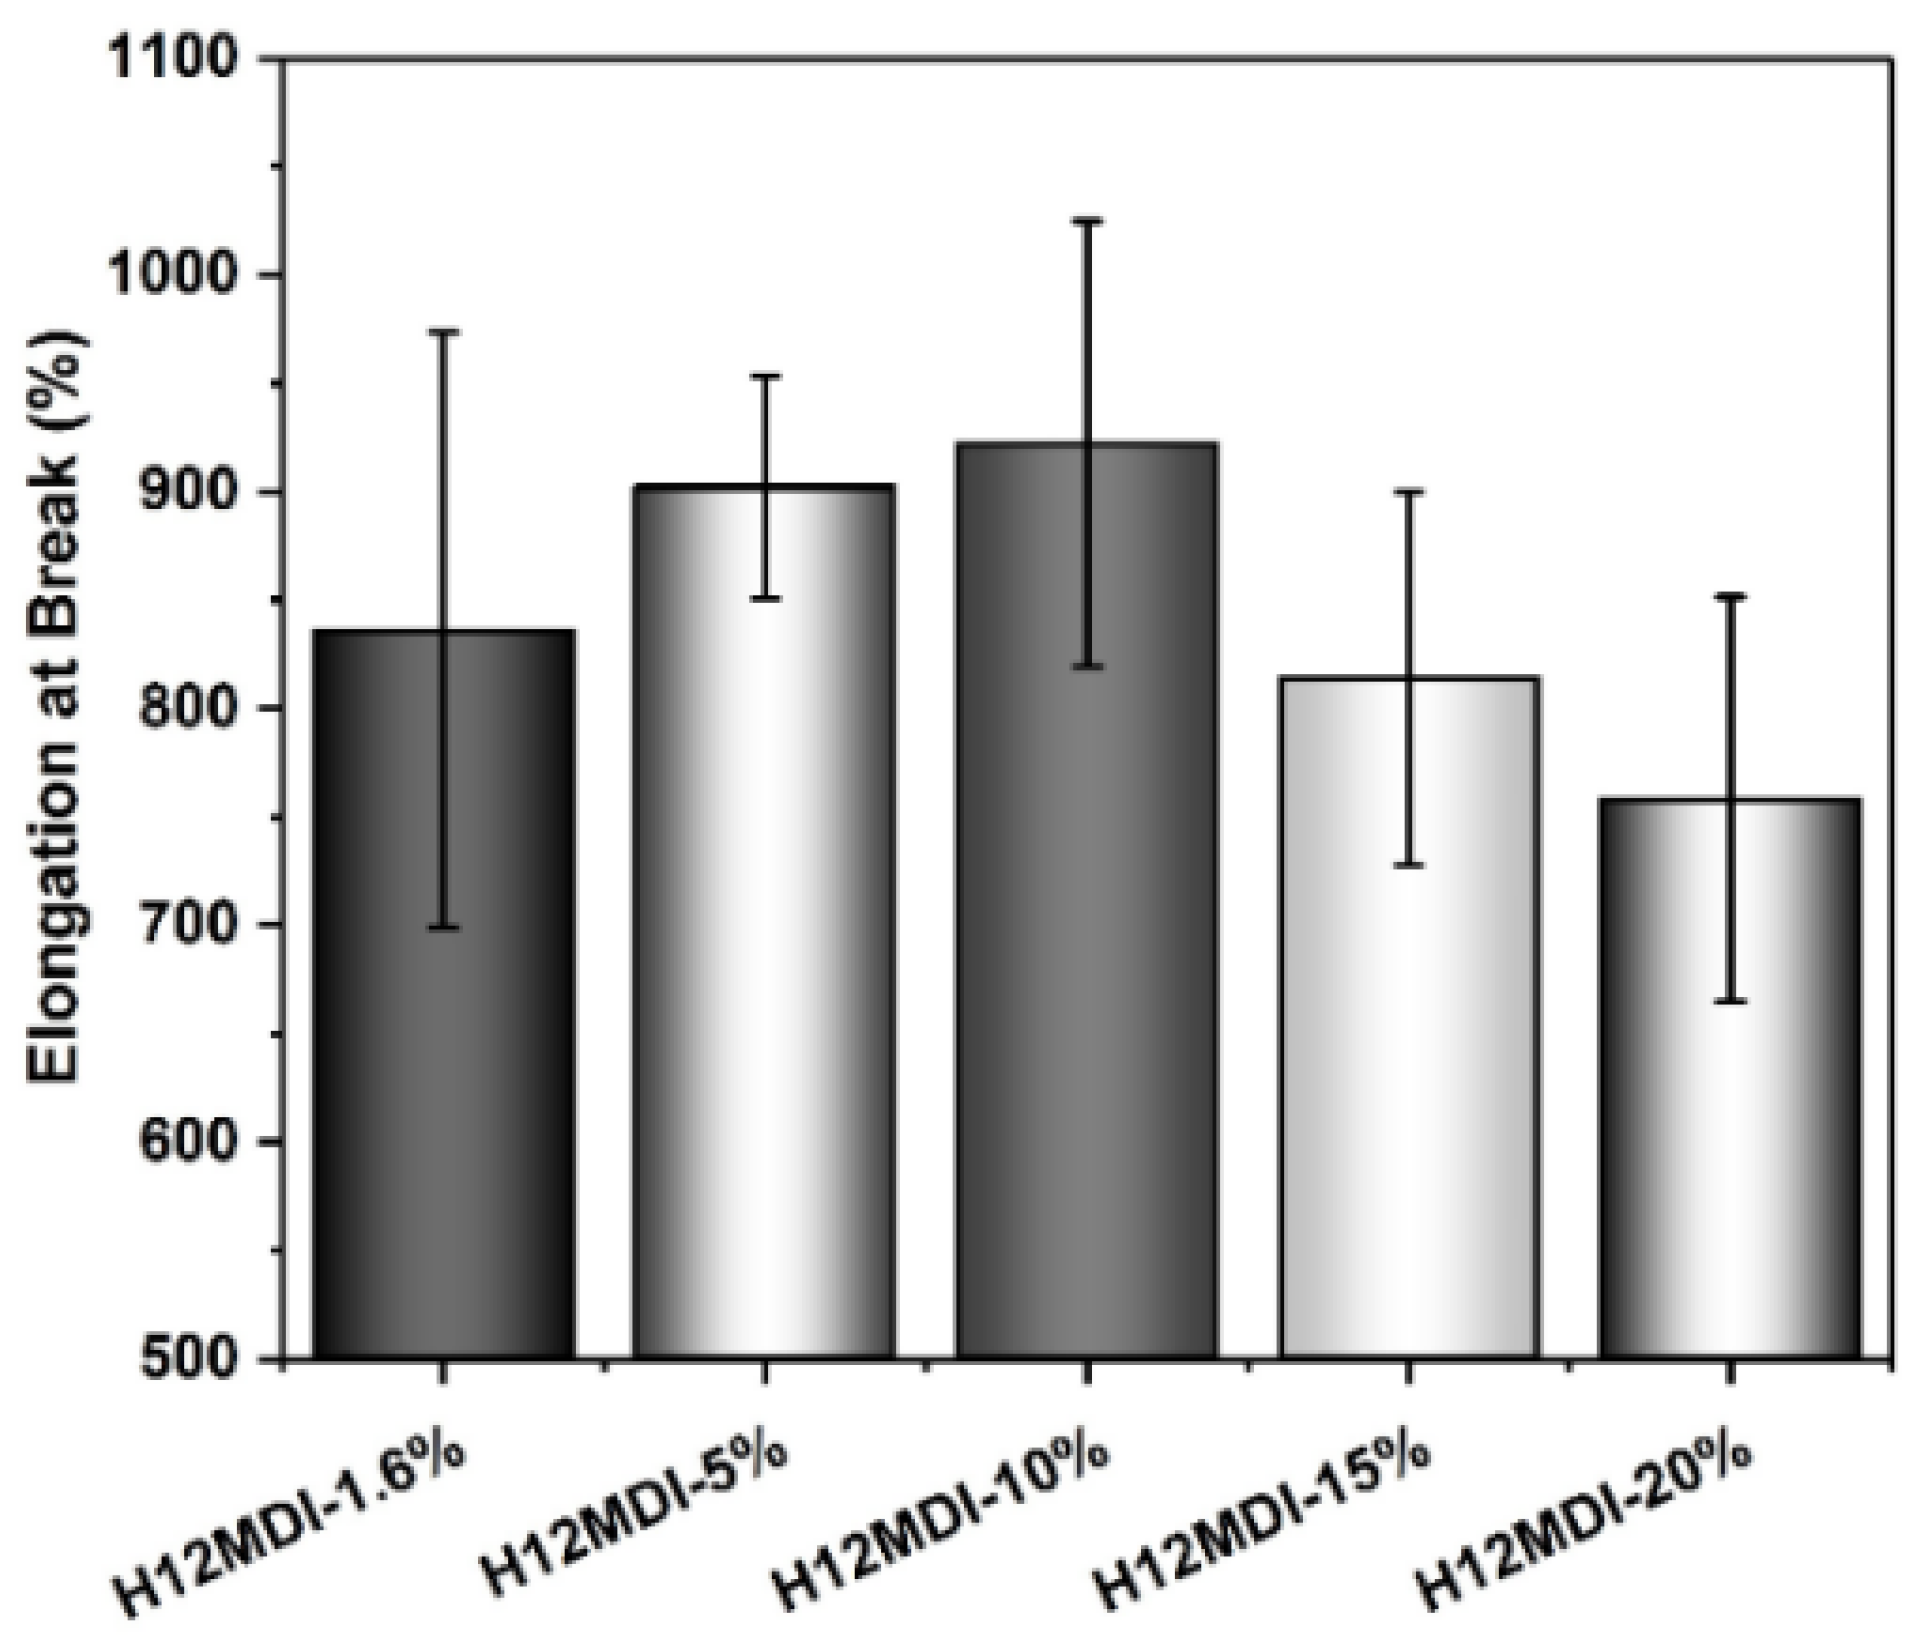
| PSU H12MDI-1.6% | 0.52 ± 0.05 | 1.34 ± 0.13 | 836 ± 137 |
| PSU H12MDI-5% | 0.83 ± 0.07 | 2.41 ± 0.14 | 902 ± 51 |
| PSU H12MDI-10% | 0.96 ± 0.13 | 4.07 ± 0.16 | 922 ± 103 |
| PSU H12MDI-15% | 1.17 ± 0.07 | 5.37 ± 0.40 | 814 ± 86 |
| PSU H12MDI-20% | 1.34 ± 0.06 | 6.70 ± 0.52 | 758 ± 93 |
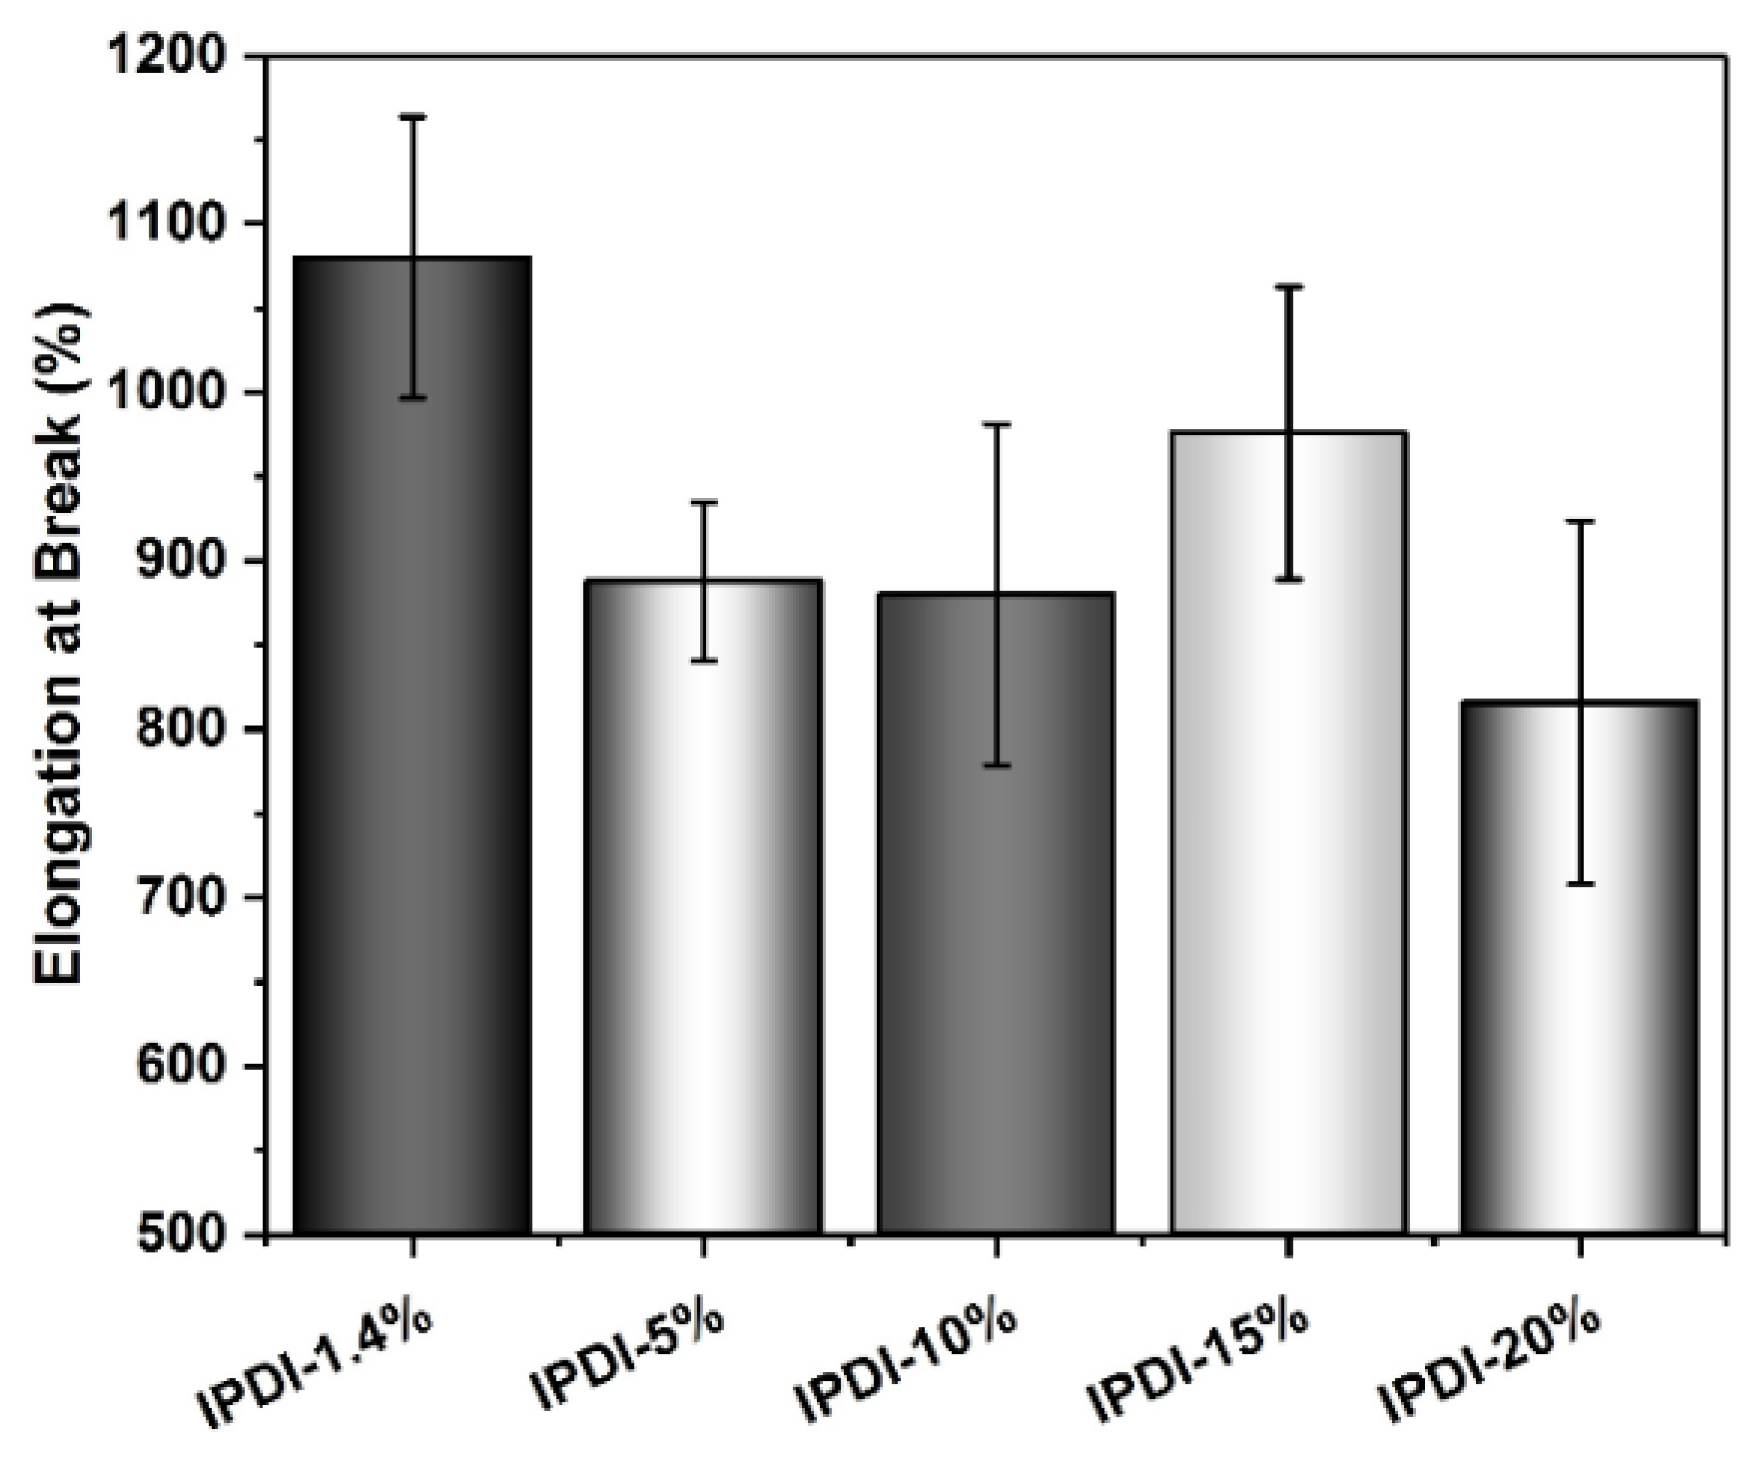
| PSU IPDI-1.4% | 0.27 ± 0.01 | 1.00 ± 0.07 | 1080 ± 84 |
| PSU IPDI-5% | 0.60 ± 0.04 | 1.88 ± 0.13 | 888 ± 47 |
| PSU IPDI-10% | 0.92 ± 0.04 | 3.04 ± 0.19 | 880 ± 101 |
| PSU IPDI-15% | 1.12 ± 0.03 | 4.56 ± 0.38 | 976 ± 87 |
| PSU IPDI-20% | 1.28 ± 0.10 | 4.76 ± 0.50 | 816 ± 108 |
| PSU MDI-1.5% | 0.48 ± 0.04 | 1.36 ± 0.25 | 1050 ± 140 |
| PSU CHDI-1.0% | 0.91 ± 0.05 | 1.19 ± 0.12 | 602 ± 77 |


| PSU/Cycle | 1 | 2 | 3 | 4 | 5 | 6 | 7 | 8 | 9 | 10 |
|---|---|---|---|---|---|---|---|---|---|---|
| H12MDI-1.6% | 23.8 | 16.4 | 15.5 | 15.1 | 14.7 | 14.7 | 14.6 | 14.5 | 14.4 | 14.5 |
| SD | 1.8 | 0.2 | 0.2 | 0.3 | 0.2 | 0.2 | 0.2 | 0.2 | 0.2 | 0.2 |
| H12MDI-5% | 11.2 | 6.9 | 6.1 | 5.7 | 5.5 | 5.3 | 5.3 | 5.2 | 5.0 | 5.0 |
| SD | 0.8 | 0.3 | 0.3 | 0.4 | 0.4 | 0.4 | 0.4 | 0.4 | 0.3 | 0.4 |
| H12MDI-10% | 8.8 | 3.7 | 3.3 | 3.0 | 2.9 | 2.8 | 2.7 | 2.7 | 2.7 | 2.6 |
| SD | 1.7 | 0.4 | 0.3 | 0.3 | 0.3 | 0.3 | 0.2 | 0.3 | 0.3 | 0.3 |
| H12MDI-15% | 12.3 | 3.6 | 3.2 | 3.0 | 2.8 | 2.8 | 2.7 | 2.7 | 2.6 | 2.6 |
| SD | 4.7 | 0.2 | 0.1 | 0.1 | 0.1 | 0.1 | 0.1 | 0.1 | 0.1 | 0.1 |
| H12MDI-20% | 27.8 | 5.1 | 4.5 | 4.3 | 4.2 | 4.1 | 4.1 | 4.0 | 4.0 | 4.0 |
| SD | 3.5 | 1.3 | 1.4 | 1.5 | 1.5 | 1.5 | 1.5 | 1.6 | 1.5 | 1.5 |
| PSU/Cycle | 1 | 2 | 3 | 4 | 5 | 6 | 7 | 8 | 9 | 10 |
|---|---|---|---|---|---|---|---|---|---|---|
| IPDI-1.4% | 34.2 | 20.9 | 20.3 | 20.1 | 20.0 | 19.9 | 19.9 | 20.0 | 20.1 | 20.1 |
| SD | 1.8 | 0.7 | 0.7 | 0.6 | 0.5 | 0.4 | 0.5 | 0.5 | 0.6 | 0.4 |
| IPDI-5% | 17.0 | 10.3 | 9.4 | 9.1 | 8.8 | 8.7 | 8.5 | 8.5 | 8.4 | 8.3 |
| SD | 0.3 | 0.6 | 0.7 | 0.7 | 0.8 | 0.8 | 0.8 | 0.8 | 0.8 | 0.8 |
| IPDI-10% | 9.5 | 4.6 | 4.0 | 3.7 | 3.4 | 3.3 | 3.3 | 3.2 | 3.1 | 3.1 |
| SD | 0.6 | 0.3 | 0.3 | 0.3 | 0.3 | 0.2 | 0.2 | 0.2 | 0.2 | 0.2 |
| IPDI-15% | 13.2 | 5.1 | 4.4 | 4.0 | 3.9 | 3.7 | 3.7 | 3.6 | 3.5 | 3.4 |
| SD | 0.4 | 0.1 | 0.1 | 0.1 | 0.0 | 0.1 | 0.1 | 0.1 | 0.1 | 0.1 |
| IPDI-20% | 21.6 | 7.9 | 6.8 | 6.3 | 6.0 | 5.8 | 5.6 | 5.5 | 5.4 | 5.3 |
| SD | 0.6 | 0.3 | 0.2 | 0.2 | 0.2 | 0.2 | 0.2 | 0.2 | 0.2 | 0.2 |
| PSU/Cycle | 1 | 2 | 3 | 4 | 5 | 6 | 7 | 8 | 9 | 10 |
|---|---|---|---|---|---|---|---|---|---|---|
| MDI-1.5% | 23.4 | 15.7 | 15.1 | 14.6 | 14.3 | 14.2 | 14.1 | 13.9 | 13.8 | 13.7 |
| SD | 0.8 | 0.7 | 0.7 | 0.6 | 0.8 | 0.9 | 0.9 | 0.7 | 0.8 | 0.7 |
| CHDI-1.0% | 18.7 | 12.3 | 11.1 | 10.5 | 10.1 | 9.9 | 9.7 | 9.5 | 9.3 | 9.2 |
| SD | 1.6 | 0.7 | 0.7 | 0.8 | 0.9 | 0.8 | 0.8 | 0.8 | 0.9 | 0.9 |
| PSU/Cycle | 1 | 2 | 3 | 4 | 5 | 6 | 7 | 8 | 9 | 10 |
|---|---|---|---|---|---|---|---|---|---|---|
| H12MDI-1.6% | 23.9 | 17.0 | 15.8 | 15.4 | 15.2 | 15.0 | 14.9 | 14.8 | 14.8 | 14.8 |
| SD | 0.6 | 0.3 | 0.2 | 0.2 | 0.2 | 0.2 | 0.2 | 0.2 | 0.2 | 0.2 |
| H12MDI-5% | 21.4 | 12.1 | 10.8 | 10.2 | 9.9 | 9.6 | 9.4 | 9.2 | 9.1 | 8.9 |
| SD | 1.1 | 0.2 | 0.3 | 0.3 | 0.3 | 0.3 | 0.3 | 0.3 | 0.3 | 0.3 |
| H12MDI-10% | 21.1 | 9.5 | 8.4 | 7.9 | 7.5 | 7.3 | 7.1 | 6.9 | 6.8 | 6.7 |
| SD | 1.3 | 1.3 | 1.2 | 1.2 | 1.2 | 1.1 | 1.1 | 1.1 | 1.0 | 1.0 |
| H12MDI-15% | 28.9 | 10.6 | 9.2 | 8.6 | 8.1 | 7.9 | 7.6 | 7.4 | 7.3 | 7.1 |
| SD | 1.8 | 0.9 | 0.8 | 0.8 | 0.8 | 0.7 | 0.7 | 0.7 | 0.6 | 0.7 |
| H12MDI-20% | 27.5 | 10.0 | 8.7 | 8.2 | 7.8 | 7.6 | 7.3 | 7.2 | 7.1 | 7.0 |
| SD | 0.9 | 0.3 | 0.3 | 0.5 | 0.4 | 0.4 | 0.3 | 0.3 | 0.4 | 0.5 |
| PSU/Cycle | 1 | 2 | 3 | 4 | 5 | 6 | 7 | 8 | 9 | 10 |
|---|---|---|---|---|---|---|---|---|---|---|
| IPDI-1.4% | 25.6 | 18.1 | 17.2 | 16.8 | 16.6 | 16.5 | 16.4 | 16.4 | 16.3 | 16.4 |
| SD | 0.9 | 0.3 | 0.5 | 0.5 | 0.5 | 0.6 | 0.6 | 0.6 | 0.7 | 0.7 |
| IPDI-5% | 26.9 | 14.5 | 13.1 | 12.3 | 11.9 | 11.6 | 11.4 | 11.2 | 11.1 | 10.9 |
| SD | 2.1 | 0.8 | 0.9 | 0.9 | 0.9 | 1.0 | 1.0 | 1.0 | 1.0 | 1.0 |
| IPDI-10% | 25.0 | 10.0 | 8.7 | 8.1 | 7.8 | 7.5 | 7.3 | 7.2 | 7.0 | 6.9 |
| SD | 0.9 | 0.2 | 0.2 | 0.3 | 0.3 | 0.3 | 0.4 | 0.4 | 0.4 | 0.4 |
| IPDI-15% | 30.7 | 11.2 | 9.6 | 9.0 | 8.6 | 8.3 | 8.1 | 7.9 | 7.7 | 7.6 |
| SD | 1.7 | 0.1 | 0.1 | 0.1 | 0.1 | 0.1 | 0.1 | 0.1 | 0.1 | 0.2 |
| IPDI-20% | 41.5 | 13.4 | 11.5 | 10.6 | 10.0 | 9.7 | 9.4 | 9.2 | 9.0 | 8.8 |
| SD | 0.9 | 0.2 | 0.1 | 0.1 | 0.1 | 0.1 | 0.1 | 0.1 | 0.1 | 0.2 |
| PSU/Cycle | 1 | 2 | 3 | 4 | 5 | 6 | 7 | 8 | 9 | 10 |
|---|---|---|---|---|---|---|---|---|---|---|
| MDI-1.5% | 32.0 | 22.1 | 19.9 | 19.1 | 18.8 | 18.5 | 18.3 | 18.1 | 17.9 | 17.8 |
| SD | 1.5 | 1.1 | 0.6 | 0.7 | 0.7 | 0.7 | 0.7 | 0.6 | 0.7 | 0.8 |
| CHDI-1.0% | 37.4 | 20.6 | 17.9 | 16.6 | 15.9 | 15.3 | 14.7 | 14.3 | 13.8 | 13.1 |
| SD | 0.9 | 0.5 | 0.5 | 0.4 | 0.3 | 0.3 | 0.3 | 0.3 | 0.3 | 0.3 |

Appendix F. Film Thicknesses of Polydimethylsiloxane-Based PUr Elastomers Used for UV–Vis Spectroscopy
| PSU | Film Thickness (mm) |
|---|---|
| H12MDI-1.6% | 0.36 |
| H12MDI-5% | 0.33 |
| H12MDI-10% | 0.36 |
| H12MDI-15% | 0.34 |
| H12MDI-20% | 0.35 |
| IPDI-1.4% | 0.34 |
| IPDI-5% | 0.35 |
| IPDI-10% | 0.35–0.36 |
| IPDI-15% | 0.35–0.36 |
| IPDI-20% | 0.36 |
| MDI-1.5% | 0.35 |
| CHDI-1.0% | 0.36 |
References
- Huang, S.-L.; Chao, M.-S.; Ruaan, R.-C.; Lai, J.-Y. Microphase separated structure and protein adsorption of polyurethanes with butadiene soft segment. Eur. Polym. J. 2000, 36, 285–294. [Google Scholar] [CrossRef]
- Kang, J.; Erdodi, G.; Brendel, C.M.; Ely, D.; Kennedy, J.P. Polyisobutylene-based polyurethanes. V. Oxidative-hydrolytic stability and biocompatibility. J. Polym. Sci. Part A Polym. Chem. 2010, 48, 2194–2203. [Google Scholar] [CrossRef]
- Zdrahala, R.J.; Zdrahala, I.J. Biomedical Applications of Polyurethanes: A Review of Past Promises, Present Realities, and a Vibrant Future. J. Biomater. Appl. 1999, 14, 67–90. [Google Scholar] [CrossRef] [PubMed]
- Gunatillake, P.A.; Meijs, G.F. Polyurethanes in Biomedical Engineering. In Encyclopedia of Materials: Science and Technology, 2nd ed.; Buschow, K.H.J., Cahn, R.W., Flemings, M.C., Ilschner, B., Kramer, E.J., Mahajan, S., Veyssiere, P., Eds.; Elsevier: Oxford, UK, 2001; pp. 7746–7752. [Google Scholar]
- Wang, W.; Wang, C. Polyurethane for biomedical applications: A review of recent developments. In Design and Manufacture of Medical Devices; Davim, J.P., Ed.; Woodhead Publishing: Sawston, UK, 2012; pp. 115–151. [Google Scholar]
- Ward, R.S.; Jones, R.L. Polyurethanes and Silicone Polyurethane Copolymers. In Comprehensive Biomaterials; Ducheyne, P., Ed.; Elsevier: Oxford, UK, 2011; pp. 431–477. [Google Scholar]
- Simmons, A.; Padsalgikar, A.D.; Ferris, L.M.; Poole-Warren, L.A. Biostability and biological performance of a PDMS-based polyurethane for controlled drug release. Biomaterials 2008, 29, 2987–2995. [Google Scholar] [CrossRef] [PubMed]
- Sivak, W.N.; Zhang, J.; Petoud, S.; Beckman, E.J. Simultaneous drug release at different rates from biodegradable polyurethane foams. Acta Biomater. 2009, 5, 2398–2408. [Google Scholar] [CrossRef]
- Jiang, J.; Fu, Y.; Zhang, Q.; Zhan, X.; Chen, F. Novel amphiphilic poly(dimethylsiloxane) based polyurethane networks tethered with carboxybetaine and their combined antibacterial and anti-adhesive property. Appl. Surf. Sci. 2017, 412, 1–9. [Google Scholar] [CrossRef]
- Nowatzki, P.J.; Koepsel, R.R.; Stoodley, P.; Min, K.; Harper, A.; Murata, H.; Donfack, J.; Hortelano, E.R.; Ehrlich, G.D.; Russell, A.J. Salicylic acid-releasing polyurethane acrylate polymers as anti-biofilm urological catheter coatings. Acta Biomater. 2012, 8, 1869–1880. [Google Scholar] [CrossRef]
- Moura, L.I.; Dias, A.M.; Carvalho, E.; De Sousa, H.C. Recent advances on the development of wound dressings for diabetic foot ulcer treatment—A review. Acta Biomater. 2013, 9, 7093–7114. [Google Scholar] [CrossRef]
- Duxbury, P.J.; Harvey, J.R. Systematic review of the effectiveness of polyurethane-coated compared with textured silicone implants in breast surgery. J. Plast. Reconstr. Aesthetic Surg. 2016, 69, 452–460. [Google Scholar] [CrossRef]
- Bernacca, G.M.; Straub, I.; Wheatley, D.J. Mechanical and morphological study of biostable polyurethane heart valve leaflets explanted from sheep. J. Biomed. Mater. Res. 2002, 61, 138–145. [Google Scholar] [CrossRef]
- Heijkants, R.G.J.C.; Van Calck, R.V.; De Groot, J.H.; Pennings, A.J.; Schouten, A.J.; Van Tienen, T.G.; Ramrattan, N.; Buma, P.; Veth, R.P.H. Design, synthesis and properties of a degradable polyurethane scaffold for meniscus regeneration. J. Mater. Sci. Mater. Med. 2004, 15, 423–427. [Google Scholar] [CrossRef] [PubMed]
- Da Silva, G.R.; Junior, D.S.C.A.; Saliba, J.B.; Berdugo, M.; Goldenberg, B.T.; Naud, M.C.; Ayres, E.; Oréfice, R.L.; Cohen, F.B. Polyurethanes as supports for human retinal pigment epithelium cell growth. Int. J. Artif. Organs 2011, 34, 198–209. [Google Scholar] [CrossRef] [PubMed]
- Gunatillake, P.A.; Martin, D.J.; Meijs, G.F.; McCarthy, S.J.; Adhikari, R. Designing biostable polyurethane elastomers for biomedical implants. Aust. J. Chem. 2003, 56, 545–557. [Google Scholar] [CrossRef]
- Yang, J.; Gao, Y.; Li, J.; Ding, M.; Chen, F.; Tan, H.; Fu, Q. Synthesis and microphase separated structures of polydimethylsiloxane/polycarbonate-based polyurethanes. RSC Adv. 2013, 3, 8291–8297. [Google Scholar] [CrossRef]
- Adhikari, R.; Gunatillake, P.A.; McCarthy, S.J.; Meijs, G.F. Mixed macrodiol-based siloxane polyurethanes: Effect of the comacrodiol structure on properties and morphology. J. Appl. Polym. Sci. 2000, 78, 1071–1082. [Google Scholar] [CrossRef]
- Martin, D.J.; Warren, L.A.; Gunatillake, P.A.; McCarthy, S.J.; Meijs, G.F.; Schindhelm, K. Polydimethylsiloxane/polyether-mixed macrodiol-based polyurethane elastomers: Biostability. Biomaterials 2000, 21, 1021–1029. [Google Scholar] [CrossRef]
- CSIRO. Elast-Eon™ Biocompatible Polyurethane. 2008. Available online: https://csiropedia.csiro.au/elast-eon-biocompatible-polyurethane/ (accessed on 1 August 2018.).
- Yilgör, I.; Yilgör, E.; Wilkes, G.L. Critical parameters in designing segmented polyurethanes and their effect on morphology and properties: A comprehensive review. Polymer 2015, 58, A1–A36. [Google Scholar] [CrossRef]
- Yilgor, E.; Eynur, T.; Bakan, M.; Yilgor, I.; Wilkes, G.L. Contribution of soft segment entanglement on the tensile properties of silicone-urea copolymers with low hard segment contents. Polymer 2009, 50, 4432–4437. [Google Scholar] [CrossRef]
- Adhikari, R.; Gunatillake, P.A.; Meijs, G.F.; McCarthy, S.J. The effect of diisocyanate isomer composition on properties and morphology of polyurethanes based on 4,4′-dicyclohexyl methane diisocyanate and mixed macrodiols (PDMS–PHMO). J. Appl. Polym. Sci. 1999, 73, 573–582. [Google Scholar] [CrossRef]
- Saralegi, A.; Exteberria, A.; Fernándes-d’Arlas, B.; Mondragon, I.; Eceiza, A.; Corcuera, M.A. Effect of H12MDI isomer composition on mechanical and physico-chemical properties of polyurethanes based on amorphous and semicrystalline soft segments. Polym. Bull. 2013, 70, 2193–2210. [Google Scholar] [CrossRef]
- Joseph, M.D.; Savina, M.R.; Harris, R.F. Effects on properties of varying the cis/trans isomer distribution in polyurethane elastomers made with 1,4-cyclohexane diisocyanate. J. Appl. Polym. Sci. 1992, 44, 1125–1133. [Google Scholar] [CrossRef]
- Prisacariu, C.; Buckley, C.P.; Caraculacu, A.A. Mechanical response of dibenzyl-based polyurethanes with diol chain extension. Polymer 2005, 46, 3884–3894. [Google Scholar] [CrossRef]
- Prisacariu, C.; Scortanu, E. Effect of Increasing the Hard Segment Percentage on the Mechanical Response of Selected Polyurethane Films. High Perform. Polym. 2010, 22, 876–887. [Google Scholar] [CrossRef]
- Das, S.; Cox, D.F.; Wilkes, G.L.; Klinedinst, D.B.; Yilgor, I.; Yilgor, E.; Beyer, F.L. Effect of Symmetry and H-bond Strength of Hard Segments on the Structure-Property Relationships of Segmented, Nonchain Extended Polyurethanes and Polyureas. J. Macromol. Sci. Part B 2007, 46, 853–875. [Google Scholar] [CrossRef]
- Yilgor, I.; Yilgor, E. Structure-Morphology-Property Behavior of Segmented Thermoplastic Polyurethanes and Polyureas Prepared without Chain Extenders. Polym. Rev. 2007, 47, 487–510. [Google Scholar] [CrossRef]
- Sami, S.; Yildirim, E.; Yurtsever, M.; Yurtsever, E.; Yilgor, E.; Yilgor, I.; Wilkes, G.L. Understanding the influence of hydrogen bonding and diisocyanate symmetry on the morphology and properties of segmented polyurethanes and polyureas: Computational and experimental study. Polymer 2014, 55, 4563–4576. [Google Scholar] [CrossRef]
- Yildirim, E.; Yurtsever, M. The role of diisocyanate and soft segment on the intersegmental interactions in urethane and urea based segmented copolymers: A DFT study. Comput. Theor. Chem. 2014, 1035, 28–38. [Google Scholar] [CrossRef]
- Riehle, N.; Thude, S.; Götz, T.; Kandelbauer, A.; Thanos, S.; Tovar, G.E.; Lorenz, G. Influence of PDMS molecular weight on transparency and mechanical properties of soft polysiloxane-urea-elastomers for intraocular lens application. Eur. Polym. J. 2018, 101, 190–201. [Google Scholar] [CrossRef]
- Riehle, N.; Maurus, M.A.; Tovar, G.E.M.; Lorenz, G. Data on the synthesis of trans-1,4-cyclohexane diisocyanate from 1,4-cyclohexane dicarboxylic acid. Data Brief. prepared for publication.
- Riehle, N.; Götz, T.; Kandelbauer, A.; Tovar, G.E.M.; Lorenz, G. Data on the synthesis and mechanical characterization of polysiloxane-based urea-elastomers prepared from amino-terminated polydimethylsiloxanes and polydimethyl-methyl-phenyl-siloxane-copolymers. Data Brief 2018, 18, 1784–1794. [Google Scholar] [CrossRef]
- Riehle, N.; Thude, S.; Kandelbauer, A.; Tovar, G.E.M.; Lorenz, G. Synthesis of Soft Polysiloxane-urea Elastomers for Intraocular Lens Application. J. Vis. Exp. 2019, 145, e58590. [Google Scholar] [CrossRef] [PubMed]
- Deutsches Institut für Normung e.V. Prüfung von Kautschuk und Elastomeren–Bestimmung von Reißfestigkeit, Zugfestigkeit, Reißdehnung und Spannungswerten im Zugversuch; Beuth Verlag GmbH: Berlin, Germany, 2017. (In German) [Google Scholar]
- Deutsches Institut für Normung e.V. Biologische Beurteilung von Medizinprodukten-Teil 5: Prüfungen Auf In-vitro-Zytotoxizität; Beuth Verlag GmbH: Berlin, Germany, 2009. (In German) [Google Scholar]
- Yılgör, E.; Yılgör, İ. Hydrogen bonding: A critical parameter in designing silicone copolymers. Polymer 2001, 42, 7953–7959. [Google Scholar] [CrossRef]
- Barton, A.F.M. CRC Handbook of Solubility Parameters and Other Cohesion Parameters, 2nd ed.; CRC Press: Boca Raton, FL, USA, 1991. [Google Scholar]
- Versteegen, R.M.; Sijbesma, R.P.; Meijer, E.W. Synthesis and Characterization of Segmented Copoly(ether urea)s with Uniform Hard Segments. Macromolecules 2005, 38, 3176–3184. [Google Scholar] [CrossRef]
- Prisacariu, C. Polyurethane Elastomers-From Morphology to Mechanical Aspects; Springer: Vienna, Austria, 2011. [Google Scholar]
- Dearth, R.; Mertes, H.; Jacobs, P. An overview of the structure/property relationship of coatings based on 4,4′-dicyclohexylmethane diisocyanate (H12MDI). Prog. Org. Coat. 1996, 29, 73–79. [Google Scholar] [CrossRef]
- Hatada, K.; Ute, K.; Oka, K.I.; Pappas, S.P. Unambiguous 13C-NMR assignments for isocyanate carbons of isophorone diisocyanate and reactivity of isocyanate groups in Z- and E-stereoisomers. J. Polym. Sci. Part A Polym. Chem. 1990, 28, 3019–3027. [Google Scholar] [CrossRef]
- Cionni, R.J. Intraocular lenses to restore and preserve vision following cataract surgery. In Essentials in Ophthalmology-Cataract and Refractive Surgery; Kohnen, T., Koch, D.D., Eds.; Springer: Berlin/Heidelberg, Germany, 2006; pp. 3–9. [Google Scholar]
- Yilgör, E.; Burgaz, E.; Yurtsever, E.; Yilgör, I. Comparison of hydrogen bonding in polydimethylsiloxane and polyether based urethane and urea copolymers. Polymer 2000, 41, 849–857. [Google Scholar] [CrossRef]
- Bozukova, D.; Pagnoulle, C.; Jérôme, R.; Jérôme, C. Polymers in modern ophthalmic implants-Historical background and recent advances. Mater. Sci. Eng. R Rep. 2010, 69, 63–83. [Google Scholar] [CrossRef]
- Rosu, D.; Rosu, L.; Cascaval, C.N. IR-change and yellowing of polyurethane as a result of UV irradiation. Polym. Degrad. Stab. 2009, 94, 591–596. [Google Scholar] [CrossRef]
- Versteegen, R.M.; Kleppinger, R.R.; Sijbesma, A.R.P.; Meijer, E.B. Properties and Morphology of Segmented Copoly(ether urea)s with Uniform Hard Segments. Macromolecules 2006, 39, 772–783. [Google Scholar] [CrossRef]
- Arun, A.; Baack, K.K.; Gaymans, R. Polyurethane tri-block copolymers—Synthesis, mechanical, elastic, and rheological properties. Polym. Eng. Sci. 2009, 50, 747–755. [Google Scholar] [CrossRef]
- De, D.; Gaymans, R. Thermoplastic Polyurethanes with TDI-Based Monodisperse Hard Segments. Macromol. Mater. Eng. 2009, 294, 405–413. [Google Scholar] [CrossRef]
- Wittbecker, E.L.; Houtz, R.C.; Watkins, W.W. Elastic N-Substituted Polyamides. Ind. Eng. Chem. 1948, 48, 875–879. [Google Scholar] [CrossRef]
- Ertem, S.P.; Yilgor, E.; Kosak, C.; Wilkes, G.L.; Zhang, M.; Yilgor, I. Effect of soft segment molecular weight on tensile properties of poly(propylene oxide) based polyurethaneureas. Polymer 2012, 53, 4614–4622. [Google Scholar] [CrossRef]
- Jewrajka, K.S.; Yilgor, E.; Yilgor, I.; Kennedy, J.P. Polyisobutylene-based segmented polyureas. I. Synthesis of hydrolytically and oxidatively stable polyureas. J. Polym. Sci. Part A Polym. Chem. 2009, 47, 38–48. [Google Scholar] [CrossRef]
- Buckwalter, J.D.; Zhang, M.; Inglefield, D.L.; Moore, R.B.; Long, T.E. Synthesis and characterization of siloxane-containing poly(urea oxamide) segmented copolymers. Polymer 2013, 54, 4849–4857. [Google Scholar] [CrossRef]
- Buckwalter, D.J.; Inglefield, D.L.; Enokida, J.S.; Hudson, A.G.; Moore, R.B.; Long, T.E. Effects of Copolymer Structure on the Mechanical Properties of Poly(dimethyl siloxane) Poly(oxamide) Segmented Copolymers. Macromol. Chem. Phys. 2013, 214, 2073–2082. [Google Scholar] [CrossRef]
- Yilgor, I.; Eynur, T.; Bilgin, S.; Yilgor, E.; Wilkes, G.L. Influence of soft segment molecular weight on the mechanical hysteresis and set behavior of silicone-urea copolymers with low hard segment contents. Polymer 2011, 52, 266–274. [Google Scholar] [CrossRef]
- Hellgeth, J.W.; Ward, T.C. Mechanical hysteresis of a polyether polyurethane thermoplastic elastomer. Polym. Eng. Sci. 1993, 33, 1170–1176. [Google Scholar]
- Caracciolo, P.C.; Buffa, F.; Abraham, G.A. Effect of the hard segment chemistry and structure on the thermal and mechanical properties of novel biomedical segmented poly(esterurethanes). J. Mater. Sci. Mater. Med. 2009, 20, 145–155. [Google Scholar] [CrossRef]
- Yildirim, E.; Yurtsever, M.; Wilkes, G.L.; Yilgör, I. Effect of intersegmental interactions on the morphology of segmented polyurethanes with mixed soft segments: A coarse-grained simulation study. Polymer 2016, 90, 204–214. [Google Scholar] [CrossRef]
- Kuo, A.C.M. Polydimethylsiloxanes. In Polymer Data Handbook; Mark, J.E., Ed.; Oxford University Press: Oxford, UK, 2009; pp. 411–435. [Google Scholar]
- Adhikari, R.; Gunatillake, P.A.; McCarthy, S.J.; Meijs, G.F. Low-modulus siloxane-based polyurethanes. I. Effect of the chain extender 1,3-bis(4-hydroxybutyl)1,1,3,3-tetramethyldisiloxane (BHTD) on properties and morphology. J. Appl. Polym. Sci. 2001, 83, 736–746. [Google Scholar] [CrossRef]
- Adhikari, R.; Gunatillake, P.A.; McCarthy, S.J.; Bown, M.; Meijs, G.F. Low-modulus siloxane-polyurethanes. Part II. Effect of chain extender structure on properties and morphology. J. Appl. Polym. Sci. 2003, 87, 1092–1100. [Google Scholar] [CrossRef]
- Yildirim, E.; Yurtsever, M.; Yurtsever, E.; Yilgor, I.; Yilgor, E. Multiscale Modeling of the Morphology and Properties of Segmented Silicone-Urea Copolymers. J. Inorg. Organomet. Polym. Mater. 2012, 22, 604–616. [Google Scholar] [CrossRef]
- Abouzahr, S.; Wilkes, G.; Ophir, Z. Structure-property behaviour of segmented polyether-MDI-butanediol based urethanes: Effect of composition ratio. Polymer 1982, 23, 1077–1086. [Google Scholar] [CrossRef]
- Wang, C.B.; Cooper, S.L. Morphology and properties of segmented polyether polyurethane ureas. Macromolecules 1983, 16, 775–786. [Google Scholar] [CrossRef]
- Neira-Velázques, M.G.; Rodríguez-Hernández, M.T.; Ernesto, H.-H.; Ruiz-Martínez, A.R.Y. Polymer Molecular Weight Measurement. In Handbook of Polymer Synthesis, Characterization, and Processing; John Wiley & Sons: Hoboken, NJ, USA, 2013. [Google Scholar]
- Gurunathan, T.; Mohanty, S.; Nayak, S.K. Isocyanate terminated castor oil-based polyurethane prepolymer: Synthesis and characterization. Prog. Org. Coat. 2015, 80, 39–48. [Google Scholar] [CrossRef]
- Wachholz, S.; Keidel, F.; Just, U.; Geissler, H.; Käppler, K. Analysis of a mixture of linear and cyclic siloxanes by cryo-gas chromatography-Fourier transform infrared spectroscopy and gas chromatography-mass spectrometry. J. Chromatogr. A 1995, 693, 89–99. [Google Scholar] [CrossRef]


| PDMS 1 | Molar Ratio (D4/APTMDS) | Conversion (%) | Theoretical 2 (g·mol−1) | Titration 3 (g·mol−1) |
|---|---|---|---|---|
| PDMS (H12MDI/IPDI) | 60.6/1.0 | 88.8 | 16,175 | 16,338 |
| PDMS (MDI) | 60.5/1.0 | 88.0 | 16,013 | 16,296 |
| PDMS (CHDI) | 60.6/1.0 | 89.5 | 16,295 | 16,472 |
| PSU | Molar Ratio (PDMS/NCO/CE) | SEC (×103 g·mol−1) | SEC (×103 g·mol−1) | PDI | Intrinsic Viscosity [η] (dL·g−1) 1 | HS 2 (g·mol−1) |
|---|---|---|---|---|---|---|
| PSU H12MDI-1.6% * | 1.0/1.0/0.0 | 553 | 1185 | 2.14 | 1.05 | 295 |
| PSU H12MDI-5% | 1.0/2.2/1.2 | 547 | 1314 | 2.33 | 0.77 | 892 |
| PSU H12MDI-10% | 1.0/4.0/3.0 | 441 | 859 | 1.95 | n.a # | 1848 |
| PSU H12MDI-15% | 1.0/6.1/5.1 | 401 | 832 | 2.07 | n.a # | 2915 |
| PSU H12MDI-20% | 1.0/8.5/7.5 | 314 | 707 | 2.26 | n.a # | 4116 |
| PSU IPDI-1.4% * | 1.0/1.0/0.0 | 675 | 1498 | 2.22 | 1.06 | 257 |
| PSU IPDI-5% | 1.0/2.4/1.4 | 487 | 1046 | 2.15 | 0.86 | 892 |
| PSU IPDI-10% | 1.0/4.4/3.4 | 319 | 631 | 1.98 | 0.65 | 1849 |
| PSU IPDI-15% | 1.0/6.7/5.7 | 245 | 506 | 2.06 | 0.48 | 2916 |
| PSU IPDI-20% | 1.0/9.2/8.2 | 116 | 288 | 2.48 | 0.32 | 4126 |
| PSU MDI-1.5% * | 1.0/1.0/0.0 | 635 | 1853 | 2.92 | 1.16 | 285 |
| PSU CHDI-1.0% * | 1.0/1.0/0.0 | 403 | 829 | 2.06 | 0.77 | 194 |
| PSU (Elongation)/Cycle | 1 | 2 | 3 | 10 |
|---|---|---|---|---|
| H12MDI-1.6% (100%) | 24 | 16 | 16 | 15 |
| H12MDI-1.6% (300%) | 24 | 17 | 16 | 15 |
| H12MDI-5% (100%) | 11 | 7 | 6 | 5 |
| H12MDI-5% (300%) | 21 | 12 | 11 | 9 |
| H12MDI-10% (100%) | 9 | 4 | 3 | 3 |
| H12MDI-10% (300%) | 21 | 10 | 8 | 7 |
| H12MDI-15% (100%) | 12 | 4 | 3 | 3 |
| H12MDI-15% (300%) | 29 | 11 | 9 | 7 |
| H12MDI-20% (100%) | 28 | 5 | 5 | 4 |
| H12MDI-20% (300%) | 28 | 10 | 9 | 7 |
| PSU (Elongation)/Cycle | 1 | 2 | 3 | 10 |
|---|---|---|---|---|
| IPDI-1.4% (100%) | 34 | 21 | 20 | 20 |
| IPDI-1.4% (300%) | 26 | 18 | 17 | 16 |
| IPDI-5% (100%) | 17 | 10 | 9 | 8 |
| IPDI-5% (300%) | 27 | 15 | 13 | 11 |
| IPDI-10% (100%) | 10 | 5 | 4 | 3 |
| IPDI-10% (300%) | 25 | 10 | 9 | 7 |
| IPDI-15% (100%) | 13 | 5 | 4 | 3 |
| IPDI-15% (300%) | 31 | 11 | 10 | 8 |
| IPDI-20% (100%) | 22 | 8 | 7 | 5 |
| IPDI-20% (300%) | 42 | 13 | 12 | 9 |
| PSU (Elongation)/Cycle | 1 | 2 | 3 | 10 |
|---|---|---|---|---|
| H12MDI-1.6% (100%) | 24 | 16 | 16 | 15 |
| H12MDI-1.6% (300%) | 24 | 17 | 16 | 15 |
| IPDI-1.4% (100%) | 34 | 21 | 20 | 20 |
| IPDI-1.4% (300%) | 26 | 18 | 17 | 16 |
| MDI-1.5% (100%) | 23 | 16 | 15 | 14 |
| MDI-1.5% (300%) | 32 | 22 | 20 | 18 |
| CHDI-1.0% (100%) | 19 | 12 | 11 | 9 |
| CHDI-1.0% (300%) | 37 | 21 | 18 | 13 |
Publisher’s Note: MDPI stays neutral with regard to jurisdictional claims in published maps and institutional affiliations. |
© 2021 by the authors. Licensee MDPI, Basel, Switzerland. This article is an open access article distributed under the terms and conditions of the Creative Commons Attribution (CC BY) license (http://creativecommons.org/licenses/by/4.0/).
Share and Cite
Riehle, N.; Athanasopulu, K.; Kutuzova, L.; Götz, T.; Kandelbauer, A.; Tovar, G.E.M.; Lorenz, G. Influence of Hard Segment Content and Diisocyanate Structure on the Transparency and Mechanical Properties of Poly(dimethylsiloxane)-Based Urea Elastomers for Biomedical Applications. Polymers 2021, 13, 212. https://doi.org/10.3390/polym13020212
Riehle N, Athanasopulu K, Kutuzova L, Götz T, Kandelbauer A, Tovar GEM, Lorenz G. Influence of Hard Segment Content and Diisocyanate Structure on the Transparency and Mechanical Properties of Poly(dimethylsiloxane)-Based Urea Elastomers for Biomedical Applications. Polymers. 2021; 13(2):212. https://doi.org/10.3390/polym13020212
Chicago/Turabian StyleRiehle, Natascha, Kiriaki Athanasopulu, Larysa Kutuzova, Tobias Götz, Andreas Kandelbauer, Günter E. M. Tovar, and Günter Lorenz. 2021. "Influence of Hard Segment Content and Diisocyanate Structure on the Transparency and Mechanical Properties of Poly(dimethylsiloxane)-Based Urea Elastomers for Biomedical Applications" Polymers 13, no. 2: 212. https://doi.org/10.3390/polym13020212
APA StyleRiehle, N., Athanasopulu, K., Kutuzova, L., Götz, T., Kandelbauer, A., Tovar, G. E. M., & Lorenz, G. (2021). Influence of Hard Segment Content and Diisocyanate Structure on the Transparency and Mechanical Properties of Poly(dimethylsiloxane)-Based Urea Elastomers for Biomedical Applications. Polymers, 13(2), 212. https://doi.org/10.3390/polym13020212