Abstract
The emergence of micro and nano-based inorganic oxide fillers with optimal filler-loadings further enhances the required insulation characteristics of neat epoxy. During manufacturing and service application, insulators and dielectrics face mechanical stresses which may alter their basic characteristics. Keeping this in mind, the facts’ influence of mechanical stresses and fillers on dielectric properties of polymeric insulators of two epoxy/silica composites were fabricated and thoroughly analyzed for dielectric characteristics under ramped mechanical compressions relative to the unfilled sample. Before compression, epoxy nanocomposites exhibited responses having an average dielectric constant of 7.68 with an average dissipation factor of 0.18. After each compression, dielectric properties of all samples were analyzed. The dissipation factor and the dielectric constant trends of each sample are plotted against a suitable frequency range. It was observed that after the successive compressions up to 25 MPa, the dielectric properties of epoxy micro-silica composites were highly affected, having an average final dielectric constant of 9.65 times that of the uncompressed sample and a dissipation factor of 2.2 times that of the uncompressed sample, and these were recorded.
1. Introduction
Polymeric insulators and dielectrics have been extensively utilized in electrical insulation and dielectric applications due to their superior properties over the conventional ceramic insulators, such as light in weight, flexibility in nature, ease of installation, low maintenance, low cost, higher tensile strength, and higher dielectric strength [1,2,3]. The dielectric behavior of polymeric dielectrics is of utmost importance for usage in energy storage applications [4]. Mechanical stresses significantly influence the dielectric properties of polymeric dielectrics [5,6]. Ramy et al. studied the effect of mechanical stresses on polymeric-insulating materials and concluded that electric field strength decreased significantly due to mechanical stresses. Shen et al. [7] studied the impact of hydrostatic compression on nano carbon-filled epoxy composites and deduced a decrease in electrical resistance due to decrement in the tunneling gap. Khattak et al. [8] studied the dielectric behavior of epoxy silica micro and nanocomposites at 15 MPa pressure. It was concluded that compression increased the dielectric constant and dissipation factor of all the composites. Shen et al. [9] conducted a study on dielectric properties of SnO2 under high pressure and found that the dielectric constant and loss tangent decreased with increasing frequency. Authors of [10] studied the effects of mechanical stresses on polymeric materials and concluded that all the critical phenomena, including a decrease of dielectric strength, electrical tree growth, accumulated damage, space charge accumulation, etc., in insulating polymer materials are significantly influenced by internal (residual) and external mechanical stresses. In another study, it was concluded that mechanical stresses alter the dielectric properties of epoxy due to the change of tetragonal orthorhombic structures of epoxy into cubic structures [11]. Epoxy is known for its remarkable dielectric properties and mechanical resilience [12,13]. However, pristine epoxy expresses degradation in dielectric properties due to mechanical stresses. To mitigate the effect of mechanical compression on epoxy, its composites with inorganic fillers are recommended. Inorganic fillers not only increase the mechanical strength but also improve the dielectric properties of epoxy [14,15]. Various inorganic oxide filler-based composites, for example, zinc oxide, titania, and alumina, are used to improve the dielectric characteristics of the neat epoxy [16,17]. This prompts the replacements of neat epoxy by its composites in electrical insulation and as dielectrics. So far, less study has been undertaken on dielectric properties of epoxy composites and their correlation to the compression. Single compression effects on the dielectric behavior of epoxy and its composite are not enough to understand the influence of compression on dielectric properties of epoxy. This is of utmost importance and will give detailed insights into the function of compressions with dielectric properties of neat epoxy, nano, and microcomposites.
Keeping in mind the above motivation, the purpose of this study is to explore the dielectric response of epoxy–silica nano and microcomposites, as well as their impact on multiple increasing successive compressions.
Preparation of Nanocomposite
Bisphenol-A (DGEBA) (Eposchon®) resin diglycidyl ether, cycloaliphatic amine (EPH 555®) hardener, and 189 ± 5 g (equivalent to 86 g/eq of amine hydrogen) of epoxy were utilized. Justus Kimia Raya, Indonesia, provided both the resin and the hardener. Degussa, USA, provided Nanosilica (AEROSIL® 200) with an average particle size of 12 nm with 200 m2/g of surface area. Micro-silica with an average particle size of 5 µm was used and it was provided by NewReach chemicals, Wuhan, China.
The surface functionalization of silica was achieved with silane, which was provided by (DOW CORNING ® Z-6040, Midland, TX, USA), whiles the solvent ethanol was obtained from Sigma-Aldrich® from the United States. Surface functionalization was performed to achieve better filler-polymer interaction. The schematic of the functionalization process is shown in Figure 1. For preventing clinging, silica was poured and scattered into the ethanol. The mixture was placed for 1.5 h in an ultrasonic bath to obtain optimum dispersion. Using a high-shear mixer with a rotating speed of 3600 revolutions per minute, the epoxy resin was added in the mixture. The solution was then returned to the ultrasonic bath for another 30 min. Then, hardener was added into the mixture and it was rotated in the shear mixer at 7200 revolutions per minute for 30 min. Then, the solution was vacuum-sealed at temperatures over the boiling point of ethanol to allow for all the ethanol to be evaporated. The slurry was kept in vacuum at 27 mmHg for degassing and debubbling for 15 min. In the following stage, the mixture was moved to castings and kept for 24 h at 25 °C. In the last stage, samples were cured for approximately 4 h. The prepared samples have an 80-mm diameter and a 3-mm thickness. Table 1 shows a list of the prepared samples with their codes.
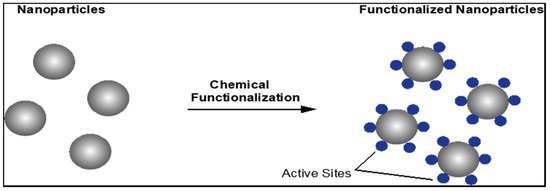
Figure 1.
Schematic of the functionalization of nanoparticles.

Table 1.
Synthesized epoxy composites.
2. Measurements and Methods
2.1. Dielectric Properties Measurement
The dielectric constant (ĸ) can be defined as:
The capacitance of a capacitor may be determined using the relation:
where, A = area of the capacitor plate;
ε = permittivity; and
d = thickness of the dielectric.
As a result, the dielectric constant (ĸ) can be calculated by dividing the capacitance of the capacitor with a dielectric material (Cm) by the value of the capacitance (C0) with air medium, expressed as:
To measure dielectric properties, the LCR meter 7600 Plus with a dielectric cell LD-3 from IET Labs, USA, was utilized.
2.2. Compression Setup and Conditions
Mechanical compression setup was comprised of a CY-600D mounting press, made in China, connected with thermostats for controlled heating purposes. Epoxy composite samples were first heated at 700C and then compressed. The compression experiment was carried out with five constant increasing interval mechanical pressure steps, i.e., 5 MPa, 10 MPa, 15 MPa, 20 MPa, and 25 MPa. The schematic representation of the compression setup and its pictorial view are shown in Figure 2.
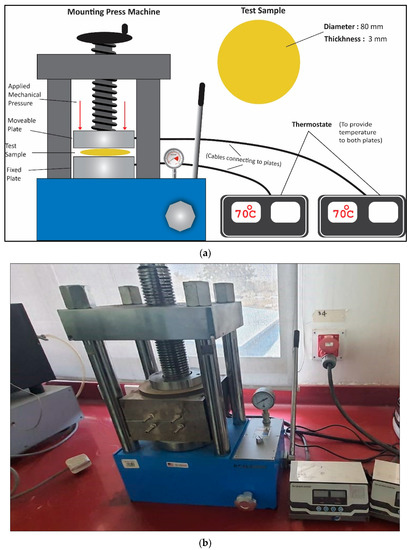
Figure 2.
Schematic diagram of the compression setup. (a,b) Photo of the compression setup and its pictorial view.
3. Results and Discussion
3.1. Results at Low Frequency
Capacitors drain their energy and any real-world capacitor may be thought of as an ideal capacitance linked in series to an equivalent series resistance (ESR). It is possible that the occurrence of ESR in a capacitor is caused by the dipole relaxation and electronic conduction in the dielectrics. The dissipation factor (DF) is used to indicate the purity of a capacitor and may be defined as the ratio of real power loss in the ESR to the reactive power fluctuating over the capacitive reactance (XC).
Mathematically,
For an AC supply with frequency f:
where, Cm = the capacitance in a medium.
Thus,
By combining Equations (4) and (5), we can deduce:
Equation (7) states that the DF varies as a function of the dielectric constant (ĸ) if any dielectric with specific ESR is exposed to an AC supply. As a result, the higher the dielectric constant (ĸ) for dielectrics, the greater the energy storage potential.
Lower k and a lower DF are needed for insulation purposes. It is quite challenging to estimate the reading of the capacitor’s real resistance at lower and higher frequencies. This is due the fact that at low frequencies, impedance is high, and at high frequencies, the displacement current is high. The LCR meter is unable to calculate the exact phase angle at lower frequencies because the impedance reaches a particular threshold value and hence the ESR values at lower frequencies are unreliable. Conversely, a high displacement current at higher frequencies is due to the lower series resistance. As a result, resistance calculated at these frequencies may not be equal to the real resistance. For best measurement accuracy, the desired impedance in the current case was in the range of 100 to 100 k. Consequently, measurements were anticipated to be more reliable at higher frequencies, while low frequency results were ambiguous. For example, Figure 3 shows incorrect findings in the whole range of 10 Hz to 2 MHz and the term ESRn represents normalized values that can be calculated by dividing the specific ESR of each sample by the maximum ESR.
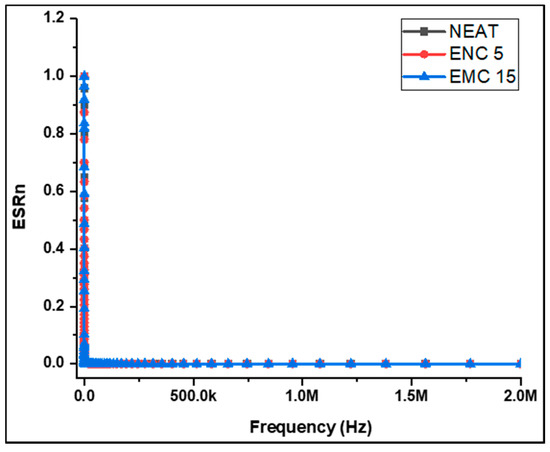
Figure 3.
ESRn values of the samples against the frequency range.
Below 20 kHz frequencies, an abrupt enhancement in normalized ESR varying with frequency was observed. This immediate rise can be associated with increases in impedance above the 100-kΩ limit. For these high impedances, the LCR meter cannot correctly calculate phase angles; therefore, both ESR and Xc should not be considered. In the case of the DF calculation, such impacts become even more prominent. As a result, the dielectric characteristics should be considered in a suitable frequency range in which the readings are reliable. Hence, for accurate measurements of DF and the dielectric constant ĸ, the test frequency range 60 kHz–2.0 MHz was selected.
3.2. Analysis in the Range of 60 kHz–2 MHz
Dielectric constants and the dissipation factor were recorded for the epoxy and its composites. Figure 4 depicts the effects of the addition of silica filler in the epoxy on the dielectric constant (ĸ). The dependency of the frequency of the dielectric constant (ĸ) was studied. The neat epoxy showed the lowest k with an average value of 4.14 and EMC 15 showed an average value of 4.68. Among all samples, ENC 5 exhibited the highest response with an average value of 7.68. Generally, the value of the dielectric constant (ĸ) increased with the silica loading. In case of EMC 15, however, a decrement in the dielectric constant was shown with the maximum concentration. This might be due to the smaller surface area of micro-silica, which resulted in poor dispersion of the filler.
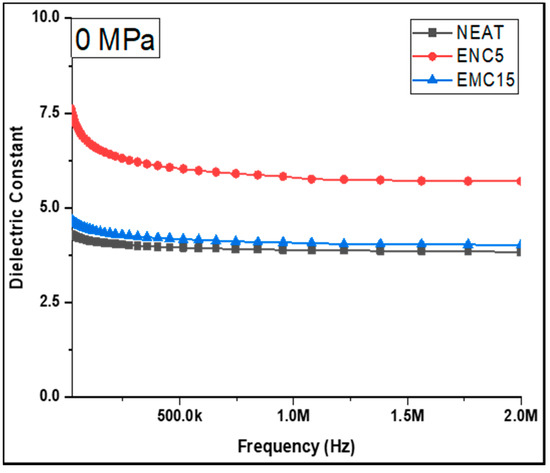
Figure 4.
Dielectric constant of the uncompressed samples.
Based on the foregoing findings, it can be established that the dielectric constant of the epoxy matrix can improve with the inclusion of silica filler. In comparison to micro-silica, however, this effect was more evident in nano-silica. This property of the epoxy–SiO2 combination can be ascribed to the fine dispersion of nano-silica and the enhancement of the surface area. In terms of the dissipation factor, Figure 5 illustrates the purity of the capacitive nature of the neat epoxy and its composites, demonstrating that DF increased as the test frequency increased. The explanation for this concerns a large reduction in the displacement current at lower frequencies. Similarly, a decrease in the dielectric constant was observed in conjunction with an increase in DF as frequency increased. The neat epoxy showed the lowest dissipation factor with an average of 0.03 and EMC 15 with an average value of 0.05. Furthermore, ENC 5 had an average DF of 0.18.
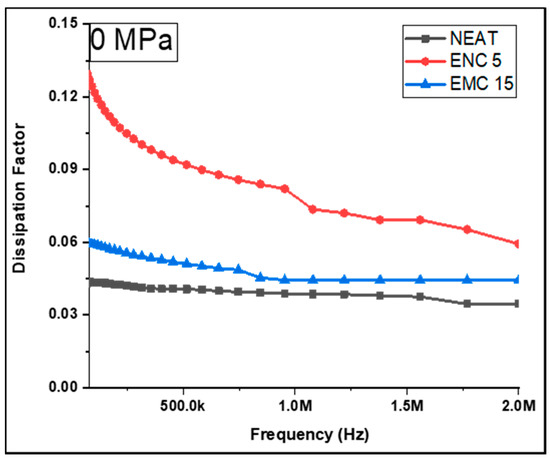
Figure 5.
Dissipation factor of the uncompressed samples.
It can be inferred from the above results that EMC 15 showed contradictory behavior due to restricted molecular level interactivity. Another cause of the contradictory response of EMC 15 could be the non-uniform distribution of the micro-filler and the filler–filler interactions, which leads to many voids with trapped air. Equation (4) is completely consistent with this response.
Due to the existence of an ample amount of silanol functional groups (Si-OH) at the surface of nano-silica, epoxy nanocomposites showed excellent dielectric responses contrary to the other samples. These silanol groups provided solidity to the overall epoxy matrix by providing strong binding with hydrogen. Hence, intactness of the overall epoxy composite system was achieved due to SiO2 nanoparticle and polymer interactivity at interaction regions [18,19]. In the case of the micro-composite (EMC 15), however, despite its 15% concentration, improvement in dielectric properties was not achieved because of the nine times or above silanol groups on the nanoparticles’ surface. This interprets the intent to keep low concentrations of nano-silica as compared to micro-silica to achieve improvements in the dielectric characteristics of the epoxy-silica composite system [20]. Furthermore, the concentration of nano-silica beyond 5% may create agglomeration and decrease the inter-filler distances due to these phenomenon-like significant properties of polymerics that may be compromised at higher nanofiller-loadings [21]. In a study carried out by M. Fairus [22], they investigated the dielectric strength of SiR/EPDM nanocomposites and reported that nanofiller concentrations above 5% caused agglomeration in the polymer matrix and enhanced mobile charge carriers, which eventually reduced the dielectric strength of nanocomposites. Conversely, the loading of micro-fillers can be enhanced above 40%, but increased filler-loadings may create significant impacts on inter-filler interactions which worsen dielectric properties and thermal stability [23,24]. Consequently, considering all the above constraints, an optimum loading of micro-fillers at about 10–20% can be used to restrain filler–filler interactivity [25,26].
3.3. Ramped Compression Effects
To explore the electromechanical characteristics of the epoxy–SiO2 system, the samples were compressed at multiple steps of pressures: 5 MPa, 10 MPa, 15 MPa, 20 MPa, and 25 MPa at 70 °C. After each compression step, the dielectric constant (ĸ) of all samples were evaluated and the comparative analysis of samples using graphical representation was investigated. Through all this experimental work, one trend can be clearly observed for all the working samples that dielectric constants irregularly enhanced by increasing compressive pressure. This trend, however, was more prominent in the case of micro-composites.
For comparison of all the samples, Figure 6 and Table 2 are presented, which show the average dielectric constants of samples against each compression step. In a similar manner, Figure 7 displays the trends of the dielectric constants of each sample at the chosen frequency range. For neat epoxy, at 5 and 10 MPa, the average dielectric constant remained almost the same, but at 15 MPa and 20 MPa, it improved 1.94 and 2.1 times, respectively, for the uncompressed sample. By applying 25 MPa, it increased 4.267 times for the uncompressed sample. Similarly, in the case of ENC 5, the dielectric constant at 10 MPa, 15 MPa, 20 MPa improved by 1.23, 2.09, and 2.487 times, respectively, as compared to the uncompressed sample, and at 25 MPa, the dielectric constant reached to 36.24, which is 4.718 times the uncompressed sample. The most irregular and prominent response could be seen in the case of EMC 15 as compared to other samples, where the average dielectric constant jumped to an average of 45.15 from 4.68 after successive mechanical pressures up to 25 MPa. The dielectric constant of the nanocomposite remained least affected by compression, contrary to the neat and micro-composite. This is because of the interaction of nano-silica with the polymer chains, which restricted the motion of the polymer chain, and the electrical polarization was not aided by the polymer chains [23,27,28]. In the case of the micro-composite, the relatively larger size of micro-silica did not achieve as good filler dispersion as compared to the nanocomposite, which left voids in the composite that began to deplete, and interfacial polarization enhanced by increasing mechanical pressures.
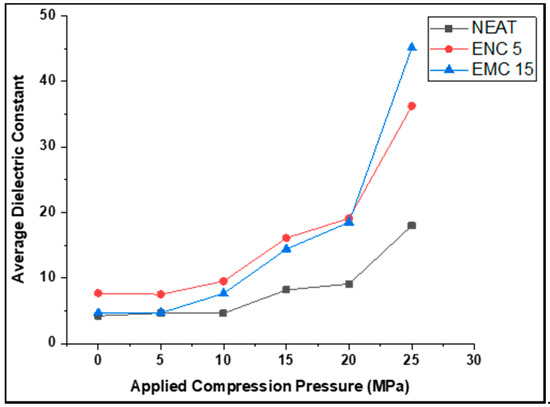
Figure 6.
Average dielectric constant of samples.
Table 2.
Average dielectric constant of samples at different pressures.
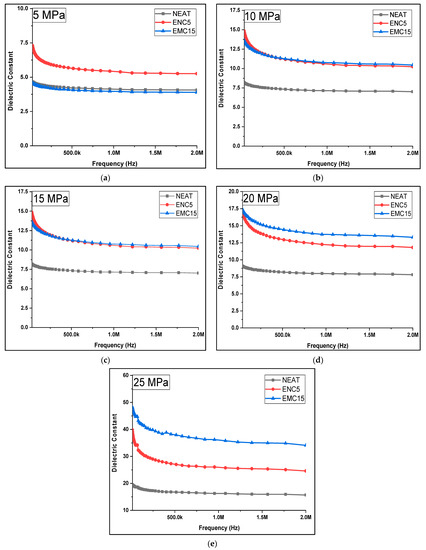
Figure 7.
Dielectric constant of samples after compressions at (a) 5 MPa, (b) 10 MPa, (c)15 MPa, (d) 20 MPa, and (e) 25 MPa.
The dissipation factor was recorded against the ramped compression. Figure 8 and Table 3 are given to demonstrate the calculated average dissipation factors of all the samples at the selected frequency range against the corresponding compression pressure, while Figure 9 shows the trends of the dissipation factor against the frequency range. It can be observed that almost a similar pattern was followed by dielectric constant (ĸ). There was less change in DF in the neat epoxy after each compression step. At 5 MPa and 10 MPa, DF remained same, but at 15 MPa, 20 MPa, and 25 MPa, it was increased to 0.04 from 0.03 as compared to the uncompressed. In the case of ENC 5, DF increased to 0.25 from 0.18 at 10 MPa and remained almost the same up to 25 MPa. In comparison to the uncompressed sample, a 1.33-times increase was recorded. In the case of EMC 15, DF was most affected by increasing mechanical compression and increased 2.2 times from 0.04 to 0.11. This could be attributed to the inhomogeneities of micro-fillers. The dissipation factor (dielectric loss) was influenced by the enhancement of interfacial polarization due to the presence of mobile ionic impurities [27,28].
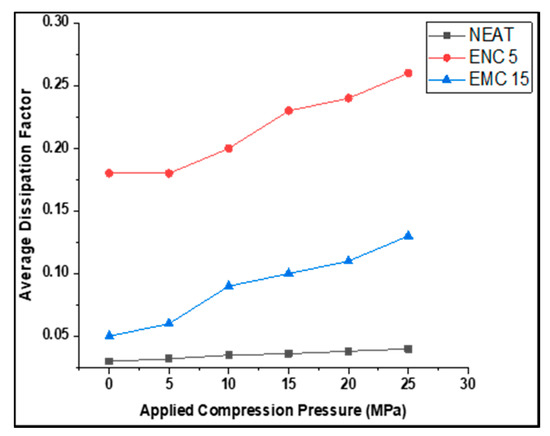
Figure 8.
Average dissipation factor of samples.
Table 3.
Average dissipation factor of samples at different pressures.
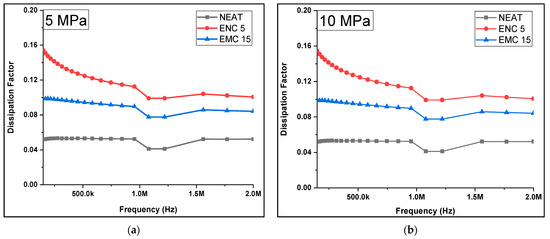
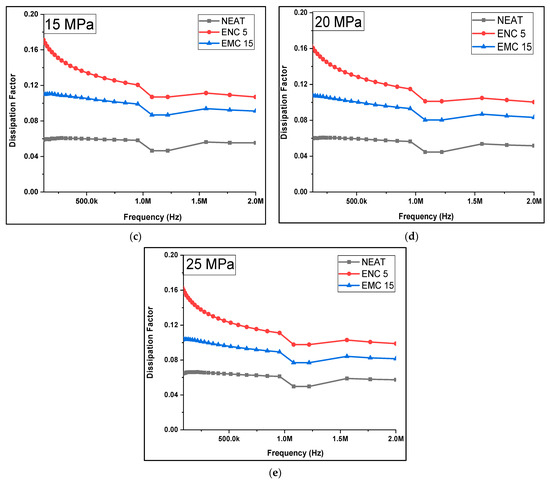
Figure 9.
Dissipation factor of samples after compressions at (a) 5 MPa, (b) 10 MPa, (c) 15 MPa, (d) 20 MPa, (e) 25 MPa.
Similar outcomes were also reported and prior literature on other classes of uncompressed epoxy composites such as in Singha et al. [23] stated high permittivity and tan delta values for Epoxy-TiO2/Zinc Oxide micro and nanocomposites, and concluded that interfacial properties are pivotal factor for the dielectric behavior of nanocomposites. Similarly, Yu, J. [29] obtained enhanced breakdown strength and dielectric constants for epoxy-alumina nanocomposites.
4. Conclusions
The dielectric characteristics of epoxy composites with nano and micro-silica fillers were investigated under mechanical pressures from 0 MPa to 25 MPa with ramped compression steps of 5 MPa at 70 °C. Before applying compressions, nanocomposites with 5% nano-silica (ENC 5) exhibited a maximum dielectric constant with an average of 7.68 and DF with an average of 0.18. After each compression step, the dielectric constant (ĸ) and dissipation factor (DF) of neat epoxy, epoxy-nanocomposite (ENC 5), and epoxy-micrcomposite (EMC 15) were measured and a comparative analysis was conducted. Major variations in results were experienced above 15 MPa. The dielectric constant and DF of ENC 5 increased 2.48 and 1.33 times at 20 MPa. Similarly, at 25 MPa, an increase of 4.71 and 1.44 times was recorded. In the case of EMC 15, at 20 MPa and 25 MPa, the dielectric constant and DF were enhanced by 3.97 and 2 times, and by 9.63 and 2.2 times, respectively. It was clearly observed that microcomposites with 15% filler-loading were badly influenced by compressions as compared to nanocomposites.
Author Contributions
Conceptualization, A.A.A.; Data curation, M.H.R. and A.K. (Adam Khan); Formal analysis, M.B.I. and M.H.R.; Funding acquisition, A.A.A. and A.K. (Adam Khan); Investigation, M.B.I. and A.A.; Methodology, N.U.; Project administration, A.K. (Abraiz Khattak) and N.U.; Resources, A.A.A. and A.K. (Adam Khan); Supervision, A.K. (Abraiz Khattak); Writing—original draft, M.B.I.; Writing—review & editing, A.K. (Abraiz Khattak) and N.U. All authors have read and agreed to the published version of the manuscript.
Funding
This research work was supported in parts by the National University of Sciences and Technology (NUST), Islamabad, Pakistan, and by the Taif University Researchers Supporting Project, number (TURSP-2020/121), Taif University, Taif, Saudi Arabia.
Institutional Review Board Statement
Not applicable.
Informed Consent Statement
Not applicable.
Data Availability Statement
Authors confirm the availability of all the supporting material and findings in the manuscript.
Acknowledgments
Authors from NUST acknowledge the funding support from the National University of Sciences and Technology, Islamabad, Pakistan. The authors from Taif University, Saudi Arabia, acknowledge the funding from the Researchers Supporting Project, number (TURSP-2020/121), Taif University, Taif.
Conflicts of Interest
The authors declare no conflict of interest.
References
- Gubanski, S.; Vlastos, A. Wettability of naturally aged silicon and EPDM composite insulators. IEEE Trans. Power Deliv. 1990, 5, 1527–1535. [Google Scholar] [CrossRef]
- Kornbluh, R.D.; Pelrine, R.; Joseph, J.; Heydt, R.; Pei, Q.; Chiba, S. High-field electrostriction of elastomeric polymer dielectrics for actuation. Symp. Smart Struct. Mater. 1999, 3669, 149–161. [Google Scholar] [CrossRef]
- Du, B.X.; Li, A.; Li, J. Effects of AC and pulse voltage combination on surface charge accumulation and decay of epoxy resin. IEEE Trans. Dielectr. Electr. Insul. 2016, 23, 2368–2376. [Google Scholar] [CrossRef]
- Haque, S.; Ardila-Rey, J.; Umar, Y.; Mas’Ud, A.; Muhammad-Sukki, F.; Jume, B.; Rahman, H.; Bani, N. Application and Suitability of Polymeric Materials as Insulators in Electrical Equipment. Energies 2021, 14, 2758. [Google Scholar] [CrossRef]
- Du, B.X.; Xu, H.; Li, J. Effects of mechanical stretching on space charge behaviors of PP/POE blend for HVDC cables. IEEE Trans. Dielectr. Electr. Insul. 2017, 24, 1438–1445. [Google Scholar] [CrossRef]
- Da Silva, R.F.; Swinka Filho, V. Analysis of electrical tracking by energy absorption during surface discharge in polymeric materials. IEEE Trans. Dielectr. Electr. Insul. 2016, 23, 501–506. [Google Scholar] [CrossRef]
- Shen, J.T.; Buschhorn, S.T.; De Hosson, J.T.M.; Schulte, K.; Fiedler, B. Pressure and temperature induced elec-trical resistance change in nano-carbon/epoxy composites. Compos. Sci. Technol. 2015, 115, 1–8. [Google Scholar] [CrossRef]
- Khattak, A.; Imran, K.; Ali, A.; Khan, Z.S.; Ulasyar, A.; Amin, M.; Khan, A.; Haq, A.U. Effects of Compression and Silica Addition on the Dielectric Properties of Epoxy Composites. Arab. J. Sci. Eng. 2020, 45, 6741–6750. [Google Scholar] [CrossRef]
- Shen, W.; Ou, T.; Wang, J.; Qin, T.; Zhang, G.; Zhang, X.; Han, Y.; Ma, Y.; Gao, C. Effects of high pressure on the electrical re-sistivity and dielectric properties of nanocrystalline SnO2. Sci. Rep. 2018, 8, 5086. [Google Scholar] [CrossRef] [Green Version]
- Du, B.X.; Su, J.G.; Li, J.; Han, T. Effects of mechanical stress on treeing growth characteristics in HTV silicone rubber. IEEE Trans. Dielectr. Electr. Insul. 2017, 24, 1547–1556. [Google Scholar] [CrossRef]
- Girão, H.T.; Cornier, T.; Daniele, S.; Debord, R.; Caravaca, M.A.; Casali, R.A.; Mélinon, P.; Machon, D. Pressure-Induced Disordering in SnO2 Nanoparticles. J. Phys. Chem. C 2017, 121, 15463–15471. [Google Scholar] [CrossRef]
- Cheng, K.-C.; Lin, C.-M.; Wang, S.-F.; Lin, S.-T.; Yang, C.-F. Dielectric properties of epoxy resin–barium titanate composites at high frequency. Mater. Lett. 2007, 61, 757–760. [Google Scholar] [CrossRef]
- Pierson, H.A.; Celik, E.; Abbott, A.; De Jarnette, H.; Gutierrez, L.S.; Johnson, K.; Koerner, H.; Baur, J.W. Mechanical Properties of Printed Epoxy-Carbon Fiber Composites. Exp. Mech. 2019, 59, 843–857. [Google Scholar] [CrossRef]
- Jaafar, C.A.; Zainol, I.; Ishak, N.S.; Ilyas, R.A.; Sapuan, S.M. Effects of the liquid natural rubber (LNR) on mechanical properties and microstructure of epoxy/silica/kenaf hybrid composite for potential automotive applications. J. Mater. Res. Technol. 2021, 12, 1026–1038. [Google Scholar] [CrossRef]
- Bazli, L.; Eskandarinezhad, S.; Kakur, N.; Ramachandran, V.; Bacigalupe, A.; Mansilla, M.; Escobar, M. Electrical properties of polymer blend composites based on Silicone rubber/EPDM/clay for high voltage insulators. J. Compos. Compd. 2020, 2, 18–24. [Google Scholar] [CrossRef]
- Preetha, P.; Thomas, M.J. AC breakdown characteristics of epoxy nanocomposites. IEEE Trans. Dielectr. Electr. Insul. 2011, 18, 1526–1534. [Google Scholar] [CrossRef]
- Wang, R.; Xie, C.; Zeng, L.; Xu, H. Thermal decomposition behavior and kinetics of nanocomposites at low-modified ZnO content. RSC Adv. 2019, 9, 790–800. [Google Scholar] [CrossRef] [Green Version]
- Venkatesulu, B. Studies on Polymeric Micro/Nanocomposites for Outdoor High Voltage Insulation. Ph.D. Thesis, Indian Institute of Science, Bangalore, India, 2011. [Google Scholar]
- Nelson, J.; Utracki, L.; MacCrone, R.; Reed, C. Role of the interface in determining the dielectric properties of nanocomposites. In Proceedings of the 17th Annual Meeting of the IEEE Lasers and Electro-Optics Society, LEOS 2004, Boulder, CO, USA, 20–22 October 2004. [Google Scholar] [CrossRef] [Green Version]
- Ramirez Vazquez, I. A Study of Nanofilled Silicone Dielectrics for Outdoor Insulation. Ph.D. Thesis, University of Waterloo, Waterloo, ON, Canada, 2009. [Google Scholar]
- Amin, M.; Ali, M. Polymer nanocomposites for high voltage outdoor insulation applications. Rev. Adv. Mater. Sci. 2015, 40, 276–294. [Google Scholar]
- Fairus, M.; Mansor, N.S.; Hafiz, M.; Kamarol, M.; Mariatti, M. Investigation on dielectric strength of alumina nanofiller with SiR/EPDM composites for HV insulator. In Proceedings of the 2015 IEEE 11th International Conference on the Properties and Applications of Dielectric Materials (ICPADM), Sydney, Australia, 19–22 July 2015; pp. 923–926. [Google Scholar]
- Singha, S.; Thomas, M.J. Dielectric properties of epoxy nanocomposites. IEEE Trans. Dielectr. Electr. Insul. 2008, 15, 12–23. [Google Scholar] [CrossRef]
- Yim, M.J.; Kwon, W.; Paik, K.W. Effect of filler content on the dielectric properties of anisotropic conductive adhesives materials for high-frequency flip–chip interconnection. Mater. Sci. Eng. B 2006, 126, 59–65. [Google Scholar] [CrossRef]
- Foo, E.; Jaafar, M.; Aziz, A.; Sim, L.C. Properties of spin coated epoxy/silica thin film composites: Effect of nano- and micron-size fillers. Compos. Part A Appl. Sci. Manuf. 2011, 42, 1432–1437. [Google Scholar] [CrossRef]
- Momen, G.; Farzaneh, M. Survey of micro/nano filler use to improve silicone rubber for outdoor insulators. Rev. Adv. Mater. Sci. 2011, 27, 1–13. [Google Scholar]
- Guevara-Morales, A.; Taylor, A.C. Mechanical and dielectric properties of epoxy–clay nanocomposites. J. Mater. Sci. 2013, 49, 1574–1584. [Google Scholar] [CrossRef]
- Tanaka, T. Dielectric nanocomposites with insulating properties. IEEE Trans. Dielectr. Electr. Insul. 2005, 12, 914–928. [Google Scholar] [CrossRef]
- Yu, J.; Huo, R.; Wu, C.; Wu, X.; Wang, G.; Jiang, P. Influence of interface structure on dielectric properties of epoxy/alumina nanocomposites. Macromol. Res. 2012, 20, 816–826. [Google Scholar] [CrossRef]
Publisher’s Note: MDPI stays neutral with regard to jurisdictional claims in published maps and institutional affiliations. |
© 2021 by the authors. Licensee MDPI, Basel, Switzerland. This article is an open access article distributed under the terms and conditions of the Creative Commons Attribution (CC BY) license (https://creativecommons.org/licenses/by/4.0/).