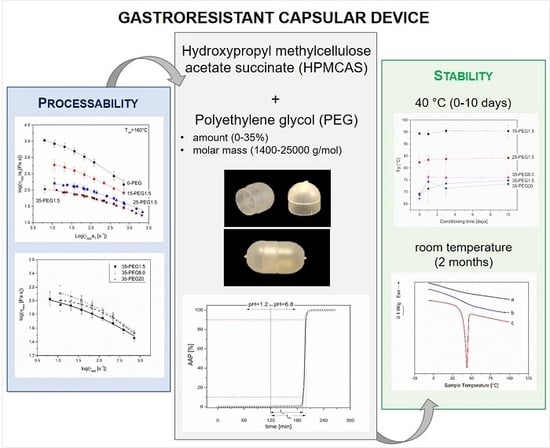
Effect of Polyethylene Glycol Content and Molar Mass on Injection Molding of Hydroxypropyl Methylcellulose Acetate Succinate-Based Gastroresistant Capsular Devices for Oral Drug Delivery

 ,
, 
 and
and
Abstract
:
1. Introduction
2. Materials and Methods
2.1. Materials
2.2. Methods
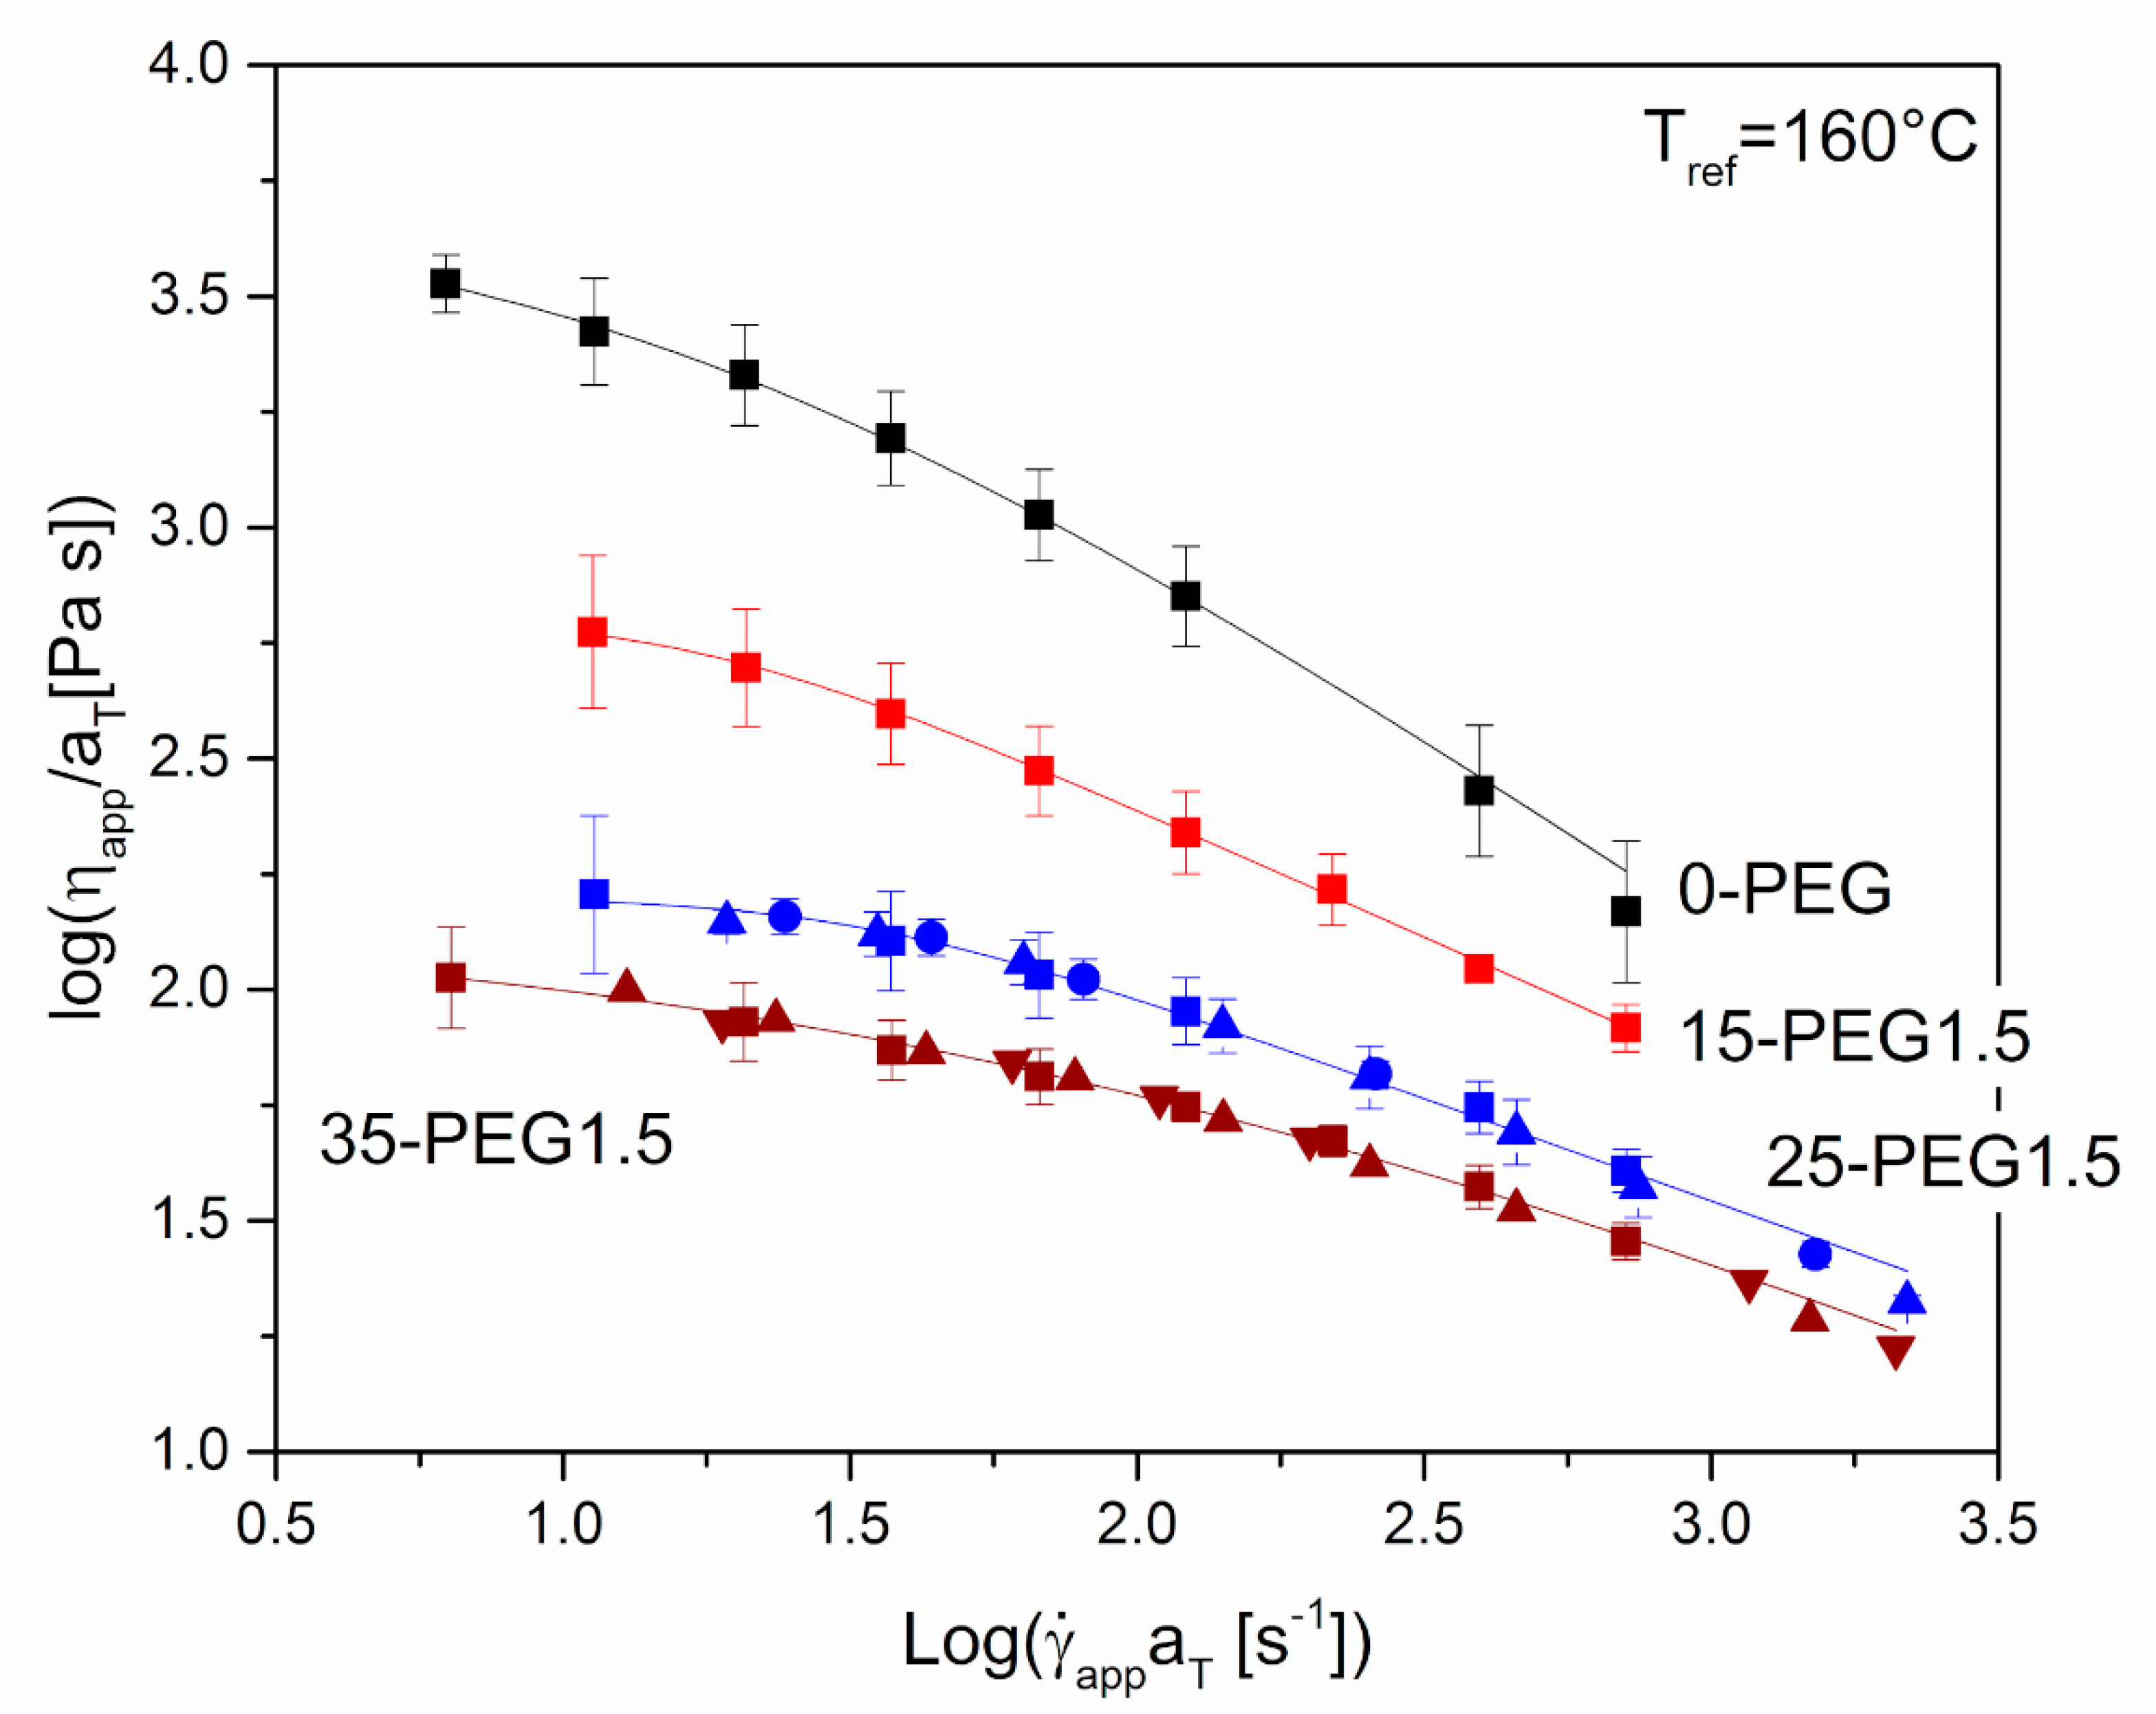
2.2.1. Rheological Characterization of Materials
2.2.2. Differential Scanning Calorimetry (DSC)
2.2.3. Dynamic Mechanical Analysis (DMA) of Extruded Samples
2.2.4. IM of Capsular Devices
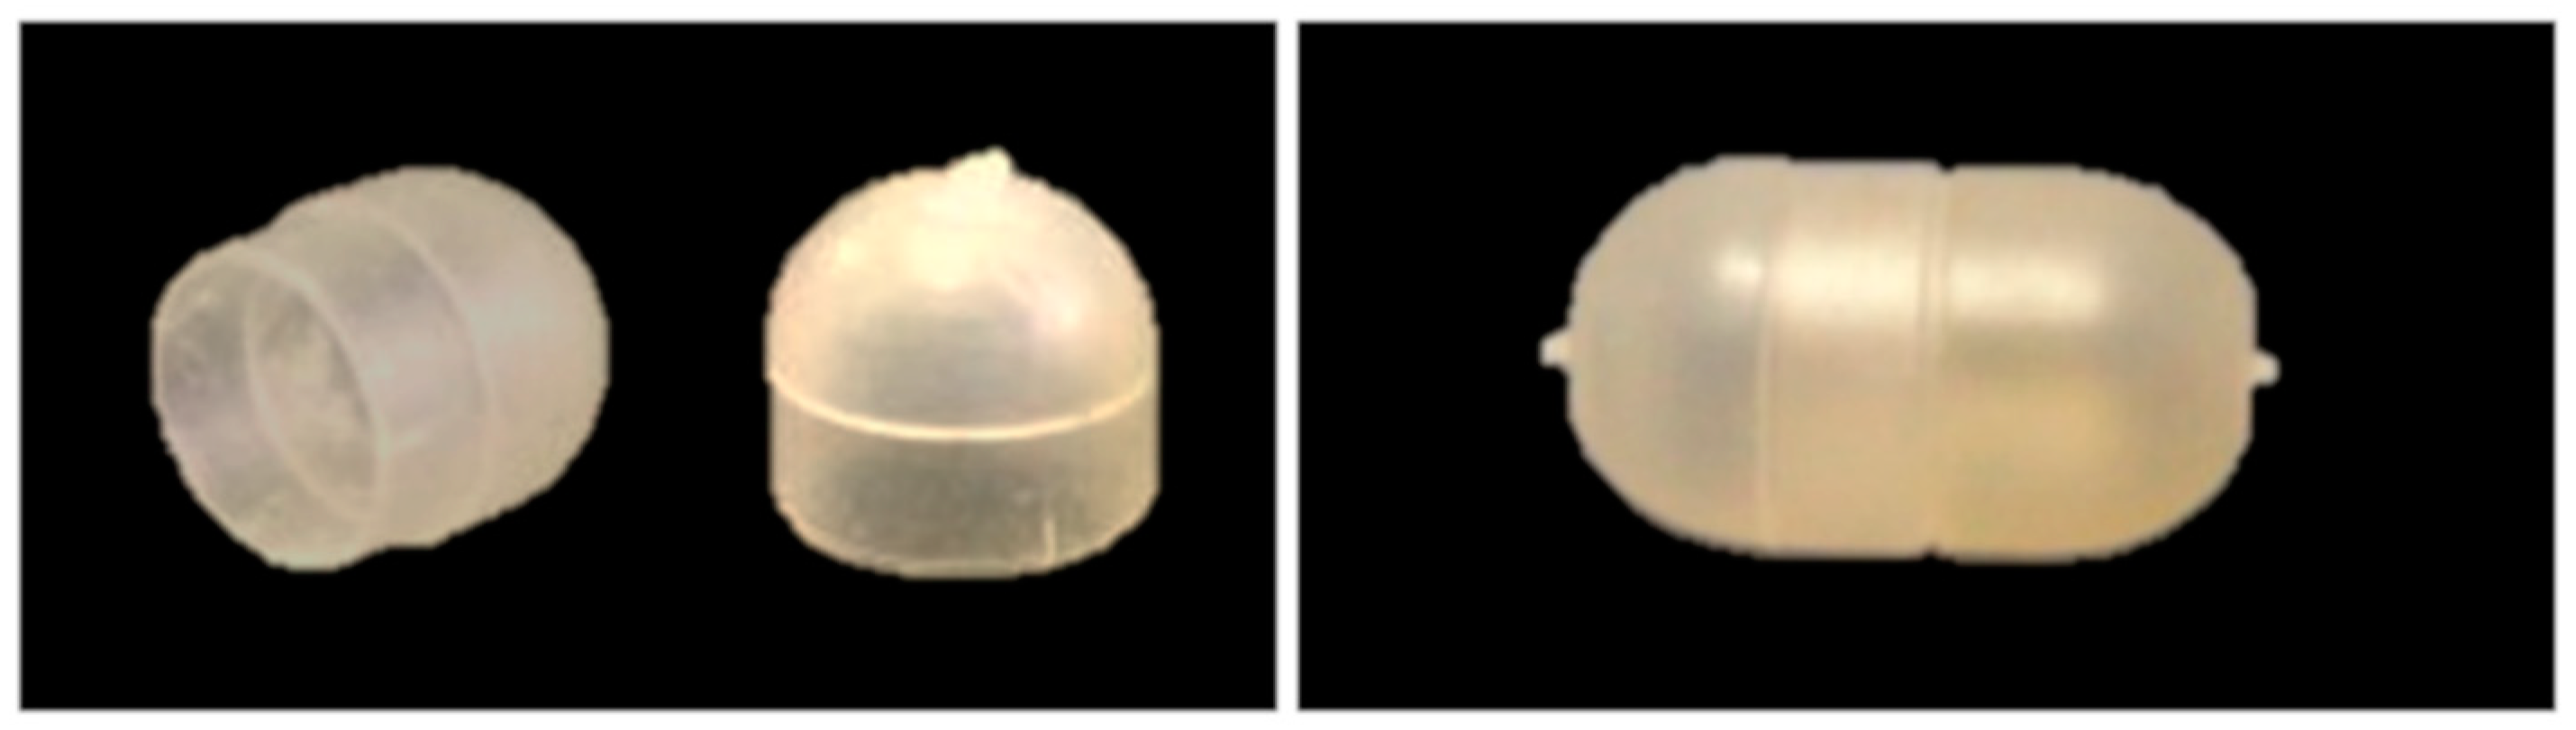
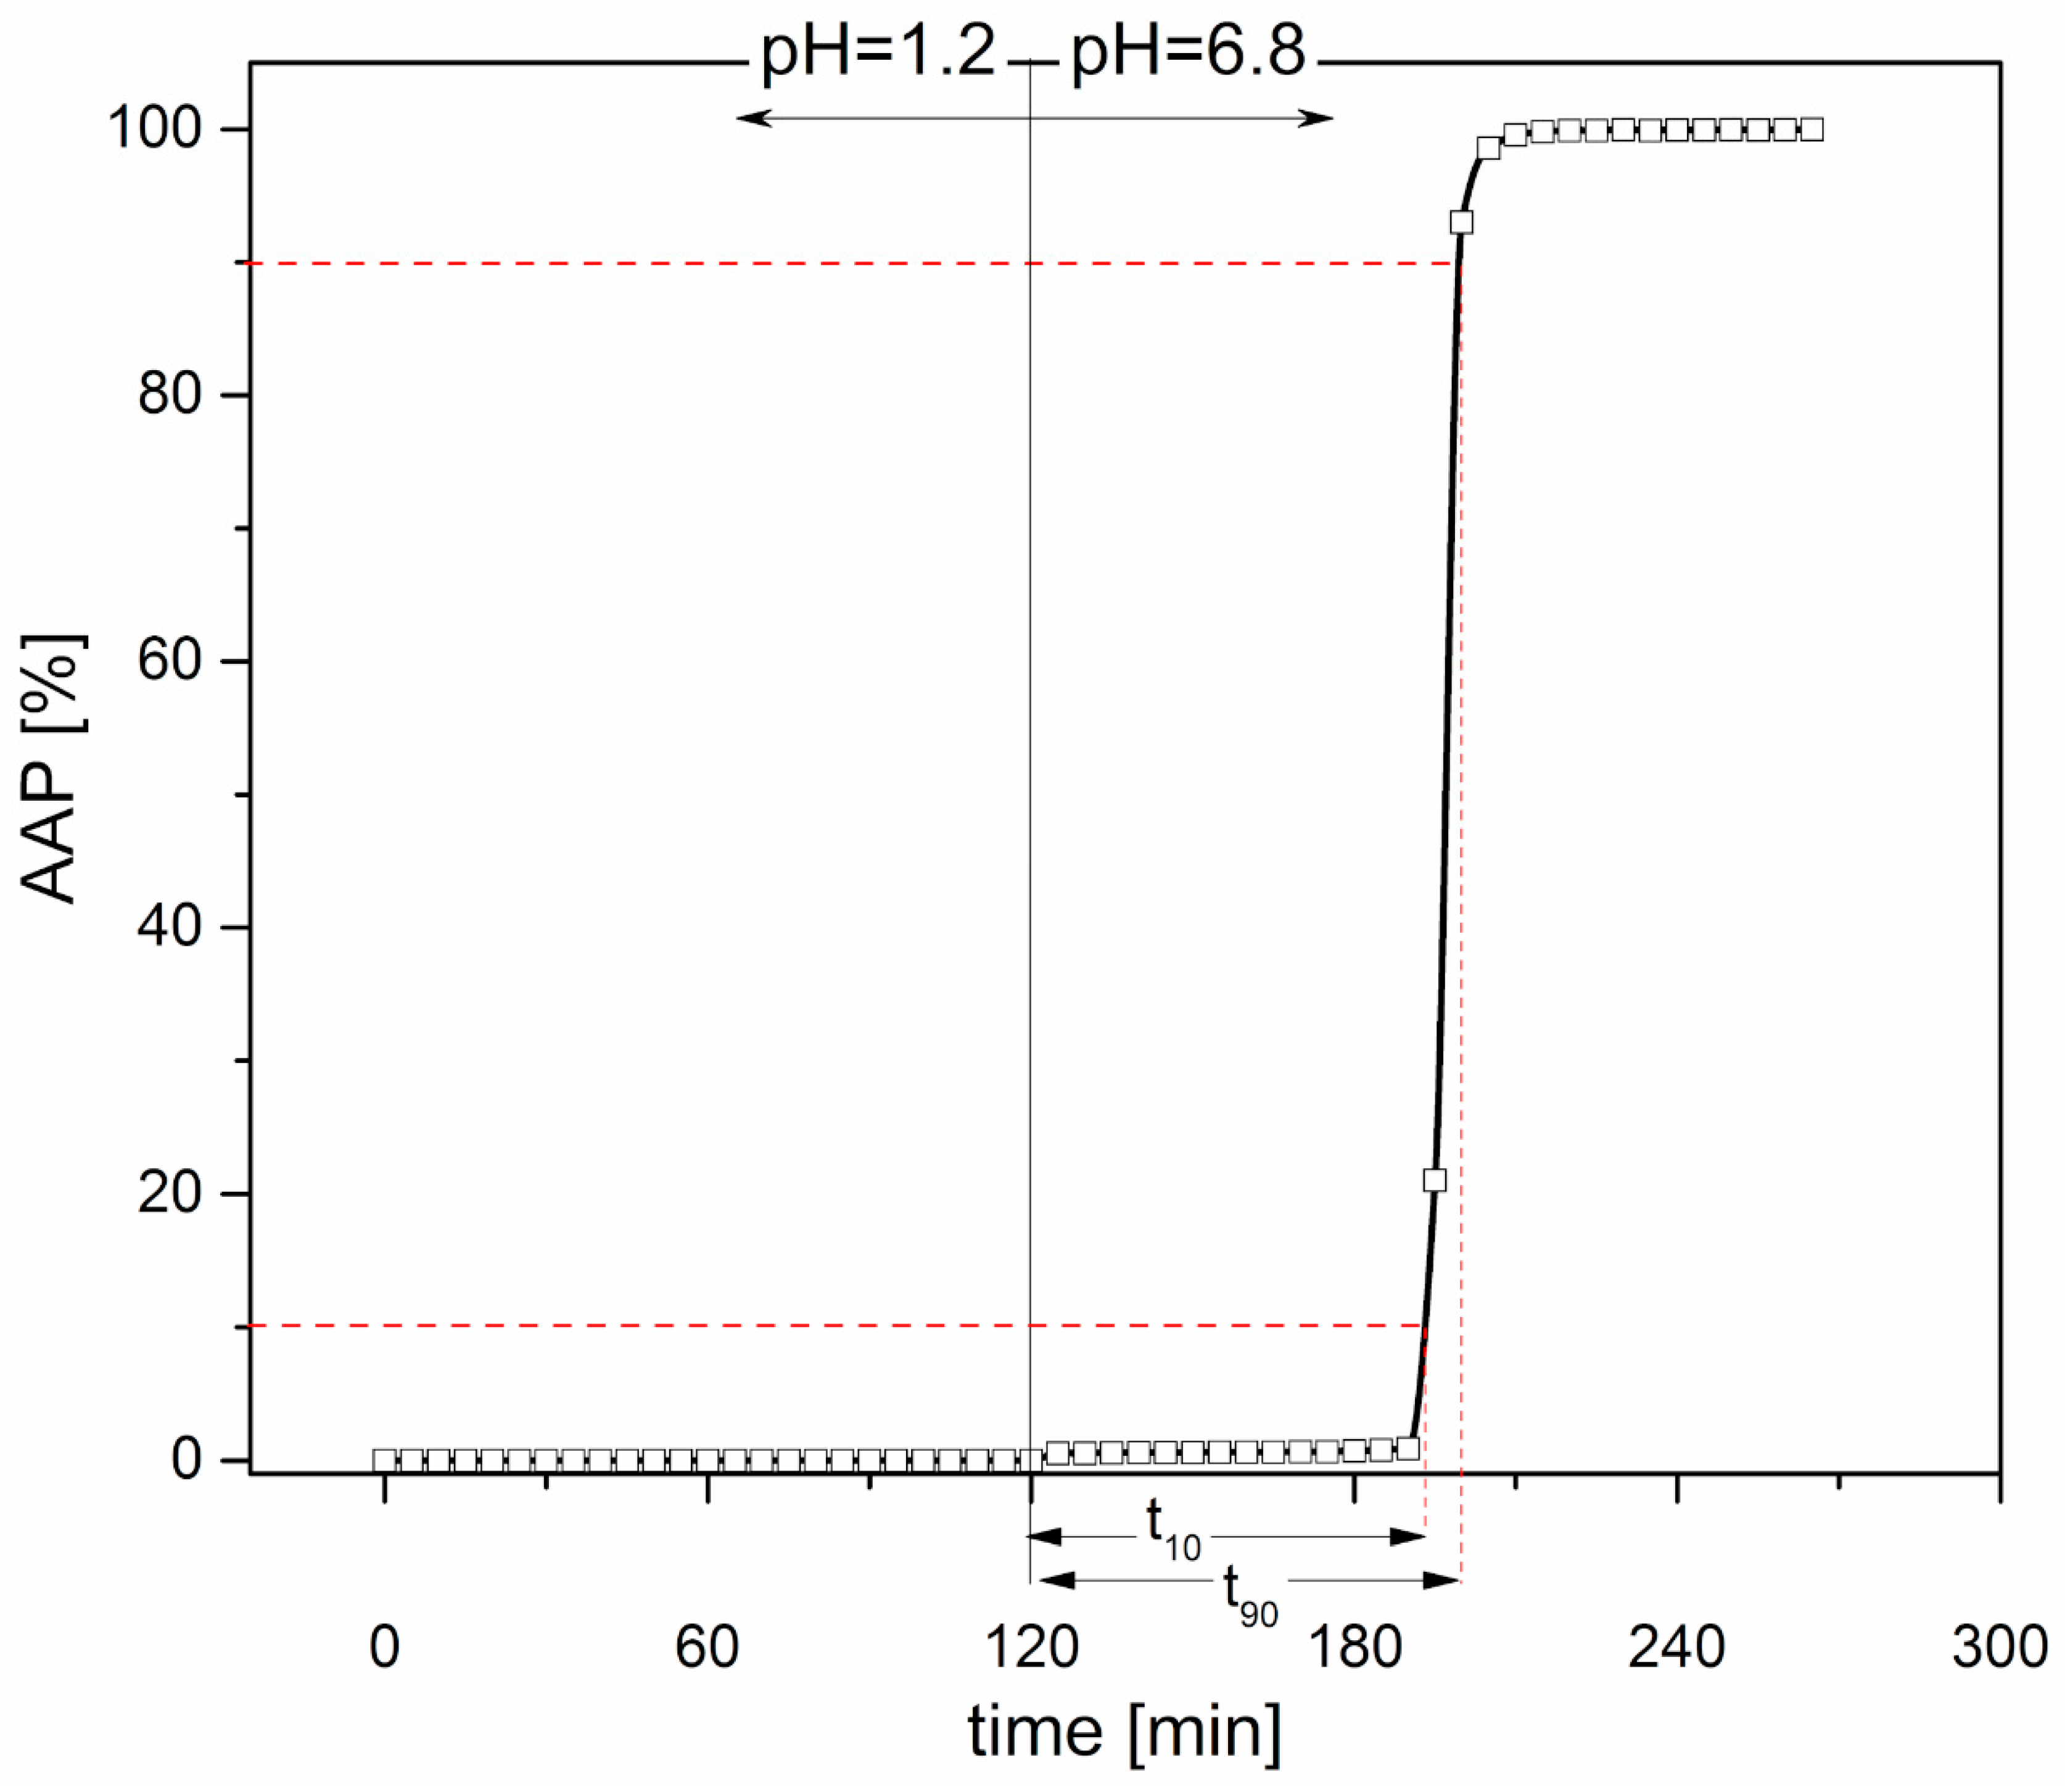
2.2.5. Characterization of Capsular Devices
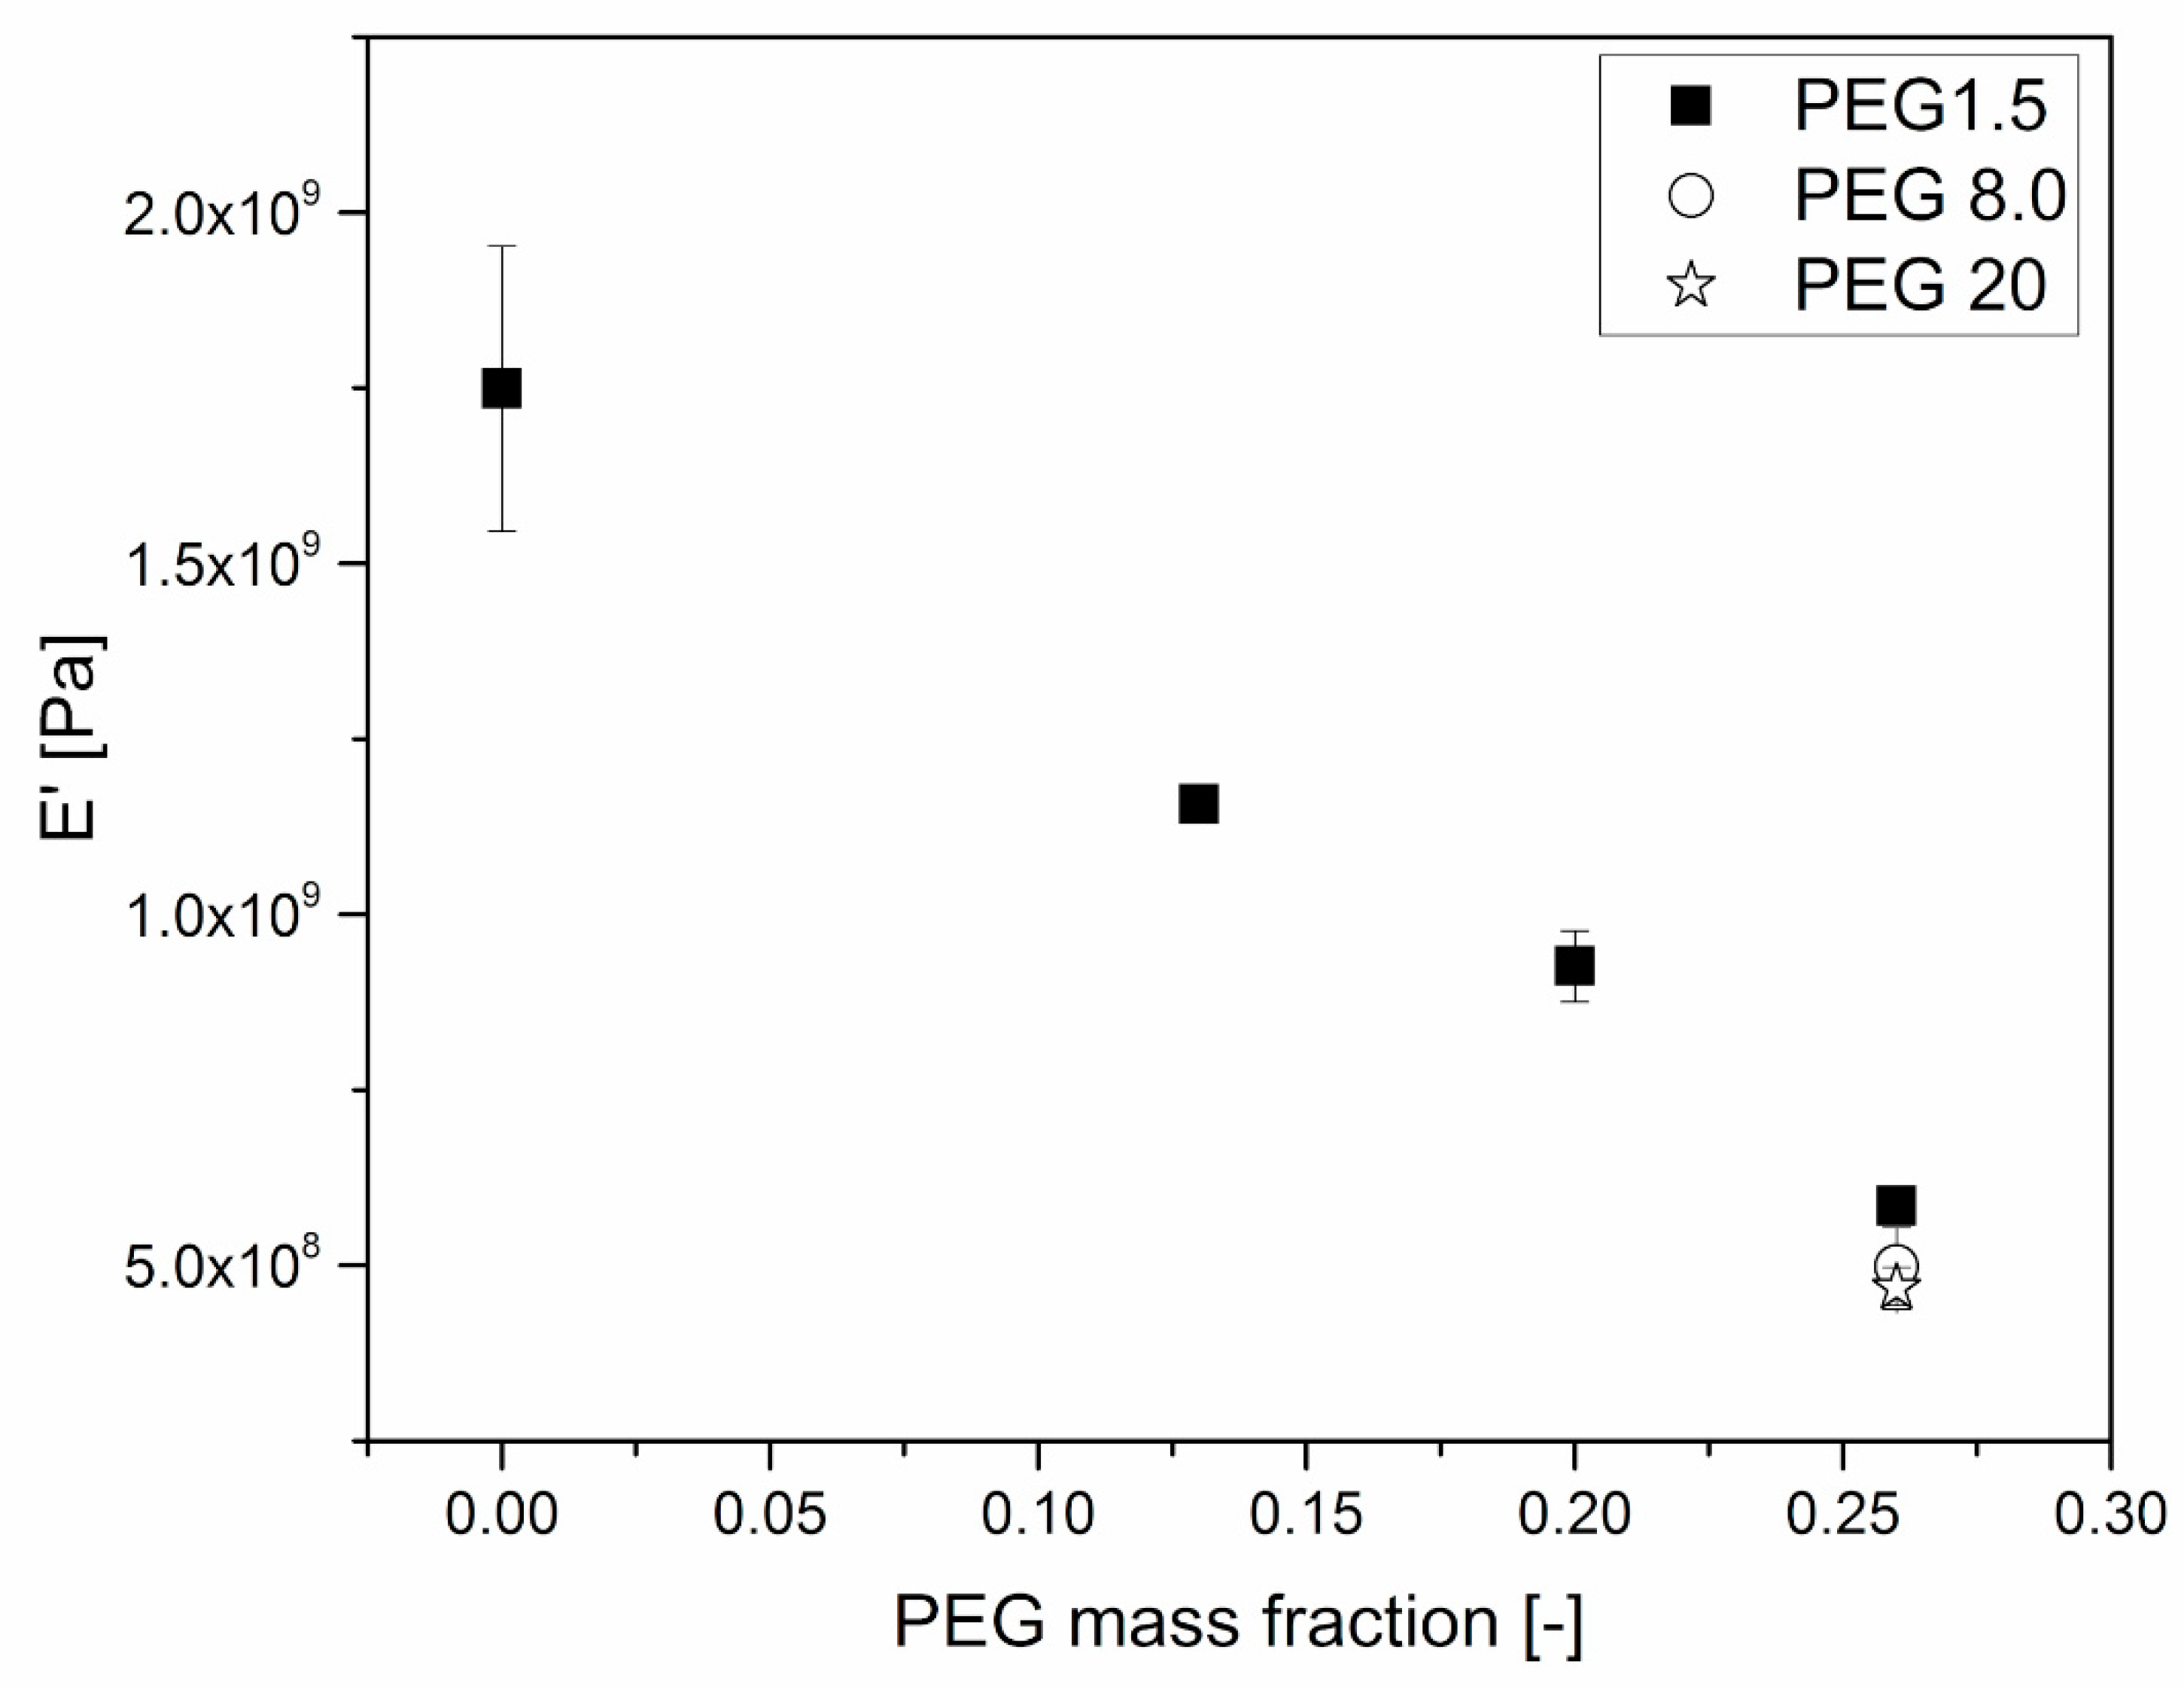
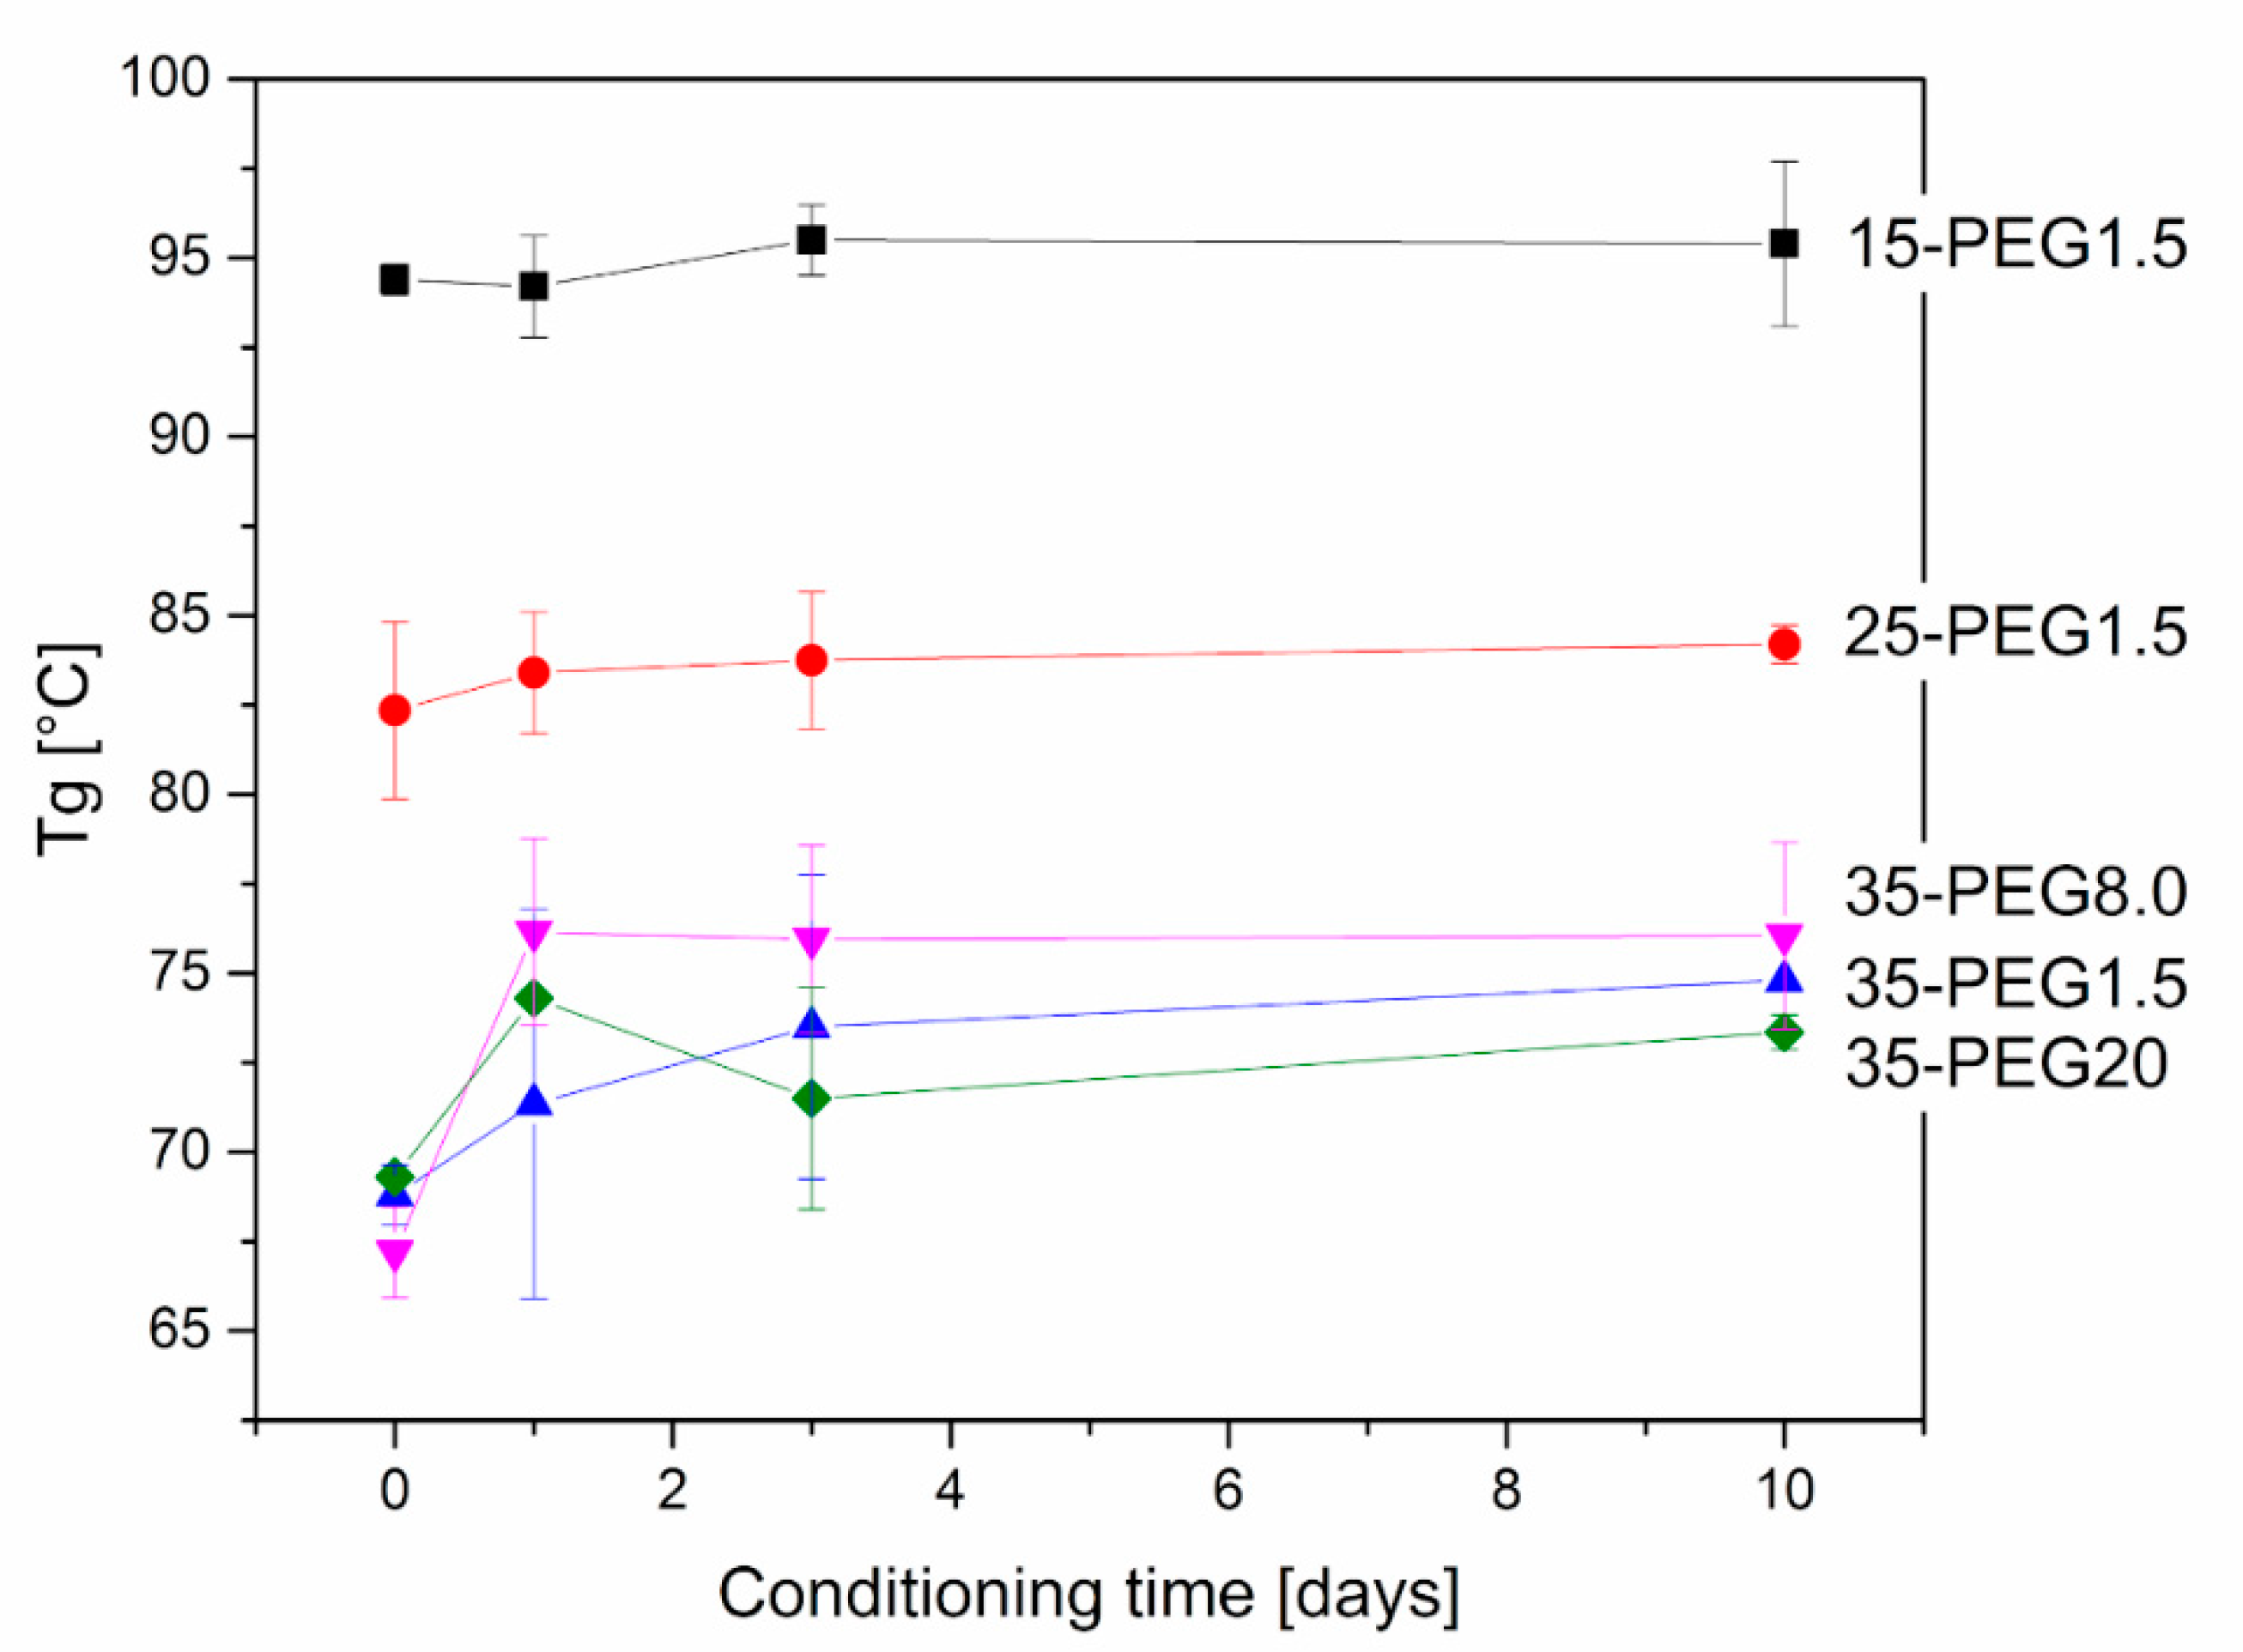
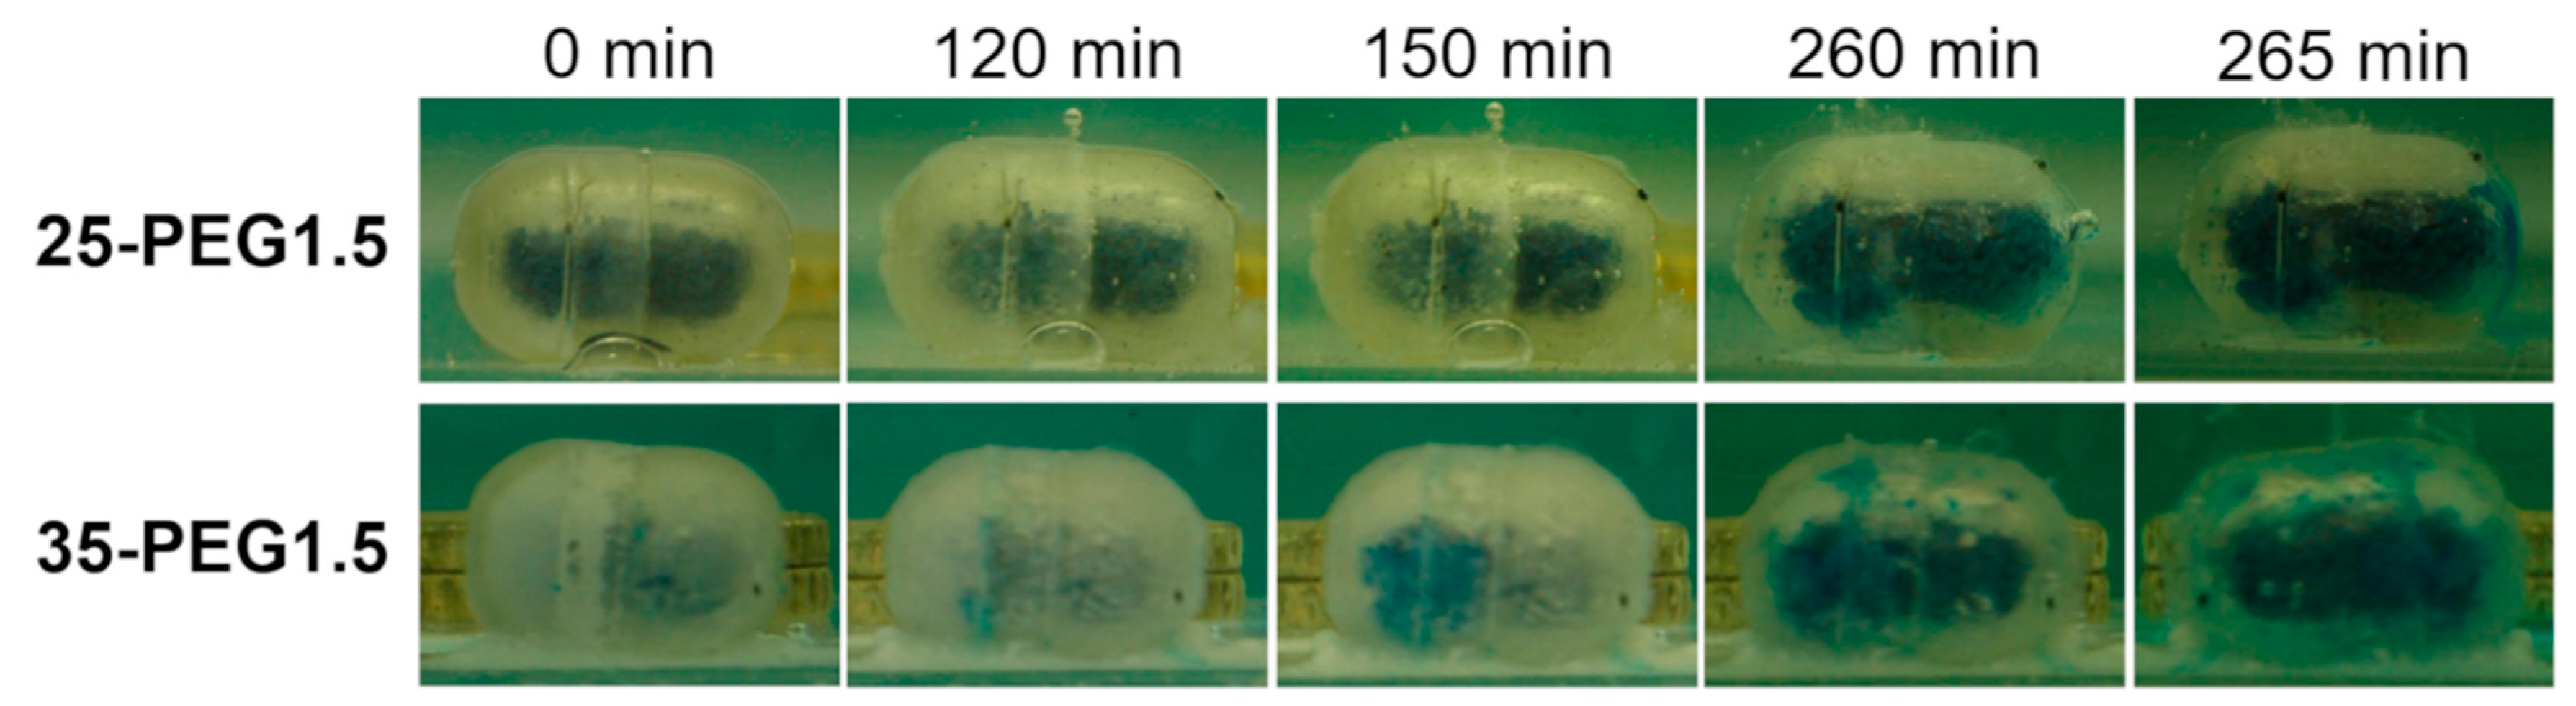
3. Results and Discussion
3.1. Characterization of HPMCAS-Based Materials
3.2. Manufacturing and Characterization of HPMCAS-Based Capsular Devices
3.3. Characterization of Translucent HPMCAS-Based Samples
4. Conclusions
Author Contributions
Funding
Conflicts of Interest
References
- Zema, L.; Loreti, G.; Melocchi, A.; Maroni, A.; Gazzaniga, A. Injection Molding and its application to drug delivery. J. Control. Release 2012, 159, 324–331. [Google Scholar] [CrossRef] [PubMed]
- Burns, S.J.; Corness, D.; Hay, G.; Higginbottom, S.; Whelan, I.; Attwood, D.; Barnwell, S.G. An in vitro assessment of liquid-filled Capill® potato starch capsules with biphasic release characteristics. Int. J. Pharm. 1996, 134, 223–230. [Google Scholar] [CrossRef]
- Vilivalam, V.D.; Illum, L.; Iqbal, K. Starch capsules: An alternative system for oral drug delivery. Pharm. Sci. Technol. Today 2000, 3, 64–69. [Google Scholar] [CrossRef]
- Melocchi, A.; Loreti, G.; Del Curto, M.D.; Maroni, A.; Gazzaniga, A.; Zema, L. Evaluation of hot-melt extrusion and injection molding for continuous manufacturing of immediate-release tablets. J. Pharm. Sci. 2015, 104, 1971–1980. [Google Scholar] [CrossRef]
- Puri, V.; Brancazio, D.; Desai, P.M.; Jensen, K.D.; Chun, J.-H.; Myerson, A.S.; Trout, B.-L. Development of maltodextrin-based immediate-release tablets using an integrated twin-screw hot-melt extrusion and injection-molding continuous manufacturing process. J. Pharm. Sci. 2017, 106, 3328–3336. [Google Scholar] [CrossRef] [PubMed]
- Verstraete, G.; Van Renterghem, J.; Van Bockstal, P.J.; Kasmi, S.; De Geest, B.G.; De Beer, T.; Remon, J.P.; Vervaet, C. Hydrophilic thermoplastic polyurethanes for the manufacturing of highly dosed oral sustained release matrices via hot melt extrusion and injection molding. Int. J. Pharm. 2016, 506, 214–221. [Google Scholar] [CrossRef]
- Verstraete, G.; Vandenbussche, L.; Kasmi, S.; Nuhn, L.; Brouckaert, D.; Van Renterghem, J.; Grymonpré, W.; Vanhoorne, V.; Coenye, T.; De Geest, B.G.; et al. Thermoplastic polyurethane-based intravaginal rings for prophylaxis and treatment of (recurrent) bacterial vaginosis. Int. J. Pharm. 2017, 529, 218–226. [Google Scholar] [CrossRef] [PubMed]
- Hanafy, A.F.; Ali, H.S.M.; El Achy, S.N.; Habib, E.-S.E. Dual effect biodegradable ciprofloxacin loaded implantable matrices for osteomyelitis: Controlled release and osteointegration. Drug. Dev. Ind. Pharm. 2018, 44, 1023–1033. [Google Scholar] [CrossRef]
- Gazzaniga, A.; Cerea, M.; Cozzi, A.; Foppoli, A.; Maroni, A.; Zema, L. A novel injection-molded capsular device for oral pulsatile delivery based on swellable/erodible polymers. AAPS PharmSciTech 2011, 12, 295–303. [Google Scholar] [CrossRef]
- Zema, L.; Loreti, G.; Macchi, E.; Foppoli, A.; Maroni, A.; Gazzaniga, A. Injection-molded capsular device for oral pulsatile release: Development of a novel mold. J. Pharm. Sci. 2013, 102, 489–499. [Google Scholar] [CrossRef]
- Maroni, A.; Melocchi, A.; Parietti, F.; Foppoli, A.; Zema, L.; Gazzaniga, A. 3D printed multi-compartment capsular devices for two-pulse oral drug delivery. J. Control. Release 2017, 268, 10–18. [Google Scholar] [CrossRef] [PubMed]
- Maroni, A.; Zema, L.; Cerea, M.; Foppoli, A.; Palugan, L.; Gazzaniga, A. Erodible drug delivery systems for time-controlled release into the gastrointestinal tract. J. Drug Deliv. Sci. Technol. 2016, 32, 229–235. [Google Scholar] [CrossRef]
- Gazzaniga, A.; Giordano, F.; Sangalli, M.E.; Zema, L. Oral colon-specific drug delivery: Design strategies. STP Pharm. Prat. 1994, 4, 336–343. [Google Scholar]
- Maroni, A.; Del Curto, M.D.; Salmaso, S.; Zema, L.; Melocchi, A.; Caliceti, P.; Gazzaniga, A. In vitro and in vivo evaluation of an oral-multiple unit formulation for colonic delivery of insulin. Eur. J. Pharm. Biopharm. 2016, 108, 76–82. [Google Scholar] [CrossRef] [PubMed]
- Macchi, E.; Zema, L.; Maroni, A.; Gazzaniga, A.; Felton, L.A. Enteric-coating of pulsatile-release HPC capsules prepared by injection molding. Eur. J. Pharm. Sci. 2015, 70, 1–11. [Google Scholar] [CrossRef] [PubMed]
- Macchi, E.; Zema, L.; Pandey, P.; Gazzaniga, A.; Felton, L.A. Influence of temperature and relative humidity conditions on the pan coating of hydroxypropyl cellulose molded capsules. Eur. J. Pharm. Biopharm. 2016, 100, 47–57. [Google Scholar] [CrossRef] [PubMed]
- Melocchi, A.; Parietti, F.; Loreti, G.; Maroni, A.; Gazzaniga, A.; Zema, L. 3D printing by fused deposition modeling (FDM) of a swellable/erodible capsular device for oral pulsatile release of drugs. J. Drug Deliv. Sci. Technol. 2015, 30 Pt B, 360–367. [Google Scholar] [CrossRef]
- Melocchi, A.; Parietti, F.; Maccagnan, S.; Ortenzi, M.A.; Antenucci, S.; Briatico-Vangosa, F.; Maroni, A.; Gazzaniga, A.; Zema, L. Industrial Development of a 3D-printed nutraceutical delivery platform in the form of a multicompartment HPC capsule. AAPS PharmSciTech 2018, 19, 3343–3354. [Google Scholar] [CrossRef]
- Zema, L.; Loreti, G.; Melocchi, A.; Maroni, A.; Palugan, L.; Gazzaniga, A. Gastroresistant capsular device prepared by injection molding. Int. J. Pharm. 2013, 440, 264–272. [Google Scholar] [CrossRef]
- Baldi, F.; Ragnoli, J.; Zinesi, D.; Bignotti, F.; Briatico-Vangosa, F.; Casati, F.; Loreti, G.; Melocchi, A.; Zema, L. Rheological Characterization of Ethylcellulose-Based Melts for Pharmaceutical Applications. AAPS PharmSciTech 2017, 18, 855–866. [Google Scholar] [CrossRef]
- Casati, F.; Briatico-Vangosa, F.; Baldi, F.; Melocchi, A.; Maroni, A.; Gazzaniga, A.; Zema, L. Assessment of hot-processability and performance of ethylcellulose-based materials for injection-molded prolonged-release systems: An investigational approach. Int. J. Pharm. 2018, 548, 400–407. [Google Scholar] [CrossRef]
- Lindström, A.; Hakkarainen, M. Migration resistant polymeric plasticizer for poly(vinyl chloride). J. Appl. Polym. Sci. 2007, 104, 2458–2467. [Google Scholar] [CrossRef]
- Latini, G.; Ferri, M.; Chiellini, F. Materials degradation in PVC medical devices, DEHP leaching and neonatal outcomes. Curr. Med. Chem. 2010, 17, 2979–2989. [Google Scholar] [CrossRef]
- Ambrogi, V.; Brostow, W.; Carfagna, C.; Pannico, M.; Persico, P. Plasticizer migration from cross-linked flexible PVC: Effects on tribology and hardness. Polym. Eng. Sci. 2011, 52, 211–217. [Google Scholar] [CrossRef]
- Sunny, M.C.; Ramesh, P.; George, K.E. Use of polymeric plasticizers in polyvinyl chloride to reduce conventional plasticizer migration for critical applications. J. Elast. Plast. 2004, 36, 19–31. [Google Scholar] [CrossRef]
- Yuan, J.; Cheng, B. A strategy for nonmigrating highly plasticized PVC. Sci. Rep. 2017, 7, 9277. [Google Scholar] [CrossRef] [PubMed]
- Mehuys, E.; Remon, J.-P.; Vervaet, C. Production of enteric capsules by means of hot-melt extrusion. Eur. J. Pharm. Sci. 2005, 24, 207–212. [Google Scholar] [CrossRef] [PubMed]
- Sarode, A.L.; Obara, S.; Tanno, F.K.; Sandhu, H.; Iyer, R.; Shah, N. Stability assessment of hypromellose acetate succinate (HPMCAS) NF for application in hot melt extrusion (HME). Carbohydr. Polym. 2014, 101, 146–153. [Google Scholar] [CrossRef]
- Yousfi, M.; Alix, S.; Lebeau, M.; Soulestin, J.; Lacrampe, M.F.; Krawczak, P. Evaluation of rheological properties of non-Newtonian fluids in micro rheology compounder: Experimental procedures for a reliable polymer melt viscosity measurement. Pol. Test. 2014, 40, 207–217. [Google Scholar] [CrossRef]
- McConnell, E.L.; Fadda, A.M.; Basit, A.W. Gut instincts: Explorations in intestinal physiology and drug delivery. Int. J. Pharm. 2008, 364, 213–226. [Google Scholar] [CrossRef]
- Liu, F.; Basit, A.W. A paradigm shift in enteric coating: Achieving rapid release in the proximal small intestine of man. J. Control. Release 2010, 147, 242–245. [Google Scholar] [CrossRef]
- Laun, H.M. Orientation effects and rheology of short glass fiber-reinforced thermoplastics. Colloid. Polym. Sci. 1984, 262, 257–269. [Google Scholar] [CrossRef]
- Baldi, F.; Franceschini, A.; Bignotti, F.; Tieghi, G.; Riccò, T. Rheological behaviour of nano-composites based on polyamide 6 under shear and elongational flow at high strain rates. Rheol. Acta 2009, 48, 73–88. [Google Scholar] [CrossRef]
- Bochmann, E.S.; Üstüner, E.E.; Gryczke, A.; Wagner, K.G. Predicting melt rheology for hot-melt extrusion by means of a simple Tg-measurement. Eur. J. Pharm. Biopharm. 2017, 119, 47–55. [Google Scholar] [CrossRef] [PubMed]


| PEG | Formulation Code | ||
|---|---|---|---|
| Nominal Molar Mass | wt % | ||
| HPMCAS | - | 0 | 0-PEG |
| 1500 | 15 | 15-PEG1.5 | |
| 25 | 25-PEG1.5 | ||
| 35 | 35-PEG1.5 | ||
| 8000 | 35 | 35-PEG8.0 | |
| 20000 | 35 | 35-PEG20 | |
| Formulation | T1 (°C) | T2 (°C) | T3 (°C) | T4 (°C) | C (mm) | P1 (bar) | r1 (%) | P2 (bar) | r2 (%) |
|---|---|---|---|---|---|---|---|---|---|
| 15-PEG1.5 | 130 | 135 | 155 | 165 | 6 | 30 | 0.4 | 20 | 0.3 |
| 25-PEG1.5 | 130 | 135 | 150 | 160 | 6 | 30 | 0.4 | 20 | 0.3 |
| 35-PEG1.5 | 130 | 135 | 150 | 160 | 7 | 30 | 0.4 | 20 | 0.3 |
| 35-PEG8.0 | 130 | 135 | 160 | 170 | 6 | 30 | 0.4 | 20 | 0.3 |
| 35-PEG20 | 130 | 135 | 160 | 170 | 6 | 30 | 0.4 | 20 | 0.3 |
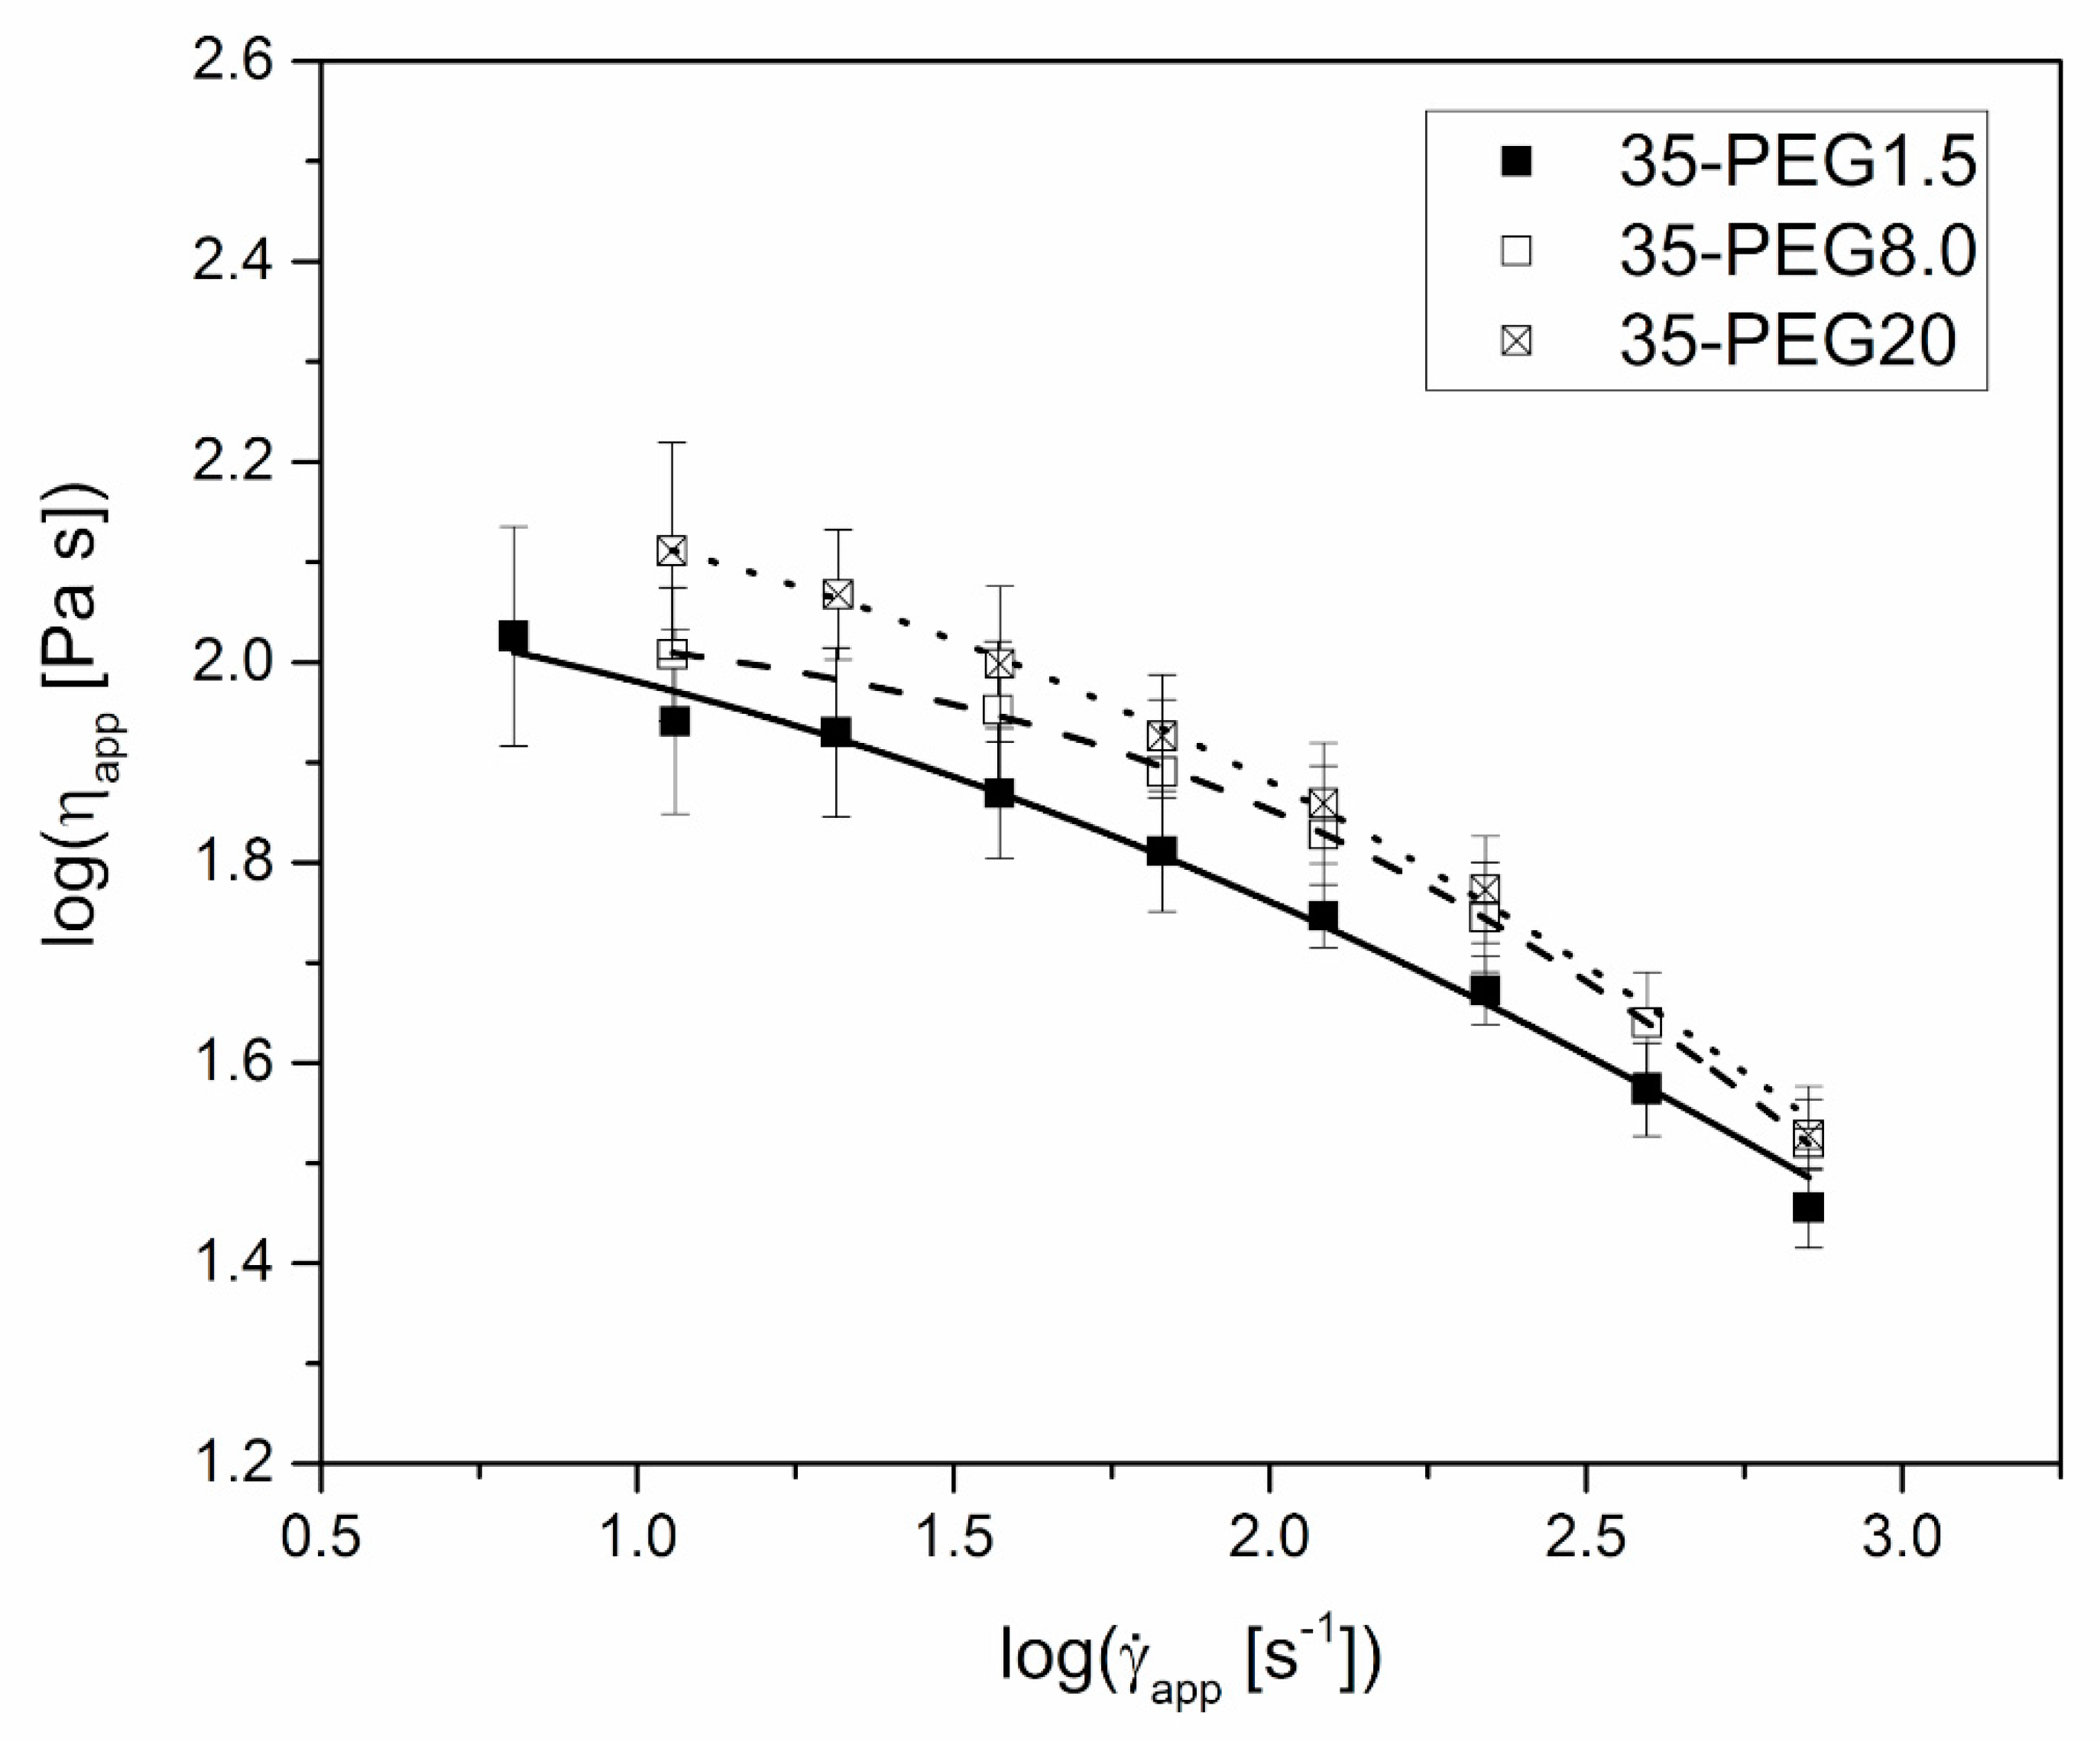
| Formulation | η0 (Pa s) | λ (s) | m (–) | R2 |
|---|---|---|---|---|
| 0-PEG | 5037 ± 389 | 0.071 ± 0.014 | 0.84 ± 0.04 | 0.998 |
| 15-PEG1.5 | 1003 ± 55 | 0.050 ± 0.008 | 0.68 ± 0.01 | 0.994 |
| 25-PEG1.5 | 236 ± 9 | 0.021 ± 0.003 | 0.55 ± 0.04 | 0.996 |
| 35-PEG1.5 | 141 ± 17 | 0.019 ± 0.004 | 0.52 ± 0.02 | 0.995 |
| 35-PEG8.0 | 115 ± 2 | 0.005 ± 0.003 | 0.71 ± 0.02 | 0.999 |
| 35-PEG20 | 184 ± 14 | 0.019 ± 0.005 | 0.55 ± 0.04 | 0.998 |
| Formulation | Weight (mg) | |
|---|---|---|
| Cap | Body | |
| 15-PEG1.5 | 114.57 (1.02) | 125.79 (1.99) |
| 25-PEG1.5 | 115.46 (0.62) | 128.07 (0.28) |
| 35-PEG1.5 | 115.85 (0.31) | 127.51 (0.32) |
| Formulation | t0 (min) | t30days (min) | ||
|---|---|---|---|---|
| t10% | t90% − t10% | t10% | t90% − t10% | |
| 25-PEG1.5 | 65.2 (6.1) | 19.7 (11.9) | 74.7 (6.4) | 17.9 (8.1) |
| 35-PEG1.5 | 60.3 (5.4) | 13.6 (8.4) | 78.0 (4.3) | 82.9 (15.4) |
| 35-PEG8.0 | 57.4 (7.1) | 15.9 (6.1) | 63.8 (5.7) | 18.3 (8.4) |
| 35-PEG20 | 56.7 (15.1) | 20.5 (3.0) | 68.6 (24.6) | 14.52 (4.8) |
| Formulation | ΔHmelting, thin layer (J/g) | χPEG (%) |
|---|---|---|
| 25-PEG1.5 | 5.0 | 3.4 |
| 35-PEG1.5 | 22.4 | 15.2 |
| 35-PEG8.0 | 0.3 | 0.3 |
| 35-PEG20 | 0.3 | 0.3 |
© 2019 by the authors. Licensee MDPI, Basel, Switzerland. This article is an open access article distributed under the terms and conditions of the Creative Commons Attribution (CC BY) license (http://creativecommons.org/licenses/by/4.0/).
Share and Cite
Briatico-Vangosa, F.; Melocchi, A.; Uboldi, M.; Gazzaniga, A.; Zema, L.; Maroni, A. Effect of Polyethylene Glycol Content and Molar Mass on Injection Molding of Hydroxypropyl Methylcellulose Acetate Succinate-Based Gastroresistant Capsular Devices for Oral Drug Delivery. Polymers 2019, 11, 517. https://doi.org/10.3390/polym11030517
Briatico-Vangosa F, Melocchi A, Uboldi M, Gazzaniga A, Zema L, Maroni A. Effect of Polyethylene Glycol Content and Molar Mass on Injection Molding of Hydroxypropyl Methylcellulose Acetate Succinate-Based Gastroresistant Capsular Devices for Oral Drug Delivery. Polymers. 2019; 11(3):517. https://doi.org/10.3390/polym11030517
Chicago/Turabian StyleBriatico-Vangosa, Francesco, Alice Melocchi, Marco Uboldi, Andrea Gazzaniga, Lucia Zema, and Alessandra Maroni. 2019. "Effect of Polyethylene Glycol Content and Molar Mass on Injection Molding of Hydroxypropyl Methylcellulose Acetate Succinate-Based Gastroresistant Capsular Devices for Oral Drug Delivery" Polymers 11, no. 3: 517. https://doi.org/10.3390/polym11030517
APA StyleBriatico-Vangosa, F., Melocchi, A., Uboldi, M., Gazzaniga, A., Zema, L., & Maroni, A. (2019). Effect of Polyethylene Glycol Content and Molar Mass on Injection Molding of Hydroxypropyl Methylcellulose Acetate Succinate-Based Gastroresistant Capsular Devices for Oral Drug Delivery. Polymers, 11(3), 517. https://doi.org/10.3390/polym11030517