Article

Raman Spectra and Microstructure of Zinc Oxide irradiated with Swift Heavy Ion

1
Institute of Modern Physics, Chinese Academy of Sciences, Lanzhou 730000, China
2
School of Nuclear Science and Technology, University of Chinese Academy of Sciences, Beijing 100000, China
*
Author to whom correspondence should be addressed.
Crystals 2019, 9(8), 395; https://doi.org/10.3390/cryst9080395
Submission received: 9 July 2019 / Revised: 23 July 2019 / Accepted: 29 July 2019 / Published: 31 July 2019
(This article belongs to the Special Issue Zinc Oxide Nanomaterials and Based Devices)

Abstract

:
Zinc oxide (ZnO) materials irradiated with 350 MeV 56Fe21+ ions were studied by Raman spectroscopy, Photoluminescence spectra (PL) and Transmission electron microscope (TEM). After 56Fe21+ ion irradiation, a strong oxygen vacancy (Vo) related defect absorption peak at 576 cm−1 and an interstitial zinc (Zni) -related defect at 80 cm−1~200 cm−1 formed, and with the increase of dose, the absorption peak was obviously enhanced. Through theoretical calculation, different Raman incident light test methods wereused to determine the oxygen vacancy defect (Vo). There were no significant variation tendencies in the other Raman characteristic lines. Our results demonstrate an energy loss process contributing to the defect structure during irradiation. TEM images showed a lot of fundamental defects. But we see no distinct amorphization in the samples in the electron diffraction images, indicating that the higher energy and irradiation dose hardly affected the structure and performance of zinc oxide.

1. Introduction

ZnO is a kind of typical II–IV group elements oxide material, due to its excellent optical and electrical properties. Thus, it has received wide attention from the scientific community. Because of its simple synthesis and the possibility of optoelectronic integration, the application of ZnO in nano-electronics and nano-photonics [1,2,3,4] is very promising. In addition, ZnO has great application potential in ultraviolet laser devices and nano-photonics devices [5,6,7]. The research of related ZnO materials is mainly focused on voltage-dependent, gas sensing characteristics, the photocatalytic properties of nanomaterials [8,9], NiO/ZnO heterojunction ultraviolet detectors, and low dimensional ZnO heterojunction light emitting diodes, etc. [10,11,12]. There is relatively little research on the structural properties of ZnO materials in a strong radiation environment. There are few studies on the structural properties of Zinc oxide materials irradiated with energetic swift heavy ions.
Zinc oxide irradiated with swift heavy ions has been used to study the changes of the internal structure in detail by means of Raman spectra, Photoluminescence spectra (PL) and Transmission electron microscope (TEM). Researches on radiation resisting properties have important practical uses for the application of zinc oxide-related products in the aerospace industry in the years to come.

2. Experimental Procedure

The experimental samples for the commercial “O” surface polishing comprised zinc oxide single crystals with a surface normal direction of [0001] and an edge orientation of [11,12,13,14,15,16,17,18,19,20] (10 × 10 × 0.5 mm). The 350 MeV 56Fe21+ ion irradiation test was carried out at the Heavy Ions Research Facility in Lanzhou (HIRFL) at room temperature. The SRIM 2013 code theoretically calculated that the incidence depth of the 350 MeV 56Fe21+ ions in the ZnO is about 32.6 μm. The samples were irradiated in a target chamber with a vacuum of 5 × 10⁻⁵ Pa. The beam strength was 500 nA and beam spot area was Φ15 mm. Raman spectra adopted 532 nm lasers and measured from 80–660 cm−1. The scanning time at each point was 30 s. The PL spectra were obtained with 340 nm excitation light. TEM samples were prepared using the focusing ion beam technique. The microstructure of the irradiated zone was examined using a Jeol 200 CX microscope operated at 200 kV (SJEM-2100F JEOL, Japan).

3. Results and Discussion

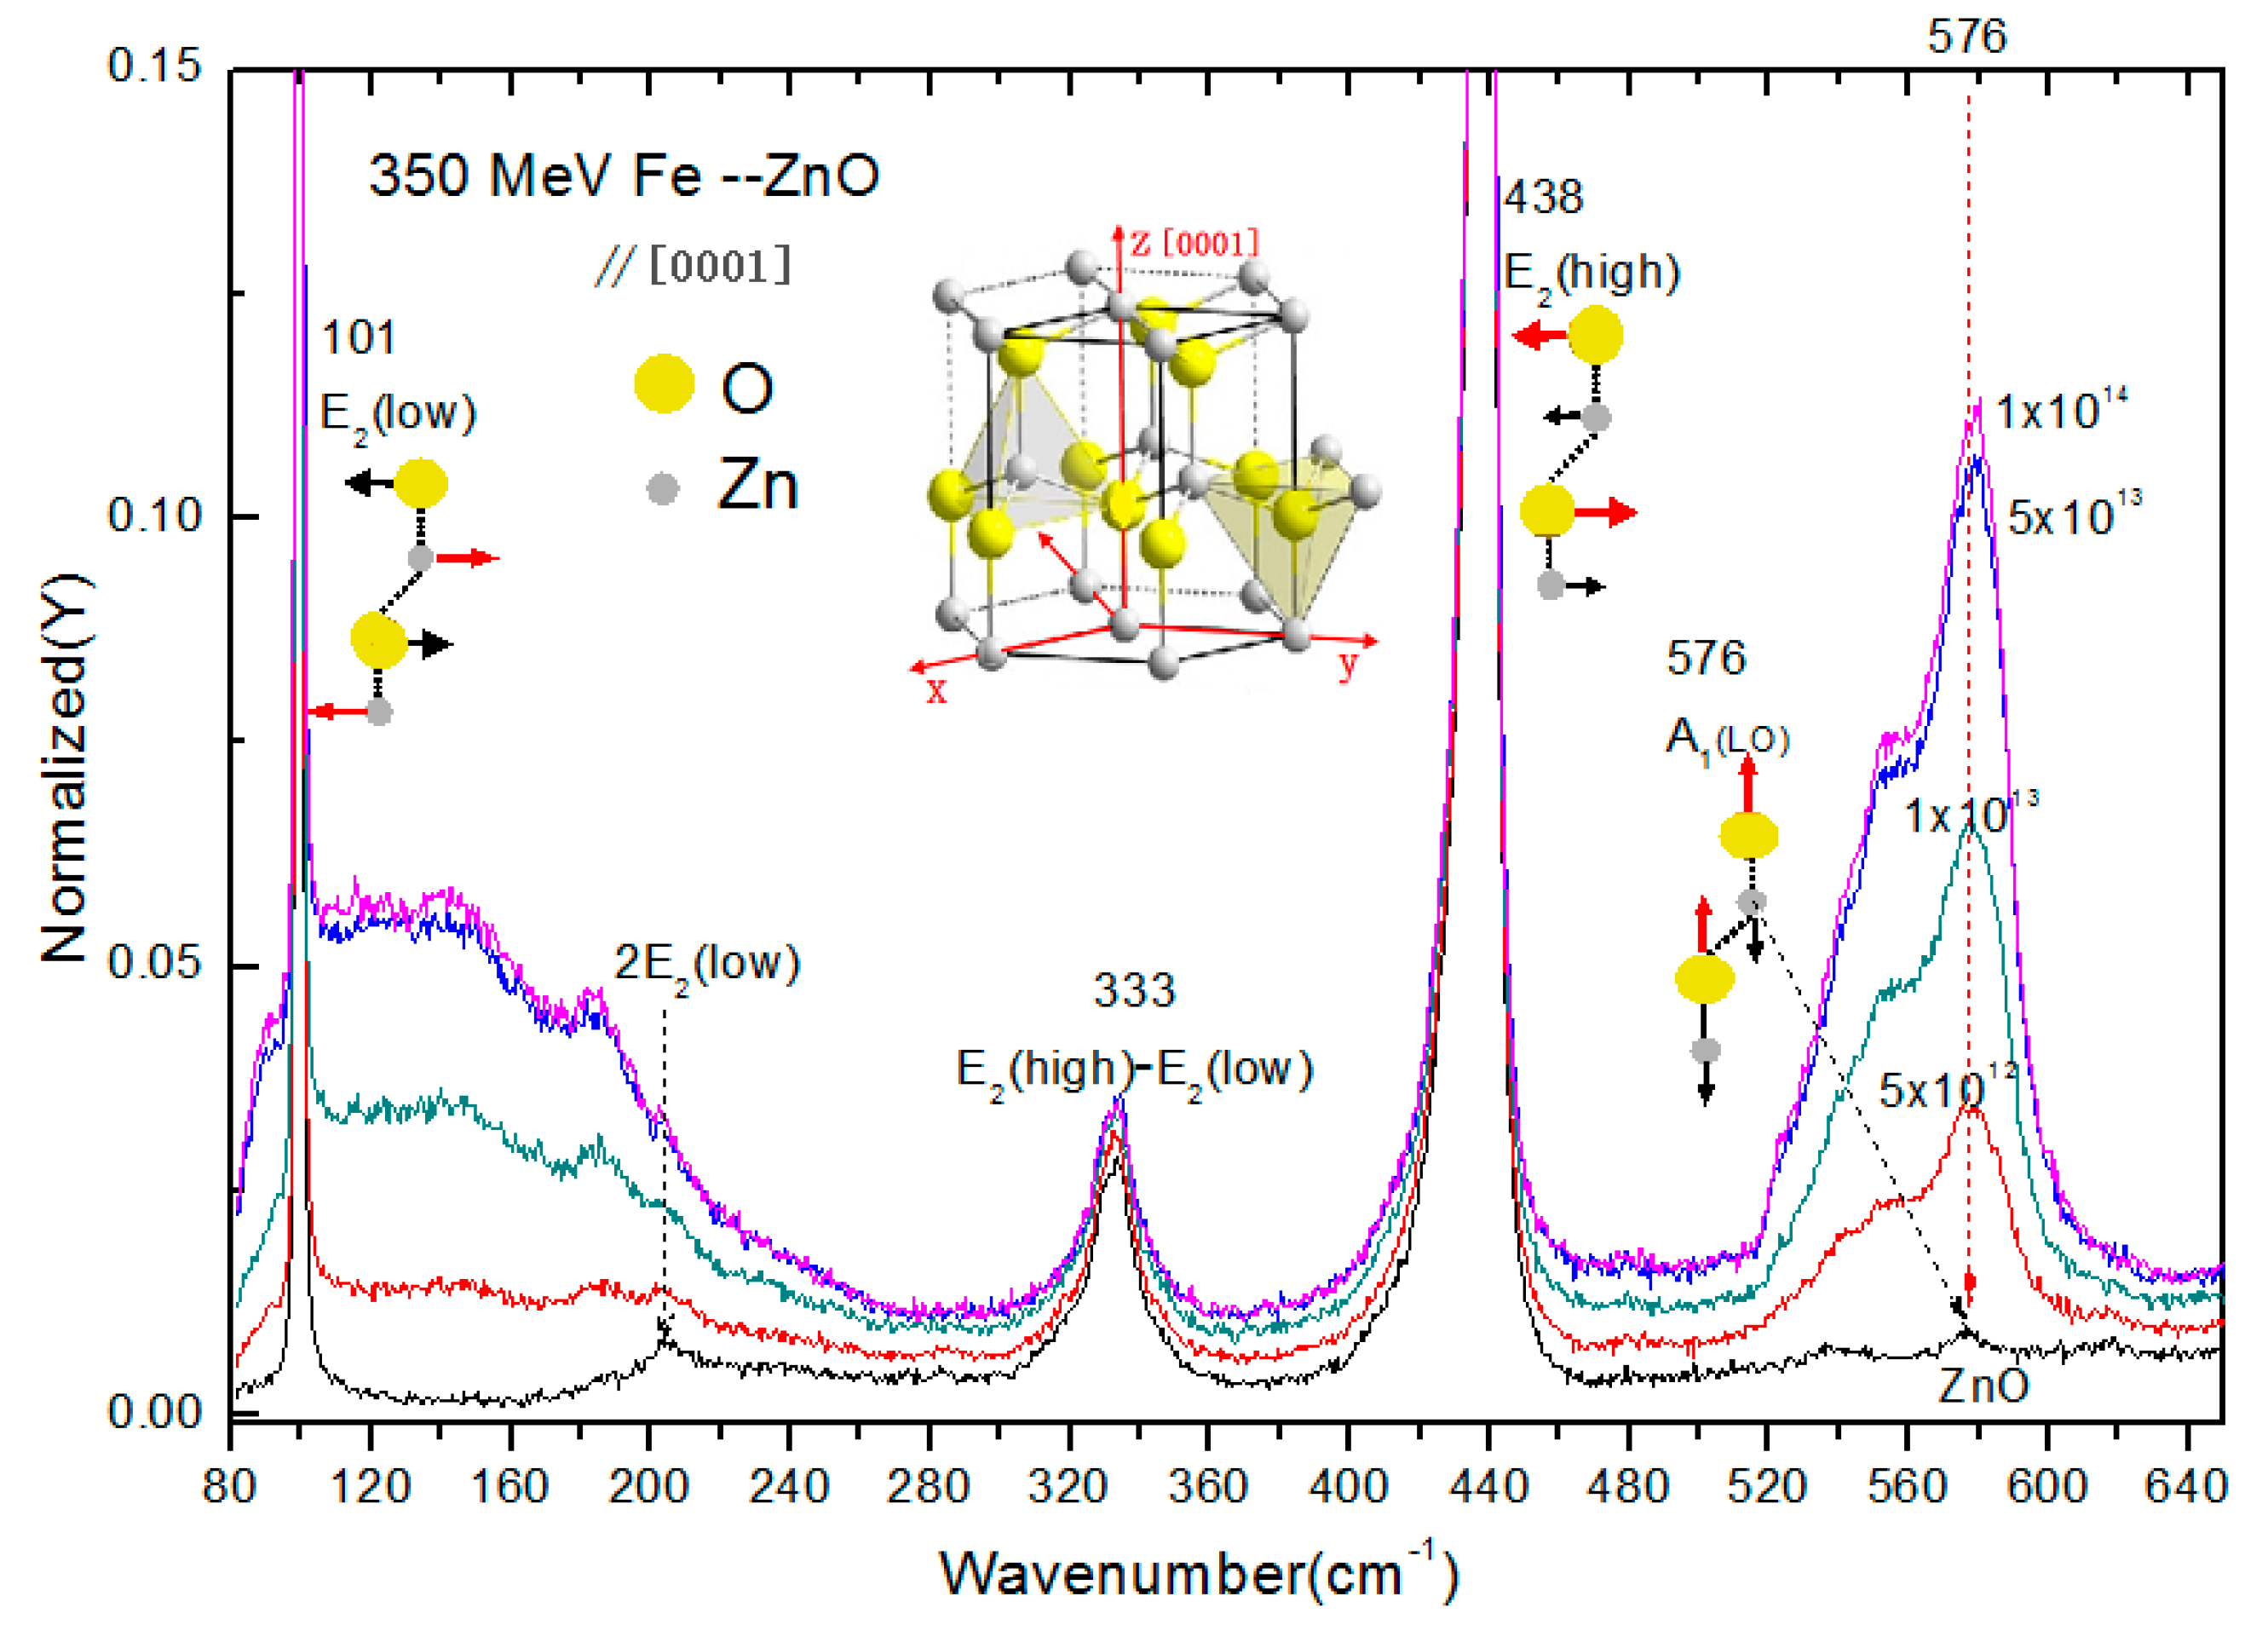
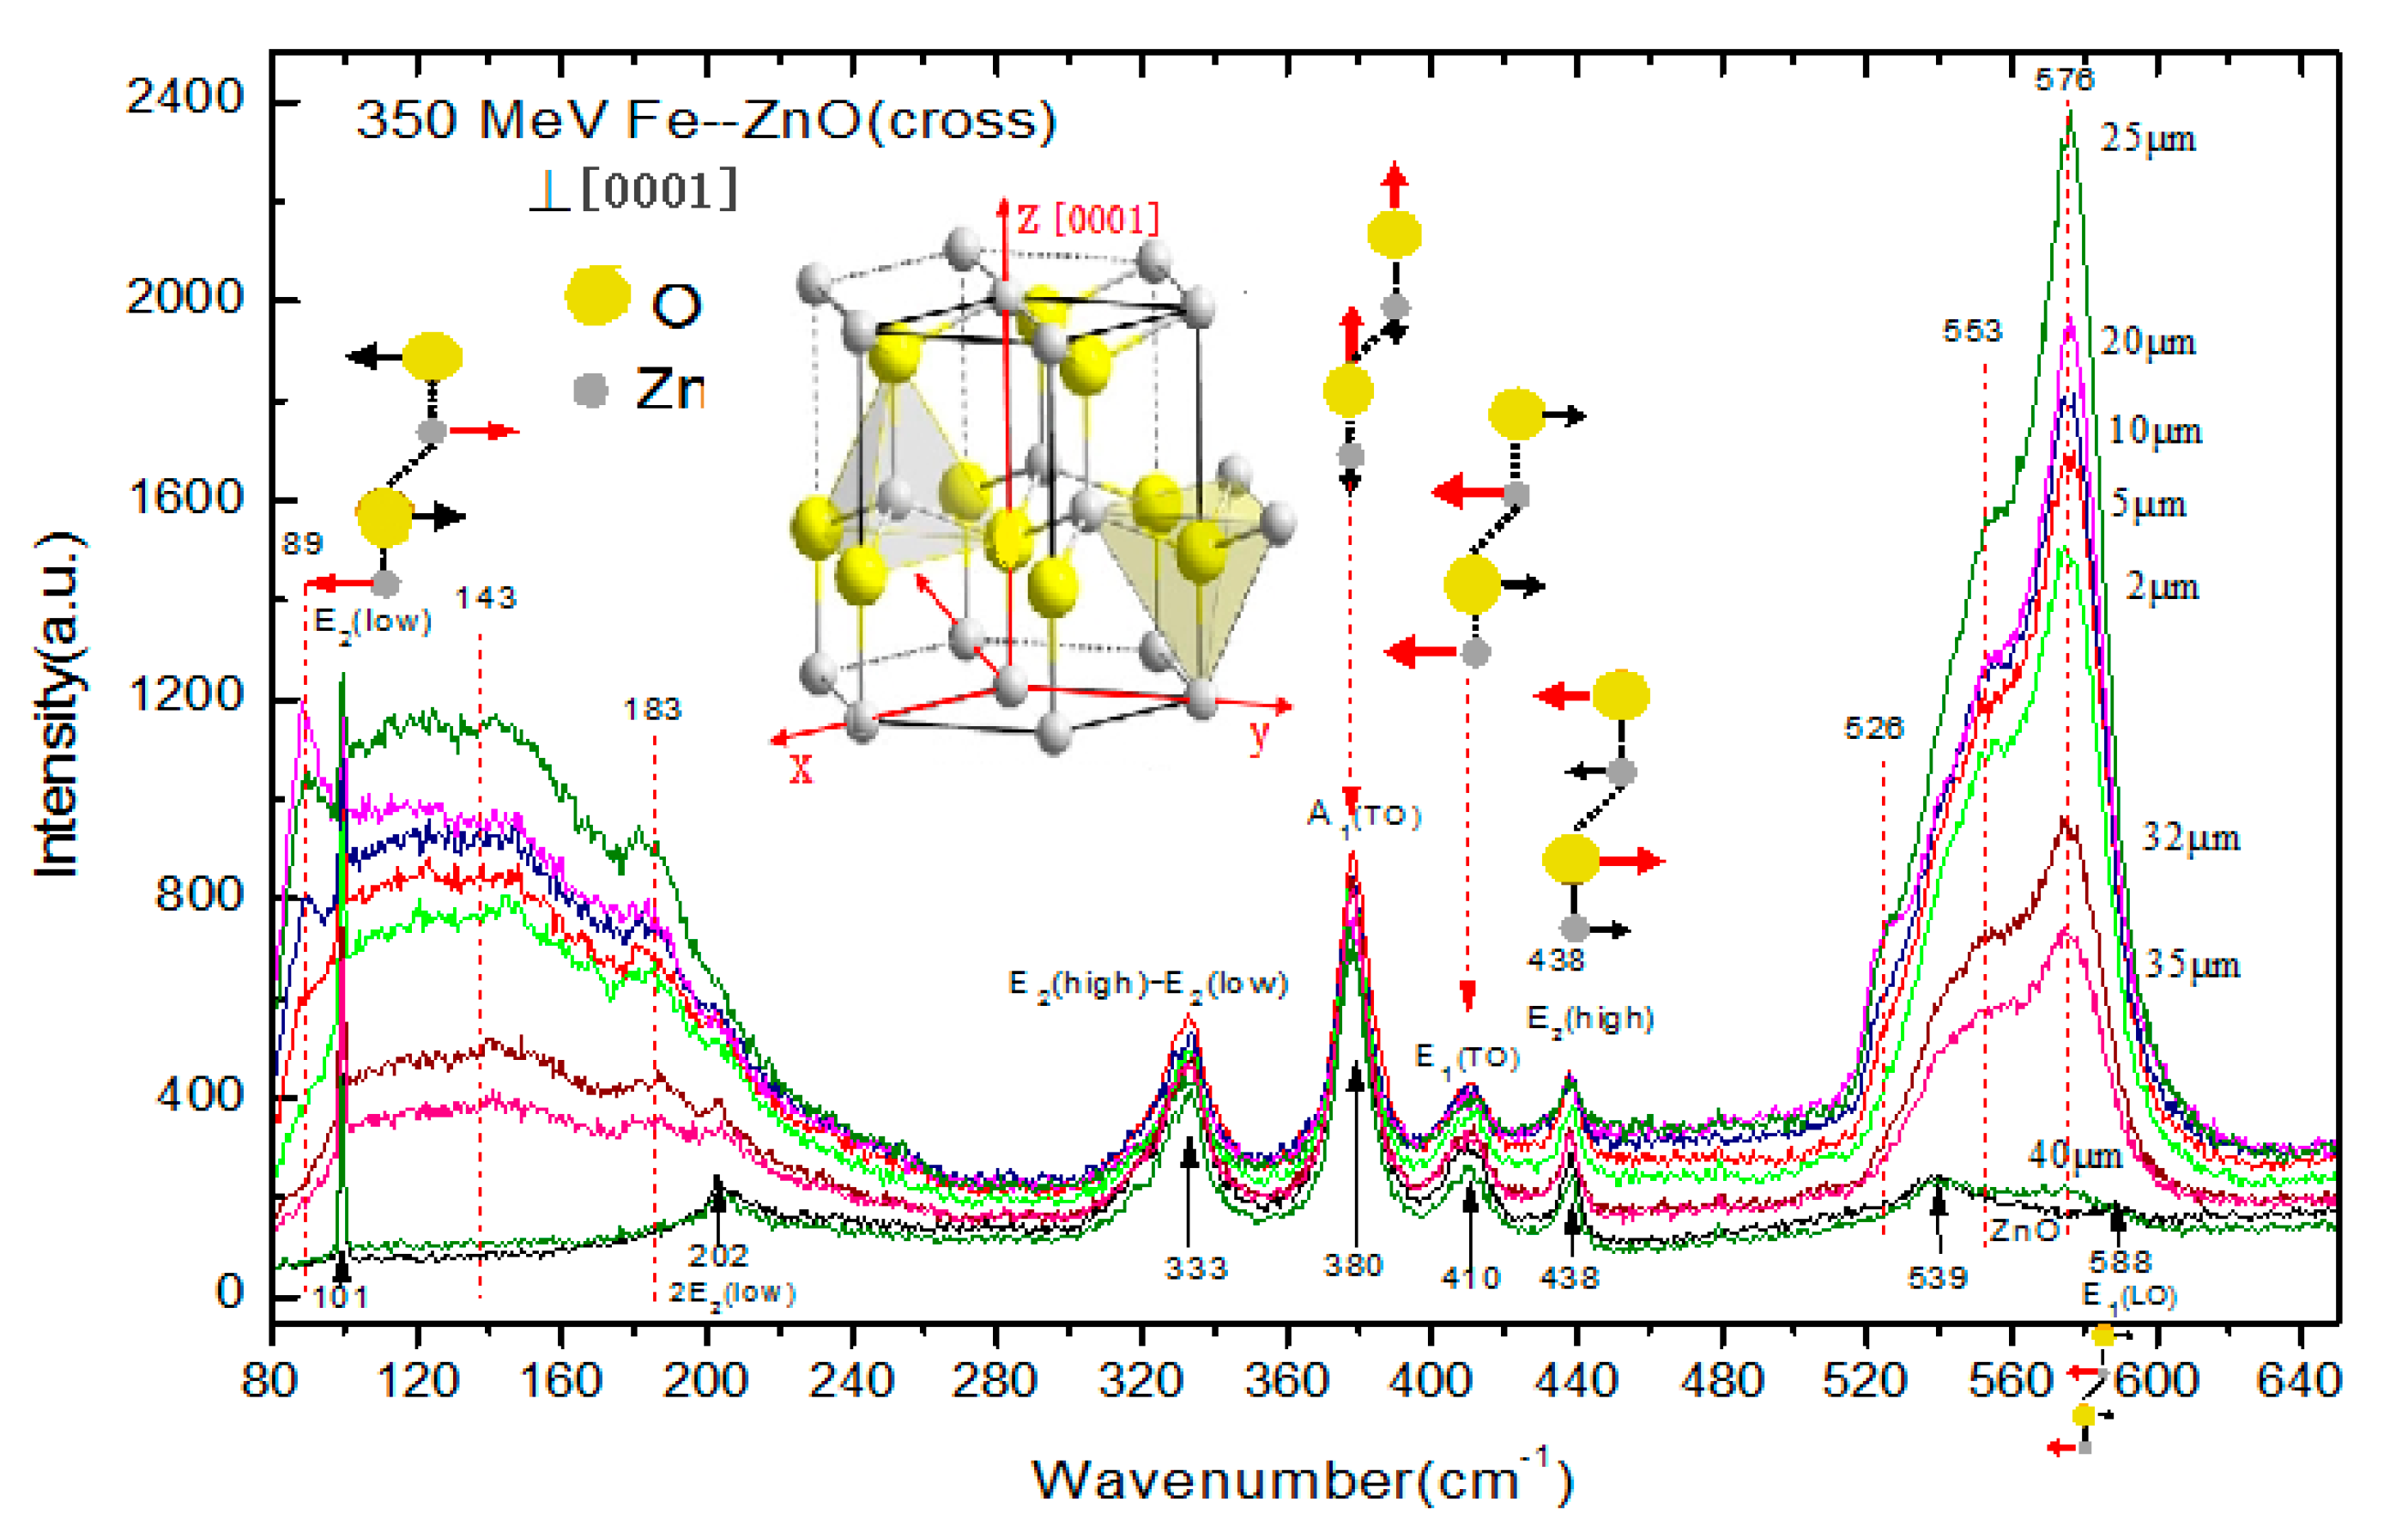
3.1. Raman Spectra of 56Fe21+ Ion-Irradiated ZnO

The Raman spectra of 56Fe21+ ion irradiated and unirradiated zinc oxide single crystals are provided in Figure 1. The Raman peaks are shown by the corresponding atomic oscillations in the middle picture of Figure 1, with the red arrows specifying the leading atomic shift direction. The incident light of the Raman laser were directed along the axis [0001] orientation. The eigenmode of E2(low), E2(high) and A1(LO) of unirradiated ZnO samples were located at 101 cm−1, 437 cm−1 and 576 cm−1, respectively. The 2E2(low) and E2(high)-E2(low) modes emerged at 202 cm−1 and 333 cm−1, respectively [13]. After irradiated by 56Fe21+ ions, wide absorption bands of 80 cm−1 ~245 cm−1 and 520 cm−1~600 cm−1 emerged. The 80 cm−1 ~ 245 cm−1 were affected by interstitial zinc ( Z n i ) [14,15]. The 520 cm−1~600 cm−1were generated by the oxygen vacancy defect (Vo) [16,17,18]. Since the characteristic vibration peaks associated with oxygen vacancy (Vo) defect at 576 cm−1 completely overlapped with the eigenmode of A1(LO), it was very difficult to confirm whether the strong vibration absorption peaks at 576 cm−1 were caused by A1(LO). According to the analysis of Raman scattering intensity of phonons based on Lattice dynamics theory, when the incident light was perpendicular to the axis [0001] of the crystal for Raman spectrum measurement, the A1(LO) vibration mode did not appear. Figure 2 shows the Raman scattering spectra of the specimen irradiated with 1 × 10¹⁴ ions/cm 256Fe21+ ions incident depth at different locations (2, 5, 10, 20, 25, 32, 35 and 40 microns away from the samples surface along the ion incident depth orientation, SRIM calculated that 350 MeV 56Fe21+ ion incident depth in ZnO is about 35 microns) were measured, and the incident light was perpendicular to the axis [0001]. In Figure 2, there is no A1(LO) pattern in the pristine sample shown with the black line. However, a strong peak appeared at 576 cm−1 after 56Fe21+ ion irradiation, which could only indicate that it was the absorption peak of oxygen vacancy (Vo) related defects. The absorption band of 80 cm−1 ~245 cm−1 shows interstitial zinc (Zni) defects, and the absorption band of the defects was obviously enhanced after 56Fe21+ ion irradiation. It may be seen from the figure that the other Raman characteristic lines have no significant variation tendency.

3.2. TEM of ZnO Irradiated with 56Fe21+ Ions

Figure 3 presents a high resolution electron microscope photograph of ZnO irradiated with 1×10¹⁴ ions/cm 256Fe21+ ions incident depth at different locations (It is 2, 10, 25 and 32 microns away from the samples surface) along the incident depth orientation of 56Fe21+ ions. As shown, after irradiation, a series of changes took place in the arrangement of atoms, including interstitial atoms, dislocations, vacancies, and other defects.The distances between planes in different directions (002), (200), (111) and (100) were determined by TEM measurement, which were 0.258, 0.19, 0.22 and 0.280 nm, respectively. At the same time, from the corresponding electron diffraction pattern on the right, the diffraction points in the samples were clear and orderly, and no noticeable amorphous phenomena appeared, which indicates that the higher energy (350 MeV) and higher irradiation dose (1 × 10¹⁴ ions/cm2) hardly affected the structure and performance of the entire zinc oxide.

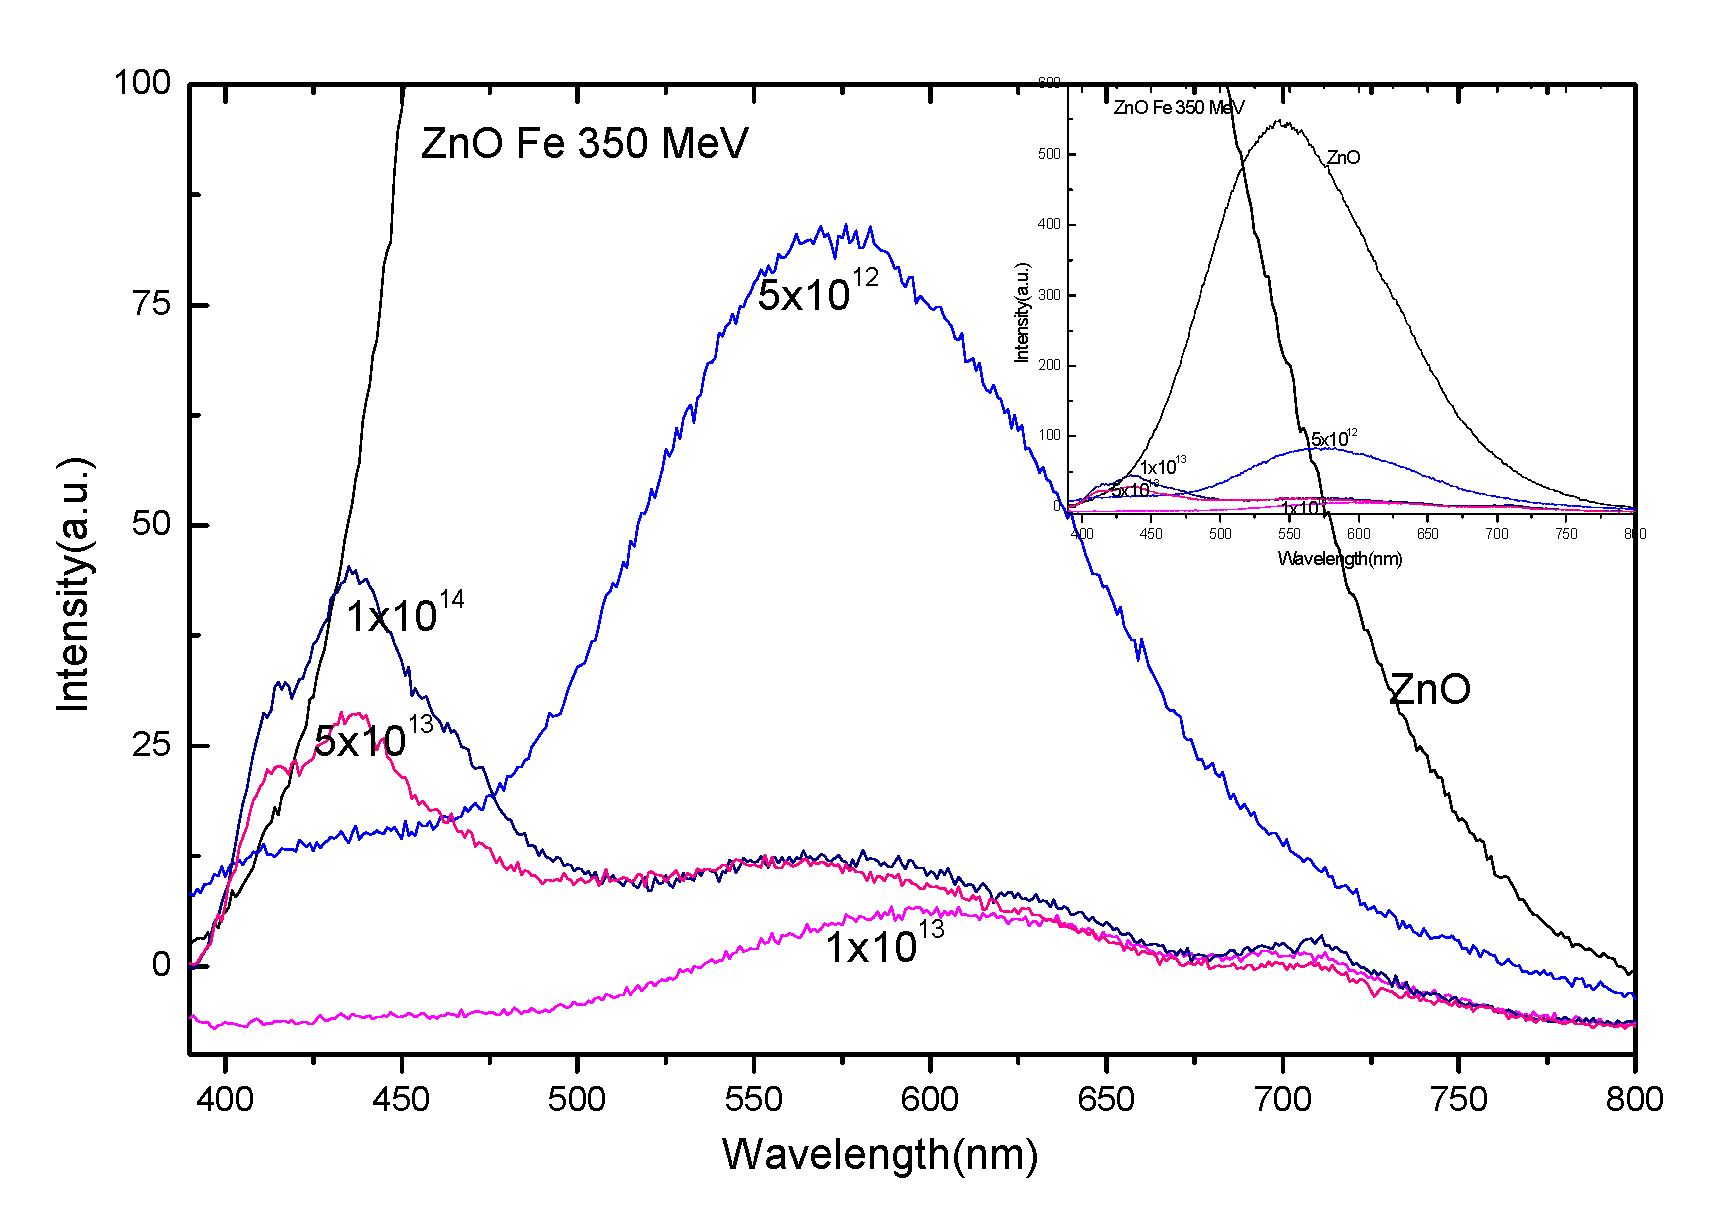
3.3. Photoluminescence Spectra of ZnO Irradiated with 56Fe21+ Ions

Photoluminescence is very sensitive to crystal structure defects. ZnO interband excitation causes electrons to jump from valence band to conduction band, leaving holes in the valence band. These holes migrate from the valence electron band to the deep level and recombine between the electrons in the conduction band or the shallow level and the capture hole in the deep level. The photoluminescence spectra of ZnO irradiated with 56Fe21+ ions and unirradiated are shown in Figure 4. With agradual increase of irradiation dose, the characteristic luminous peak of ZnO decreases rapidly, and various defective luminous peaks appear at 5 × 10¹³ ions/cm2 dose. Experimental data (black line) were fitted with Voigt peaks, the red curve represents the sum of fitted peaks (green peaks) plus the background in Figure 5. It is generally believed that in zinc oxide, oxygen vacancy (Vo), and interstitial zinc (Zni) are the donors, and zinc vacancy (Vzn) and interstitial oxygen (Oi) are the receptors [19,20]. In our experiment, anemission at around 410 nm may be related to the transition of electrons from the shallow donor level of Zni to the top level of the valence band.Emission at around 430 nm was associated with ZnO nanoparticles. The blue emission at about 450 nm may be attributed to the transition from the extended Zni state (slightly lower than the simple Zni state) to the valence band [20]. The red emission at about 580 nm, 640 nm, and 710 nm suggests that different Fe-related emitting centers coexist in ZnO irradiated with 350 MeV 56Fe21+ ions.

3.4. Theoretical Calculation and Discussion

A hexagonal fiber zinc structure is one of the most stable crystal structures with chemical characteristics. The lattice has hexagonal symmetry and belongs to C 6 v 4 space group. The Zn and O atoms in the crystal form a simple hexagonal lattice. Each primitive cell consists of two ZnO molecular units consisting of four atoms. There are eight optical vibrational modes at Γ point of the Brillouin zone center, which are expressed as: Γopt = A1 + 2B1 + E1 + 2E2 [21]. A1 and E1 are polar lattice vibrational modes, which are optical vibrational modes with Raman and infrared activities. Because the propagation direction is perpendicular to the axis [0001] symmetry, these modes are divided into E1(LO) (588 cm−1) and A1(TO) (380 cm−1) (LO, longitudinal optics. TO, transverse Optics). Polarization- induced mode E1(TO) (410 cm−1) and A1(LO) (576 cm−1) propagate parallel to the z axis in infrared region. In the first region of Brillouin A1, E1 is doubly degenerate, E2 (low is 101 cm−1, high is 438 cm−1) has Raman activity and B1 have no Raman activity. According to the lattice dynamics equation can calculate the phonon dispersion relations of wurtzite zinc oxide at Γ point in a particular orientation of the Brillouin zone center. As shown in Figure 6, there are three groups of optical modes in the high frequency range, namely, E1(LO), A1(LO) and B1(high). E2(high), E1(TO) and A1(TO) appear between 350 cm−1 to 550 cm−1 frequency range, and the low frequency has a single characteristic frequency which belongs to B1(low) and E2(low), respectively.
R. Loudon et al. [22] calculated the following five Raman tensors of ZnO:
ψ A 1 ( z ) = { a 0 0 0 a 0 0 0 b } ,   ψ E 1 ( x ) = { 0 0 - c 0 0 0 - c 0 0 } ,   ψ E 1 ( y ) = { 0 0 0 0 0 c 0 c 0 } ,   ψ E 2 ( x ) = { 0 d 0 d 0 0 0 0 0 } ,   ψ E 2 ( y ) = { d 0 0 0 - d 0 0 0 0 }
The Raman scattering strength is related to the polarization strength vectors e i and e s of the incident and scattered beam, that is, β = C | e i . ψ δ . e s | 2 . C is a constant, ψ δ is Raman tensor of phonon δ . Different Raman spectra may be measured by selecting the appropriate polarization orientation of incident beam. For instance, if we set the polarization strength vectors to e i = ( 0 , cos α , sin α ) , e s = ( 0 , cos α , sin α ) T , using the backscatter geometry x ( e i , e s ) x ¯ [23,24]. α is the angle between the incident light polarization orientation and the y axis. According to the above formula, it is possible to calculate the scattering strength β A 1 of A1 phonon, β E 1 ( x ) of E1(x), β E 2 ( x ) of E2(x), β E 1 ( y ) of E1(y) and β E 2 ( y ) of E2(y):
β E 1 ( x ) = | { 0 cos α sin α } T { 0 0 - c 0 0 0 - c 0 0 } { 0 cos α sin α } | 2 = 0
β E 1 ( y ) = | { 0 cos α sin α } { 0 0 - c 0 0 0 - c 0 0 } { 0 cos α sin α } | = C c 2 sin 2 ( 2 α )
β E 2 ( x ) = | { 0 cos α sin α } T { 0 d 0 d 0 0 0 0 0 } { 0 cos α sin α } | 2 = 0
β E 2 ( y ) = | { 0 cos α sin α } T { d 0 0 0 d 0 0 0 0 } { 0 cos α sin α } | 2 = C d 2 cos 4 α
β A 1 = | { 0 cos α sin α } T { a 0 0 0 a 0 0 0 b } { 0 cos α sin β } | 2 = C ( b sin 2 α + a cos 2 α ) 2
The β A 1 consequence is that the A1 mode is a vibration parallel to the axis [0001] of the crystal and the polarization orientation is non-degenerate along the axis [0001] direction. Figure 1 shows the propagation direction of incident light along the axis [0001], the scattering strength of E1(y) phonon β E 1 ( y ) = 0 and the vibrational mode of A1(LO) appeared at 576 cm−1. The E1 mode is the vertical axis [0001] vibration in the XY plane. The scattering strength of A1 phonon is β A 1 = 0 , only when the incident light orientation travel in the vertical z-axis plane and the E1(LO) (588 cm−1) mode is observed. These are confirmed in Figure 2. Therefore, after irradiation, it’s easy to distinguish between A1(LO) and the oxygen vacancy (Vo), which are changing. Both E2(low) and E2(high) modes can be detected simultaneously. This is due to the fact that the E2(low) mode is only associated with the vibration of Zn atoms, while the E2(high) mode is only associated with the vibration of O atoms. All of these are caused by a large number of interstitial oxygen and interstitial zinc atoms after 350 MeV 56Fe21+ ion irradiation. Correspondingly, the absorption band of zinc interstitial (Zni) defects was about 80~245 cm−1, and Vo at 576 cm−1 was detected. The strength of these absorption bands was relevant to the radiation influences of 350 MeV 56Fe21+ ions. This completely demonstrates the vibrational absorption peak at 576 cm−1 after irradiation with 56Fe21+ ions is Vo, rather than the vibration mode of A1(LO).

4. Conclusions

Raman spectra, PL spectra and TEM images of ZnO single crystals irradiated by 350 MeV56Fe21+ ions were studied. The experimental data showed that numerous of defects associated with oxygen vacancies and interstitial zinc were produced in ZnO after irradiated with 56Fe21+ ions. Through theoretical calculation and experimental testing, it was determined that the vibrational absorption peak at 576 cm−1 after irradiation with 56Fe21+ ions was due to the oxygen vacancy defect (Vo), rather than the eigenmode of A1(LO). The Raman spectra showed that the absorption peak of oxygen defects increased with anincrease of dose, and reached a saturation state with a 5 × 10¹³ ions/cm2 dose, which indicated that the local structure of ZnO single crystals had been destroyed after irradiation. However, with the other eigenmode, almost no change took place, i.e., a wurtzite structure was retained. It is difficult to produce amorphous crystals, even after swift heavy ion irradiation. The results show that ZnO has excellent radiation resisting properties.

Author Contributions

Y.S. was responsible for writing manuscripts, irradiation experiments, testing and analysis, etc. S.Z. participated in the test and analysis of Raman data, Y.Y. and C.Z. participated in research design, data analysis and other work, K.L. participated in ion beam irradiation experiments.

Funding

This research received the financial supports of The National Natural Science Foundation of China (Nos.1103Y623010, Nos.11705246) and National Science Foundation of China (Grant number U1532262).

Conflicts of Interest

The authors declare no conflict of interest. The funders had no role in the design of the study.

References

  1. Wang, Z.L. Zinc oxide nanostructures: Growth, properties and applications. J. Phys. Condens. Matter. 2004, 16, R829–R858. [Google Scholar] [CrossRef]
  2. Ozgur, U.; Alivov, Y.I.; Liu, C.; Teke, A.; Reshchikov, M.A.; Dogan, S.; Avrutin, V.; Cho, S.J.; Morkoçet, H. A comprehensive review of ZnO materials and devices. J. Appl. Phys. 2005, 98, 41301. [Google Scholar] [CrossRef] [Green Version]
  3. Pearton, S.J.; Norton, D.P.; Tien, L.C.; Guo, J. Modeling and Fabrication of ZnO Nanowire Transistors. IEEE Trans. Electron Devices 2008, 55, 3012–3019. [Google Scholar] [CrossRef]
  4. Wu, C.L.; Guo, J.H.; Yao, H.B. Study on the photoluminescence properties of ZnOsinglecrystal. Spectrosc. Spectr. Anal. 2016, 6, 1700–1702. [Google Scholar]
  5. Xu, S.; Qin, Y.; Xu, C.; Wei, Y.; Yang, R.; Wang, Z.L. Self-powered nanowire devices. Nat. Nanotechnol. 2010, 5, 366–373. [Google Scholar] [CrossRef]
  6. Leong, E.S.P.; Yu, S.F.; Lau, S.P. Directional edge-emitting UV random laser diodes. Appl. Phys. Lett. 2006, 89, 221109. [Google Scholar] [CrossRef]
  7. Guo, R.; Nishimura, J.; Matsumoto, M.; Higashihata, M.; Nakamura, D.; Okada, T. Electroluminescence from ZnO nanowire-based p-GaN/n-ZnO heterojunction light-emitting diodes. Appl. Phys. B 2009, 94, 33–38. [Google Scholar] [CrossRef]
  8. Duta, M.; Perniu, D.; Duta, A. Photocatalytic zinc oxide thin films obtained by surfactant assisted spray pyrolysis deposition. Appl. Surf. Sci. 2014, 306, 80–88. [Google Scholar] [CrossRef]
  9. Pal, S.; Sarkar, A.; Chattopadhyay, S.; Chakrabarti, M.; Sanyal, D.; Kumar, P.; Kanjilal, D.; Rakshitf, T.; Ray, S.K.; Jana, D. Defects in 700 keV oxygen ion irradiated ZnO. Nucl. Instrum. Methods Phys. Res. B 2013, 311, 20–26. [Google Scholar] [CrossRef]
  10. Crupi, I.; Boscarino, S.; Strano, V.; Mirabella, S.; Simone, F.; Terrasi, A. Optimization of ZnO:Al/Ag/ZnO:Al structures for ultra-thin high-performance transparent conductive electrodes. Thin Solid Films 2012, 520, 4432–4435. [Google Scholar] [CrossRef]
  11. Choi, K.H.; Nam, H.J.; Jeong, J.A.; Cho, S.W.; Kim, H.K.; Kang, J.W.; Kim, D.G.; Cho, W.J. Highly flexible and transparent InZnSnOx/Ag/InZnSnOx multilayer electrode for flexible organic light emitting diodes. Appl. Phys. Lett. 2008, 92, 223302–223303. [Google Scholar] [CrossRef]
  12. Martín-Tovar, E.A.; Castro-Rodríguez, R.; Daza, L.G.; Méndez-Gamboa, J.; Medina-Esquivel, R.; Perez- Quintana, I.; Iribarren, A. Structural and optical properties of ZnO thin films prepared by laser ablation using target of ZnO powder mixture with glue. Bull. Mater. Sci. 2017, 40, 467–471. [Google Scholar] [CrossRef] [Green Version]
  13. Jaramillo, A.F.; Baez-Cruz, R.; Montoya, L.F. Estimation of the surface interaction mechanism of ZnO nanoparticles modified with organosilane groups by Raman Spectroscopy. Ceram. Int. 2017, 43, 11838–11847. [Google Scholar] [CrossRef]
  14. Chae, K. Electronic structures of a Zn vacancy on the ZnOsurface: Density functional theory calculations. J. Korean Phys. Soc. 2013, 62, 508–512. [Google Scholar] [CrossRef]
  15. Yao, Z.R.; Tang, K.; Xu, Z.H.; Ye, J.D.; Zhu, S.M.; Gu, S.L. The luminescent inhomogeneity and the distribution of zinc vacancy-related acceptor-like defects in N-Doped ZnOmicrorods. Nanoscale Res. Lett. 2016, 11, 511. [Google Scholar] [CrossRef]
  16. Yao, Y.H.; Cao, Q.X. First-principles study on infrared absorptions of transition metal-doped ZnO with oxygen vacancy. Acta. Metall. Sin. (Engl. Lett.) 2013, 26, 467–472. [Google Scholar] [CrossRef] [Green Version]
  17. Li, W.L.; Hou, Q.Y.; Jia, X.F.; Xu, Z.C. Effects of la doping and Zn or O vacancy on the magnetic property of ZnO. J. Supercond. Nov. Magn. 2018, 31. [Google Scholar] [CrossRef]
  18. Ding, Y.; Pradel, K.C.; Wang, Z.L. In situ transmission electron microscopy observation of ZnO polar and non-polar surfaces structure evolution under electron beam irradiation. J. Appl. Phys. 2016, 119, 015305. [Google Scholar] [CrossRef]
  19. Zeng, H.B.; Duan, G.T.; Li, Y.; Yang, S.K.; Xu, X.X.; Cai, W.P. Blue luminescence of ZnO nanoparticles based on non-equilibrium processes defect origins and emission controls. Adv. Funct. Mater. 2010, 20, 561. [Google Scholar] [CrossRef]
  20. Duan, L.B.; Zhao, X.R.; Wang, Y.J.; Geng, W.C.; Zhang, F.L. Structural and optical properties of (Mg, Al) –codoped ZnO nanoparticles synthesized by the auto combustion method. Ceram. Int. 2015, 41, 6373–6380. [Google Scholar] [CrossRef]
  21. Serrano, J.; Romero, A.H.; Manjon, F.J.; Lauck, R.; Cardona, M.; Rubio, A. Pressure dependence of the lattice dynamics of ZnO: An ab initio approach. Phys. Rev. B 2004, 69, 094306. [Google Scholar] [CrossRef]
  22. Loudon, R. The Raman effect in crystals. Adv. Phys. 1964, 13, 423–482. [Google Scholar] [CrossRef]
  23. Tell, B.; Damen, T.C.; Porto, S.P.S. Raman Effect in cadmium sulfide. Phy. Rev. 1966, 142, 570–576. [Google Scholar] [CrossRef]
  24. Song, Y.; Gou, J.; Yang, Y.T.; Ding, Z.N.; Zhang, S.X.; Zhang, C.H. Microstructure property study of ZnO single crystal irradiated with 200 MeV Kr ions. Mater. Res. Express 2019, 6, 026203. [Google Scholar]
Figure 1. Raman spectra of ZnO irradiated and unirradiated by 56Fe21+ ions were measured. Direction of the laser was along the axis [0001] of the crystal. The ZnO structure of wurtzite is shown in the figure. The Raman peaks are assigned by corresponding atomic oscillations (the motion of the dominant atom is indicated by the red arrow).
Crystals 09 00395 g001
Figure 2. Raman spectra (incident light is perpendicular to the axis [0001]) of ZnO irradiated by 56Fe21+ ion with irradiation does of 1 × 10¹⁴ ions/cm2. The incident ions were along [0001] of the crystal. The zinc oxide structure of wurtzite is shown in the image. The Raman peaks are described by corresponding atomic oscillations. (The motion of the dominant atom is indicated by the red arrows).
Crystals 09 00395 g002
Figure 3. TEM images and corresponding diffraction patterns of 56Fe21+ ion irradiated ZnO at different depths ((a) is 2 μm, (b) is 10 μm, (c) is 25 μm, (d) is 32 μm) along the incident direction of 56Fe21+ ions. Irradiation does of heavy ions were 1 × 10¹⁴ ions/cm2.
Crystals 09 00395 g003
Figure 4. PL spectra of ZnO irradiated with 56Fe21+ ions measured by excited light at 340 nm. The image on the upper right is a panorama of the image.
Crystals 09 00395 g004
Figure 5. PL spectra of ZnO irradiated with 1 × 10¹³ ions/cm 256Fe21+ ions. Experimental data (black line) were fitted with Voigt peaks, the red curve represents the sum of fitted peaks (green peaks) plus background.
Crystals 09 00395 g005
Figure 6. Phonon dispersion relationship of wurtzite zinc oxide are calculatedat Γ point in the specified direction of the Brillouin zonecenter by using the lattice dynamics equation. Molecular vibration represented by red font (E1, E2, A1) can be observed through Raman scattering, while B1 mode represented by green font can’t be observed through Raman scattering.
Crystals 09 00395 g006

