Article

Selection of CVD Diamond Crystals for X-ray Monochromator Applications Using X-ray Diffraction Imaging

1
Cornell High Energy Synchrotron Source, Cornell University, Ithaca, NY 14853, USA
2
Advanced Photon Source, Argonne National Laboratory, Lemont, IL 60439, USA
3
Laboratory of Atomic and Solid State Physics, Cornell University, Ithaca, NY 14853, USA
*
Author to whom correspondence should be addressed.
Crystals 2019, 9(8), 396; https://doi.org/10.3390/cryst9080396
Submission received: 22 June 2019 / Revised: 19 July 2019 / Accepted: 28 July 2019 / Published: 31 July 2019
(This article belongs to the Special Issue Synthesis and Characterization of Diamond Crystals)

Abstract

:
A set of 20 single crystal diamond plates synthesized using chemical vapor deposition (CVD) was studied using X-ray diffraction imaging to determine their applicability as side-bounce (single-reflection) Laue monochromators for synchrotron radiation. The crystal plates were of optical grade (as provided by the supplier) with (001) nominal surface orientation. High dislocation density was found for all samples. Distortions in the crystal lattice were quantified for low-index Laue reflections of interests using rocking curve topography. Maps of effective radius of curvature in the scattering plane were calculated using spline interpolation of the rocking curve peak position across the studied plates. For several selected plates, nearly flat regions with large effective radius of curvature were found ( R 0 30 70 m, some regions as large as 1 × 4 mm 2 ). The average width of the rocking curve for these regions was found to be about 150 μ rad (r.m.s.). These observations suggest that the selected CVD diamond plates could be used as intermediate-bandwidth monochromators refocusing the radiation source to a specific location downstream with close to 1:1 distance ratio.

Graphical Abstract

1. Introduction

Chemically vapor-deposited single crystal (sc-CVD) diamond is a synthetic material with many emerging applications in modern technology. sc-CVD diamond retains the spectacular thermal and mechanical properties of single crystal diamond, natural or the more demanding (grown in equilibrium conditions) high-pressure high-temperature (HPHT) material [1,2]. It has been shown that regions of nearly perfect crystal lattices exist in HPHT diamond, which can be used for the next-generation high-resolution X-ray optics [3,4] (including high radiation heat load applications). In contrast, CVD crystals show increased dislocation densities, which results in broadening of X-ray rocking curves and reduction in X-ray reflectivity per unit spectral interval (not to be confused with the overall increase in integrated reflectivity frequently observed for imperfect crystals). Successful attempts to reduce dislocation density in CVD diamond have been reported (e.g., [5]), yet, availability of high-quality CVD and HPHT crystals remains limited. At the same time, many X-ray studies performed at present using conventional X-ray sources and synchrotrons do not rely on the narrow radiation bandwidths provided by reflections in perfect crystals ( Δ E / E 10 4 ), but instead benefit from the increased photon flux due to the use of a monochromator element with an increased acceptance radiation bandwidth. Traditionally, the desired increase ( Δ E / E 10 2 10 3 ) is accomplished using multilayer monochromators (e.g., [6,7]) or refractive lenses (e.g., [8]). Imperfect/mosaic CVD diamond crystal can be considered as a cost-efficient alternative for the high-heat-load monochromator element. The benefits are a relatively low cost of the element and a reduction in the monochromator operational expenses (possible use of water cooling as opposed to cryogenic cooling under conditions of high incident X-ray power density). In the previous study we described substantial broadening of X-ray rocking curves in sc-CVD diamond plates while retaining high reflectivity in the Laue geometry for hard X-rays [9]. The challenge for the application of sc-CVD diamond crystals as X-ray monochromator elements at synchrotrons originates from distortion of the radiation wavefront of the reflected X-rays due to imperfections of the crystal lattice.
The distortion can be conditionally ascribed to two major effects: the intrinsic effective curvature of the crystal lattice across the incident beam footprint (total curvature) and the increase in radiation divergence due to local interaction with misoriented crystal blocks. In general the two effects are coupled by the stress-strain elasticity relationships: bending of the crystal lattice results in a change of the lattice parameter locally. Experiments show that the most dramatic effect on the reflected radiation wavefront (e.g., increased beam size and the resulting loss in the reflected radiation flux density) is due to substantial total lattice curvature [10]. This parameter is typically not controlled during CVD growth. Therefore, quantitative characterization of the total curvature is an important step in selection of CVD diamond crystals for X-ray monochromator applications. In this work we describe evaluation of the total lattice curvature using X-ray diffraction imaging (double-crystal X-ray topography), present quantitative characterization results and the related statistics for a collection of sc-CVD diamond plates of the nominal “optical” grade featuring high dislocation densities.
Distortions of the crystal lattice were quantified using rocking curve topography [11] in the double-crystal configuration. Rocking curve peak position topographs visualize and quantify effective misorientation of different crystal regions (fulfillment of the Bragg’s condition locally at different orientation angles), revealing regions with larger or smaller variations. To further characterize the crystals as X-ray reflectors, maps of the effective radius of curvature in the scattering plane were generated using spline interpolation of the rocking curve peak position profiles. Substantial variation in the radius of curvature were found among all samples as well as across each individual crystal plate. For several selected plates regions with large radius of curvature ( R 0 30–70 m) were found (some regions as large as 1 × 4 mm 2 ). For a given radius of curvature and the reflection geometry focusing distances can be predicted, which presents an opportunity to use the CVD diamond as a refocusing monochromator. The standard deviation for the rocking curve peak position across the nearly flat regions of interest (ROIs) can be as small as 20 μ rad. The average rocking curve width for the ROIs was found to be about 150 μ rad (r.m.s.). By decoupling the shear (lattice rotation) and the lattice spacing (dilation-compression) contributions to the rocking curve peak position topographs it was found that the local lattice rotation is the dominant contribution (analysis performed for one of the plates). The variation due to the lattice spacing was found to be 24 μ rad (r.m.s.) across the ROI.

2. Samples

A set of 20 sc-CVD diamond plates of the optical grade was obtained from Applied Diamond Inc., (DE, USA). The plates were of square shape with 7 × 7 mm 2 area and of 1 mm thickness. The nominal crystallographic orientation of the 7 × 7 mm 2 surface was (001). Twelve of the studied plates had (100) edge orientation and the remaining eight plates had (110) edge orientation. Crystallographic orientation of the plates was measured using Multiwire X-ray back-reflection instrument at Cornell Center for Materials Research. Deviations from the nominal surface orientation were measured for each sample with ±0.5 precision. These deviations did not exceed 4 . White-beam X-ray topography in the transmission (Laue) geometry was performed for selected samples at 1-BM Optics beamline of the Advanced Photon Source (Argonne National Laboratory, IL, USA). A dense network of dislocations was found for all studied samples (dislocation densities above 10 4 cm 2 ). A representative topograph for one of the samples is shown in Figure A1.

3. Experiments

Rocking curve imaging of the CVD diamond crystal plates aligned for either 111, 220 or 400 Laue reflections was performed in the double-crystal nearly-nondispersive configurations shown in Figure 1. The experiments were conducted at 1-BM Optics beamline using the sequential X-ray topography setup [12]. The bending magnet synchrotron radiation is monochromatized using a Si 111 double-crystal monochromator (DCM). An asymmetric Si crystal serving as beam conditioner is in the dispersive arrangement to the DCM’s second crystal, which further reduces the radiation bandwidth. The asymmetry is described by the angle between the lattice planes of the working reflection and the entrance crystal surface (the asymmetry angle η ). The beam conditioner reflection is selected with an approximate match in d-spacing to the studied diamond reflection. The beam conditioner crystal and the diamond crystal reflections were set in the nearly non-dispersive configuration (e.g., [13]). The profile of the X-ray beam reflected from the diamond crystal is imaged using a digital area detector (AD). The configuration of experimental setup depicted in Figure 1a was used to study (110)-edge oriented diamond plates using the 220 Laue reflection, while the configuration shown in Figure 1b was used to study (100)-edge oriented plates using the 400 Laue reflection. To complement synchrotron experiments, some of the (110)-edge oriented plates were studied using Cu K α rotating anode source (Rigaku), in a configuration shown in Figure 1c. These measurements required increased data collection time (about 2 h per plate). A photon counting area detector was used to facilitate data collection. The resulting topographs were found to be noisy. Nevertheless, the angular characteristics were determined and found satisfactory upon cross-check with synchrotron measurements for one of the plates. The parameters of the configurations are summarized in Table 1.
Measurements were performed while scanning the angle of the diamond crystal plate in the scattering plane. Images of the beam profile were taken at each angular setting of the crystal over its reflection curve. The scattering plane was vertical ( σ -polarization of the X-ray wave) in the synchrotron experiments. In the configuration with the rotating anode source the scattering plane was horizontal. The sequences of collected images were sorted to calculate local rocking curves for each detector pixel. Rocking curve topographs were computed using rctopo code of the DTXRD package [14]. The parameters of the local rocking curves were obtained using Gaussian profile fitting of the local rocking curves.
These topographs in the Laue geometry represent projections of the crystal volume across its entire thickness. A geometric representation of the Laue diffraction geometry for a collimated monochromatic incident beam shows that each ray in the reflected beam emanating from the crystal at a given point originates from a finite crystal volume defined by the Borrmann triangle as shown in Figure 2. The base of the triangle on the entrance surface of the crystal is
l 0 = t 0 1 G 0 2 + 1 G h 2 2 cos 2 θ C G 0 G h ,
where t 0 is the thickness of the plate, θ C is the Bragg angle, G 0 = cos ϕ 0 and G h = cos ϕ h are the direction cosines with respect to the surface normal z . In the case of a symmetric Laue reflection ( G 0 = G h = cos θ C ) Equation (1) reduces to l 0 = 2 t 0 tan θ C . Thus, good lateral resolution can be achieved only for thin specimens at shallow Bragg angles.
Spatial restriction of the incident radiation to a narrow “pencil” beam permits depth resolution in the Laue geometry, which is known as section topography. The principle of section topography can be easily understood by reversing the direction of propagation of X-rays in Figure 2. Unlike in traditional X-ray topography (using either white-beam or monochromatic X-rays) where quantitative analysis is focused on studies of defect-induced diffraction contrast (e.g., [15,16]) our goal is to quantitatively map macroscopic characteristics (reflectivity, peak position and curve’s width) using rocking curve imaging. In our study, the incident monochromatic radiation illuminates the entire volume of the crystal. This approach is particularly useful for visualizing and quantifying the regions (contours) of equal effective orientation of the distorted crystal lattice.

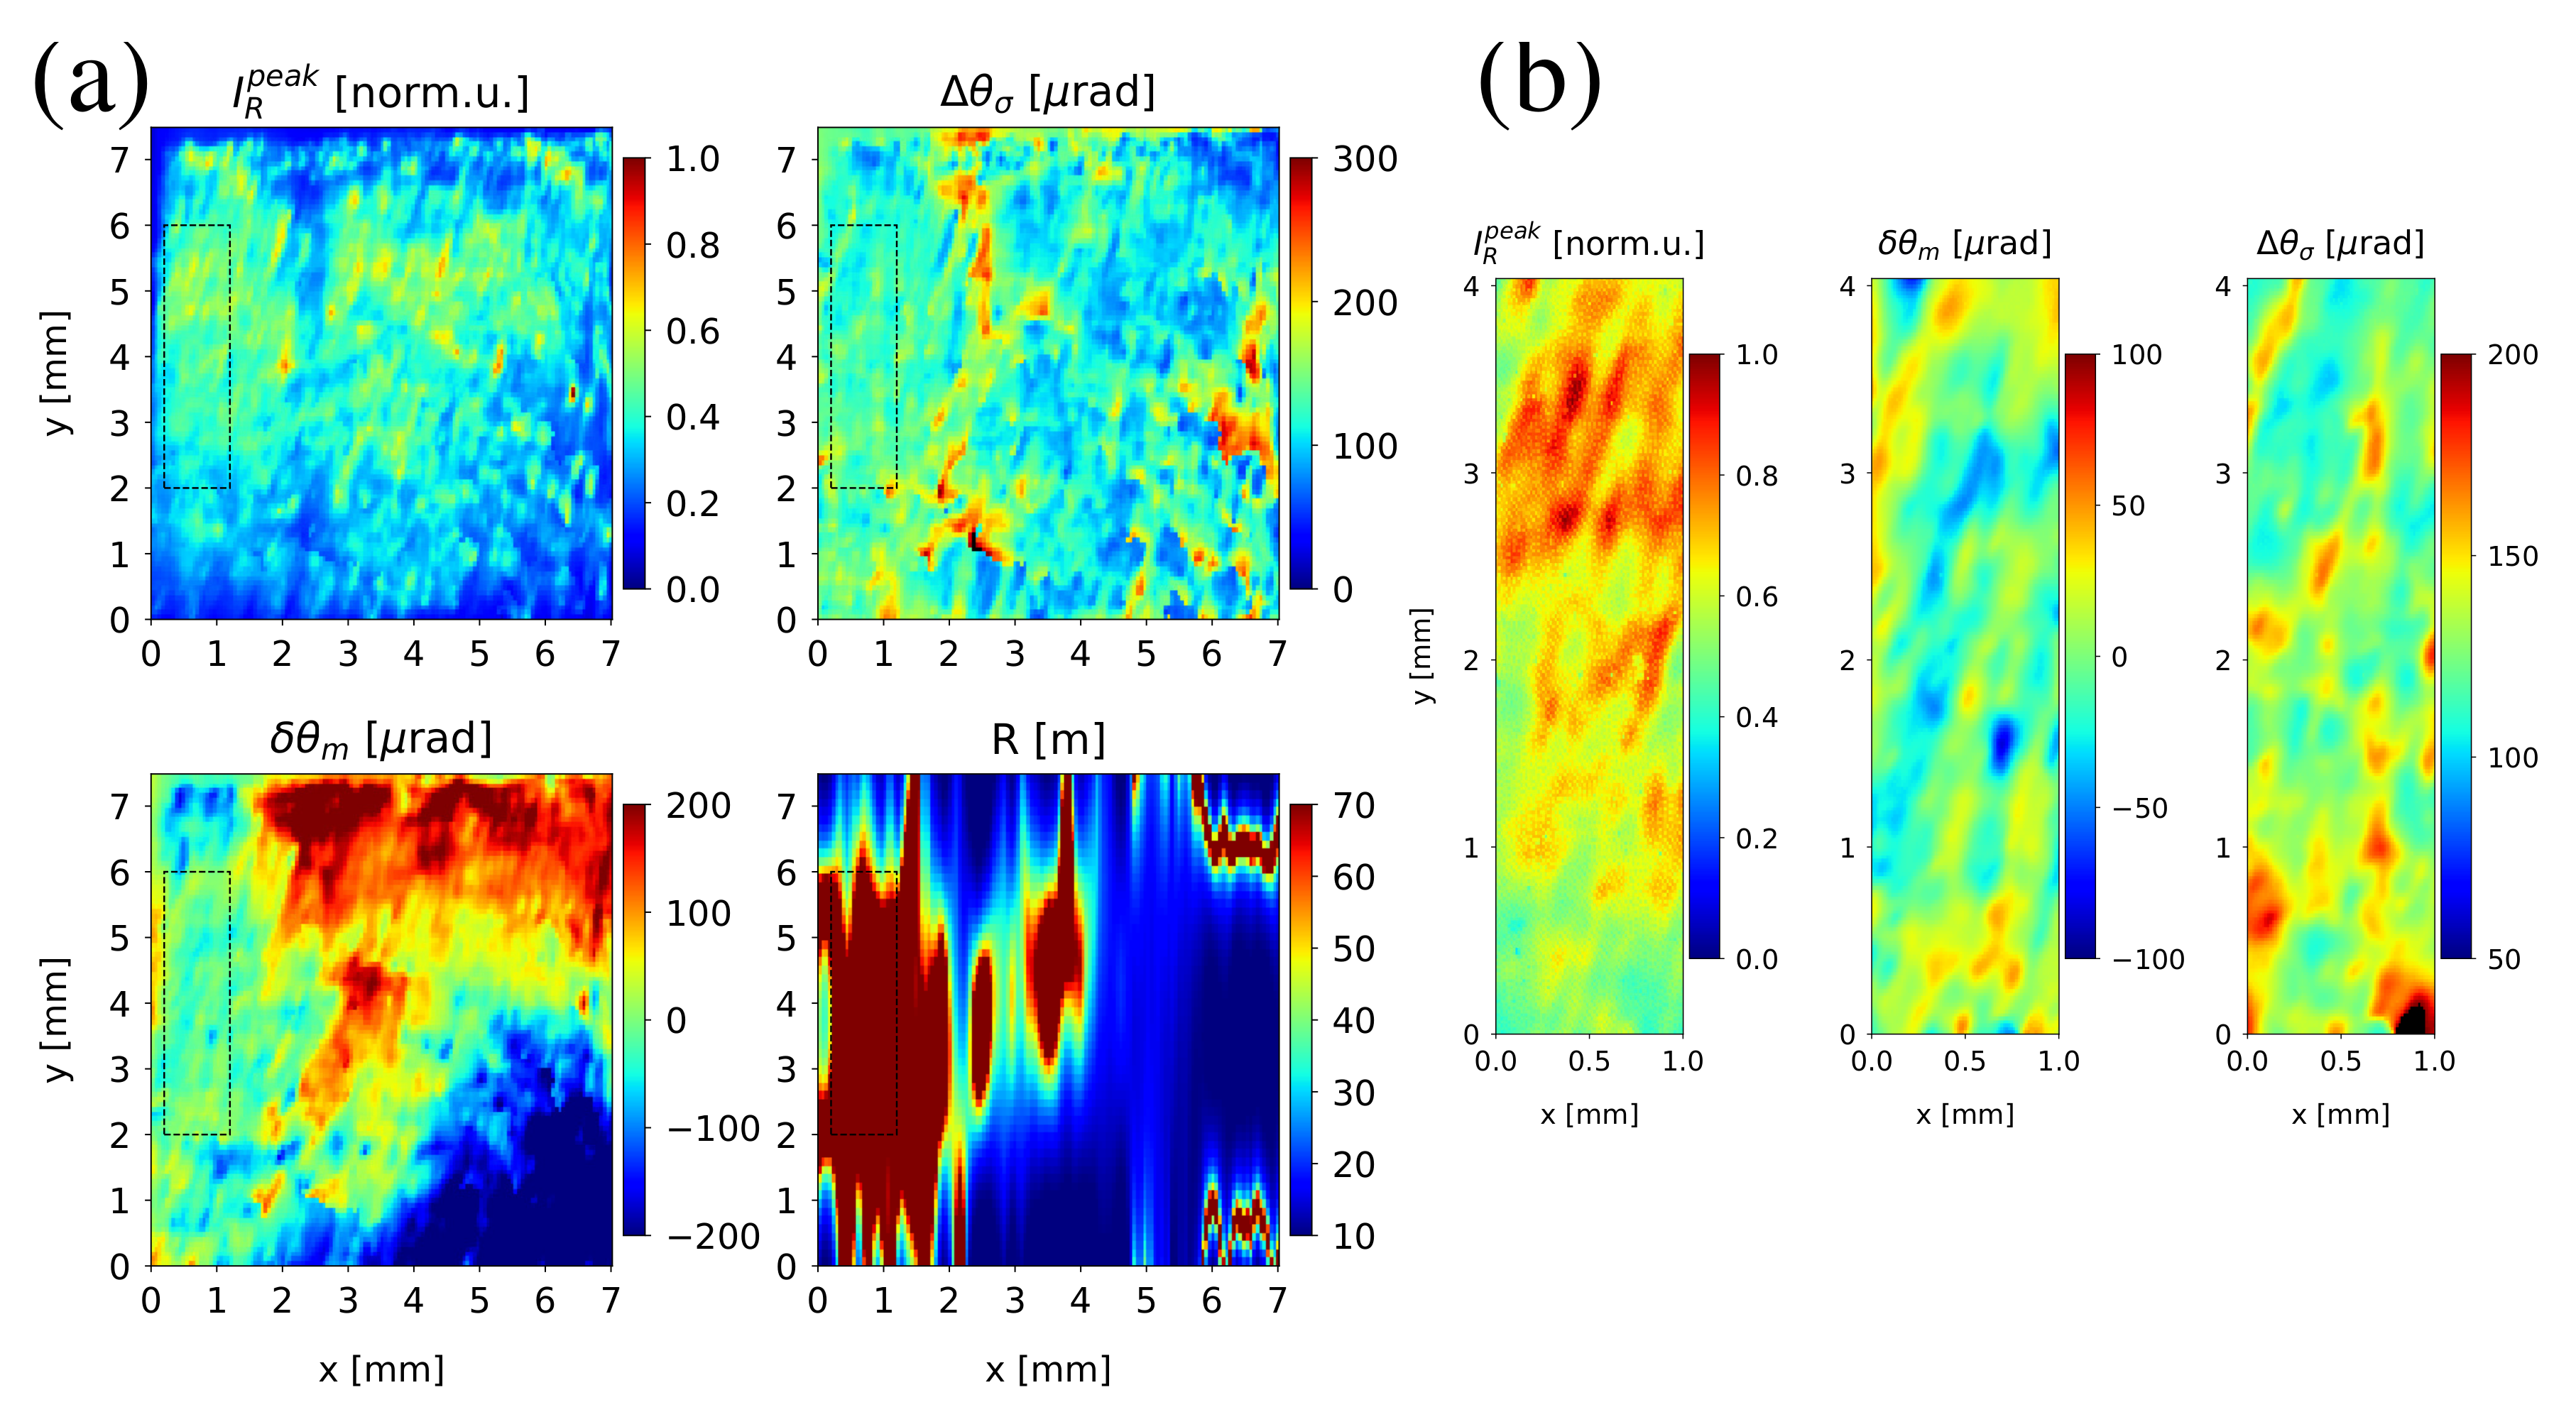
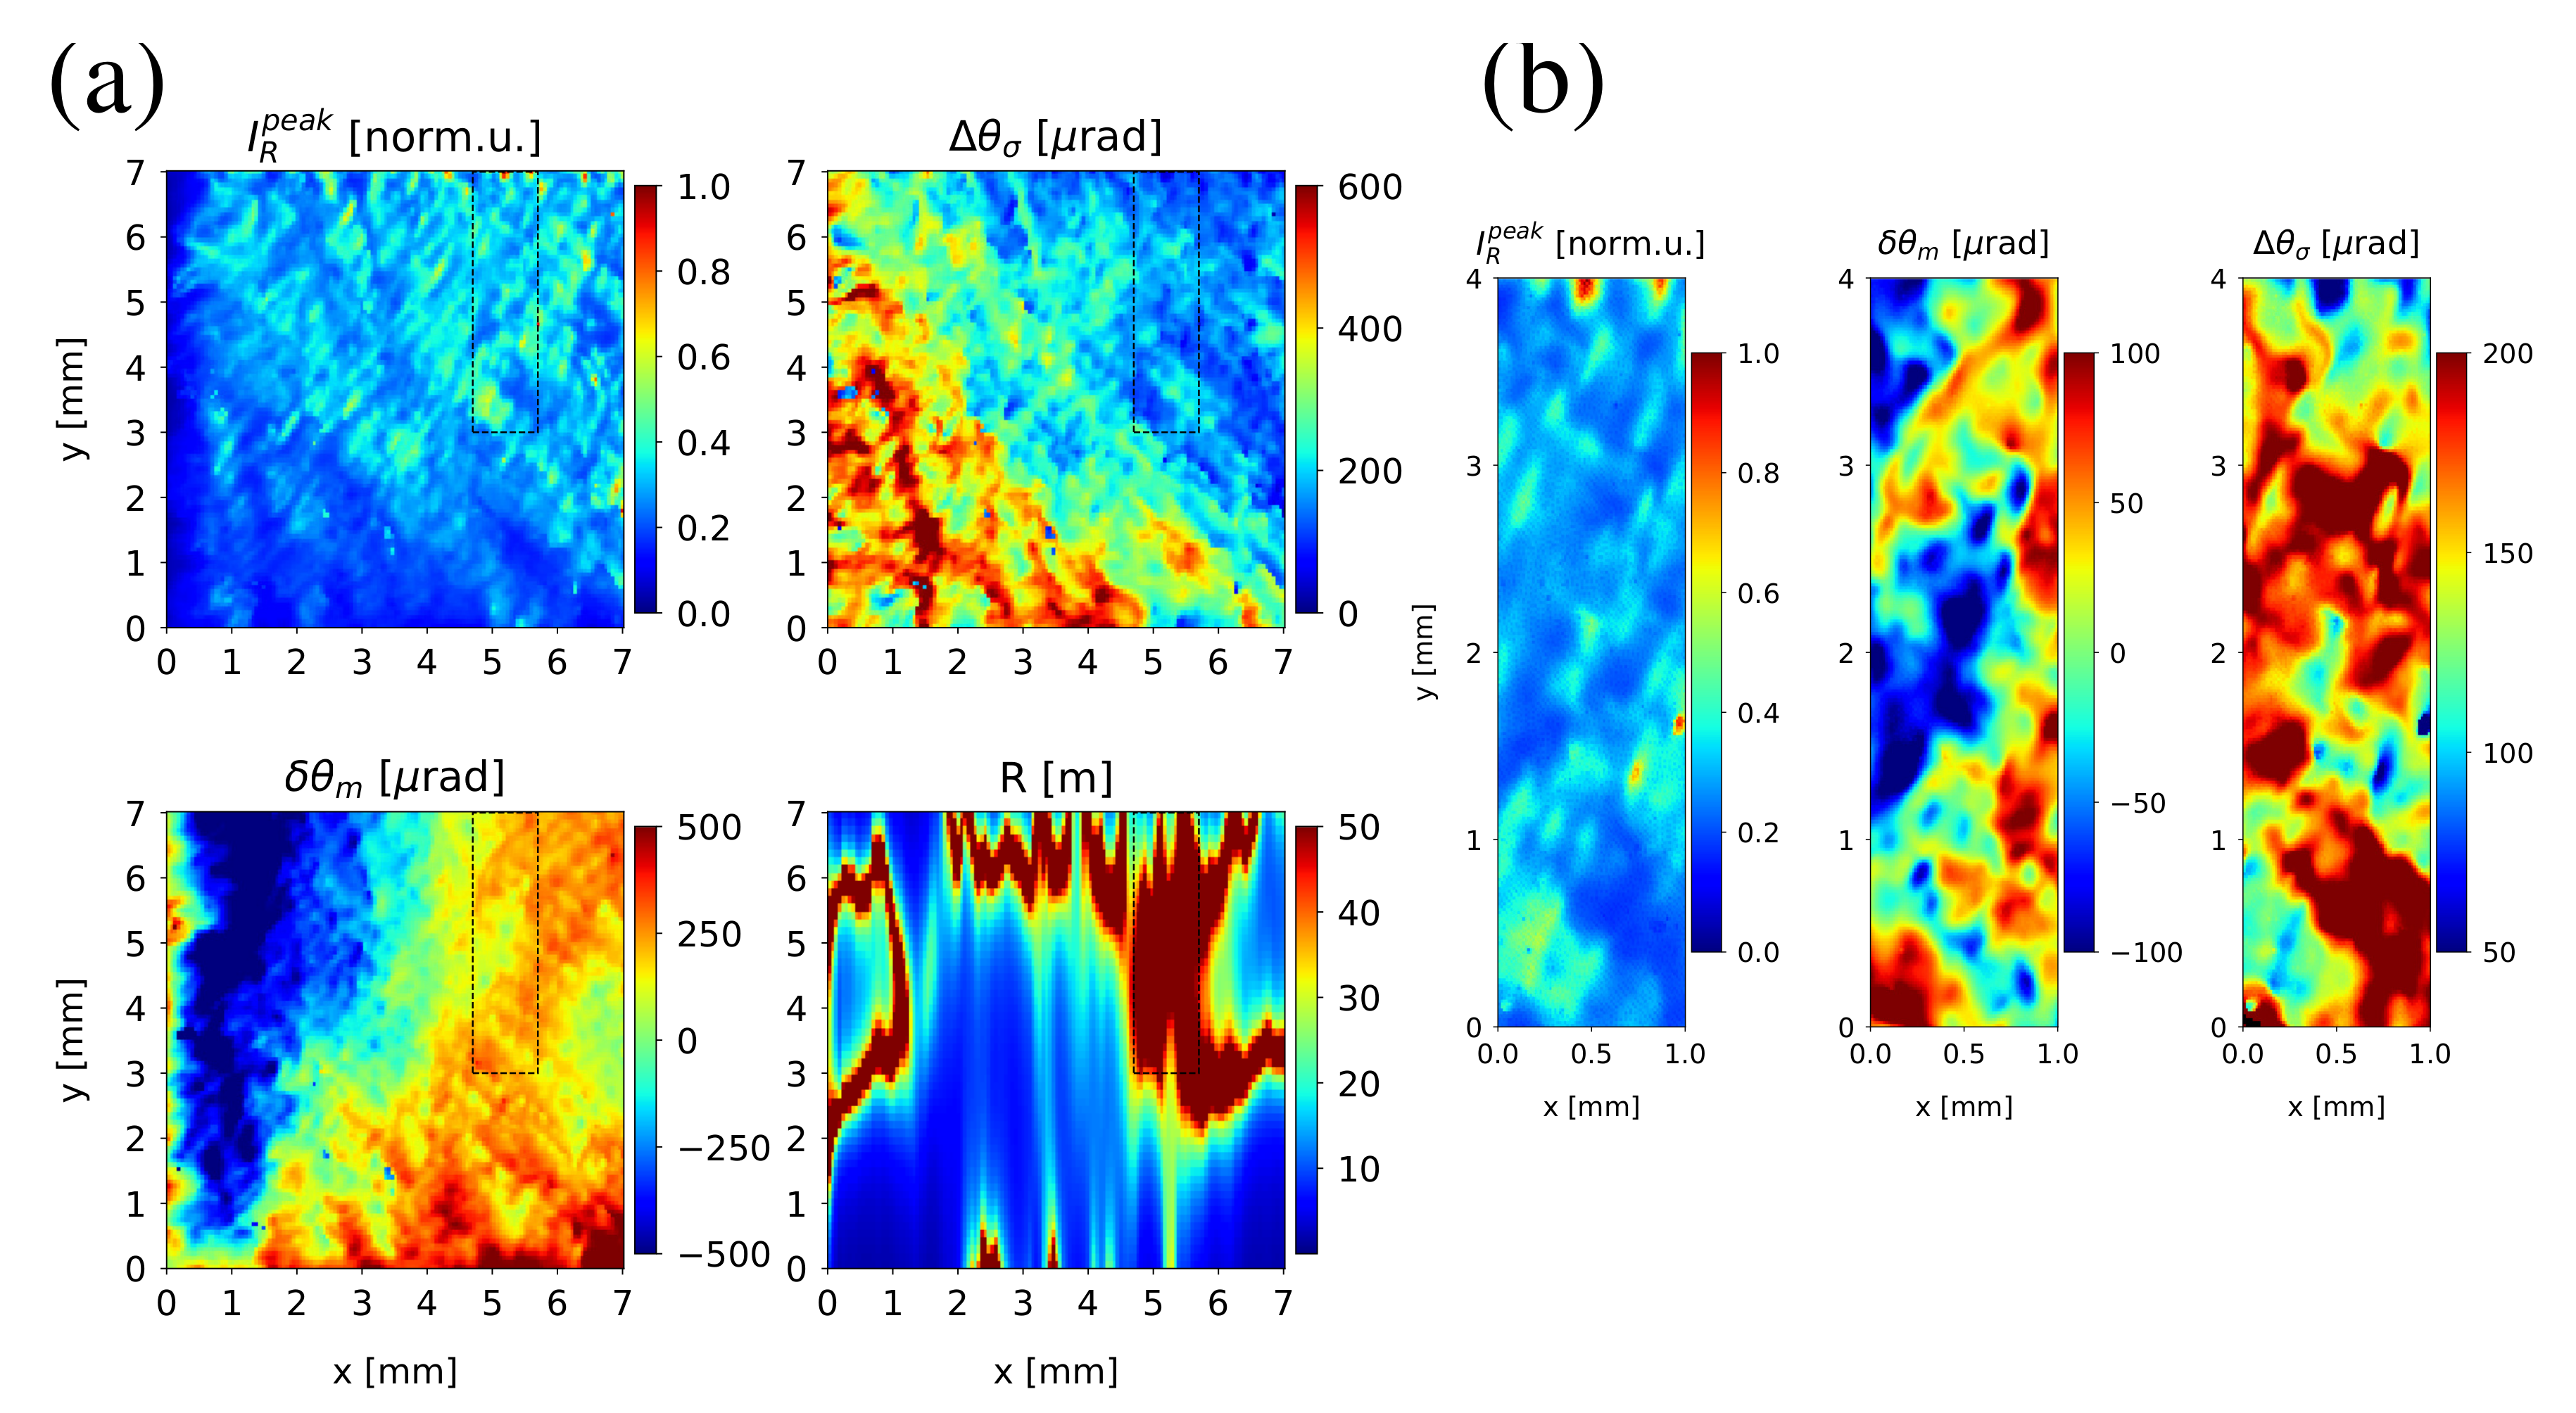
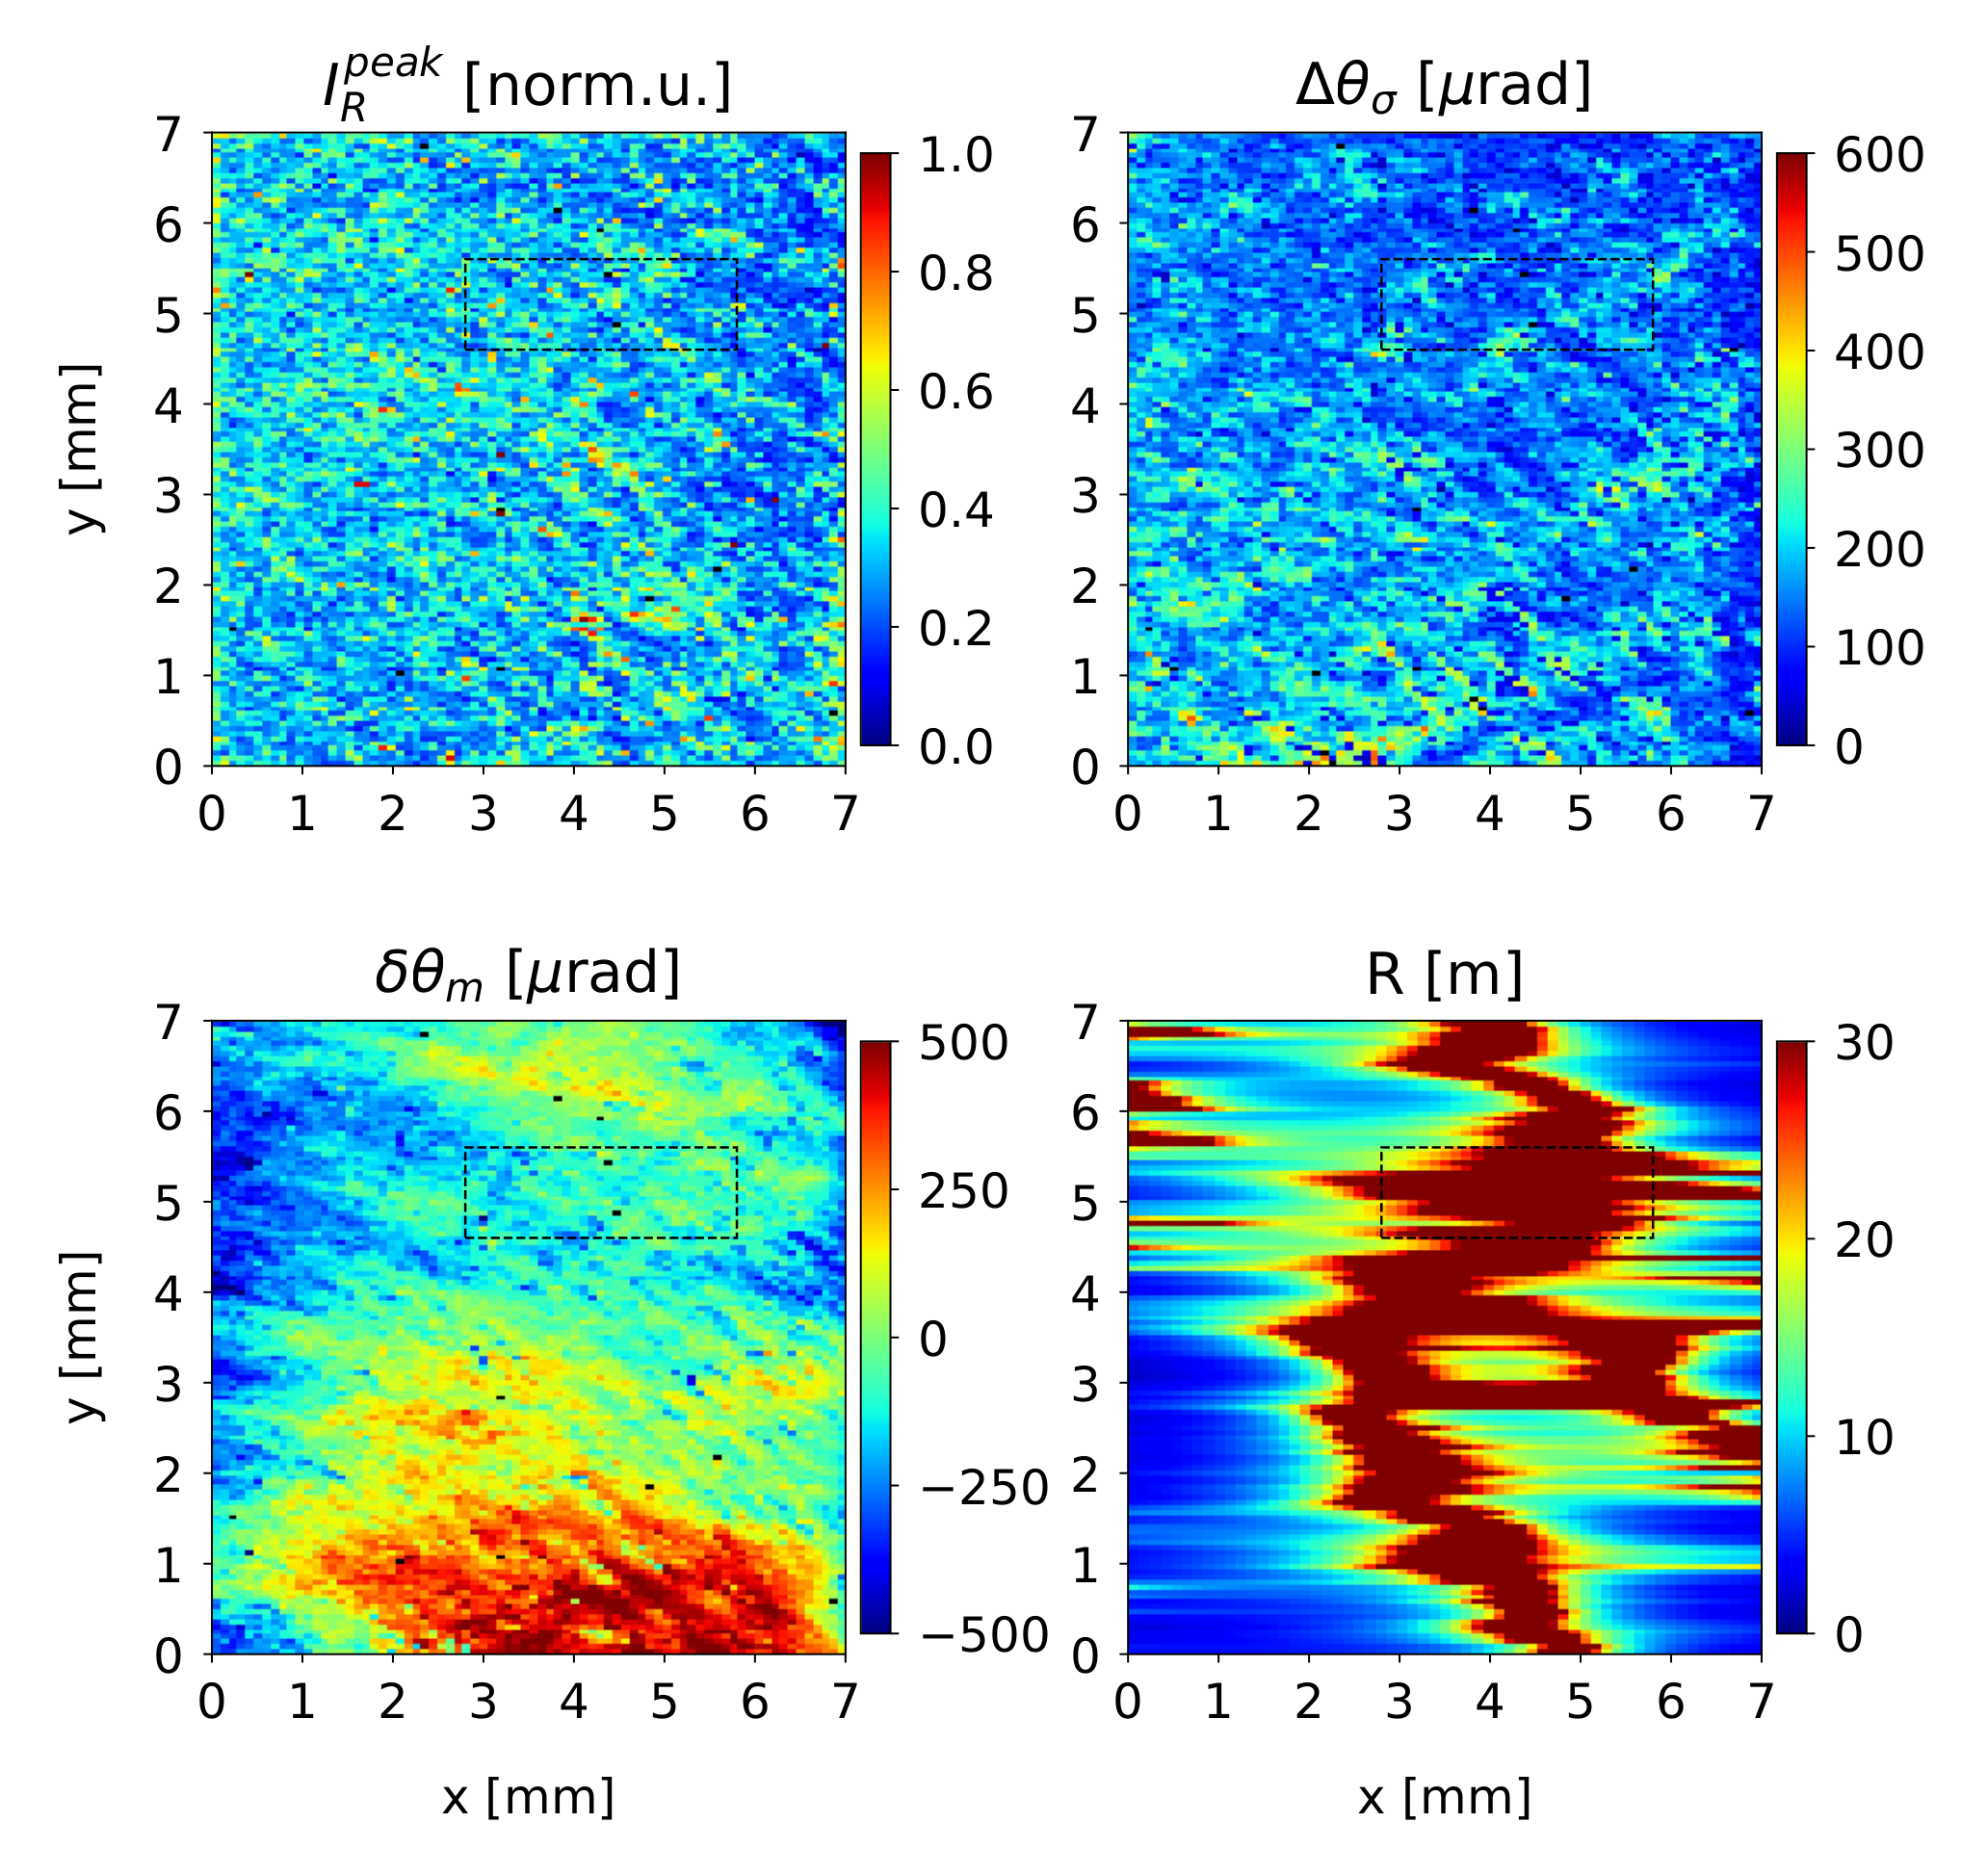
4. Analysis of Rocking Curve Topographs

Figure 3a shows rocking curve topographs for a selected (100)-edge oriented plate (CVD-B). The topographs represent peak reflectivity of the local rocking curves ( I R p e a k , normalized by the maximum observed value), rocking curve peak position ( δ θ m ) and width ( Δ θ σ ) reported as standard deviation. The scattering plane is aligned with the vertical axis (y). The images were projected on the entrance crystal surface by scaling the vertical coordinate with a factor F = cos [ 2 ( θ S i θ C ) ] / G h .
The effective radius of curvature (R) was calculated using spline interpolation of the peak position profiles δ θ m ( y ) at each x coordinate. This radius of curvature is shown as a topograph with meter units on the colorbar. A rectangular region of interest (ROI) marked by the dashed rectangle is relatively flat. The radius of curvature across this region is ≳ 70 m. The rocking curve characteristics in this region are relatively uniform if compared to the entire crystal Figure 3a. This region is selected for further analysis. The I R p e a k , δ θ m and Δ θ σ topographs for this region are shown in Figure 3b. The rescaled colorbar reveals variations in the angular characteristics on the order of 100 μ rad. Statistical characteristics of the rocking curve peak position, and width across the region are shown in Table 2. In addition, the width of the total (integrated across the region) rocking curve is given.
Similar analysis for another diamond plate CVD-N is summarized in Figure 4. This plate had (110) edge orientation and the rocking curve topographs were collected in the experimental setup configuration shown in Figure 1b. The overall distortion of the crystal lattice is substantially greater compared to that for plate CVD-B (note the increased range of the ( δ θ m ) and ( Δ θ σ ) colorbars). The effective radius of curvature was found to be R 0 50 m in the ROI of size 1×4 mm 2 shown by the dashed rectangle in Figure 4a. The I R p e a k , δ θ m and Δ θ σ topographs for this region are shown in Figure 4b. The colorbars ranges are the same as those of Figure 3b. The ROI is significantly more distorted compared to the region of interest for CVD-B. This is quantified by the increased standard deviation of the rocking curve peak position and the average width of the rocking curve compared to those for the ROI on plate CVD-B (see Table 2). The I R p e a k topograph shows a few occasional peaks of increased reflectivity. These peaks correspond to regions of substantially reduced curve width at the corresponding locations ( Δ θ σ topograph). The origin of these features are not understood at present.
In addition, Table 2 shows results for crystal plate CVD-I of (110) edge orientation, which was studied in configuration of experimental setup shown in Figure 1c. The data were found somewhat noisy (the topographs for plate CVD-I are shown in Figure A2). Nevertheless, the angular topographs showed valid statistical results. For ROI of a similar size 1 × 3 mm 2 the radius of curvature was found to be R 0 30 m. The standard deviation of the peak position, the average and the total curve widths are similar to those found for the ROI of plate CVD-N. The total rocking curves for ROIs of the three crystals are shown in Figure A3. Their shape is well approximated with a Gaussian function.

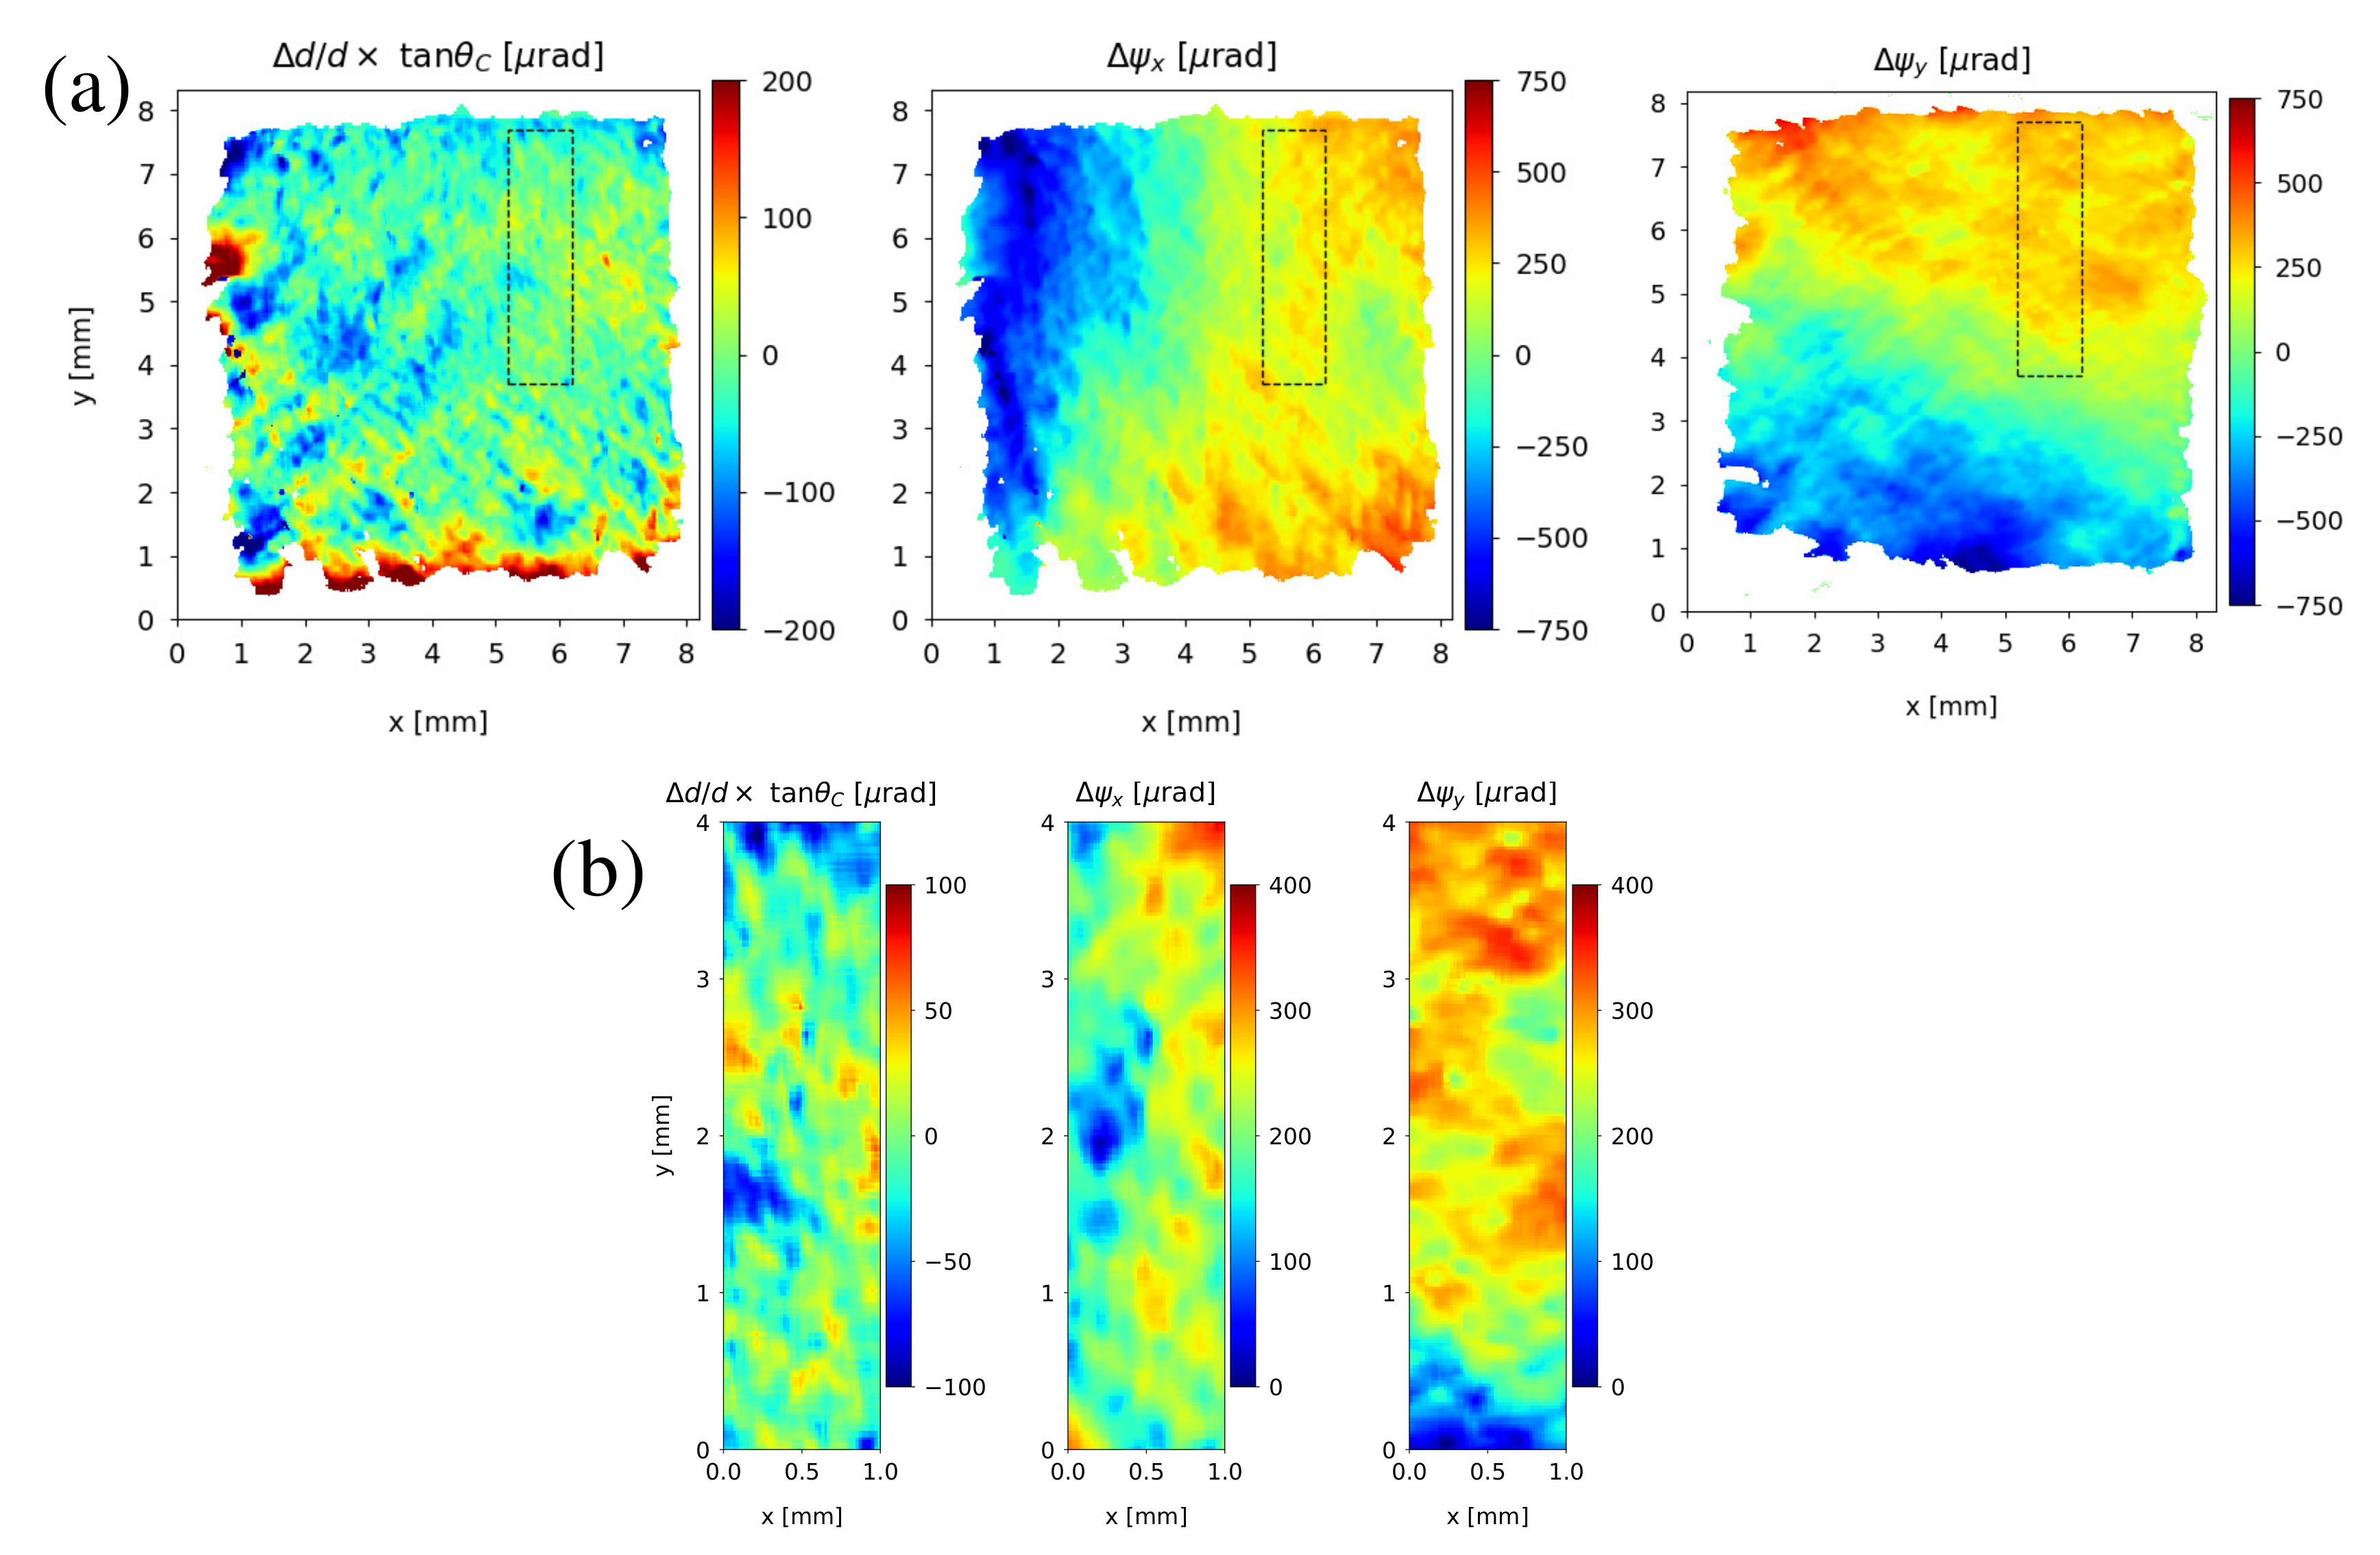
5. Dilational and Rotational Components of the Lattice Distortion

To further study the origin of the angular variations (effective tilt of the crystal lattice) δ θ m , separation of the local dilation and rotational components was performed (first proposed by Bonse [17]). The differential form of the Bragg’s Law
Δ λ λ = Δ d d + Δ θ tan θ C
shows that the Bragg’s condition for a monochromatic wave ( Δ λ = 0) can be satisfied by either variations in the d-spacing ( Δ d / d ) or the rotation of the lattice planes Δ θ . The rocking curve shift relative to a reference position is (e.g., [18,19]):
δ θ m = Δ d d tan θ C + ( n r · n m ) Δ ψ ,
where Δ ψ is the local misorientation angle, n r and n m are the unit vectors representing directions of the rocking curve rotation axis and the misorientation rotation axis, respectively. The dilation/compression ( Δ d / d ) and the shear/rotation ( Δ ψ ) components of the lattice distortion can be decoupled by altering the sign of the second term in Equation (3) via choice of the crystal lattice orientation with respect to the rotation axis. The components can be obtained from sums and differences of the data taken at azimuthal rotations around the reciprocal vector, which are 180 apart.
Δ d d tan θ C = 1 2 ( δ θ m ( 0 ) + δ θ m ( 180 ) ) ,
Δ ψ x = 1 2 ( δ θ m ( 0 ) δ θ m ( 180 ) )
Additional data collection and analysis were performed for one of the samples (CVD-N). An extra sequence of images on the rocking curve of the 220 reflection was collected upon rotation of the plate by 180 around the reflection’s reciprocal vector. To extract the local rotations around the perpendicular y axis ( Δ ψ y ) another pair of sequences at 0 and 180 were collected in a similar manner for the 2 2 ¯ 0 reflection (plate rotated 90 about its surface normal and remounted). The resulting decoupled maps of dilational and rotational contributions to the effective tilt δ θ m are shown in Figure 5.
Figure 5a shows these maps for the entire crystal. The dominant contribution to the overall effective tilt of the crystal lattice (or slope error from which the effective radius of curvature was deduced) originates from the local rotations Δ ψ x , y . The dilational component shows a more localized texture (except for some features at the edges of the crystal where the lattice is severely distorted and the subtraction procedure fails). The dashed rectangular region corresponds to the previously identified ROI with R 0 50 m. Remarkably, the angular variation in the perpendicular direction Δ ψ y is also optimal (minimized) for this region. The dilational and the rotational components for the ROI are shown in Figure 5b with colorbars rescaled to reveal more details. The peak-to-valley variation in the rotational components are about two times greater compared to that of the dilational component. The standard deviations across the ROI are 24 μ rad for the dilational component, and 49 and 64 μ rad for Δ ψ x and Δ ψ y , respectively. These results suggest that the contribution of the local lattice rotations to the effective tilt δ θ m is the dominant contribution, even for the relatively “flat” regions of the crystal. Nevertheless, the dilational components, which seem to be more localized around the defects (dislocations) in the crystal lattice cause substantial (possibly non-negligible) variations in the studied high-dislocation-density CVD diamond.

6. Conclusions

Among the studied 20 sc-CVD diamond plates of the nominal optical grade and (001) surface orientation it was found that about 50% had substantial total curvature (the effective radius of curvature was < 10 m over the entire crystal, which is impractical for refocusing of synchrotron radiation). These were rejected in our selection procedure aimed at finding nearly “flat” regions with large radii of curvature to realize a close-to 1:1 polychromatic pseudo-focusing in the Laue geometry [20]. The 1:1 focusing geometry refers to the ratio of a distance from source to the optical element to the distance form the optical element to the desired observation plane.
Among the remaining 50%, several plates were identified with relatively “flat” regions (of size 1 × 4 mm 2 ) having the effective radius of curvature 30 70 m. The size of these regions is sufficient to accommodate footprints of synchrotron beams at practical distances from synchrotron radiation source (20–30 m). In particular, one of the dimensions (4 mm) being greater than the other is required to intercept the larger beam footprint in the horizontal direction (this asymmetry is common for the third-generation synchrotrons such as Cornell High Energy Synchrotron Source (CHESS)). The most prominent effect on beam propagation is expected to be caused by the effective curvature of the crystal in the scattering plane, which is the horizontal plane at CHESS for several newly constructed side-bounce beamlines. Our crystal selection methodology was developed to mitigate this effect, and to explore the increase in the reflected radiation bandwidth (thus, the potential increase in the reflected photon flux) due to use of imperfect reflectors such as high-dislocation-density CVD diamond crystals.
The analysis of the rocking curve topographs is summarized as follows.
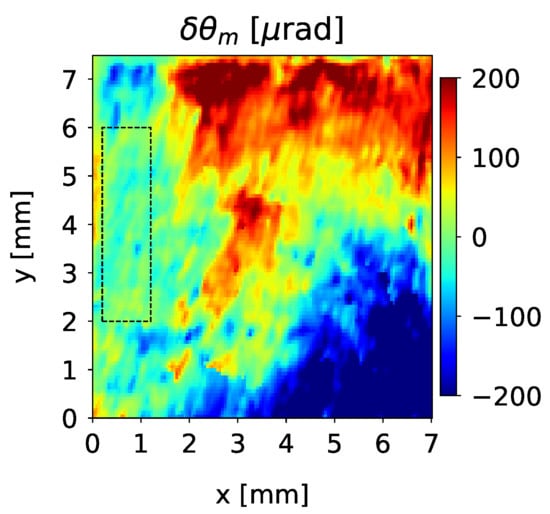
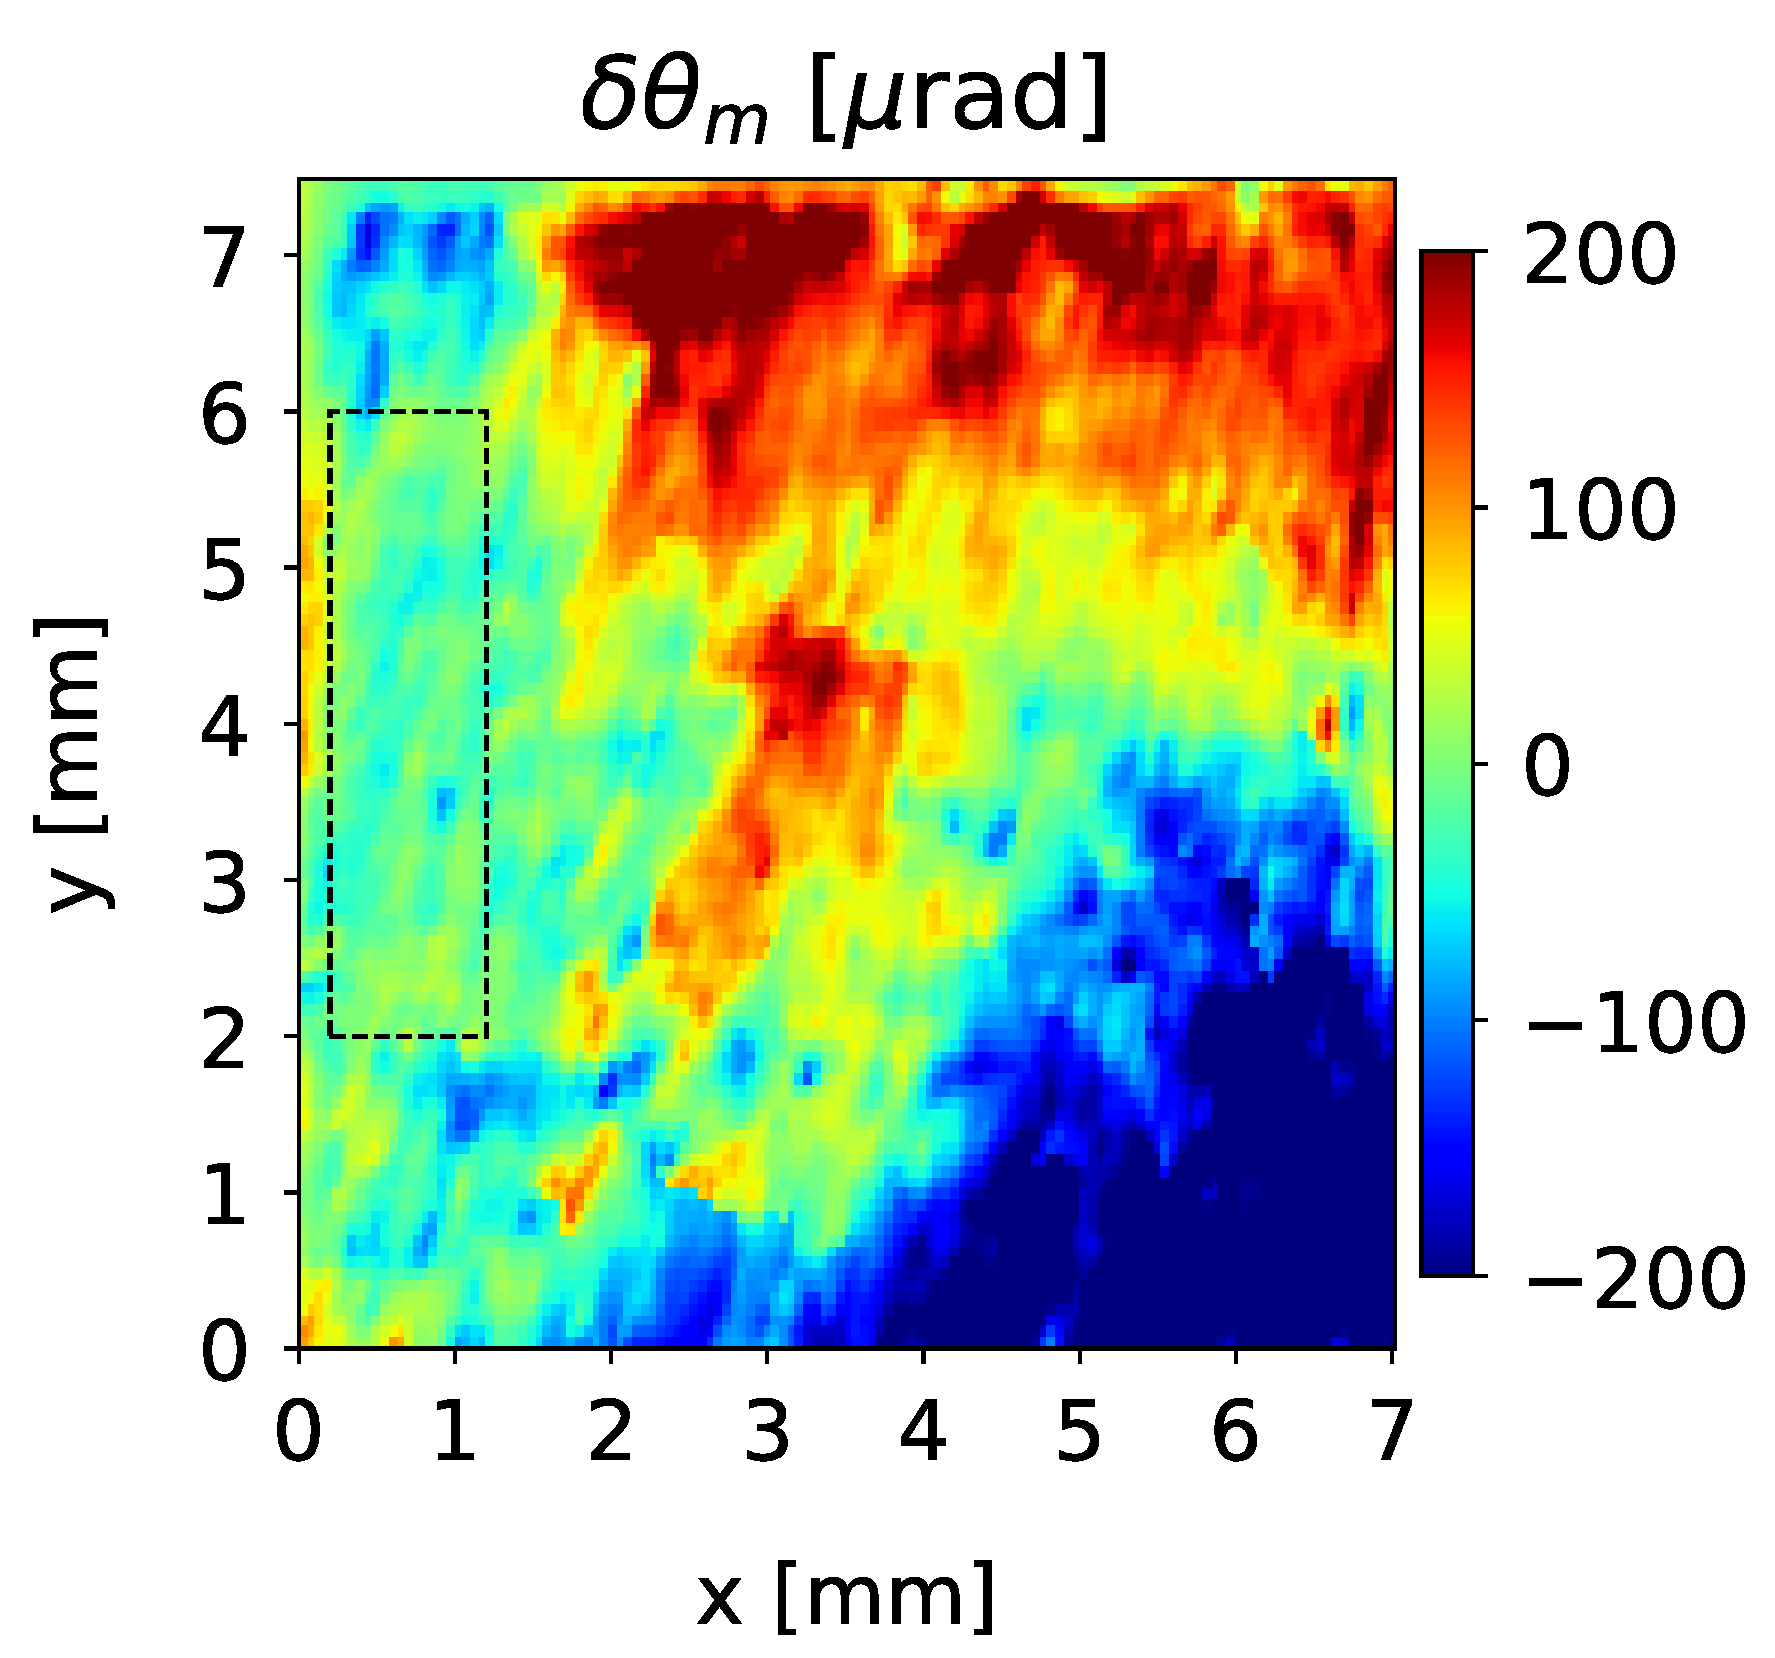
  • The standard deviation of the effective lattice misorientation across the nearly flat regions of interest is in the range 20–70 μ rad.
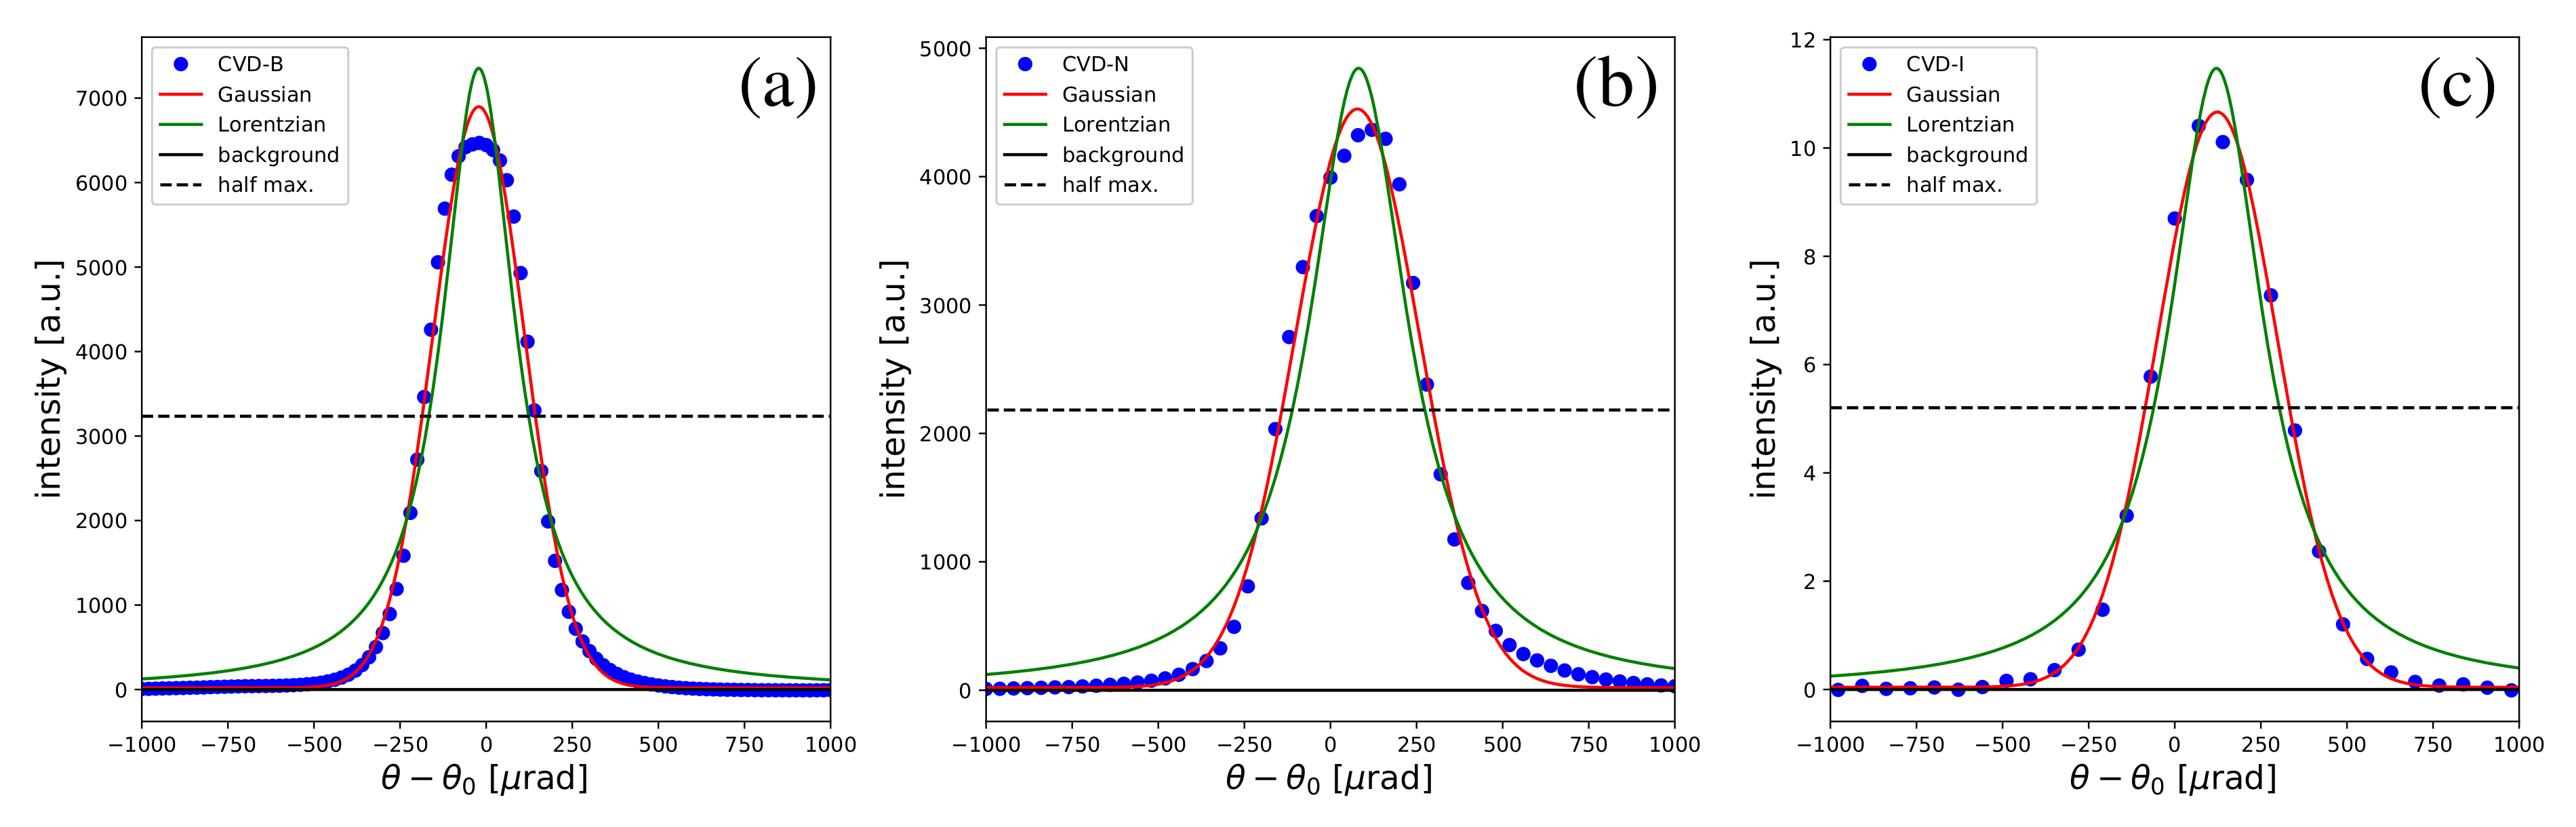
  • The averaged rocking curve width for these regions is about 130–165 μ rad (r.m.s.), which was found to be close to Δ θ t o t = 134–181 μ rad (r.m.s.) widths of the total rocking curve (integrated across the region). The effective intrinsic bandwidth of the reflector (FWHM) can be estimated as Δ E / E 2 . 355 Δ θ σ t o t / tan θ C .
  • The effective lattice misorientation observed in the rocking curve topographs was dominated by the shear/rotational components of the lattice distortion, which exceed the dilation-compression component by about a factor of 2 (peak-to-valley variation) in the studied nearly flat region of interest for a representative crystal plate. The standard deviation for the dilation-compression component across the region was found to be 24 μ rad.

Author Contributions

Methodology, experiment, formal analysis, manuscript preparation, S.S.; experiment, sample procurement, T.K.; experiment, Z.L. and C.F.

Funding

This work is based upon research conducted at the Cornell High Energy Synchrotron Source (CHESS) which is supported by the National Science Foundation under award DMR-1332208. Support for the Cornell Center for Materials Research facility used in this work provided through the NSF Grant DMR-1719875, part of the NSF MRSEC Program. This research used resources of the Advanced Photon Source, a U.S. Department of Energy (DOE) Office of Science User Facility operated for the DOE Office of Science by Argonne National Laboratory under Contract No. DE-AC02-06CH11357.

Acknowledgments

The authors are grateful to J.D. Brock for support and encouragement. D. Sagan is acknowledged for helpful discussions. M. Wojcik is acknowledged for assistance with synchrotron experiments at 1-BM Optics beamline of the Advanced Photon Source. Help of J. Houghton, P. Sorensen, S. Smith and S. Yang with implementation of the experimental configuration using the rotating anode X-ray source is greatly appreciated.

Conflicts of Interest

The authors declare no conflict of interest.

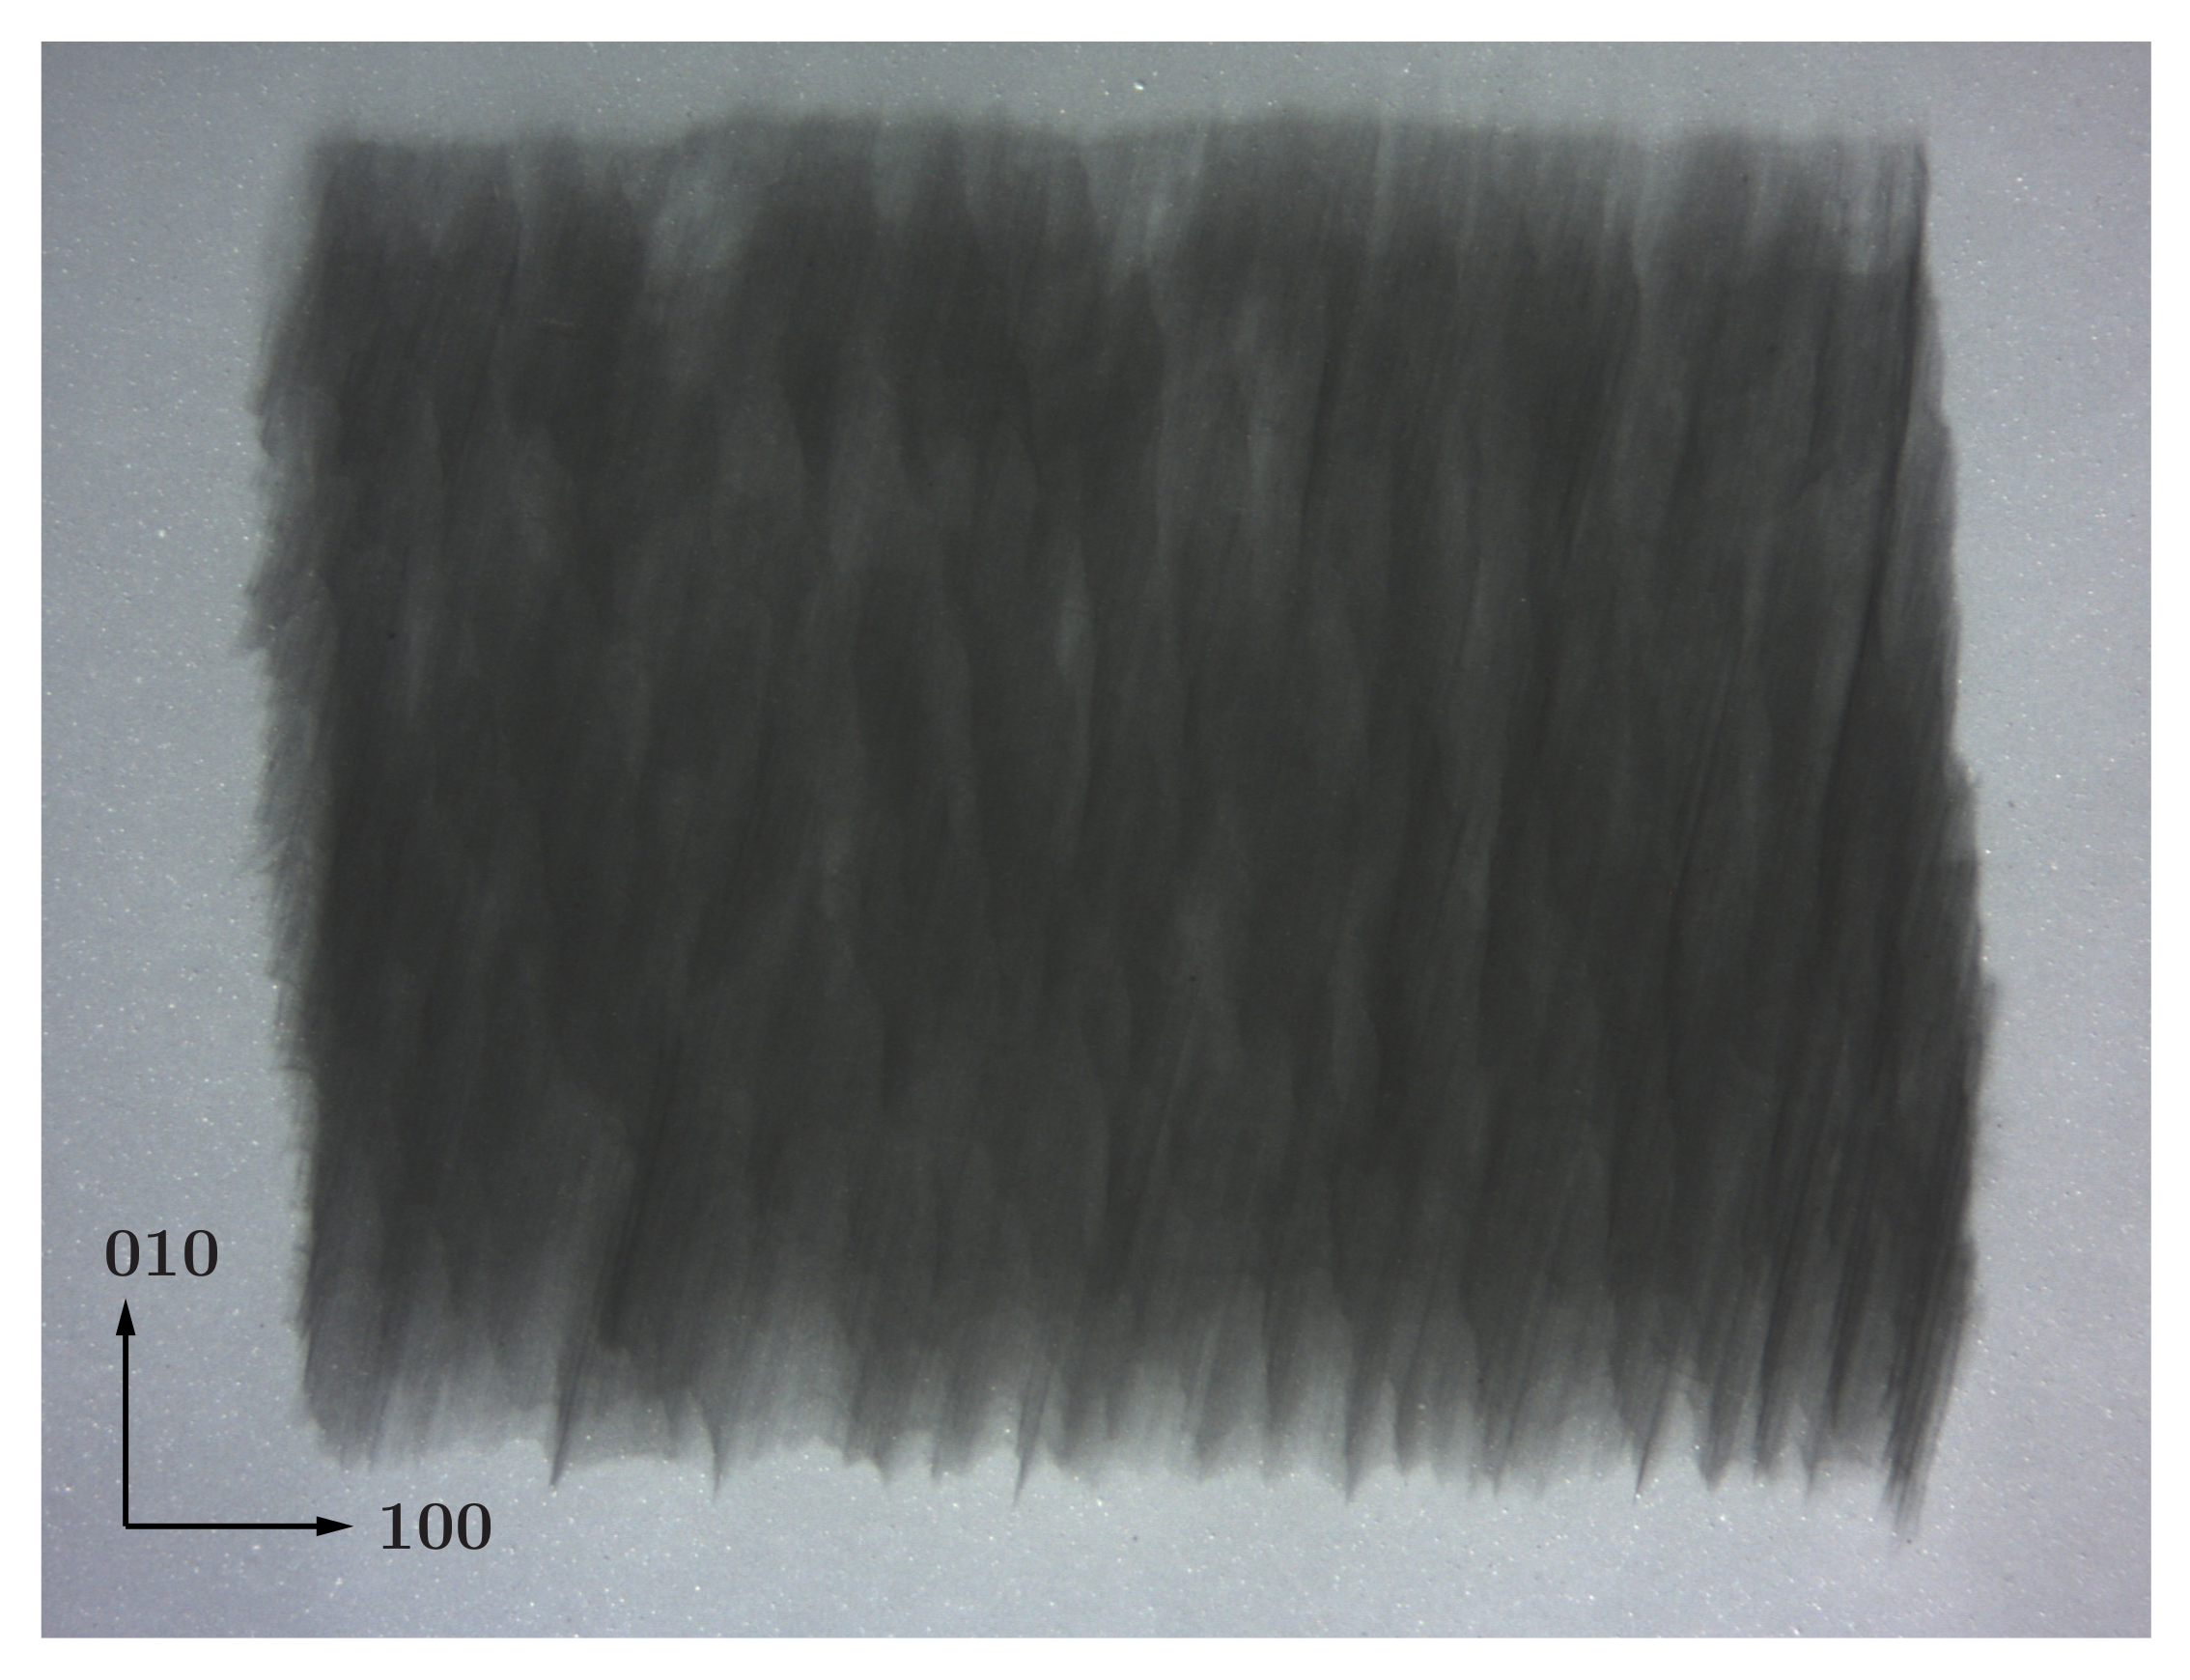
Appendix A. Representative White-Beam X-ray Topograph

Figure A1. A white-beam topograph obtained in transmission (Laue) geometry from 131 reflection of plate CVD-B. Individual dislocations are not easily discerned, which confirms high dislocaiton density material.
Crystals 09 00396 g0a1

Appendix B. Rocking Curve Topographs for CVD-I Using Rotating Anode X-ray Source

Figure A2. Rocking curve topographs for the (110)-edge oriented diamond crystal plate CVD-I showing maps of peak reflectivity ( I R p e a k , normalized by the maximum value), rocking curve peak position ( δ θ m ), width ( Δ θ σ ), and the effective radius of curvature R calculated from spline-interpolated δ θ m .
Crystals 09 00396 g0a2

Appendix C. Total Rocking Curves for the Regions of Interest

Figure A3. Total rocking curves for the regions of interest showing data points, fits to the Gaussian and Lorentzian shapes for plates: (a) CVD-B, (b) CVD-N, and (c) CVD-I. The dashed horizontal line shows the level corresponding to 1/2 of the rocking curve peak intensity.
Crystals 09 00396 g0a3

References

  1. Hess, P. The mechanical properties of various chemical vapor deposition diamond structures compared to the ideal single crystal. J. Appl. Phys. 2012, 111, 051101. [Google Scholar] [CrossRef] [Green Version]
  2. Inyushkin, A.V.; Taldenkov, A.N.; Ralchenko, V.G.; Bolshakov, A.P.; Koliadin, A.V.; Katrusha, A.N. Thermal conductivity of high purity synthetic single crystal diamonds. Phys. Rev. B 2018, 97, 144305. [Google Scholar] [CrossRef]
  3. Shvyd’ko, Y.V.; Stoupin, S.; Cunsolo, A.; Said, A.; Huang, X. High-reflectivity high-resolution X-ray crystal optics with diamonds. Nat. Phys. 2010, 6, 196. [Google Scholar] [CrossRef]
  4. Shvyd’ko, Y.V.; Stoupin, S.; Blank, V.; Terentyev, S. Near 100% Bragg Reflectivity of X-rays. Nat. Photonics 2011, 5, 539–542. [Google Scholar] [CrossRef]
  5. Martineau, P.M.; Gaukroger, M.P.; Guy, K.B.; Lawson, S.C.; Twitchen, D.J.; Friel, I.; Hansen, J.O.; Summerton, G.C.; Addison, T.P.G.; Burns, R. High crystalline quality single crystal chemical vapour deposition diamond. J. Phys. Condens. Matter 2009, 21, 364205. [Google Scholar] [CrossRef] [PubMed]
  6. Berman, L.E.; Yin, Z.; Dierker, S.B.; Dufresne, E.; Mochrie, S.G.J.; Tsui, O.K.C.; Burley, S.K.; Shu, F.; Xie, X.; Capel, M.S.; et al. Performance of the double multilayer monochromator on the NSLS wiggler beam line X25. AIP Conf. Proc. 1997, 417, 71–79. [Google Scholar]
  7. Kazimirov, A.; Smilgies, D.M.; Shen, Q.; Xiao, X.; Hao, Q.; Fontes, E.; Bilderback, D.H.; Gruner, S.M.; Platonov, Y.; Martynov, V.V. Multilayer X-ray optics at CHESS. J. Synchrotron Radiat. 2006, 13, 204–210. [Google Scholar] [CrossRef] [PubMed]
  8. Vaughan, G.B.M.; Wright, J.P.; Bytchkov, A.; Rossat, M.; Gleyzolle, H.; Snigireva, I.; Snigirev, A. X-ray transfocators: Focusing devices based on compound refractive lenses. J. Synchrotron Radiat. 2011, 18, 125–133. [Google Scholar] [CrossRef] [PubMed]
  9. Stoupin, S.; Ruff, J.P.C.; Krawczyk, T.; Finkelstein, K.D. X-ray reflectivity of chemically vapor-deposited diamond single crystals in the Laue geometry. Acta Cryst. A 2018, 74, 567–577. [Google Scholar] [CrossRef] [PubMed]
  10. Stoupin, S.; Krawczyk, T.; Ruff, J.P.C.; Finkelstein, K.D.; Lee, H.H.; Huang, R. Performance of CVD diamond single crystals as side-bounce monochromators in the Laue geometry at high photon energies. AIP Conf. Proc. 2019, 2054, 060019. [Google Scholar]
  11. Lübbert, D.; Baumbach, T.; Härtwig, J.; Boller, E.; Pernot, E. μm-resolved high resolution X-ray diffraction imaging for semiconductor quality control. Nucl. Instrum. Methods Phys. Res. B 2000, 160, 521–527. [Google Scholar] [CrossRef]
  12. Stoupin, S.; Shvyd’ko, Y.V.; Trakhtenberg, E.; Liu, Z.; Lang, K.; Huang, X.; Weiczorek, M.; Kasman, E.; Hammonds, J.; Macrander, A.; et al. Sequential X-ray Diffraction Topography at 1-BM X-ray Optics Testing Beamline at the Advanced Photon Source. AIP Conf. Proc. 2016, 1741, 050020. [Google Scholar]
  13. Bowen, D.K.; Tanner, B.K. (Eds.) High Resolution X-ray Diffraction and Topography; Taylor and Francis: London, UK, 1998. [Google Scholar]
  14. Stoupin, S. DTXRD—Software for Evaluation of Single Crystals Using X-ray Diffraction. 2015. Available online: https://www.aps.anl.gov/Science/Scientific-Software/DTXRD (accessed on 30 July 2019).
  15. Lang, A.R.; Makepeace, A.P.W.; Moore, M.; Machado, W.C. On the variation of X-ray diffraction contrast with wavelength: A study with synchrotron radiation. J. Appl. Cryst. 1983, 16, 113–125. [Google Scholar] [CrossRef]
  16. Moore, M. Imaging diamond with X-rays. J. Phys. Condens. Matter 2009, 21, 364217. [Google Scholar] [CrossRef] [PubMed]
  17. Bonse, U. Zur röntgenographischen Bestimmung des Typs einzelner Versetzungen in Einkristallen. Zeitschrift für Physik 1958, 153, 278–296. [Google Scholar] [CrossRef]
  18. Lang, A.R.; Moore, M.; Makepeace, A.P.W.; Wierzchowski, W.; Welbourn, C.M. On the Dilatation of Synthetic Type Ib Diamond by Substitutional Nitrogen Impurity. Philos. Trans. R. Soc. Lond. Ser. A Phys. Eng. Sci. 1991, 337, 497–520. [Google Scholar]
  19. Macrander, A.T.; Krasnicki, S.; Zhong, Y.; Maj, J.; Chu, Y.S. Strain mapping with parts-per-million resolution in synthetic type-Ib diamond plates. Appl. Phys. Lett. 2005, 87, 194113. [Google Scholar] [CrossRef]
  20. Sánchez del Río, M.; Grübel, G.; Als-Nielsen, J.; Nielsen, M. Focusing characteristics of diamond crystal x-ray monochromators. An experimental and theoretical comparisona). Rev. Sci. Instrum. 1995, 66, 5148–5152. [Google Scholar] [CrossRef]
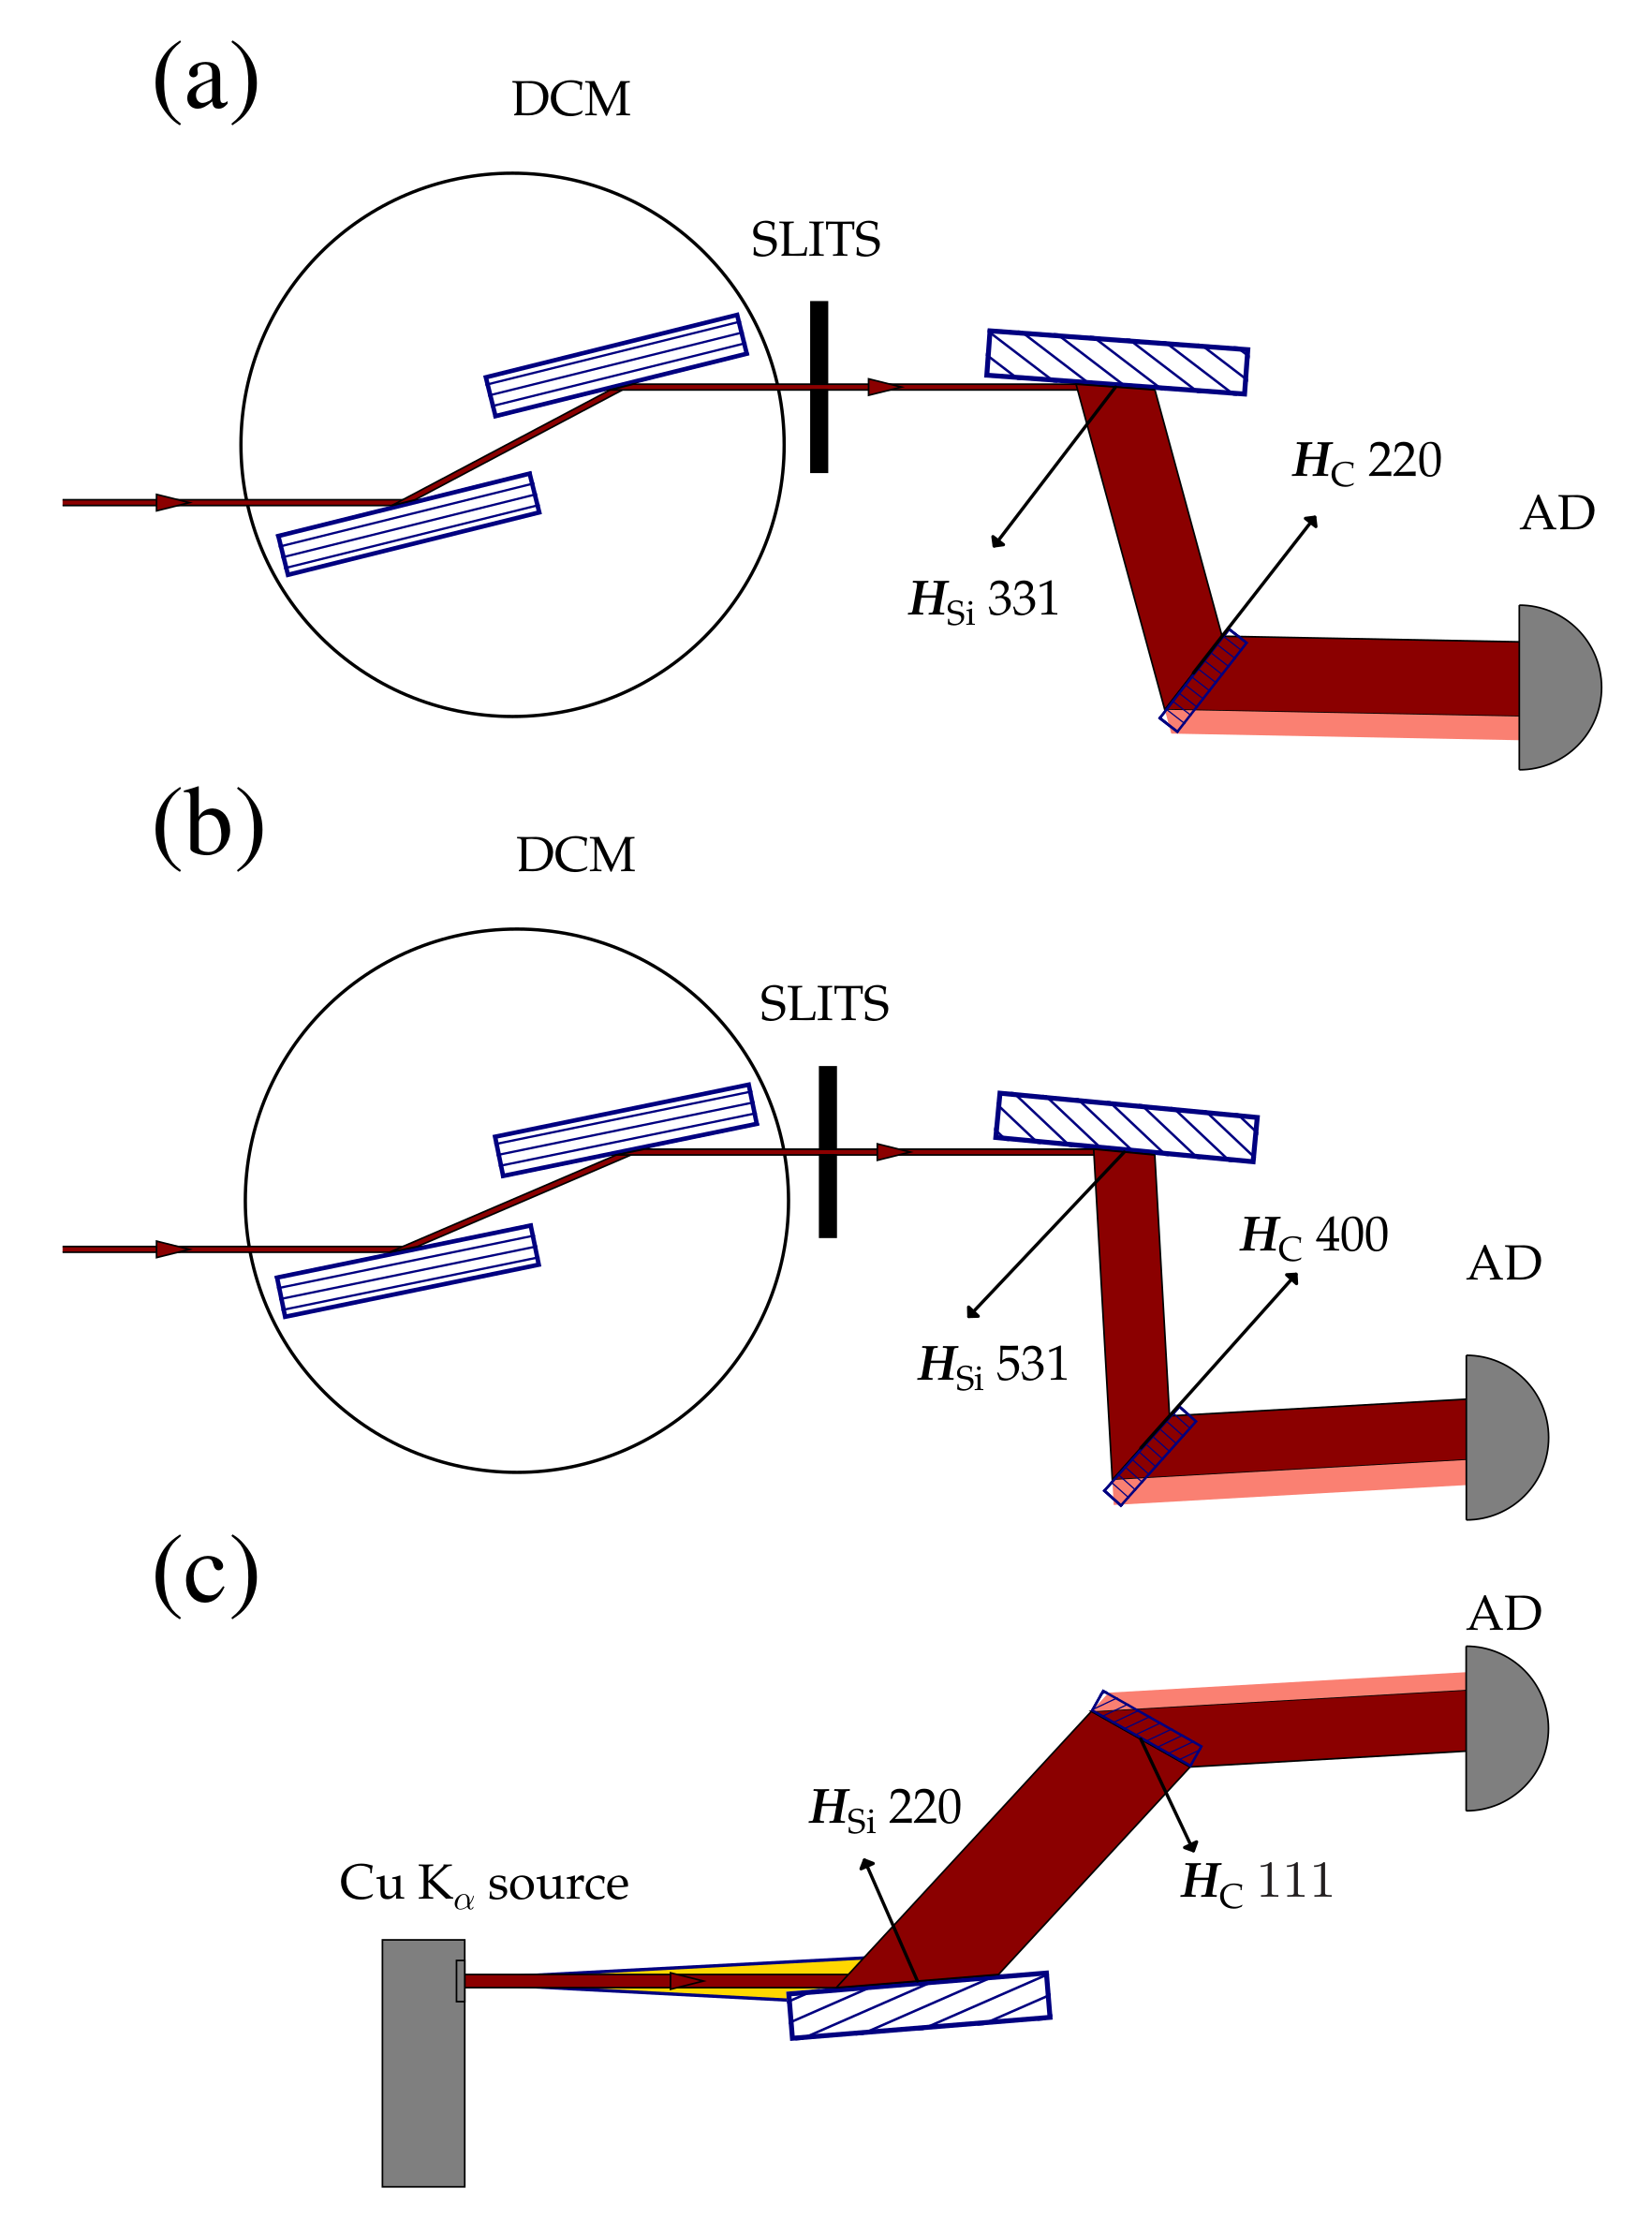
Figure 1. Experimental configurations for rocking curve topography of (110)-edge oriented diamond plates (a and c) and (100)-edge oriented diamond plates (b). DCM—double crystal Si 111 (symmetric) monochromator; AD—digital area detector; H Si and H C along with the Miller indices denote reciprocal vectors of the Si beam conditioner crystal and the diamond crystal respectively. For each configuration the angular deflections of the X-ray beams correspond to the Bragg angles at the chosen photon energies as summarized in Table 1. The incidence angles on the strongly asymmetric beam conditioner crystals are exaggerated (increased) for clarity. See text for more details.
Crystals 09 00396 g001
Figure 2. Laue geometry for a collimated monochromatic incident beam: ϕ 0 and ϕ h are the incidence angles with respect to the crystal surface normal z, l 0 is the base of the Borrmann triangle, and t 0 is the thickness of the crystal plate.
Crystals 09 00396 g002
Figure 3. Rocking curve topographs for the (100)-edge oriented diamond crystal plate (CVD-B): (a) for the entire crystal showing maps of peak reflectivity ( I R p e a k , normalized by the maximum observed value), rocking curve peak position ( δ θ m ), width ( Δ θ σ ), and the effective radius of curvature R calculated from spline-interpolated δ θ m ; (b) for the region of interest where the radius of curvature is maximized R 0 70 m (shown by the dashed rectangle in (a)). The x and y coordinates in (b) are shown with respect to the lower left corner of the rectangle. The limits of the colormaps for δ θ m and Δ θ σ in (b) are redefined to highlight variations in the mapped values.
Crystals 09 00396 g003
Figure 4. Rocking curve topographs for the (110)-edge oriented diamond crystal plate (CVD-N): (a) for the entire crystal showing maps of peak reflectivity ( I R p e a k , normalized by the maximum value), rocking curve peak position ( δ θ m ), width ( Δ θ σ ), and the effective radius of curvature R calculated from spline-interpolated δ θ m ; (b) for the region of interest where the radius of curvature is maximized R 0 50 m (shown by the dashed rectangle in (a)). The x and y coordinates in (b) are shown with respect to the lower left corner of the rectangle. The limits of the colormaps for δ θ m and Δ θ σ in (b) are redefined to highlight variations in the mapped values.
Crystals 09 00396 g004
Figure 5. Decoupled dilational and rotational contributions to the effective tilt δ θ m for plate CVD-N: (a)for the entire crystal; (b) for the region of interest where the radius of curvature is maximized R 0 50 m.
Crystals 09 00396 g005
Table 1. Parameters of the experimental configurations shown in Figure 1.
Configuration(a)(b)(c)
E, [keV]8.29.838.05
θ S i , [deg]37.3843.3823.66
η S i , [deg]36.241.422.2
θ C , [deg]36.8345.021.96
η C , [deg]90.090.054.7
E—photon energy (selected by the DCM); θ S i —Bragg angle of the Si beam conditioner crystal; η S i —asymmetry angle of the Si reflection; θ C —Bragg angle of the studied diamond crystal; η C —asymmetry angle of the diamond reflection (nominal).
Table 2. Statistical rocking curve characteristics for the regions of interest on selected sc-CVD diamond plates.
CVD PlateCVD-BCVD-NCVD-I
D ( δ θ m ) [ μ rad]205873
< Δ θ σ > [ μ rad]132(17)164(39)155(53)
Δ θ σ t o t [ μ rad]134181174
R 0 [m]≳ 70≳ 50≳ 30
D ( δ θ m ) —standard deviation of the peak position from average value; < Δ θ σ > —average curve width (r.m.s.), standard deviation form the average value is shown in parentheses; Δ θ σ t o t —width of the total rocking curve (integrated across the region); R 0 —effective radius of curvature.

