Abstract
The performance of flux-cored Zn-Al filler metal is susceptible to corrosion-induced degradation, thereby impairing its brazability. In this study, flux-cored Zn-2Al filler metals are prepared, and the salt spray test is subsequently carried out on the prepared filler metals. Scanning transmission electron microscope is used to identify the phases in filler metals. An electrochemical workstation was employed to test the electrochemical performance of the filler metals. The corrosion pathways and evolution patterns of filler metals are analyzed. The findings demonstrate that the corrosion type of the filler metals is electrochemical corrosion, characterized primarily by the corrosion modes of pitting corrosion and intergranular corrosion. The cathode is the α-Al phase, which undergoes an oxygen-absorption corrosion reaction, while the anode is the η-Zn phase, which experiences corrosion and subsequent dissolution. The continuously distributed α-Al phase bands and discontinuously distributed large-sized rod-like α-Al phases accelerate the corrosion rate, and the corrosion propagation rate along the extrusion direction is higher than that in the radially inward direction. After 15 days of salt spray corrosion, the tensile strength of filler metals decreases by 16.2%, and the elongation rate decreases to 3.73%.
1. Introduction
Zn-Al filler metals are employed in fields of aerospace, electronics, and rail transportation for brazing aluminum alloys due to their advantages, including low melting point, favorable wettability, and superior processability [1,2,3,4]. In contrast to Zn-Al filler metal wires, flux-cored Zn-Al filler metals demonstrate better suitability for automatic brazing equipment [5,6]. However, flux-cored Zn-Al filler metals are susceptible to corrosion attacks during storage, which reduces the fluidity and filling performance of filler metals [7,8].
It is necessary to investigate the corrosion behavior of filler metals for enhancing the corrosion resistance [9]. The available research primarily focus on the corrosion types, corrosion mechanisms, and mechanical properties [10,11,12]. Roberts et al. [13] proposed that the corrosion of Zn-Al alloys is due to chemical corrosion caused by the high affinity between Al atoms and O atoms at grain boundaries. Yan et al. [14,15] found that electrochemical corrosion occurred on the surface of filler metal in the form of pitting corrosion, which reduces the mechanical properties of filler metals. Lin et al. [16] investigated the corrosion behavior of Zn-Al alloys in seawater at 80 °C and discovered that the filler metal mainly experiences electrochemical corrosion in the form of intergranular corrosion. The corrosion reaction in this system is hydrogen evolution corrosion. Li et al. [17] found that the electrode potentials of Al and Zn are −0.83 V and −1.10 V in a humid environment, respectively, and η-Zn acts as the anode. The corrosion reaction in this system is oxygen absorption corrosion. Pritha et al. [18] examined the influence of microstructure on the corrosion behavior of alloys. The findings indicated that in the electrochemical corrosion solution, Zn ions react with water to form zinc hydroxide, which forms a protective layer on the metal surface, slowing subsequent corrosion. Zhang et al. [19] found that with the extension of corrosion time, the tensile strength and elongation of the filler metal decreased, and the brazing processability of the filler metal decreased.
There is controversy over the electrochemical corrosion reactions of filler metals [20,21,22]. Yu et al. [23] studied the corrosion behavior of the Zn-2Al filler metal at 117.85 °C in a hot, damp environment. The results showed that the standard electrode potential of α-Al is lower than that of the Zn-rich phase and that α-Al undergoes anodic dissolution, acting as the anode. Yang et al. [24] also discovered that α-Al is preferentially corroded in SO2 and O2 environments, and the corrosion products mainly included Al6O5(SO4)4·xH2O. However, Osório [25] hold the opposite view, where the Zn-rich phase was the anode. Liu et al. [26] found that the potentials of Al and Zn shift to −0.17 V and −1.02 V under polarization. Hence, Zn is preferentially corroded as the anode. In addition, Yan et al. [14] found that the heat treatment can improve the corrosion resistance of alloys by promoting the precipitation of elements. Cai et.al. [27] also found the same phenomenon. Zhao et al. [28] demonstrate that Ge can optimize the microstructure of Zn-Al filler metals, thereby improving corrosion resistance. Ji et al. [29] found that Ti could also optimize the microstructure of filler metals to improve the corrosion resistance. Therefore, the microstructure of the filler metals is closely related to its corrosion resistance.
In this study, flux-cored Zn-2Al filler metals are prepared. The corrosion mechanism of the Zn-2Al filler metals is analyzed using salt spray testing. The effect of the microstructure on the corrosion paths of filler metals is investigated. The relationship between corrosion time and mechanical properties of filler metals is analyzed. This study will offer a theoretical foundation for enhancing the corrosion resistance of flux-cored filler metals.
2. Materials and Methods
In this study, commercially pure zinc (99.95%) and aluminum (99.70%) are employed as raw materials to prepare Zn-2Al alloys (2% Al + 98% Zn). The raw materials are loaded into a high-frequency induction graphite crucible and heated to 650 °C for 5 min. Thereafter, they are air-cooled to 25 °C to obtain the ingots. The filler metal ingot is processed into a Φ50 × 80 mm cylinder with a Φ20 × 60 mm hole in the center. The brazing flux, CsAlF4, is filled into the hole. The ingot filled with flux is extruded into alloy rods with a diameter of 8 mm at 380 °C, which is the optimal forming temperature obtained through systematic experiments. The alloy rods are processed into a wire-shaped flux-cored filler metal with a diameter of 3 mm through multi-pass processing.
The salt spray test is performed according to the GB/T10125-2021 standard [30]. The deionized water and NaCl are prepared in proportion to obtain a 3.5 wt.% NaCl solution. The test temperature is set to 38 °C to improve the corrosion rate. Filler metals are cleaned with ethanol before performing the salt spray test. The corroded filler metals are cut along the longitudinal section throug wire electrical machining to prepare SEM samples. After polishing and grinding, the obtained samples are cleaned with ultrasonic waves.
The electrochemical performance of Zn-2Al is measured using an electrochemical workstation (CHI760E, Chenhua Instruments, Shanghai, China) in a standard three-electrode system. Prior to the test, the surface of the filler metal is sequentially ground with 400#, 800#, 1000#, and 2000# diamond abrasive papers to remove surface oxides and machining defects. All samples are washed through ultrasonic cleaning in absolute ethanol for 15 min to eliminate residual abrasive particles. After drying naturally at room temperature, the samples are used as the working electrode with an exposed area of 1 cm2, a platinum sheet (10 mm × 10 mm × 0.5 mm) as the counter electrode, and a saturated calomel electrode (SCE) as the reference electrode. The electrolyte is 3.5 wt.% NaCl aqueous solution (analytical grade, without further purification) and is maintained at 25 ± 1 °C throughout the test. The curves are recorded at a scan rate of 1 mV·s−1, with the potential range set from −1.5 V to 0.5 V (vs. SCE). Before scanning, the samples are stabilized in the electrolyte for 30 min to achieve a steady open-circuit potential (OCP). Each test is repeated three times to ensure data reliability.
The filler metals are subjected to tensile tests using a universal testing apparatus (DNS-100, Sinotest Equipment Co., Ltd., Jinan, China) at a rate of 1 mm/min. The average tensile strength of five identical filler metals is calculated. Tensile tests were conducted in strict accordance with T/CMES 02006-2024 “Welding Wire Tensile Testing Method”, and the technical drawing of samples are shown in Figure 1 [31]. The phases in filler metals are identified using a scanning transmission electron microscope (STEM, JEOL JEM-2100F, JEOL, Tokyo, Japan) and scanning electron microscope (SEM, ZEISS-SUPRA55, Carl Zeiss AG, Oberkochen, Germany). The TEM sample with a thickness of 50 nm is prepared using a focusing ion beam (FIB, Helios G4 UX, Thermo Fisher Scientific, Waltham, MA, USA). The scanning electron microscope (SEM, ZEISS-SUPRA55) and energy dispersive spectroscopy (EDS, Oxford Instruments, Oxfordshire, UK) are used to analyze the microstructure and corrosion morphology of the filler metal. The BSE mode is adopted to obtain the pictures.
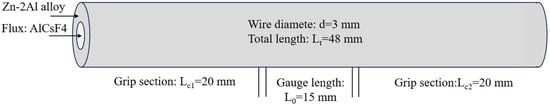
Figure 1.
Technical drawing of tensile samples.
3. Results and Discussion
3.1. Microstructures of Filler Metals
The typical microstructure of the Zn-2Al filler metals is illustrated in Figure 2. Zn-Al filler metals are composed of the black phase and white phase. The black phase mainly exists in three forms in the microstructure of filler metals, namely large-sized rod-shaped grains with concentrated distribution, small spherical grains distributed at grain boundaries, and particulate phases within η-Zn grains. According to the EDS analysis results, as shown in Table 1, the chemical composition of the black phase is (36.4–43.4) wt.% Al + (56.6–63.6) wt.% Zn (Point 1, 3, 5, 7 and 8). The black phase is α-Al. The chemical composition of white phase is (1.5–3.1) wt.% Al + (96.9–98.5) wt.% Zn (Point 2, 4 and 6). The white phase is η-Zn. In order to accurately characterize the crystal structure of each phase in the filler metal, the transmission analysis is carried out on the filler metal, and the results are shown in Figure 2c–e. From the bright-field image in Figure 2b, two different areas can be found. The relevant selected electron diffraction (SAED) patterns are revealed in Figure 2b–d. SAED 1 confirmed the α-Al phase along the [012] crystal band axis of the Al crystal. SAED 2 identified the η-Zn phase along the [11] crystal band axis of η-Zn crystal. Therefore, the black phase is α-Al, and the white phase is η-Zn.
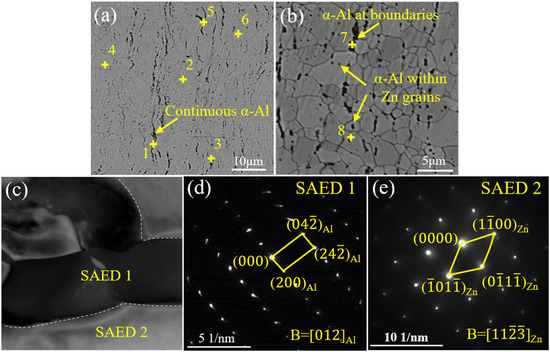
Figure 2.
Typical microstructure of the Zn-2Al filler metals: (a,b) SEM image; (c) bright-field image; (d,e) selected area electron diffraction patterns corresponding to the marked locations in (a).

Table 1.
EDS results marked in Figure 1 (wt.%).
3.2. Corrosion Mechanism of Filler Metals
Figure 3a presents the polarization curve of Zn-Al filler metals when immersed in a 3.5 wt.% NaCl solution. The corrosion rates of different alloys are listed in Table 2. The corrosion rate of the Zn-2Al alloy is 2.61 e−1 mm/y. For the cathodic polarization curves, a clear trend emerges: as the cathodic overpotential goes up, the cathodic corrosion current first rises rapidly and then increases at a slower rate. This trend suggests that the diffusion process of oxygen (O) exerts an influence on the cathodic reaction. The anodic polarization curves show a different characteristic: as the anodic overpotential increases, the anodic corrosion current rises sharply. At this stage, the pitting potential (Epit) equals the corrosion potential (Ecorr)—a phenomenon that indicates that the anodic reaction is affected by the pitting process.
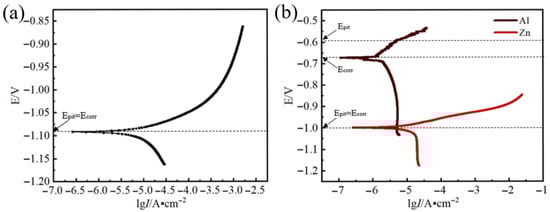
Figure 3.
Polarization curves: (a) Zn-2Al filler metals; (b) Zn and Al.
Table 2.
The corrosion rate calculated from Figure 2.
Figure 3b presents the polarization curves of Zn and Al when immersed in a 3.5 wt.% NaCl solution. The corrosion rate of Zn and Al is 9.62 e−2mm/y and 1.10 e−2mm/y, respectively. It proves that Al is more corrosion-resistant than Zn at room temperature. The cathodic polarization curves are characterized by a larger slope, indicating that the cathodic reaction is mainly influenced by diffusion process. The cathodic current increases to a limited extent because O atoms participate in the cathodic reaction cannot be supplied infinitely. However, there are differences in the anodic polarization curves between Zn and Al. The anodic polarization curve of Zn is relatively flat, and as the anodic overpotential increases, the current rapidly increases, indicating that the corrosion products cannot hinder the progress of anodic reaction. Therefore, pitting mainly affects the anodic reaction (Epit = Ecorr). The anodic polarization curve of Al first flattens and then gradually steepens. As the anodic overpotential increases to −0.6 V, the increasing rate of current begins to fall, indicating the passivation of the anode. The anodic products hinder the progress of the anodic reaction. Therefore, the activation process mainly affects the anodic reaction, with Epit > Ecorr at this point. The passivation behavior of Al in the 3.5 wt.% NaCl solution results in a pitting potential of −0.67 V, which is higher than the pitting potential of the Zn in 3.5 wt.% NaCl solution (−1 V). The electrode potential of Zn is lower than that of Al, indicating that the Zn-2Al filler metals undergo electrochemical corrosion, with Zn serving as the anode in this system. The result is consistent with the research results of Osório’s et al. [25] but contradict the findings of Yu et al. and Yan et al. [14,23] due to the different testing temperatures. When the testing temperature is 100 °C, the diffusion ability of chloride ions increases. The ability of chloride ions to damage the oxide film increases. The α-Al is difficult to passivate to improve the corrosion potential. The corrosion potential remains lower than that of η-Zn and dissolves as an anode. When the testing temperature is approaching room temperature, the diffusion ability of chloride ions is weak. The α-Al is easy to passivate. At this time, η-Zn dissolves as an anode.
Figure 4 shows the corrosion morphology and the longitudinal section microstructure of the Zn-2Al filler metal after 10 h of salt spray testing. It can be seen that obvious pitting corrosion occurs on the surface of the filler metals. The corroded area displays an obvious mesh-like morphology, showing typical intergranular corrosion characteristics. The color of η-Zn in the corroded area has significantly darkened, while the α-Al remains black. Figure 4c–f shows the corrosion morphology and the composition analysis results. It can be seen that the content of Zn in the corroded area decreases, while the content of O and Al elements increases. This is due to the electrochemical corrosion of microcells formed by the η-Zn phase and α-Al in a salt spray environment [28]. The η-Zn phase acts as the anode and undergoes anodic dissolution reaction, resulting in a decrease in Zn content in the corroded area. It can be seen from Figure 4c,e that the corrosion in the filler metals is concentrated near the α-Al phase, and the degree of the η-Zn phase corrosion intensifies as the size of the α-Al phase increases because a larger cathode area gives rise to an increased anodic current, which in turn accelerates the anodic corrosion.
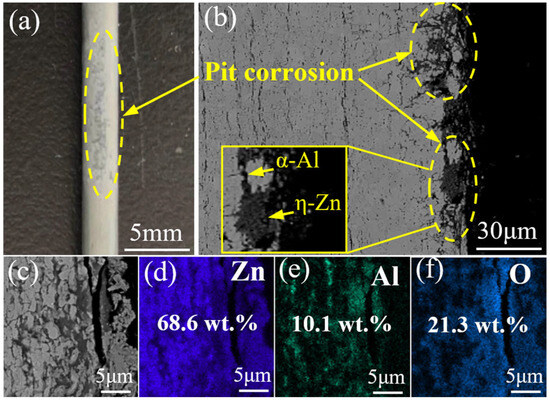
Figure 4.
Corrosion morphology and composition analysis of Zn-2Al filler metal: (a) pitting corrosion, (b,c) microstructure of corrosion area, (d) Zn, (e) Al, (f) O.
Figure 5a,b shows the microstructure and XRD patterns of corrosion products on the surface of the filler metal after 10 hours of salt spray testing. The EDS results marked in Figure 4a are presented in Table 3. It can be seen that the chemical composition of the corrosion products is Zn, O, Cl, C, and Na. The corrosion products mainly contain Zn(OH)2, ZnCl2, ZnO, Zn5(OH)8Cl2H2O, and Zn5(OH)6(CO3)2 because during the corrosion process, the anode dissolution reaction occurs in the η-Zn and forms zinc compound. According to the E-pH pattern of the Zn-H2O system (25 °C) (Figure 5c) [32], the corrosion reaction is Zn + 2H+ → Zn2+ + H2 (hydrogen evolutional corrosion), occurring when pH < 4. The corrosion reaction is 2Zn + O2 + 2H2O → 2Zn(OH)2 (oxygen absorption corrosion), occurring when 4 < pH < 14. The corrosion reaction is ZnO2− + 2H+ → Zn(OH)2, occurring when pH > 14. The pH of the 3.5 wt.% NaCl solution adopted in this study is 7. Therefore, the corrosion reaction of the Zn-2Al filler metal belongs to the oxygen absorption corrosion, and the following reactions mainly occur:
Zn → Zn2+ + 2e−
O2 + 2 H2O + 4e− → 4OH−
Zn2+ + 2OH− → Zn(OH)2
Zn(OH)2 will take part in the following reactions and form other corrosion products in the NaCl solution [33]:
Zn(OH)2 → ZnO + H2O
5Zn(OH)2 + H2O + 2Cl− → Zn5(OH)8Cl2H2O + 2OH−
CO2 + H2O → H2CO3
5Zn(OH)2 + 2 H2CO3 → Zn5(OH)6(CO3)2 + 4H2O
Table 3.
EDS results marked in Figure 1 (wt.%).
Table 3.
EDS results marked in Figure 1 (wt.%).
| Point | Al | Zn | O | Cl | C | Na |
|---|---|---|---|---|---|---|
| 9 | 0.9 | 74.5 | 17.8 | 5.2 | 0 | 1.6 |
| 10 | 0 | 48.2 | 24.8 | 15.5 | 6.3 | 5.2 |
| 11 | 0 | 34.9 | 31.3 | 16.6 | 9.2 | 8.1 |

Figure 5.
Corrosion products: (a) Microscopic morphology, (b) XRD pattern, (c) E-pH image of Zn-H2O system (25 °C).
Figure 5.
Corrosion products: (a) Microscopic morphology, (b) XRD pattern, (c) E-pH image of Zn-H2O system (25 °C).

3.3. Corrosion Propagation Feature of Filler Metals
Figure 6 shows the corrosion morphology of the Zn-2Al filler metals with different salt spray testing times. It can be seen that the corrosion zone of the filer metals can be divided into the intergranular corrosion area (ICA) and the uniform corrosion area (UCA). In the UCA, the network feature disappears because the η-Zn grains are completely corroded and dissolved in the electrolyte. The depth of the corroded area in the filler metals increases with the prolongation of testing time. When the corrosion time is 10 hours, the corrosion area of filler metal is mainly intergranular corrosion (Figure 6a). When the corrosion time reaches 40 h and 120 h (Figure 6b,c), the depth of the ICA increases significantly, the network characteristics become more obvious, and a clear complete corrosion zone appears.
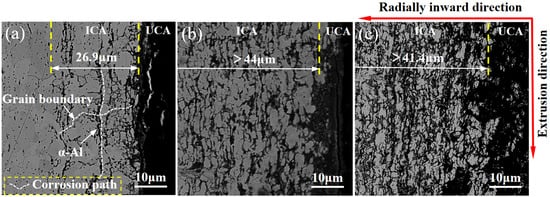
Figure 6.
Corrosion morphology of Zn-2Al filler metals: (a) 10 h; (b) 40 h; (c) 120 h.
According to Figure 6a, corrosion propagation follows a nearly straight path along the extrusion direction, while it proceeds in a predominantly curved manner along the radial direction. It can be seen from Figure 4 that the corrosion characteristics of filler metals exhibit a close correlation with the distribution of the α-Al phase. Based on the analysis of the microstructure in the filler metals (Figure 2), we mainly classify the corrosion forms of the Zn-2Al filler metal into three types according to the distribution characteristics of α-Al. Table 4 presents the EDS results marked in Figure 7. An obvious increase in the Al content is detected in different areas (Point 12, 13 and 14), which indicates the occurrence of corrosion. Figure 6 shows the influence of α-Al distribution patterns on the corrosion behaviors and the corresponding schematic diagram of the corrosion mechanism. The first one is a continuous distribution of α-Al. The size of α-Al is relatively large and continuously distributed along the extrusion direction. The η-Zn grains with relatively small size distribute between α-Al grains (Figure 7a). The surface area of the anode (η-Zn phase) is much smaller than that of the cathode (α-Al), forming a micro-battery with a small anode/large cathode. Therefore, the chemical reaction (2Zn + O2 + 2H2O → 2Zn(OH)2) has a high rate. The dissolution rate of η-Zn is fast (Figure 7d). The second one is α-Al located at η-Zn grain boundaries, which is small and discontinuous (Figure 7c). The surface area of the anode (η-Zn phase) is larger than that of the cathode (α-Al), forming a micro-battery with a large anode/small cathode and a lower chemical reaction rate. Therefore, the dissolution rate of η-Zn is relatively slow (Figure 7e). The last one is α-Al precipitated in the η-Zn grains, as shown in Figure 7c. The size of α-Al is the smallest. The surface area of the anode (η-Zn phase) is much larger than that of the cathode (α-Al), forming a micro-battery with a large anode/small cathode and the lowest chemical reaction rate. Therefore, the dissolution rate of η-Zn is the slowest (Figure 7f).
Table 4.
EDS results marked in Figure 7 (wt.%).
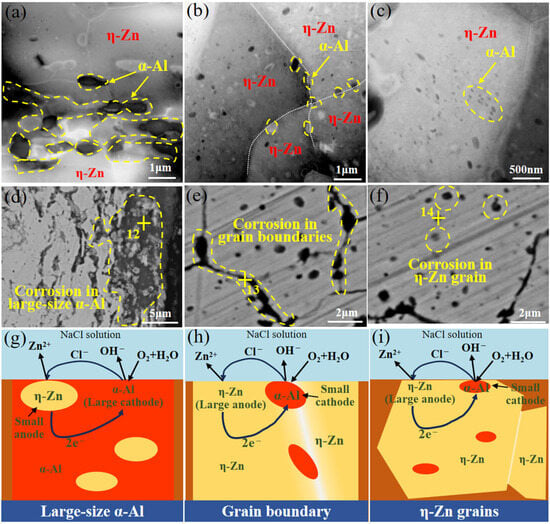
Figure 7.
The distribution of α-Al and corresponding corrosion behaviors and corrosion mechanism: (a–c) microstructure, (d–f) corrosion behaviors (g–i) corrosion mechanism.
With a comprehensive discussion of corrosion type classification and microstructural characterization results for Zn-2Al filler metals, we clarify the stepwise corrosion pathway of the filler metals. Figure 8 shows the schematic diagram of the corrosion propagation path in filler metals. The NaCl solution and O2 promote pitting corrosion on the surface of filler metals (point A). The corrosion preferentially occurs in the α-Al and grain boundaries of η-Zn. For the continuous distribution of large-sized α-Al, the adjacent small-sized η-Zn phase is corroded and rapidly dissolved, and the corrosion path mainly develops rapidly along the extrusion direction (Path 1). For small-sized α-Al with the discontinuous distribution at the η-Zn grain boundaries, the adjacent small-sized η-Zn phase is corroded, but the corrosion rate is slow, and the pitting path develops along the interface of the α-Al/η-Zn phase (Path 2). For small-sized α-Al in the η-Zn grains, η-Zn are corroded. However, the corrosion rate slows down, and the path of pitting corrosion development has no fixed direction (Path 3). The corrosion rate along the extrusion direction is much higher than that along other directions due to the band-like distribution of α-Al. Therefore, the corrosion path of filler metals preferentially propagates along the extrusion directions.
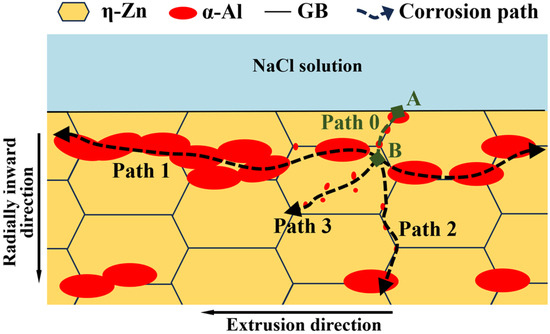
Figure 8.
Schematic diagram of corrosion propagation path in the Zn-2Al filler metal.
3.4. Mechanical Property of Zn-2Al Filler Metals
Figure 9a shows the load displacement curves of the Zn-2Al filler metals with different salt spray testing times. It can be seen that the load and displacement decrease with the extension of time. Figure 9b shows the attenuation of tensile strength and elongation of Zn-2Al filler metals with different salt spray testing times. The tensile strength and elongation rate are 173.95 MPa and 34.62% before salt spray testing, respectively. When the salt spray corrosion time is 15 days, the tensile strength drops to 145.77 MPa with a decrease rate of about 16.2%. The elongation rate decreases to 3.73%. The decrease in mechanical properties of the filler metals is mainly due to electrochemical corrosion. The generation of corrosion products reduces the bonding strength between grains, thereby reducing the mechanical properties of the joint.
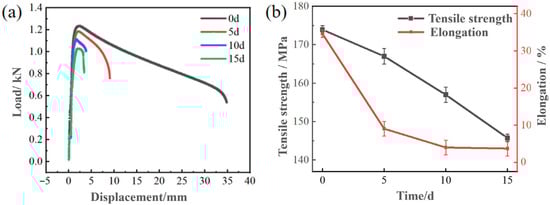
Figure 9.
The influence of corrosion time on the mechanical properties of Zn-2Al filler metals: (a) load displacement curves; (b) tensile strength and elongation.
4. Conclusions
This study primarily investigates the corrosion behavior of Zn-2Al filler metal. The main conclusions are summarized as follows:
- The corrosion type of the filler metals is electrochemical corrosion, characterized primarily by the corrosion modes of pitting corrosion and intergranular corrosion. The α-Al acts as the cathode in this system due to passivation, and η-Zn experiences corrosion and dissolution as the anode.
- The formation of a micro-battery with a small anode/large cathode in continuously distributed α-Al phase bands accelerates the corrosion rate, and the lateral corrosion propagation rate exceeds that in the depth direction.
- The generation of corrosion products reduces the bonding strength between grains and the mechanical properties of filler metals. After 15 days of salt spray corrosion, the tensile strength of filler metals decreased by 16.2%, and the elongation rate decreased to 3.73%.
Author Contributions
Conceptualization, Y.Z. and Y.S.; methodology, Y.Z. and Q.L.; software, X.W.; validation, Q.L. and Y.S.; formal analysis, Y.C. (Yinghao Cui); investigation, S.G.; resources, L.C.; data curation, X.L.; writing—original draft preparation, Y.Z.; writing—review and editing, Y.Z.; visualization, X.W.; supervision, Y.C. (Yongqian Chen) funding acquisition, Y.Z. All authors have read and agreed to the published version of the manuscript.
Funding
This research was funded by Key Research and Development and Promotion Projects in Henan Province, grant number 242102231026; Key Research and Development and Promotion Projects in Henan Province, grant number 242102221033; Open Fund Project of Hubei Digital Textile Equipment Key Laboratory, grant number DTL2024006; Key Research and Development Special Project in Henan Province, grant number 241111220100; Key project for school achievement cultivation, grant number K2023ZDPY01; and Science and Technology Guidance Program Project of China National Textile and Apparel Council, grant number 2025070.
Institutional Review Board Statement
Not applicable.
Informed Consent Statement
Not applicable.
Data Availability Statement
Research dates are contained within the article.
Acknowledgments
We would like to thank everyone who provided help.
Conflicts of Interest
The authors declare no conflict of interest.
References
- Long, W.; Zhao, Y.; Zhong, S.; Zhang, G.; Huang, S. Research Progress on Intermetallic Compounds in Copper-Aluminum Brazed Joints. Rare Met. Mater. Eng. 2021, 50, 7–13. [Google Scholar]
- Sun, H.; Yu, G.; Chen, S.; Huang, J.; Yang, J. Effect of ZnAl filler metals on the characteristics of the joint made by the high-frequency induction brazing of 304 stainless steel and 6A02 aluminum. J. Manuf. Process. 2021, 68, 961–972. [Google Scholar] [CrossRef]
- Tan, C.; Zang, C.; Xia, H.; Zhao, X.; Zhang, K.; Meng, S.; Chen, B.; Song, X.; Li, L. Influence of Al additions in Zn–based filler metals on laser welding–brazing of Al/steel. J. Manuf. Process. 2018, 34, 251–263. [Google Scholar] [CrossRef]
- Huang, R.; Tan, C.; Sun, Y.; Sun, Y.; Gong, X.; Wu, L.; Chen, B.; Zhao, H.; Song, X. Influence of processing window on laser welding-brazing of Al to press-hardened 22MnB5 steel. Opt. Laser Technol. 2021, 133, 106566. [Google Scholar] [CrossRef]
- Huang, S.; Long, W.; Lu, Q.; Jiu, Y.; Zhong, S.; Bao, L.; Zhao, Y. Research on the corrosion resistance of Cu-Al joints brazed with flux-cored Zn-2Al filler metal. Mater. Mater. Mater. Res. Express 2019, 6, 056560. [Google Scholar] [CrossRef]
- Murakami, T.; Nakata, K.; Tong, H.; Ushio, M. Dissimilar metal joining of aluminum to steel by MIG arc brazing using flux cored wire. ISIJ Int. 2003, 43, 1596–1602. [Google Scholar] [CrossRef]
- Fei, W.; Wang, B.; Lou, Y.; Long, W.; Deng, J.; Zhang, L.; Yin, P.; Wang, S. Study on Novel Powder Metallurgy Al-Si Brazing Filler Metal with Flux. Crystals 2022, 12, 544. [Google Scholar] [CrossRef]
- Long, W.; Zhang, L.; Huang, J.; Cheng, H. A brief analysis of brittle fracture of flux-cored Zn-Al welding wire. In Proceedings of the National Conference on Brazing and Special Joining Technology, Zhengzhou, China, 6–8 November 2009; China Mechanical Engineering Society: Beijing, China, 2009; Available online: https://www.zhangqiaokeyan.com/academic-conference-cn_meeting-15131_thesis/020221333855.html (accessed on 19 October 2009).
- Feng, L. Study on the Interaction Mechanism Between Flux and Cladding Metal in Zinc-Aluminum Flux-Cored Brazing Filler Metals. Master’s Thesis, Zhengzhou University, Zhengzhou, China, 2019. [Google Scholar]
- Supornpaibul, N.; Duff, J.; Burke, M.; Wang, Y.; Scenini, F. Stress corrosion crack initiation in filler metal 82 in oxygenated high-temperature water. Corros. Sci. 2023, 214, 111008. [Google Scholar] [CrossRef]
- Ma, Y.; Dong, H.; Li, P.; Wu, B.; Huang, L.; Zhang, L.; Li, C.; Li, J. Galvanic corrosion of AA5052/304SS welded joint with Zn-based filler metal in marine engineering. Corros. Sci. J. Environ. Degrad. Mater. Its Control 2023, 211, 110912. [Google Scholar] [CrossRef]
- Huang, J.; Long, W.; Zhong, S. Effect of Al element in Zn-Al fillers on the corrosion resistance of Cu/Al brazed joints. J. Mech. Sci. Technol. 2020, 34, 711–717. [Google Scholar] [CrossRef]
- Roberts, C. Intercrystalline corrosion in cast zinc-aluminium alloys. J. Inst. Met. 1952, 81, 301–304. [Google Scholar]
- Yan, X.; Liu, S.; Long, W.; Huang, J.; Zhang, L.; Chen, Y. Stress corrosion crack of ZnAl15 alloys in hot and humid environment. Mater. Lett. 2013, 93, 183–186. [Google Scholar] [CrossRef]
- Chen, Y.; Sun, Z.; Yan, X.; Huang, J.; Long, W.; Liu, S. Analysis on embrittlement phenomenon of flux cored Zn–Al wire. Mater. Sci. Technol. 2013, 29, 1017–1019. [Google Scholar] [CrossRef]
- Lin, Y.; Zhao, X.; Wang, H.; Shi, X.; Wang, T. Effect of Al on the Intergranular Corrosion of Zn-Al Sacrificial Anodes in Seawater at 80 °C. J. Mater. Eng. Perform. 2023, 32, 6876–6884. [Google Scholar]
- Li, X.; Zhang, Q.; Liu, Z.; Li, T.; Cheng, Y.; Yuan, H. Discussion on embrittlement of Zn-Al brazing filler metal. Weld. China 2013, 1, 49–52. [Google Scholar]
- Pritha, C.; Siddhartha, D. Effect of microstructure on the corrosion behavior of a zinc-aluminium alloy. J. Mater. Sci. 2005, 40, 805–807. [Google Scholar]
- Zhang, G.; Lv, D.; Long, W.; Zhong, S. Accelerated Tests for Atmospheric Corrosion of Zn-2Al Brazing Filler Metal. Chin. J. Rare Met. 2014, 38, 993–998. [Google Scholar]
- Vacchi, G.; Magalhes, D.; Kugelmeier, C.; Silva, R.; Mendes Filho, A.; Kliauga, A.; Rovere, C. Influence of Long-Term Immersion Tests on the Electrochemical Corrosion Behavior of an Ultrafine-Grained Aluminum Alloy. Metals 2024, 14, 1417. [Google Scholar] [CrossRef]
- Tan, T.; Chen, T.; Dong, Y.; Hong, Y.; Gao, Y.; Zhang, J. Electrochemical Corrosion Behavior of Zn and 55%Al-Zn Alloy Coatings by Salt Sptay Test. Corros. Sci. Protetion Technol. 2014, 26, 301–306. [Google Scholar]
- Touane, A.; Diafi, M.; Benamor, S.; Sahnoune, D. Effects of Al content on microstructure and corrosion behavior of Zn-Al alloy coatings. Dig. J. Nanomater. Biostructures 2024, 19, 409–416. [Google Scholar] [CrossRef]
- Yu, R.; Li, Y.; Liu, S.; Long, W.; Chen, Y. Microstructural and damp-heat corrosion characteristics of Zn-2 wt% Al filler metals alloys containing trace Ag. Mater. Res. Express 2018, 6, 026550. [Google Scholar] [CrossRef]
- Yang, L.; Zeng, X.; Zhang, Y.; He, J.; Song, Z. Evolution of atmospheric corrosion of superplastic Zn-Al alloys exposed to an industrial environment. Mater. Corros. 2015, 66, 1169–1180. [Google Scholar] [CrossRef]
- Osório, W.; Célia, M.; Garcia, A. Microstructural solidification parameters of a Zn-4Al alloy affecting mechanical and corrosion properties. J. Mater. Sci. 2004, 18, 189–193. [Google Scholar]
- Liu, J.; Meng, Y.; Cui, J.; Yang, T. Research Progress of Effect of Alloying and Microstructure on Corrosion Resistance of Zn Alloy. Mater. Heat Treat. 2010, 39, 9–11. [Google Scholar]
- Cai, B.; Liu, X.; Yi, Y.; Li, H.; Shi, F. Influence of Aging Temperature on the Electrochemical Corrosion Behavior of an Age-Hardening 7xxx Aluminum Alloy. Crystals 2025, 15, 107. [Google Scholar] [CrossRef]
- Zhao, Y.; Wang, X.; Lu, Q.; Shen, Y.; Cui, Y.; Guo, S.; Cui, L.; Chen, Y.; Li, X. Effects of Minor Ge on the Microstructure and Corrosion Resistance of Zn-2Al Filler Metals. Materials 2025, 18, 5111. [Google Scholar] [CrossRef]
- Ji, F.; Xue, S.; Dai, W. Effects of Ti on the Brazability of Zn-22Al-xTi Filler Metals as Well as Properties of Cu/Al Brazing Joints. Rare Met. Mater. Eng. 2013, 42, 2453–2457. [Google Scholar] [CrossRef]
- GB/T 10125-2021; Corrosion Tests in Artificial Atmospheres—Salt Spray Tests. State Administration for Market Regulation, Standardization Administration of the People’s Republic of China: Beijing, China, 2021.
- T/CMES 02006-2024; Welding Wire Tensile Testing Method. Chinese Mechanical Engineering Society: Beijing, China, 2024.
- Loučka, T.; Janoš, P. Vypovídací schopnost diagramů potenciál–pH a speciace iontů. Chem. Listy 2014, 108, 677–681. [Google Scholar]
- Cheng, Q.; Song, S.; Song, L.; Hou, B. Effect of relative humidity on the initial atmospheric corrosion behavior of zinc during drying. J. Electrochem. Soc. 2013, 160, C380–C389. [Google Scholar] [CrossRef]


Disclaimer/Publisher’s Note: The statements, opinions and data contained in all publications are solely those of the individual author(s) and contributor(s) and not of MDPI and/or the editor(s). MDPI and/or the editor(s) disclaim responsibility for any injury to people or property resulting from any ideas, methods, instructions or products referred to in the content. |
© 2026 by the authors. Licensee MDPI, Basel, Switzerland. This article is an open access article distributed under the terms and conditions of the Creative Commons Attribution (CC BY) license.