Abstract
During the annealing, recrystallization processes in ceramics can occur, manifested in the formation of new grains, grain-boundary migration, and grain coarsening. It was expected that recrystallization in mechanically deformed zones, which contain residual stresses and high defect densities, will proceed in a different way compared to the surrounding, relaxed material. Characterizing these spatial variations in defect evolution, phase transformations, and microstructural recovery is essential for predicting performance and avoiding critical structural changes when designing zirconia-based ceramics for high-temperature, load-bearing applications. To study these effects, we used partially stabilized Ce-doped ZrO2 ceramics, fabricated by solid-state synthesis. Phase composition, structural features, and morphology of these ceramics were studied using Raman spectroscopy, XRD and SEM before and after annealing in the mechanically stressed and relaxed regions. In mechanically deformed regions a more pronounced phase transformation from monoclinic to tetragonal was observed compared to relaxed zones. This result indicates that strain can facilitate tetragonal phase formation in zirconia ceramics when the material is subjected to elevated temperatures. Mechanical stresses should be taken into account when fabricating ceramic components, as they can induce phase transformation during heat treatments and change the properties of ceramics significantly.
1. Introduction
Zirconia-based ceramics can be used in a wide range of applications in energy, industry, and medicine [1,2]. Although fully stabilized zirconia ceramics are required for most applications, partially stabilized ceramics offer certain advantages that are useful in specific applications. For example, partially stabilized zirconia ceramics have increased resistance to mechanical stress, including higher crack resistance, since the presence of phases with different crystal structures effectively prevents the propagation of cracks [3,4]. In addition, partially stabilized zirconia ceramics effectively withstand thermal shocks, allowing them to be used in conditions of sudden temperature changes typical of high-temperature industrial processes.
However, zirconia ceramics can be susceptible to phase transformations during processing and subsequent operation [5,6]. For example, previous studies have shown that grinding of ceramics can lead to phase transformations in surface layers [7,8,9,10]. One study reported that grinding induced the formation of a monoclinic phase in the surface layer of zirconia ceramics initially composed entirely of the tetragonal phase and that a short 30 min annealing at 1000 °C led to a reverse transformation back to the tetragonal phase [11].
It is also interesting to trace the phase and structural changes in ceramics after indentation. The stress concentrated in the center of the indentation can become high enough to destabilize the crystal structure, often reaching values comparable to the material’s hardness. As a result, amorphization, or the formation of metastable high-pressure phases, may occur beneath the indenter. One of the early investigations in this field explored the use of highly localized mechanical stresses to induce phase transformations and amorphization in semiconductors such as Si, Ge, GaAs, and InSb, as well as in ceramics including SiC and SiO2. The results confirmed the appearance of amorphization and the formation of high-pressure phases, with these transformations shown to be strongly influenced by the unloading rate [12]. A study combining indentation and Raman spectroscopy was also conducted on LaCoO3, where significant stress-induced changes in the Raman spectra were observed. In particular, tensile stress was found to stabilize a structural state characterized by an increased average Co–O bond length [13]. Raman spectroscopy was also used to construct residual stress maps for carbide ceramics [14]. Similar studies performed on ZrO2 revealed that indentation of stabilized Y-doped ZrO2 ceramics (or single crystals) can induce tetragonal to monoclinic (t → m) transformations in the indentation area, driven by the high shear stresses generated during loading [15,16]. One study also noted that yttria-stabilized zirconia (YSZ) ceramics composed of nanosized grains are less susceptible to phase transformation during indentation compared to materials with submicron-sized grains [17]. A detailed study on 3Y-TZP ceramics using piezospectroscopy analyzed stress-induced Raman shifts of two stress-sensitive zirconia modes (A1 ≈ 468 cm−1 and A2 ≈ 648 cm−1) to map residual stress. At low loads, the stress distribution around cracks matched the Yoffe model, while at high loads, unexpectedly high compressive stresses were observed, in contrast to model predictions, which is explained by stress-induced phase transformation [18]. The results highlight the importance of experimental validation, as existing theoretical models may not accurately predict residual stress behavior after loading.
Studying the Raman spectra of indentation marks not only immediately after microhardness testing but especially after subsequent annealing can be useful for revealing the effects of recrystallization and phase transformations in ceramics. Similar investigations have previously been performed on transparent polycrystalline yttrium aluminum garnet. Indentations were introduced into the sample, followed by annealing at 1500 °C. As a result, grains within the indentation region exhibited recrystallization and were found to be approximately ten times smaller than those in the surrounding unstressed areas [19]. Strain-induced recrystallization was also observed for La2Zr2O7 ceramics. The authors found that during annealing, recrystallization initiated in regions with high dislocation density, such as shear bands and grain boundaries, and progressed through nucleation and grain growth. At temperatures below 1100 °C, recovery dominated by dislocation rearrangement and annihilation slowed recrystallization. Above 1100 °C, recrystallization became the prevailing process, driven by stored deformation energy. The study also proposed a mechanism in which new grains nucleate in shear bands, consuming dislocations and leading to an inhomogeneous recrystallization pattern, followed by subgrain and abnormal grain growth with prolonged annealing [20].
When using ceramic products, various combinations of factors can affect the structure of the ceramic and its properties [21]. Mechanical stresses and elevated temperatures are a fairly common combination of factors that can lead to significant changes, such as phase transitions or microstructural changes [22]. It is important to investigate this phenomenon, especially in partially stabilized zirconia, as this material is of particular interest due to its crack resistance and ability to withstand thermal shocks. However, under certain conditions, it may exhibit insufficient phase stability and undergo significant changes in its properties, potentially altering its behavior during manufacturing and operation.
The present work focuses on the recrystallization of partially stabilized Ce-rO2 ceramics subjected to prior indentation. The ceramics used in this study were fabricated using the solid-state sintering method. Particular attention was given to the investigation of phase transformations occurring in local regions subjected to indentation using Raman spectroscopy.
2. Materials and Methods
Solid-state sintering was used for ceramic sample fabrication, which involves the following sequential steps: combined milling of the initial oxide components, pre-annealing of powders, preparation of green powder, pressing of the green powder into tablet form, and subsequent sintering at high temperature. ZrO2 and CeO2 powders (manufactured by Sigma-Aldrich, purity 99.9%, St. Louis, MO, USA) were used to produce polycrystalline ceramics. At the initial stage, the powders were milled in a Fritsch Pulverisette 6 planetary mill (Fritsch, Idar-Oberstein, Germany) with tungsten carbide grinding sets to mix CeO2 and ZrO2 oxides. The powder ratios were selected to provide a composition corresponding to 20% Ce-doped ZrO2. Mixing in the planetary mill was carried out for 30 min at a rotation speed of 250 rpm. To ensure the formation of dense and homogeneous ceramics, the powders were subjected to pre-annealing at 1300 °C. After pre-annealing, sintering aids based on MgO-SiO2-Al2O3 amounting to 1 wt.% were added to the powders to facilitate liquid-phase sintering and promote grain growth. Larger grains were preferred to minimize the influence of grain boundaries during indentation. This composition is also of interest due to its reduced susceptibility to cracking [23]. After pre-annealing, powders were milled in the planetary mill. To obtain the green powder, the oxide mixture was gradually added to an aqueous solution of polyvinyl alcohol preheated to 90 °C while stirring intensively with a magnetic stirrer. After evaporation of water and drying at 50 °C in a drying oven, the resulting green powder was ground in an agate mortar. The next stage involved forming tablets using a single-axis hydraulic press at a pressure of 250 MPa. Sintering was performed in a Nabertherm LHT 08/18 resistive furnace (Nabertherm, Lilienthal, Germany) in air for 5 h at a temperature of 1700 °C.
The diffractograms of the samples were recorded using a Rigaku SmartLab X-ray diffractometer (Rigaku, Tokyo, Japan) equipped with a CuKα source. Raman spectroscopy studies on ceramics were performed using an EnSpectr Raman microscope (Spectr-M, Chernogolovka, Russia) with a laser wavelength of λ = 532 nm in backscattering geometry. A 100× objective lens was employed, providing a laser spot diameter of approximately 1.6 µm. For recording spectra, laser power of 15 mW was used. It was ensured that this value of laser power does not lead to heating of the sample or additional phase transformations. Each spectrum was acquired with an integration time of ~100 s. The spectral resolution of the spectrometer was 4–6 cm−1. Indentation marks and their micrographs were made on a Metkon DuroLine (Metkon Instruments Inc., Bursa, Turkey) device for studying the microhardness of materials using the Vickers method. In addition, an analysis of microstructural changes in the indentation marks was performed using a Phenom ProX G6 scanning electron microscope (Thermo Fisher Scientific, Eindhoven, The Netherlands).
To prepare the samples for indentation, they were ground and polished using a Struers Tegramin-30 machine (Struers, Ballerup, Denmark). After indentation marks were left on the polished surface of the samples and all initial information on structural, phase, and morphological characteristics was collected, the samples were annealed for 5 min at 1000, 1100, and 1200 °C. After annealing, changes in the samples were recorded using Raman spectroscopy, X-ray diffraction, and scanning electron microscopy.
To estimate the monoclinic phase content, we used the following formula, that contains relative intensities of tetragonal and monoclinic Raman modes of ZrO2 [24]:
where k = 0.97 and δ = 1 represent empirical factors.
It is important to emphasize that the calculated Cm value does not represent the real phase composition. Instead, it serves as a relative indicator for comparing different samples, where a higher relative intensity of tetragonal peaks corresponds to a higher proportion of the tetragonal phase.
3. Results and Discussion
Figure 1a,c shows optical and SEM micrographs of the microstructure of Ce-doped ZrO2 sample obtained after sintering, and Figure 1b demonstrates the corresponding Raman spectra of this sample. The grains of this sample consist of a mixture of the monoclinic and tetragonal phases of zirconium oxide, which is reflected in the presence of peaks at 141, 255, 316, 470, 608, and 630 cm−1 characteristic of the tetragonal phase (pointed out by the “t” letter) [25], and peaks at 170, 184, 331, 376, 530, and 560 cm−1 associated with monoclinic ZrO2 [26]. The microstructure of the sample is composed of large grains of complex shape separated by intergranular regions containing smaller grains. The Raman spectra of these two types of grains differ only slightly in relative peak intensities, indicating that both small and large grains have a similar phase composition, with the larger grains containing a slightly higher fraction of the tetragonal phase, as evidenced by the increased relative intensity of tetragonal peaks compared to monoclinic ones. It is important to take into account that the sample exhibits slight inhomogeneity in the distribution of tetragonal and monoclinic phases. To ensure consistency, we monitored changes at a precisely identified location on the sample, allowing us to track phase evolution during indentation and subsequent recrystallization.
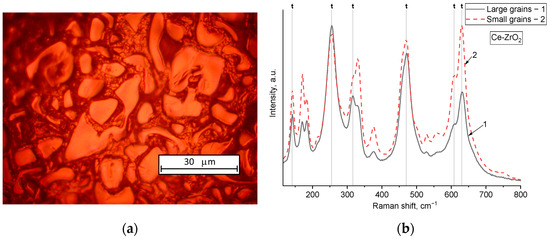
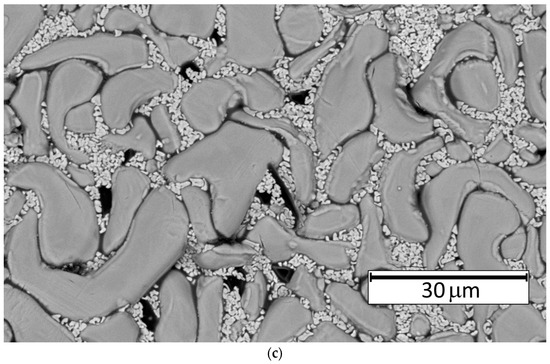
Figure 1.
Optical (a) and SEM (c) images of the microstructure of sintered Ce-doped ZrO2 before polishing, along with the corresponding Raman spectra from small and large grains (b).
After grinding and polishing the samples, a second examination was performed using Raman spectroscopy. Figure 2 presents a comparison of the Raman spectra of Ce-doped ZrO2 ceramic samples before and after polishing. Before polishing, the peaks corresponding to the tetragonal phase were higher in relative intensity or comparable to those of the monoclinic phase. After polishing, a noticeable increase in the intensity of the monoclinic peaks is observed, indicating that t→m phase transformations have occurred in the surface layer of the CeO2-doped ZrO2 ceramics. It should be noted that the phase transition from the tetragonal to the monoclinic phase observed after polishing is a well-known phenomenon that has been studied in sufficient detail in previous research [11].
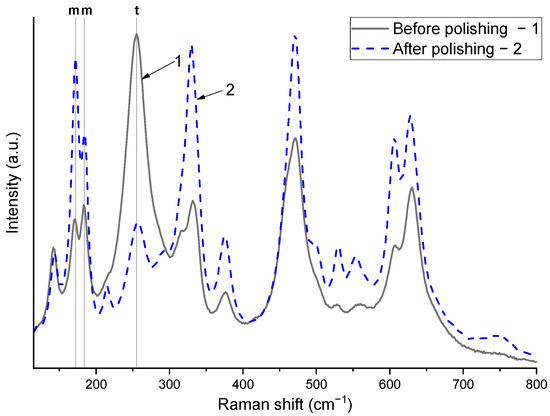
Figure 2.
Comparison of Raman spectra of Ce-doped ZrO2 ceramic samples before and after polishing.
After polishing, the samples were subjected to indentation with a 1 kgf load using a Vickers microhardness tester. Figure 3a,c shows the indentation mark produced on Ce-doped ZrO2 ceramics, captured using optical microscopy and scanning electron microscopy, respectively. No large cracks, typically observed at the corners of the indentation mark, were formed. Only small, short cracks are visible in the area of the indentation mark. This resistance to crack formation is attributed to the use of partially stabilized zirconia, known for its enhanced fracture toughness [27,28]. Crack propagation in such material is suppressed by transformational toughening. In partially stabilized zirconia containing a tetragonal phase, stresses near the crack tip trigger a transformation to the monoclinic phase, which is associated with a volume increase that acts to resist further crack growth [29,30]. Figure 3b depicts Raman spectra obtained from different regions of the indentation mark. The numbers correspond to specific spots: 1—center of the indentation, 2—inside the indentation, 3—midpoint of the distance from the vertex to the center, 4—vertex of the rhombus, 5—midpoint of the side of the rhombus. From the Raman spectra, it can be seen that there are no significant changes in the phase composition after indentation of the ceramics. However, shifts and broadening of certain peaks are observed compared to the non-indented area, which may indicate the presence of stress induced by the mechanical loading. In the following sections, we focus on two specific regions: the center of the indentation, where recrystallization is expected to be most pronounced due to the high localized stresses, and areas located sufficiently far from the indentation mark, where the material is assumed to be unaffected by indentation-induced stress.
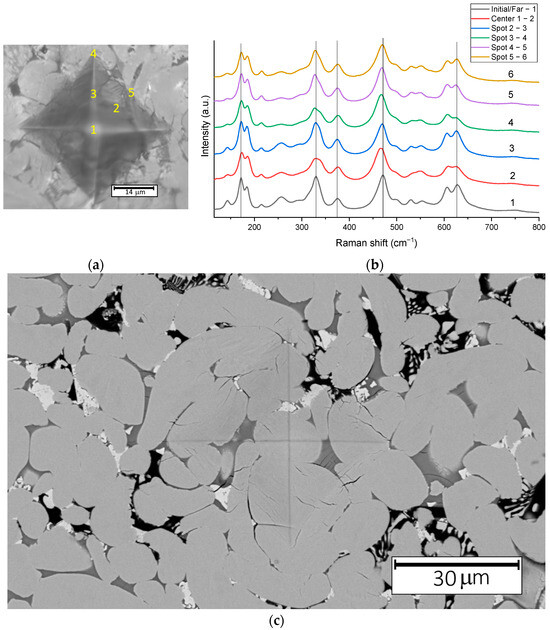
Figure 3.
Optical (a) and SEM (c) micrographs of the indentation mark on a polished Ce-doped ZrO2 sample, along with the corresponding Raman spectra collected from different spots within the indentation region (b).
To study recrystallization processes in Ce-ZrO2 ceramics, annealing of pre-indented samples was performed. Figure 4a,b presents the microstructure of Ce-doped ZrO2 ceramics before and after annealing at 1000 °C for 5 min, respectively. Figure 4c shows SEM images of the indentation mark following the same annealing treatment. After annealing at 1000 °C, cracks were observed around the indentation marks in all samples. Notably, no such cracking was detected in the indentation areas of samples annealed at higher temperatures of 1100 °C and 1200 °C. This result can be explained by considering several contributing factors. First, the annealing temperature of 1000 °C may not have been sufficient to fully induce the monoclinic-to-tetragonal phase transformation. As a result, a high monoclinic phase content remained, reducing the mechanical stability of the material and increasing its brittleness. This likely led to post-annealing volume expansion due to residual transformation mismatch, ultimately causing microcracking around the indentation marks. In addition, at higher annealing temperatures, such as 1100 °C and 1200 °C, enhanced grain boundary mobility and slight creep can occur, allowing the material to accommodate strain more effectively. This can also lead to transient stress dissipation before cooling. In contrast, at 1000 °C, the material lacks sufficient mobility to relax these stresses within the short annealing duration, leading to residual stress buildup and subsequent cracking.
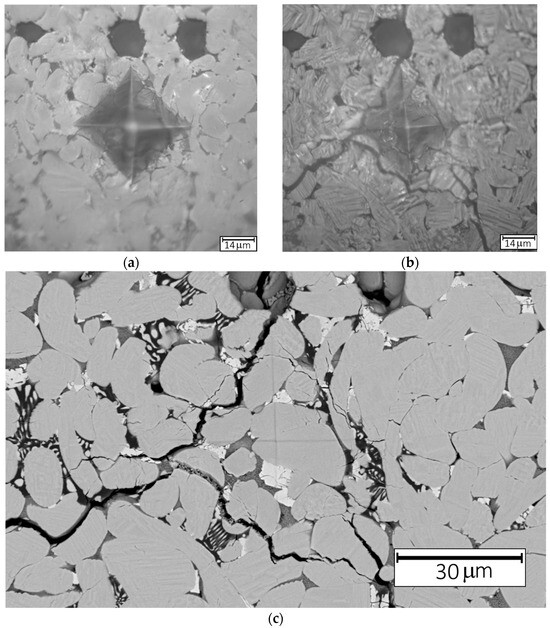
Figure 4.
Optical images of the indentation mark before annealing (a) and after annealing at 1000 °C (b), and SEM micrograph of the sample after annealing at 1000 °C (c).
Figure 5 demonstrates a comparison of the Raman spectra collected from pre-indented samples before and after annealing, recorded at the center of the indentation and at a significant distance from the indentation mark. Raman spectra before and after annealing, obtained from spots located far from the indentation mark, are almost identical. By contrast, the spectra recorded before and after annealing from the indentation center show clear differences. Before annealing, the monoclinic phase was more prevalent in the center of the indentation mark, as evidenced by the significant intensity of the peaks at 178 and 191 cm−1. After annealing for 5 min at 1000 °C, an increase in the relative intensity of the peak at 250 cm−1 is observed, which characterizes the tetragonal phase. This indicates that annealing led to a phase transition m → t being triggered in the stressed area of the indentation center. Shifts in certain peaks after annealing are also evident, which may be connected to the formation of stress-free, relaxed grains during recrystallization.
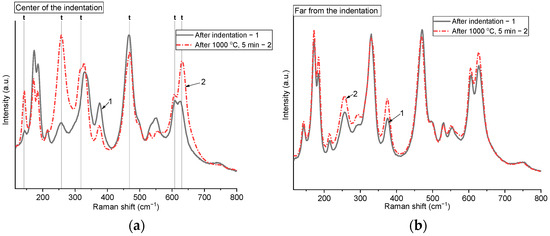
Figure 5.
Comparison of Raman spectra collected at the center of the indentation mark (a) and at a distant, undeformed region (b), before and after annealing at 1000 °C.
Figure 6a,b provides optical images illustrating the morphological changes in the indentation mark after annealing at 1100 °C for 5 min. In Figure 6c, an SEM micrograph of the microstructure of the indentation after the annealing is shown. After annealing, the surface roughness increased, and partial recovery of the indentation mark was observed.
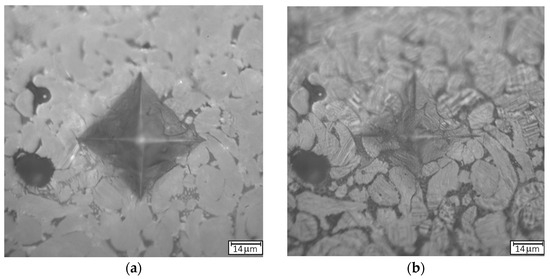
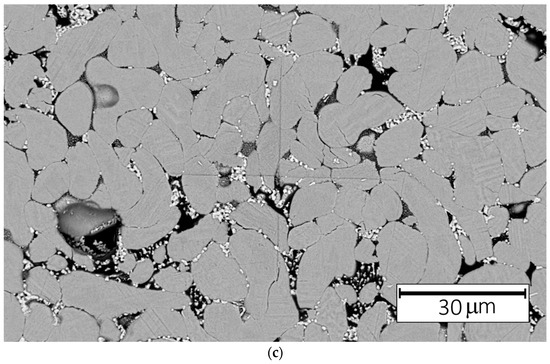
Figure 6.
Optical images of the indentation mark before annealing (a) and after annealing at 1100 °C (b), and SEM micrograph of the sample after annealing at 1100 °C (c).
Figure 7 presents a comparison of Raman spectra of the ceramics before and after 5-min annealing at 1100 °C, collected at the center of the indentation and at a location distant from the indentation mark. These results are similar to those obtained at the lower annealing temperature of 1000 °C. An increase in the relative intensities of tetragonal peaks was also detected, indicating the formation of a tetragonal-rich zone in the center of the indentation mark. In the non-indented area, the relative intensity of the tetragonal phase peaks became slightly higher than before annealing. This may indicate that, as the temperature rises, phase transformations occur not only in the indentation area but also across the entire surface or volume of the ceramic.
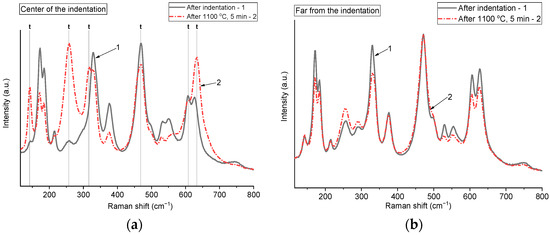
Figure 7.
Comparison of Raman spectra collected at the center of the indentation mark (a) and at a distant, undeformed region (b), before and after annealing at 1100 °C.
Figure 8a,b displays the microstructural changes in the indentation mark area after annealing at 1200 °C for 5 min. Figure 8c illustrates an SEM micrograph of the indentation mark following the same annealing treatment. Following annealing, the surface of the indentation exhibits a pronounced grainy texture, attributed to the coarsening of grains that had previously experienced stress. In addition, an increase in the size of grains located within the intergranular regions between larger grains can also be observed.
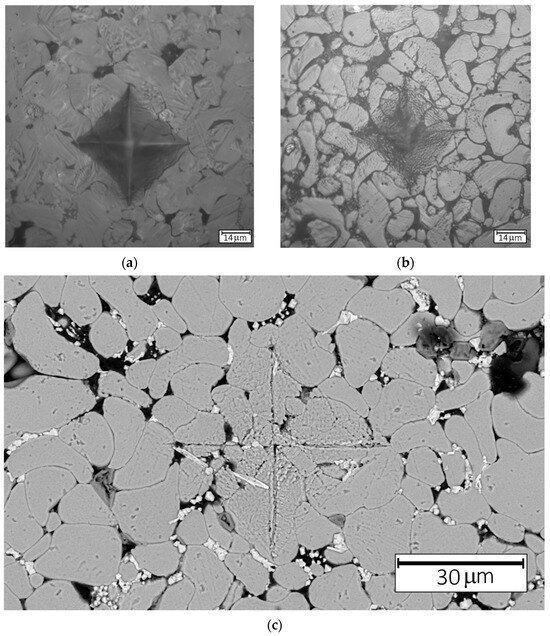
Figure 8.
Optical images of the indentation mark before annealing (a) and after annealing at 1100 °C (b), and SEM micrograph of the sample after annealing at 1200 °C (c).
Figure 9a presents a comparison of the Raman spectra of the ceramics before annealing, while Figure 9b displays optical and SEM images, respectively, of the sample after annealing at 1200 °C for 5 min. In this case, the initially selected area contained a higher fraction of the tetragonal phase compared to the samples annealed at 1000 °C and 1100 °C. Nevertheless, a clear trend is still observed: the region subjected to the highest stress (the center of the indentation) underwent a more pronounced monoclinic-to-tetragonal phase transformation. The measurement spots were precisely identified, and Raman spectra before and after annealing were recorded at the exact same locations. Unlike lower annealing temperatures, in this case, only peaks of the tetragonal phase of ZrO2 are observed in the Raman spectra of the indentation center after annealing, indicating that the phase transformation in this area has been completed. At the same time, peaks of the monoclinic phase were recorded on spectra obtained far from the indentation mark. After annealing, the intensity of the tetragonal phase also increased in the spectra recorded outside the indentation area, indicating that the tetragonal phase content increased not only in the stressed region but throughout the entire sample.
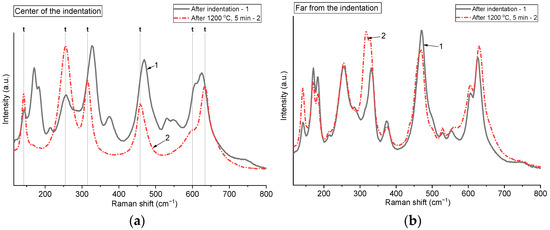
Figure 9.
Comparison of Raman spectra collected at the center of the indentation mark (a) and at a distant, undeformed region (b), before and after annealing at 1200 °C.
In Figure 10, changes in monoclinic phase content based on Raman spectroscopy, calculated using Equation (1) are presented. It is important to emphasize that these values do not represent true phase compositions but rather serve as relative parameters based on the intensity ratio of monoclinic and tetragonal peaks, used to illustrate the overall trend. It can be clearly seen that the monoclinic phase content in the center of the indentation changes substantially (by several tens of percent) after annealing, whereas the monoclinic content in regions far from indentation undergoes only minor changes.
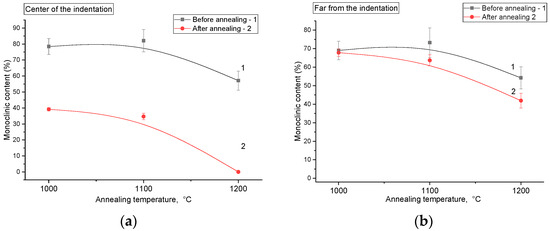
Figure 10.
Changes in the monoclinic phase content after annealing at different temperatures, evaluated at the center of the indentation (a) and in a distant undeformed region (b), based on Raman spectra and calculated using Equation (1).
It was also important to track the phase composition not only in the surface layer but also at a certain depth in the samples. For this purpose, the X-ray diffraction method was used. Figure 11a,b shows XRD patterns and comparisons of the phase composition after annealing at different temperatures of Ce-doped ZrO2 ceramics. The samples in all experiments contained tetragonal, monoclinic, and cubic phases. Interestingly, after annealing at 1000 °C, the proportion of the tetragonal phase in the samples decreased from 56% to 22%, while the proportion of the monoclinic phase increased from 38% to 74%. At the same time, with an increase in annealing temperature, the proportion of the tetragonal phase increased from 22% to 62%. However, it should be noted that although the proportion of the tetragonal phase increased overall with increasing annealing temperature, Raman spectroscopy showed the most pronounced difference before/after annealing precisely in the center of the indentation mark, suggesting that the stresses created in the sample can have a significant effect on recrystallization processes in samples during repeated heat treatments after sintering. According to XRD analysis, only annealing at 1200 °C resulted in an increase in the tetragonal phase content, while annealing at 1000 °C and 1100 °C led to an increase in the monoclinic phase fraction. This can be explained as follows: after polishing, a monoclinic surface layer formed on the samples. During subsequent annealing, this monoclinic layer may continue to grow, leading to an overall increase in monoclinic phase content. At 1000–1100 °C, the surface is free to transform further to the monoclinic due to the absence of constraints, and the monoclinic phase is thermodynamically stable at these temperatures. This could result in a higher monoclinic fraction (mostly near the surface) after annealing. This observation is consistent with the XRD results, which indicated an increase in monoclinic content, while Raman spectroscopy (sensitive primarily to the thin surface layer) showed minimal change, likely because the monoclinic phase was already present on the polished surface prior to annealing. As for annealing at 1200 °C, in pure ZrO2 the monoclinic phase transforms to the tetragonal phase at around 1170 °C. Therefore, in this case, the transformation barrier was achieved, and the fraction of the tetragonal phase increased.
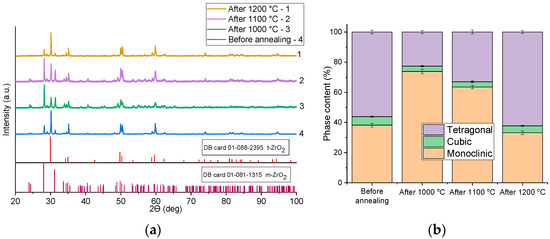
Figure 11.
X-ray diffraction patterns (a) and corresponding phase compositions (b) of samples annealed at different temperatures.
The obtained results suggest that residual stresses induced after applying mechanical stress to the sample can stimulate a phase transition from the monoclinic phase to the tetragonal phase during annealing. This corresponds to an earlier finding that discovered that residual compressive strain in zirconia suppresses tetragonal to monoclinic transformation. In their study, the authors created compressive stress in a layer through As+ bombardment, which opposed the lattice expansion required for the monoclinic phase formation, and this led to improved thermal stability [31]. Additional evidence that high compressive strain promotes the stability of the tetragonal phase and can even trigger a reverse transformation from monoclinic to tetragonal was provided in another study. Notably, the same study also demonstrated that regions exposed to tensile or shear stresses were more likely to undergo the conventional transformation from tetragonal to monoclinic [32].
4. Conclusions
This study investigated the strain-induced recrystallization processes of ceramics during repeated annealing of sintered ceramics at temperatures of 1000, 1100, and 1200 °C. In order to better track grain growth and microstructural changes, indentation marks were left on the surface of the samples. Such areas contain an increased number of defects and stresses, which makes them sensitive to heat treatment. Observing structural changes in these areas enables a more accurate assessment of the effect of temperature on recrystallization processes and grain growth in ceramics.
Based on the results of Raman spectroscopy, it can be concluded that the stresses generated by the indenter stimulated the monoclinic-to-tetragonal phase transformation during annealing. This effect was most pronounced in the highly strained indentation centers, while areas further from the indent remained largely unaffected. These findings highlight the important role of residual mechanical stress in facilitating phase transformations during thermal treatment and demonstrate the usefulness of indentation as a localized probe for studying recrystallization processes in zirconia-based ceramics.
Author Contributions
Conceptualization, N.O.V. and R.I.S.; methodology, N.O.V.; validation, N.O.V.; formal analysis, N.O.V.; investigation, N.O.V. and R.I.S.; resources, R.I.S.; data curation, N.O.V.; writing—original draft preparation, N.O.V.; writing—review and editing, N.O.V. and R.I.S.; visualization, N.O.V.; supervision, R.I.S.; project administration, R.I.S.; funding acquisition, R.I.S. All authors have read and agreed to the published version of the manuscript.
Funding
This research was funded by the Science Committee of the Ministry of Education and Science of the Republic of Kazakhstan (No. BR21882390).
Data Availability Statement
The raw data supporting the conclusions of this article will be made available by the authors on request.
Conflicts of Interest
The authors declare no conflicts of interest.
References
- Medveď, D.; Andrejovská, J.; Puchý, V. Mechanical and Tribological Properties of SPS-Sintered Y-TZP: The Effect of Sintering Temperature. Crystals 2025, 15, 593. [Google Scholar] [CrossRef]
- Yeasmin, N.; Pilli, J.; McWilliams, J.; Norris, S.; Bhattacharjee, A. Tannic Acid-Loaded Antibacterial Hydroxyapatite-Zirconia Composite for Dental Applications. Crystals 2025, 15, 396. [Google Scholar] [CrossRef]
- Will, P.; Michel, B. Transformation Toughening Fatigue Crack Growth. Phys. Status Solidi A 1987, 99, K79–K82. [Google Scholar] [CrossRef]
- Marshall, D.B.; Shaw, M.C.; Dauskardt, R.H.; Ritchie, R.O.; Readey, M.J.; Heuer, A.H. Crack-Tip Transformation Zones in Toughened Zirconia. J. Am. Ceram. Soc. 1990, 73, 2659–2666. [Google Scholar] [CrossRef]
- Garanin, Y.; Shakirzyanov, R.; Borgekov, D.; Kozlovskiy, A.; Volodina, N.; Shlimas, D.; Zdorovets, M. Study of Morphology, Phase Composition, Optical Properties, and Thermal Stability of Hydrothermal Zirconium Dioxide Synthesized at Low Temperatures. Sci. Rep. 2024, 14, 29398. [Google Scholar] [CrossRef]
- Zhou, Z.; Zhao, Z.; He, J.; Shi, R. Pulsed Laser Polishing of Zirconia Ceramic Microcrack Generation Mechanism and Size Characterization Study. Crystals 2024, 14, 810. [Google Scholar] [CrossRef]
- Annamalai, V.E.; Sornakumar, T.; Gokularathnam, C.V.; Krishnamurthy, R. Transformations During Grinding of Ceria-Stabilized Tetragonal Zirconia Polycrystals. J. Am. Ceram. Soc. 1992, 75, 2559–2564. [Google Scholar] [CrossRef]
- Ramos, G.F.; Pereira, G.K.R.; Amaral, M.; Valandro, L.F.; Bottino, M.A. Effect of Grinding and Heat Treatment on the Mechanical Behavior of Zirconia Ceramic. Braz. Oral Res. 2015, 30, e12. [Google Scholar] [CrossRef]
- Lee, J.Y.; Jang, G.W.; Park, I.I.; Heo, Y.R.; Son, M.K. The Effects of Surface Grinding and Polishing on the Phase Transformation and Flexural Strength of Zirconia. J. Adv. Prosthodont. 2019, 11, 1–6. [Google Scholar] [CrossRef]
- Pantea, M.; Ciocan, L.T.; Vasilescu, V.G.; Voicu, G.; Nicoară, A.-I.; Miculescu, F.; Ciocoiu, R.; Țâncu, A.M.C.; Banu, E.G.; Imre, M. Effects of Different Surface Treatments and Accelerated Aging on Dental Zirconia—An In Vitro Study. J. Funct. Biomater. 2025, 16, 263. [Google Scholar] [CrossRef]
- Frangulyan, T.S.; Vasil’ev, I.P.; Ghyngazov, S.A. Effect of Grinding and Subsequent Thermal Annealing on Phase Composition of Subsurface Layers of Zirconia Ceramics. Ceram. Int. 2018, 44, 2501–2503. [Google Scholar] [CrossRef]
- Kailer, A.; Nickel, K.G.; Gogotsi, Y.G. Raman Microspectroscopy of Nanocrystalline and Amorphous Phases in Hardness Indentations. J. Raman Spectrosc. 1999, 30, 939–946. [Google Scholar] [CrossRef]
- Orlovskaya, N.; Steinmetz, D.; Yarmolenko, S.; Pai, D.; Sankar, J.; Goodenough, J. Detection of Temperature- and Stress-Induced Modifications of LaCoO3 by Micro-Raman Spectroscopy. Phys. Rev. B Condens. Matter Mater. Phys. 2005, 72, 014122. [Google Scholar] [CrossRef]
- Jannotti, P.; Subhash, G.; Zheng, J.; Halls, V. Measurement of Microscale Residual Stresses in Multi-Phase Ceramic Composites Using Raman Spectroscopy. Acta Mater. 2017, 129, 482–491. [Google Scholar] [CrossRef]
- Baudín, C.; Gurauskis, J.; Sánchez-Herencia, A.J.; Orera, V.M. Indentation Damage and Residual Stress Field in Alumina-Y2O3-Stabilized Zirconia Composites. J. Am. Ceram. Soc. 2009, 92, 152–160. [Google Scholar] [CrossRef]
- Gogotsi, G.A.; Lomonova, E.E. A Micro-Raman Study of Phase Transformations of Zirconia Crystals upon Introduction of a Vickers Indentor. Refract. Ind. Ceram. 2000, 41, 191–195. [Google Scholar] [CrossRef]
- Paul, A.; Vaidhyanathan, B.; Binner, J. Micro-Raman Spectroscopy of Indentation Induced Phase Transformation in Nanozirconia Ceramics. Adv. Appl. Ceram. 2011, 110, 114–119. [Google Scholar] [CrossRef]
- Jing, Q.; Sun, J.; Zhang, F.; Lei, L.; Zhang, J. Residual Stress Distributions around Indentations and Crack in 3Y-TZP Ceramics Measured Using Piezo Spectroscopy. Ceram. Int. 2023, 49, 28256–28266. [Google Scholar] [CrossRef]
- Jiang, W.; Cheng, X.; Xiong, Z.; Cai, H.; Zhang, J. Static Recrystallization of Transparent Polycrystalline Yttrium Aluminum Garnet (YAG). Scr. Mater. 2019, 173, 37–40. [Google Scholar] [CrossRef]
- Lyu, G.; Zhai, S.; Zhao, X.; Pan, W. Strain Induced Recrystallization in Lanthanum Zirconate Ceramic. Materialia 2024, 33, 102036. [Google Scholar] [CrossRef]
- Wei, H.; Li, Y.; Sun, Y.; Li, K.; Zhang, X.; Song, F.; Bao, Y.; Wan, D. Study of the Influence of Stress Distribution and Evolution on the Mechanical Properties of Prestressed Ceramics Using In-Situ Raman Spectroscopy. Ceram. Int. 2025, 51, 16073–16080. [Google Scholar] [CrossRef]
- Shakirzyanov, R.I.; Volodina, N.O.; Kozlovskiy, A.L.; Zdorovets, M.V.; Shlimas, D.I.; Borgekov, D.B.; Garanin, Y.A. Study of the Structural, Electrical, and Mechanical Properties and Morphological Features of Y-Doped CeO2 Ceramics with Porous Structure. J. Compos. Sci. 2023, 7, 411. [Google Scholar] [CrossRef]
- Fabris, D.C.N.; Polla, M.B.; Acordi, J.; Luza, A.L.; Bernardin, A.M.; De Noni, A.; Montedo, O.R.K. Effect of MgO·Al2O3·SiO2 Glass-Ceramic as Sintering Aid on Properties of Alumina Armors. Mater. Sci. Eng. A 2020, 781, 139237. [Google Scholar] [CrossRef]
- Schröder, C.; Renz, A.; Koplin, C.; Kailer, A. Assessment of Low-Temperature Degradation of Y-TZP Ceramics Based on Raman-Spectroscopic Analysis and Hardness Indentation. J. Eur. Ceram. Soc. 2014, 34, 4311–4319. [Google Scholar] [CrossRef]
- Materano, M.; Reinig, P.; Kersch, A.; Popov, M.; Deluca, M.; Mikolajick, T.; Boettger, U.; Schroeder, U. Raman Spectroscopy as a Key Method to Distinguish the Ferroelectric Orthorhombic Phase in Thin ZrO2-Based Films. Phys. Status Solidi RRL Rapid Res. Lett. 2022, 16, 2100589. [Google Scholar] [CrossRef]
- Sakfali, J.; Ben Chaabene, S.; Akkari, R.; Dappozze, F.; Berhault, G.; Guillard, C.; Saïd Zina, M. High Photocatalytic Activity of Aerogel Tetragonal and Monoclinic ZrO2 Samples. J. Photochem. Photobiol. A Chem. 2022, 430, 113970. [Google Scholar] [CrossRef]
- Nai, X.; Wang, P.; Zhao, S.; Chen, H.; Wang, P.; Song, X.; Vairis, A.; Li, W. Unveiling Solid-State Transformation Toughening Mechanism of Yttria Stabilized Zirconia on Brazed Joint by In-Situ Observation. J. Manuf. Process. 2024, 127, 211–217. [Google Scholar] [CrossRef]
- Abdulmajeed, A.; Sulaiman, T.A.; Abdulmajeed, A.A.; Närhi, T.O. Strength and Phase Transformation of Different Zirconia Types After Chairside Adjustment. J. Prosthet. Dent. 2022, 132, 455–463. [Google Scholar] [CrossRef] [PubMed]
- Garvie, R.C.; Hannink, R.H.; Pascoe, R.T. Ceramic Steel? Nature 1975, 258, 703–704. [Google Scholar] [CrossRef]
- Gupta, T.K.; Bechtold, J.H.; Kuznicki, R.C.; Cadoff, L.H.; Rossing, B.R. Stabilization of Tetragonal Phase in Polycrystalline Zirconia. J. Mater. Sci. 1977, 12, 2421–2426. [Google Scholar] [CrossRef]
- Duh, J.G.; Wu, Y.S. Residual Stress Effects and t → m Transformation in Ion-Implanted Yttria-Stabilized Zirconia. J. Mater. Sci. 1991, 26, 6522–6526. [Google Scholar] [CrossRef]
- Allahkarami, M.; Hanan, J.C. Mapping the Tetragonal to Monoclinic Phase Transformation in Zirconia Core Dental Crowns. Dent. Mater. 2011, 27, 1279–1284. [Google Scholar] [CrossRef] [PubMed]
Disclaimer/Publisher’s Note: The statements, opinions and data contained in all publications are solely those of the individual author(s) and contributor(s) and not of MDPI and/or the editor(s). MDPI and/or the editor(s) disclaim responsibility for any injury to people or property resulting from any ideas, methods, instructions or products referred to in the content. |
© 2025 by the authors. Licensee MDPI, Basel, Switzerland. This article is an open access article distributed under the terms and conditions of the Creative Commons Attribution (CC BY) license (https://creativecommons.org/licenses/by/4.0/).