Abstract
Diffusion stress in the anode of an automotive lithium-ion battery could cause volume changes, particle rupture, and detachment of the electrode, which may lead to the failure of anode materials. In order to investigate the mechanism of diffusion stress in the anode of the battery, this paper proposes an electrochemical–mechanical coupling model to simulate the stress and strain changes in the anode. And, SEM and X-ray diffraction are also carried out to examine the mechanism between diffusion stress and the damage to the anode microstructure. The results show that as the discharge C-rate increases, the intercalation and deintercalation of lithium ions in the anode become more active, leading to greater diffusion stress. This results in noticeable cracking in the anode material, with significant particle fragmentation, ultimately causing an increase in internal resistance.
1. Introduction
The cycle life of lithium-ion batteries has received increasing attention from researchers, owing to the expanding application domains of these batteries. Compared with the widely used supercapacitors in grid-connected systems [1], lithium-ion batteries exhibit significant advantages in terms of energy density, operating voltage, and cycle life. These advantages render lithium-ion batteries promising for wide application in the field of electric vehicles. Battery life degradation is not only an electrochemical process, but also involves mechanical issues [2,3]. A harsh external environment and the irrational design of the battery structure would cause electrode detachment, increased internal resistance, and overheating of the battery, thereby leading to safety problems. One of the main reasons for lithium-ion battery failure is the destruction and fracture of the internal microstructure of active particles caused by diffusion stress in the anode of the battery [4,5]. The charge/discharge process involves the continuous intercalation and deintercalation of lithium ions in the anode, accompanied by molar volume changes during lithiation and delithiation. This leads to uneven lithium-ion concentration distribution in the anode, causing repetitive shrinkage and expansion of the material. This electrochemical–mechanical coupling effect generates diffusion stress, which directly causes the mechanical failure of anode materials [6,7].
In addition, during longer cycling time, the diffusion stress within the anode could also affect the lithium-ion diffusion process, resulting in the continuous loss of battery capacity. There are three main reasons for the stress generation in lithium-ion battery electrode particles [8].
- (1)
- Diffusion stress generated by the de-embedding of external lithium ions: The embedding and de-embedding of lithium ions during charge and discharge could lead to the expansion of the particles, and the constraints from the inactive matrix and the current collector could generate stress.
- (2)
- Diffusion stress generated by the mutual contacts between particles: The interaction of the particles could generate stress, and the constraints between adjacent particles could generate stress on each other.
- (3)
- Diffusion stress generated by the concentration between the embedded lithium phase and the un-embedded lithium phase: There is a concentration gradient between the two phases, which could lead to strain misalignment and stress discontinuity.
Recently, many researchers have carried out studies on diffusion stress in lithium-ion batteries. Prussin [9] was inspired by the thermal stress research method and deduced the diffusion stress model. Zhang [10] found the influence of particle size and shape of anode on the diffusion stress. Guo [11] further investigated diffusion stresses in spherical and ellipsoidal anode particles of different sizes, and found that smaller particle sizes could help to reduce diffusion stress. Since the previous models neglected the inter-particle fracture problem, Wu B [12] developed a mechano-electrochemical model coupling the particle scale with the electrode scale. They investigated the stress generated by the interaction between electrodes, and found the fracture phenomenon of the binder near the electrochemically inactive region considering the abrupt change in lithium concentration at the amorphous interface, which leads to strong bulk strain inhomogeneity. Wu H [13] used a flexible S-shape function and a transition layer to characterize the stress state induced by the electrochemical reaction. They found that when the transition layer was small, the tangential compressive stress in the surface layer would change to tensile stress, and vice versa, and the tangential stress in the large transition layer was always compressive. Taking into account the complexity of crack expansion before electrode particle fragmentation, Klinsmann [14,15] used a phase field model to simulate the crack expansion within the anode’s active particles during embedding and de-embedding. They found that particle fragmentation occurred in one or more half-cycles, and the formation of the particle fragmentation was affected by the initial cracks. The threshold boundaries for crack propagation or breakage of different particle radii and initial crack lengths were also given.
The studies above analyzed the formation mechanism and influencing factors of diffusion stress, and simulated its effect on electrode particle damage. However, the correlation between diffusion stress and graphite microstructure failure remains unclear. Tensile stress promotes crack initiation and extension, and the tensile stress on the anode particle is maximum at the end of the charge and discharge process [16]. And, carbon layer exfoliation is closely related to capacity loss, and the real-time measurement of diffusion stress is difficult.
This paper proposed an electrochemical–mechanical coupling model to simulate the stress and strain changes in anode. Meanwhile, SEM and X-ray diffraction were also carried out to examine the mechanism between diffusion stress and the damage to the anode microstructure. The results could provide insights into the correlation between diffusion stress and anode structural loss and provide a theoretical reference for the design of high-capacity and high-durability lithium-ion battery electrodes.
2. Experimental Platform
In order to investigate the mechanical performance of the battery during continuous cycling, 200 cycles were performed at 0.5 C, 1 C, and 2 C. Panasonic offers a wide range of battery products from small button batteries to large power batteries. The Panasonic 18650 battery is widely used in the electric vehicle sector due to its high performance, wide operating temperature range, stable voltage, and high safety. Notably, renowned car manufacturers such as Tesla have chosen Panasonic 18650 lithium-ion batteries as their preferred power batteries. Six 18650 type cylindrical lithium-ion batteries manufactured by Panasonic were selected for testing the initial capacity in this experiment. The specific calibration steps are detailed in Table 1.

Table 1.
The steps of battery capacity calibration.
The charge/discharge capacity data for the 6 cells are presented in Table 2. And, it can be found that the capacity difference in the 6 cells is within 2%.
Table 2.
Battery charge and discharge capacity data.
The cathodes of these batteries are made of nickel–cobalt–aluminum ternary composite material, and the anodes are mainly made of carbon material, with their detailed main technical parameters listed in Table 3.
Table 3.
Main parameters of Panasonic 18650 lithium-ion batteries.
The experimental setup is demonstrated in Figure 1 and consists of the following major components:
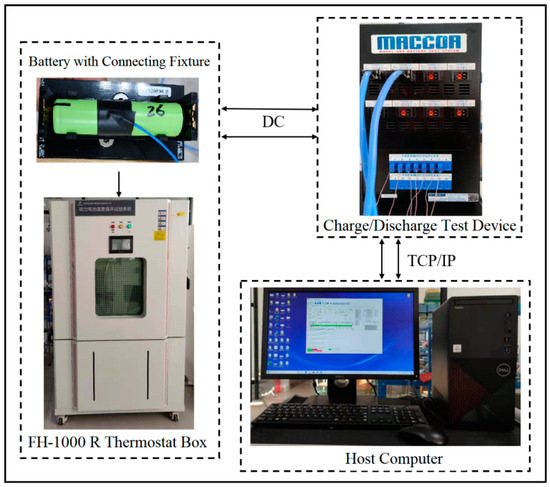
Figure 1.
Experimental platform establishment.
- (1)
- A host computer, equipped with software for designing the experimental process and allowing the user to interact with the operation,
- (2)
- A charge/discharge test device, which was responsible for implementing the charge and discharge processes of the batteries and recording the key parameters, while the test voltage range was ±5 V, with a voltage accuracy of ±0.02%. There were four current ranges for testing, including 5 A, 150 mA, 5 mA, and 150 μA. The fastest data acquisition time achieved could be as small as 1 ms.
- (3)
- A thermostat box, which was used to maintain a stable ambient temperature of 25 °C.
- (4)
- A battery connecting fixture, which was used for connecting the 18,650 lithium-ion batteries to the test system.
The Hybrid Pulse Power Characterization (HPPC) test (Figure 2) was adopted to obtain the discharge resistance under different States of Charge (SOCs) by establishing the relationship between the response voltage and current.
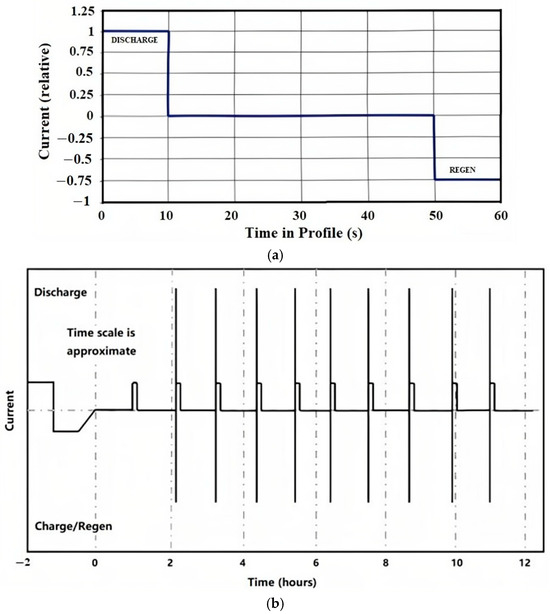
Figure 2.
HPPC test. (a) HPPC test profile; (b) complete HPPC sequence.
The specific testing process is as follows:
- (a)
- Charge the battery fully according to the manufacturer’s recommendations.
- (b)
- Allow it to rest for 1 h.
- (c)
- Conduct a constant-current pulse test.
- (d)
- Discharge the battery by 10% of its SOC.
- (e)
- Allow it to rest for another 1 h.
- (f)
- Repeat steps (c) to (e) until the battery’s power is consumed by 90% (or within the maximum discharge range specified by the manufacturer).
3. Electrochemical–Mechanical Coupling Model
An electrochemical–mechanical coupling model was constructed to simulate the diffusion stress changes in the anode. In view of the coupling of the electrochemical and mechanical models, solid-phase material conservation and solid–liquid interface kinetic equations are involved. The electrochemical–mechanical coupling parameters are shown in Table 4.
Table 4.
The electrochemical–mechanical coupling parameters.
The conservation of matter of lithium ion in the electrode particles is
where cs is the solid-phase lithium-ion concentration, t is time, and J is the molar flux of lithium ions at the solid–liquid-phase junction of the electrode, with the boundary conditions of
where r is the particle radius, Ds is the solid-phase diffusion coefficient, j is the electrode volumetric current density, F is the Faraday constant, jr is the current density at the electrode surface, and ɑ is the specific surface area of the electrode-active particles, ɑ = 3εs/Rs, where εs is the solid-phase volume fraction and Rs is the particle radius.
The electrochemical modeling of the lithium-ion battery, which describes the electrochemical reaction at the solid–liquid-phase interface, can be characterized by the Butler–Volmer equation, expressed as
where i0 is the density of the exchange current, ɑa and ɑc are the negative and positive charge transfer coefficients, R is the gas constant, T is the temperature, and η is the overpotential.
Stress–strain solid-phase concentration relationship is described as follows:
where εij is the strain component; i and j are two-dimensional directional indicators; E is the modulus of elasticity; σij is the stress component; Ω is the partial molar volume; δij is the Dirac δ function, with a value of 1 when i = j and 0 otherwise; and υ is the Poisson’s ratio.
For spherical particles, Equation (4) could be written in terms of two independent stress components, i.e., radial stress and tangential stress, which can be expressed as
where εr is the strain in the radial direction, and εθ is the strain in the tangential direction.
For elastic deformation, the strain versus displacement of a spherical particle is given by , , where is the radial displacement due to stress and r is the radius. Neglecting the effect of external force, the equilibrium equation of stress in the particle is
The radial stress is 0 when the surface of the particle is not subjected to external forces. At the same time, the stress at the center of the particle is finite, which leads to
where cav(r) is expressed as the average concentration of active particles, and as r tends to 0, cav(r) tends to cs(0), which leads to
Equation (8) shows that the state of stress in the center of the sphere is hydrostatic pressure and the hydrostatic stress is
The chemical potential gradient is the main driver of lithium ions’ motion, then the molar flux of lithium ions at the solid–liquid junction J is
where μ is the chemical potential, μ0 is a constant, υ is the lithium ions’ diffusion rate, and M is the lithium ions’ mobility. Then
where Ds = MRT is the solid-phase diffusion coefficient.
4. Results and Discussion
4.1. Model Validation
In the COMSOL Multiphysics 6.1 platform, we constructed an electrochemical force coupling model and developed a one-dimensional model to incorporate a grid sequence. For this model, the sequence is selected to control the physical field, and the grid cell size is chosen to be ultra-detailed. The specific simulation process is as follows: the global definition → creation of the geometry → add materials → multi-physics field coupling → grid division → add the study → result analysis.
The charge and discharge curves represent the external manifestations of the ratio between the anode and cathode working intervals, as well as the electrochemical reactions and polarization phenomena occurring within the battery. Furthermore, based on the coupling relationship inherent in the electrochemical–mechanical model, it is recognized that diffusion stress interacts with the solid-phase lithium-ion concentration gradient and lithium-ion flux, collectively influencing the discharge curves.
Given the challenges associated with measuring real-time diffusion stress, this study employed the discharge curve to validate the accuracy of the electrochemical model and, consequently, achieved the objective of indirectly verifying the electrochemical–mechanical model. In this paper, the simulation curves for 0.5 C, 1 C, and 2 C discharges were compared with the experimental discharge curves, as depicted in Figure 3. Three fresh Panasonic 18650 batteries were discharged under the rates of 0.5 C, 1 C, and 2 C, respectively. Then, the three experimental discharge curves were compared with the discharge curves obtained from the simulation to verify the correctness of the electrochemical–mechanical model. The discharge curves are the external reflections of the ratio between the cathode and anode working intervals, electrochemical reactions, and polarization phenomena inside the battery. Meanwhile, according to the coupling relationship of the electrochemical–mechanical model, it is known that the diffusion stress interacts with the solid-phase lithium-ion concentration gradient and lithium-ion flux, which jointly affect the discharge curves. It is seen that the curves in Figure 3 exhibit a slight deviation during the discharge process; however, the trend of voltage variation over time remains consistent. Moreover, the agreement between the simulation and the experimental data is particularly good at the cut-off voltage. The result comparison between the numerical simulation and experiment shows that the data are in good agreement with a maximum voltage difference of 1.6%, indicating that the model possesses high accuracy.
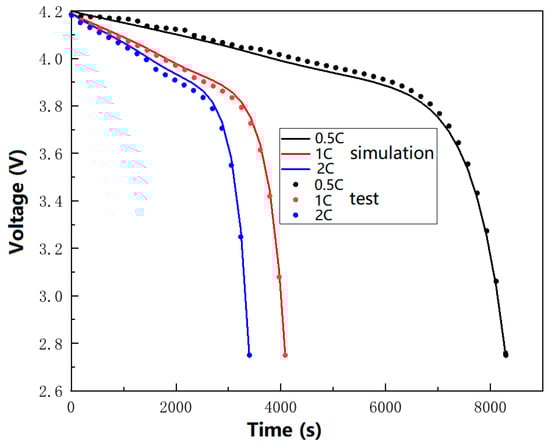
Figure 3.
The comparison of simulation and experimental curves for 1 C discharge.
4.2. Temporal and Spatial Distribution of Diffusion Stresses
Figure 4, Figure 5, Figure 6 and Figure 7 show the temporal and spatial distributions of the tangential component of diffusion stress, radial component, Von Mises stress, and lithium-ion concentration during 1 C discharge, respectively. In the temporal distribution analysis, the tangential component, radial component, and Von Mises stress of the diffusion stresses increase as the discharge progresses, ultimately reaching their maximum values at the end of the discharge process.
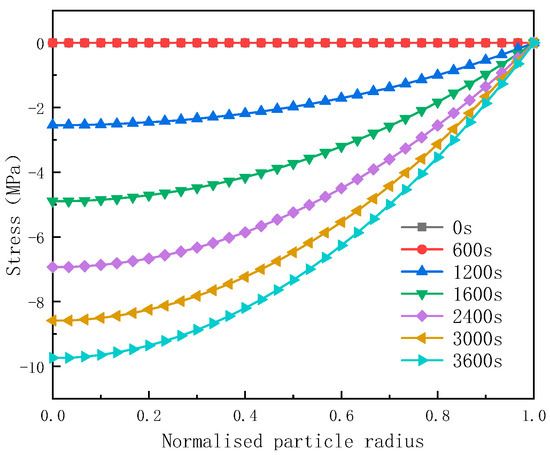
Figure 4.
The radial component of the diffusion stress.
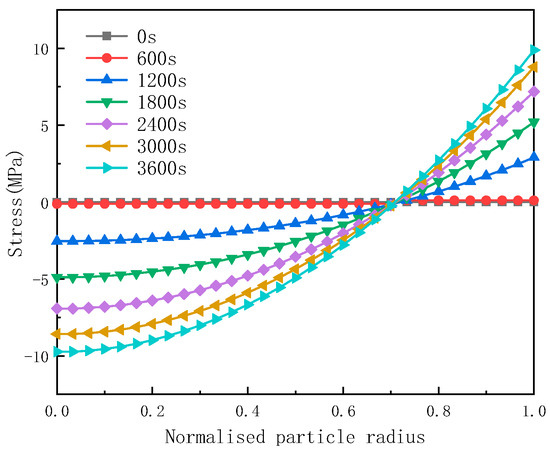
Figure 5.
The tangential component of the diffusion stress.
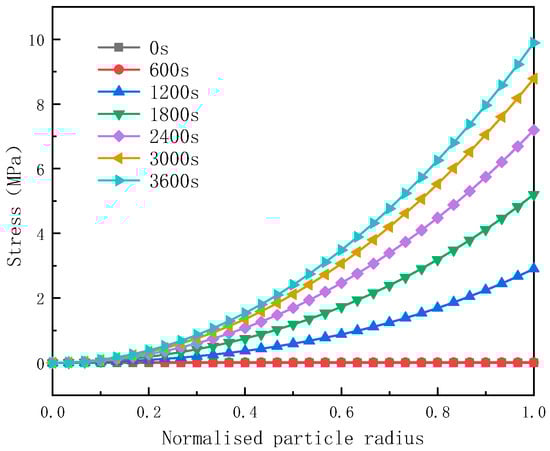
Figure 6.
The Von Mises stress distribution within the particles.
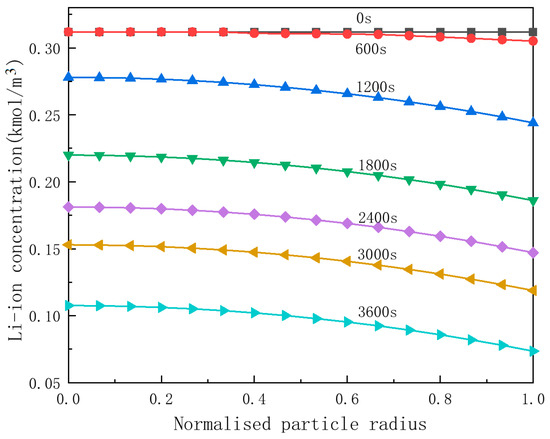
Figure 7.
Lithium-ion concentration in the anode particle.
Regarding the spatial distribution, Figure 4 illustrates that the radial component of the diffusion stress exhibits compressive characteristics during the discharge process. Furthermore, the absolute value of this stress decreases gradually along the radial direction, reaching zero at the surface of the particles.
Figure 5 demonstrates that during the discharge process, the tangential component of the diffusion stress is compressive at the center of the particles. As the radial radius increases, the absolute value of this stress decreases. Notably, the tangential component of the diffusion stress achieves its maximum value in the form of Von Mises stress at the end of the discharge process. Along the radial direction, the tangential component of the diffusion stress transitions from compressive to tensile, reaching its peak magnitude at the surface of the particles.
Figure 6 illustrates the Von Mises stress distribution within the particles. It is evident from the figure that the Von Mises stress at the center of the particles remains zero at any moment during the discharge process. Additionally, at any moment of the discharge and at any position within the particles, the stress increases from the center towards the surface, reaching its maximum value at the particle surface. The Von Mises stress represents the equivalent stress acting on the particles of the active material, commonly used to assess whether the material under test initiates plastic deformation. Furthermore, this equivalent force on the active material particles aids in analyzing the onset of plastic deformation. The stress distribution indicates that the diffusion stress is highest at the surface of the active particles, rendering this region most susceptible to fracture.
As observed in Figure 7, the difference in lithium-ion concentration between the center and the surface of the anode particles progressively increases during the discharge process. In the static phase of the battery, prior to 600 s of discharge, the changes in lithium-ion concentration are minimal. As the active particles continue to undergo volumetric contraction with ongoing discharge, lithium ions are continuously detached from anode active material, resulting in a further augmentation of the lithium-ion concentration gradient within the particles.
4.3. Diffusion Stresses at Different Discharge Rates
Figure 8 illustrates the distribution of diffusion stress within the local particles of the anode at the end of discharge across various discharge rates. And, it can be observed from Figure 8 that both the tangential and radial stresses of the particles increase with an increase in the discharge rate.
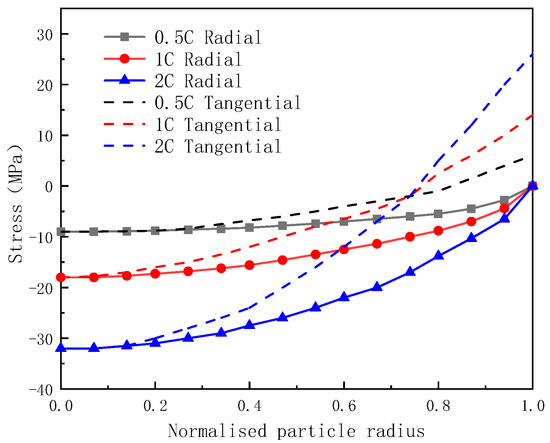
Figure 8.
The distribution of tangential and radial diffusion stress at different discharge rates.
Figure 9 demonstrates that as the discharge rate increases, particularly when the battery operates at 2 C, the Von Mises stress attains a value of 28 MPa, which is approximately two times bigger than at 1 C and three times bigger than at 0.5 C. This trend aligns with the findings reported in the literature [17]. According to the study, the tensile strength of graphite material is approximately 30 MPa, and the Von Mises stress at the particle edge at a 2 C discharge rate is very close to this value. If the discharge rate exceeds 2 C, the stress at the edge of the graphite material would exceed its tensile strength, indicating a higher possibility of failure such as microcracking or fracture. However, while the diffusion stress at 1 C is significantly lower than the tensile strength, after numerous cycles, the diffusion stress of the graphite could fall below 30 MPa. Therefore, both high-magnitude discharge and repeated cyclic charge and discharge are mechanisms that contribute to structural damage in the material.
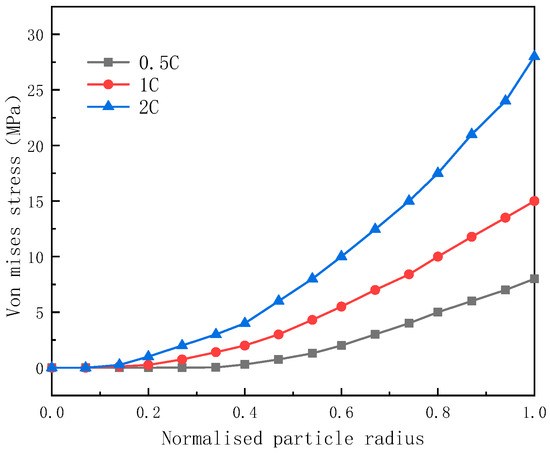
Figure 9.
The distribution of Von Mises diffusion stresses at different discharge rates.
4.4. Internal Resistance Analysis
The internal resistance of a lithium-ion battery serves as a crucial metric for assessing its performance, as it indicates the extent to which the battery opposes the flow of current through it. Ideally, this resistance should be as minimal as possible.
Figure 10 demonstrates the change in ohmic internal resistance and polarization internal resistance with SOC before and after the 200 times charge/discharge cycling of the battery. It is clear that a big charge/discharge rate could bring big internal resistance to the battery. That is because the diffusion stress is enlarged by the increasing charge/discharge rate. Diffusion stress could change the microstructure of the anode materials, including the cracking, crushing, and pulverizing of active particles. These structural changes could affect the transport path of lithium ions and electrons, and thus increase the internal resistance of the electrode.
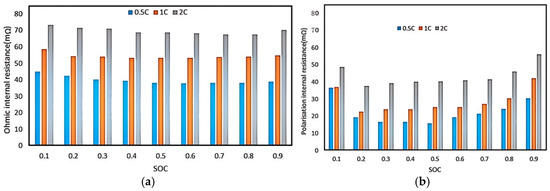
Figure 10.
Ohmic resistance and polarization resistance after 200 times cycling. (a) Ohmic internal resistance; (b) polarization internal resistance.
4.5. Mechanism of Diffusion Stress Inducing Anode’s Failure
SEM and X-ray diffraction experiments were conducted to examine the mechanism between diffusion stress and the damage to the anode microstructure.
Figure 11 shows the SEM results of the anodes. Four batteries including a fresh battery, and batteries after 100, 150, and 200 cycles were disassembled. Then, the respective microstructures of the anodes of the four batteries were observed under a scanning electron microscope. It can be seen that before the cycling of the fresh battery, the internal microstructure of the active material was closely arranged. With the number of cycles increasing, the microcracks in the anode particles became obvious. And, after 200 cycles of charge and discharge, cracks between particles became larger. The internal structure broke, and the active particles were crushed. The maximum Von Mises stress obtained from the simulation at 1 C rate during discharge was 15.12 MPa, while the tensile strength of graphite was about 30 MPa. The Von Mises stress did not reach the tensile strength, but the internal structure was fractured. It is because during the charge/discharge cycle, the tensile strength of graphite is reduced due to the diffusion stresses, which are dynamic loads for the anode, causing fatigue damage to the graphite. Subsequently, a reduction in the tensile strength of the graphite happens.
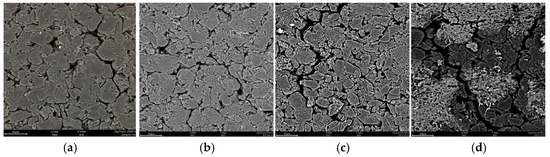
Figure 11.
SEM results of the anodes. (a) Fresh; (b) after 100 cycles; (c) after 150 cycles; (d) after 200 cycles.
It can be seen from Figure 12 that after 200 cycles, ɑ slightly decreases, c slightly decreases, and the d002 value slightly increases along with an increase in the graphite layer spacing.
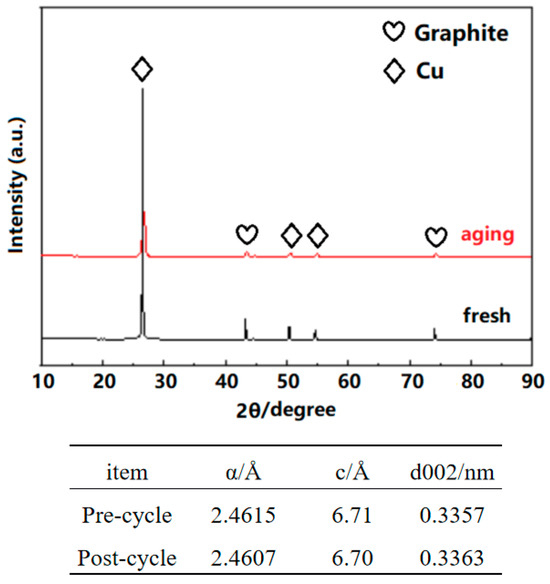
Figure 12.
XRD analysis results after cycling.
Table 5 shows the relationship between the increment of crystal surface spacing and diffusion stress. The increment of crystal surface spacing increases with the increase in Von Mises stress. After a long charge/discharge cycle, when the stress reaches about 11.96 MPa, the increment of the crystal surface spacing tends to be flat. With the increase in the C rate, the diffusion stress becomes bigger. When the stress reaches the tensile strength of the anode material, the particles undergo plastic deformation and enter the strengthening stage, and the resistance to plastic deformation increases. Then, the internal resistance of the battery increases, so as to induce capacity decay in the battery.
Table 5.
The relationship between the increment of crystal surface spacing and diffusion stress.
5. Concluding Remarks
This paper proposed an electrochemical–mechanical coupling modeling method to simulate the stress and strain changes in the anode of automotive lithium-ion batteries. The main conclusions are as follows:
- (1)
- As the battery is in the discharge process, the tangential radial stress and Von Mises stress component of the diffusion stress increase, peaking at the end of discharge. The radial stress component of the diffusion stress is compressive stress, and the absolute value decreases along the radial radius, and drops to 0 on the surface of the particles. The tangential component of diffusion stress is compressive stress at the center of the particles, and the absolute value decreases along the radial radius.
- (2)
- Both the tangential and radial stresses of the particles increase with an increase in the discharge rate. Particularly, when the battery operates at 2 C, the Von Mises stress attains a value of 28 MPa, indicating a higher possibility of failure such as microcracking or fracture in anode materials.
- (3)
- A big charge/discharge rate can bring big internal resistance to the battery. That is because the diffusion stress is enlarged by the increasing charge/discharge rate. Diffusion stress can change the microstructure of the anode materials, including the cracking, crushing, and pulverizing of active particles. These structural changes can affect the transport path of lithium ions and electrons, and thus increase the internal resistance of the electrode.
- (4)
- The bigger the discharge rate, the more severe the anode’s damage. The distance between anode layers increases after cycling, indicating that reducing the discharge rate can reduce the damage to anode. The anode graphite is de-embedded, and the diffusion stress makes the graphite particles rupture, thus increasing the internal resistance.
Hence, this study provides a way to further reveal the relationship between diffusion stress and anode graphite structure.
Author Contributions
Conceptualization and methodology, X.H.; software and formal analysis, K.Y.; validation and writing, J.C. All authors have read and agreed to the published version of the manuscript.
Funding
This research was funded by the State Key Laboratory of Mechanical System and Vibration grant number [MSV202512].
Data Availability Statement
The data presented in this study are available upon request from the corresponding author.
Conflicts of Interest
The authors declare no conflicts of interest.
References
- Benavides, D.; PArévalo, P.; Aguado, J.; Jurado, F. Experimental validation of a novel power smoothing method for on-grid photovoltaic systems using supercapacitors. Int. J. Electr. Power Energy Syst. 2023, 149, 109050. [Google Scholar] [CrossRef]
- Hendricks, C.; Williard, N.; Mathew, S.; Pecht, M. A failure modes, mechanisms, and effects analysis (FMMEA) of lithium-ion batteries. J. Power Sources 2015, 297, 113–120. [Google Scholar] [CrossRef]
- Xu, R.; Yang, Y.; Yin, F.; Liu, P.; Cloetens, P.; Liu, Y.; Lin, F.; Zhao, K. Heterogeneous damage in Li-ion batteries: Experimental analysis and theoretical modeling. J. Mech. Phys. Solids 2019, 129, 160–183. [Google Scholar] [CrossRef]
- Xu, R.; Zhao, K. Electrochemomechanics of electrodes in Li-ion batteries: A review. J. Electrochem. Energy Convers. Storage 2016, 13, 030803. [Google Scholar] [CrossRef]
- Zhang, S.; Zhao, K.; Zhu, T.; Li, J. Electrochemomechanical degradation of high-capacity battery electrode materials. Prog. Mater. Sci. 2017, 89, 479–521. [Google Scholar] [CrossRef]
- Wang, Y.; Li, H.; Wang, Z.; Li, Q.; Chen, L.; He, X. Progress on failure mechanism of lithium-ion battery caused by diffusion induced stress. J. Inorg. Mater. 2020, 35, 1071–1087. [Google Scholar]
- Ryu, H.; Namkoong, B.; Kim, J.; Belharouak, I.; Yoon, C.; Sun, Y. Capacity fading mechanisms in Ni-rich single-crystal NCM cathodes. ACS Energy Lett. 2021, 6, 2726–2734. [Google Scholar] [CrossRef]
- Mukhopadhyay, A.; Sheldon, B. Deformation and stress in electrode materials for Li-ion batteries. Prog. Mater. Sci. 2014, 63, 58–116. [Google Scholar] [CrossRef]
- Prussin, S. Generation and distribution of dislocations by solute diffusion. J. Appl. Phys. 1961, 32, 1876–1881. [Google Scholar] [CrossRef]
- Zhang, X.; Shyy, W.; Sastry, A. Numerical simulation of intercalation-induced stress in Li-ion battery electrode particles. J. Electrochem. Soc. 2007, 154, 910–916. [Google Scholar] [CrossRef]
- Guo, Z.; Ji, L.; Chen, L. Analytical solutions and numerical simulations of diffusion-induced stresses and concentration distributions in porous electrodes with particles of different size and shape. J. Mater. Sci. 2017, 52, 13606–13625. [Google Scholar] [CrossRef]
- Wu, B.; Lu, W. A battery model that fully couples mechanics and electrochemistry at both particle and electrode levels by incorporation of particle interaction. J. Power Sources 2017, 360, 360–372. [Google Scholar] [CrossRef]
- Wu, H.; Xie, Z.; Wang, Y.; Lu, C.; Ma, Z. Modeling diffusion-induced stress on two-phase lithiation in lithium-ion battery. Eur. J. Mech. A Solids 2018, 71, 320–325. [Google Scholar] [CrossRef]
- Klinsmann, M.; Rosato, D.; Kamlah, M.; Mcmeeking, R. Modeling crack growth during Li insertion in storage particles using a fracture phase field approach. J. Mech. Phys. Solids 2016, 92, 313–344. [Google Scholar] [CrossRef]
- Klinsmann, M.; Rosato, D.; Kamlah, M.; Mcmeeking, R. Modeling crack growth during Li extraction and insertion within the second half cycle. J. Power Sources 2016, 331, 32–42. [Google Scholar] [CrossRef]
- Wu, W.; Xiao, X.; Wang, M.; Huang, X. A microstructural resolved model for the stress analysis of lithium-ion batteries. J. Electrochem. Soc. 2014, 161, 803–813. [Google Scholar] [CrossRef]
- Wu, L.; Xiao, X.; Wen, Y.; Zhang, J. Three-dimensional finite element study on stress generation in synchrotron X-ray tomography reconstructed nickel-manganese-cobalt based half cell. J. Power Sources 2016, 336, 8–18. [Google Scholar] [CrossRef]
Disclaimer/Publisher’s Note: The statements, opinions and data contained in all publications are solely those of the individual author(s) and contributor(s) and not of MDPI and/or the editor(s). MDPI and/or the editor(s) disclaim responsibility for any injury to people or property resulting from any ideas, methods, instructions or products referred to in the content. |
© 2025 by the authors. Licensee MDPI, Basel, Switzerland. This article is an open access article distributed under the terms and conditions of the Creative Commons Attribution (CC BY) license (https://creativecommons.org/licenses/by/4.0/).