1. Introduction
Recent advances in smart wing skins, soft robots, and wearable devices have created a demand for large-range, highly sensitive multi-dimensional deformation and pressure sensing [
1,
2,
3]. Flexible sensors with stretching capabilities offer a crucial advantage over traditional rigid sensors in meeting these requirements. In-plane flexible sensors, featuring grid, wrinkle, and wave structures, provide better thickness and conformability than out-of-plane 3D structures like kirigami, spring, and sponge designs. This makes their film morphology ideal for these applications [
4,
5,
6]. Low-dimensional materials such as metal nanowires, graphene, and MXenes serve as the primary sensing materials chosen for their exceptional electrical conductivity and structural strength. In single-dimensional strain or pressure sensing, these flexible films respond through several mechanisms: the piezoresistive effect, geometric shape effect, nanomaterial disconnection effect, tunneling effect, and microscopic crack effect [
7,
8]. A single parameter may trigger multiple effects simultaneously, with different effects emerging across measurement stages, a complexity that increases with multi-dimensional parameter sensing. These flexible sensing films, being strongly coupled composites, also face operational challenges like baseline drift and hysteresis effects. The field currently lacks effective models to quantitatively describe these multi-dimensional sensing mechanisms and instabilities, making it difficult to optimize flexible sensor design.
Researchers have introduced numerical and computational models to address the complex sensing mechanisms and instability issues in flexible sensing films during multiparameter sensing. These models characterize both internal structural dynamics and external electrical properties. Numerical models focus on mathematical descriptions of conductive mechanisms at the microscopic level. For example, Wang et al. [
9] developed a tunneling effect model for TPU/CB conductive composites based on conductive paths and distance changes. Similarly, Li et al. [
10] analyzed TPU/CNTs sensing films’ microscopic mechanisms and created a tunneling effect theoretical model. In contrast, computational models describe conductive mechanisms from a macroscopic structural perspective. Zhao et al. [
11] created an equivalent circuit model for flexible strain sensors using network structure similarity principles, while Zhang et al. [
12] simulated sensing mechanisms through their innovative BoxLucas1 model for micro-crack phenomena. However, both types of models have limitations: they typically capture only single aspects of sensing mechanisms and struggle with full-range multi-parameter sensing descriptions. Additionally, research on flexible sensing instability remains largely qualitative, with few quantitative descriptive models available.
This paper presents a comprehensive investigation into the modeling of mechanisms and instability in multidimensional flexible sensing. The study begins with an in-depth analysis of microscopic mechanisms and macroscopic sensing characteristics in low-dimensional material-based sensitive films. A quantitative relationship between microscopic cracks and macroscopic electrical properties has been established through power spectrum analysis, enabling the calculation of electrical characteristics in flexible strain/pressure sensing. Furthermore, a detailed examination of factors contributing to flexible sensing instability has been conducted, leading to the development of dual-layer multi-channel flexible sensors. Through extensive simulation validation, this model has demonstrated its effectiveness in guiding the structural design of flexible sensing films, thereby providing a robust technical framework to enhance the stability of flexible sensors.
2. Strain Sensing Model of Low-Dimensional Materials Based on Crack Effect
Film-based flexible strain sensors detect tensile strain through the generation, propagation, and recovery of microcracks during the stretching process. As the tensile strain increases, the cracks in the film continuously expand, leading to progressive changes in the film’s electrical resistance. This phenomenon reflects both the microscopic morphology of the film and its electrical characteristics, establishing a direct correlation between these two aspects. As shown in
Figure 1, our research group’s published study [
13] demonstrates the relationship between the characteristic curves of flexible sensors and crack formation. Note that The relative resistance change (
) shows an exponential relationship with strain because the crack width increases nonlinearly at large strains. A linear relationship between resistance and strain can only be achieved by applying a logarithmic transformation to the curve [
13]. For researchers interested in replicating our work, we recommend referring to this paper to find the fabrication protocols and experimental procedures. Additionally, we have included a brief overview of the sensor fabrication process in the
Supplementary Materials Section for quick reference. Although the crack evolution process can be clearly observed from the images, the lack of quantitative indicators to describe the extent of crack propagation makes it challenging to establish a precise correspondence between crack propagation and electrical characteristic curves.
Commonly used characteristic parameters for describing cracks include crack density, crack width, and crack spacing. Crack density reflects the probability of crack occurrence on the film surface and is a scalar quantity, while crack width and spacing characterize the dimensional properties of cracks but are challenging to measure automatically. These characteristic parameters can only capture localized information from the sensing film’s crack images, which is insufficient to support comprehensive sensitivity mechanism analysis and modeling. Therefore, we can adopt the power spectrum method from image processing to conduct an in-depth analysis of the vector characteristics of cracks.
In the cross-section of crack images, by equating white cracks to signal 0 and black areas to signal 1, the crack images can be transformed into equivalent pulse signals for power spectrum analysis. The energy spectrum of cracks enables the analysis of energy distribution across the entire frequency domain, following methods similar to those used in random surface roughness energy spectrum analysis. The power spectral density (PSD) of surface morphology, which serves as the most crucial parameter for characterizing surface roughness distribution characteristics, can be expressed by the following:
where h(x) represents the roughness height function, q denotes the wave vector = 2
/L, L is the length, and ⟨...⟩ indicates the ensemble average. When ⟨h(x)⟩ = 0, it represents that the roughness surface is based on the horizontal plane.
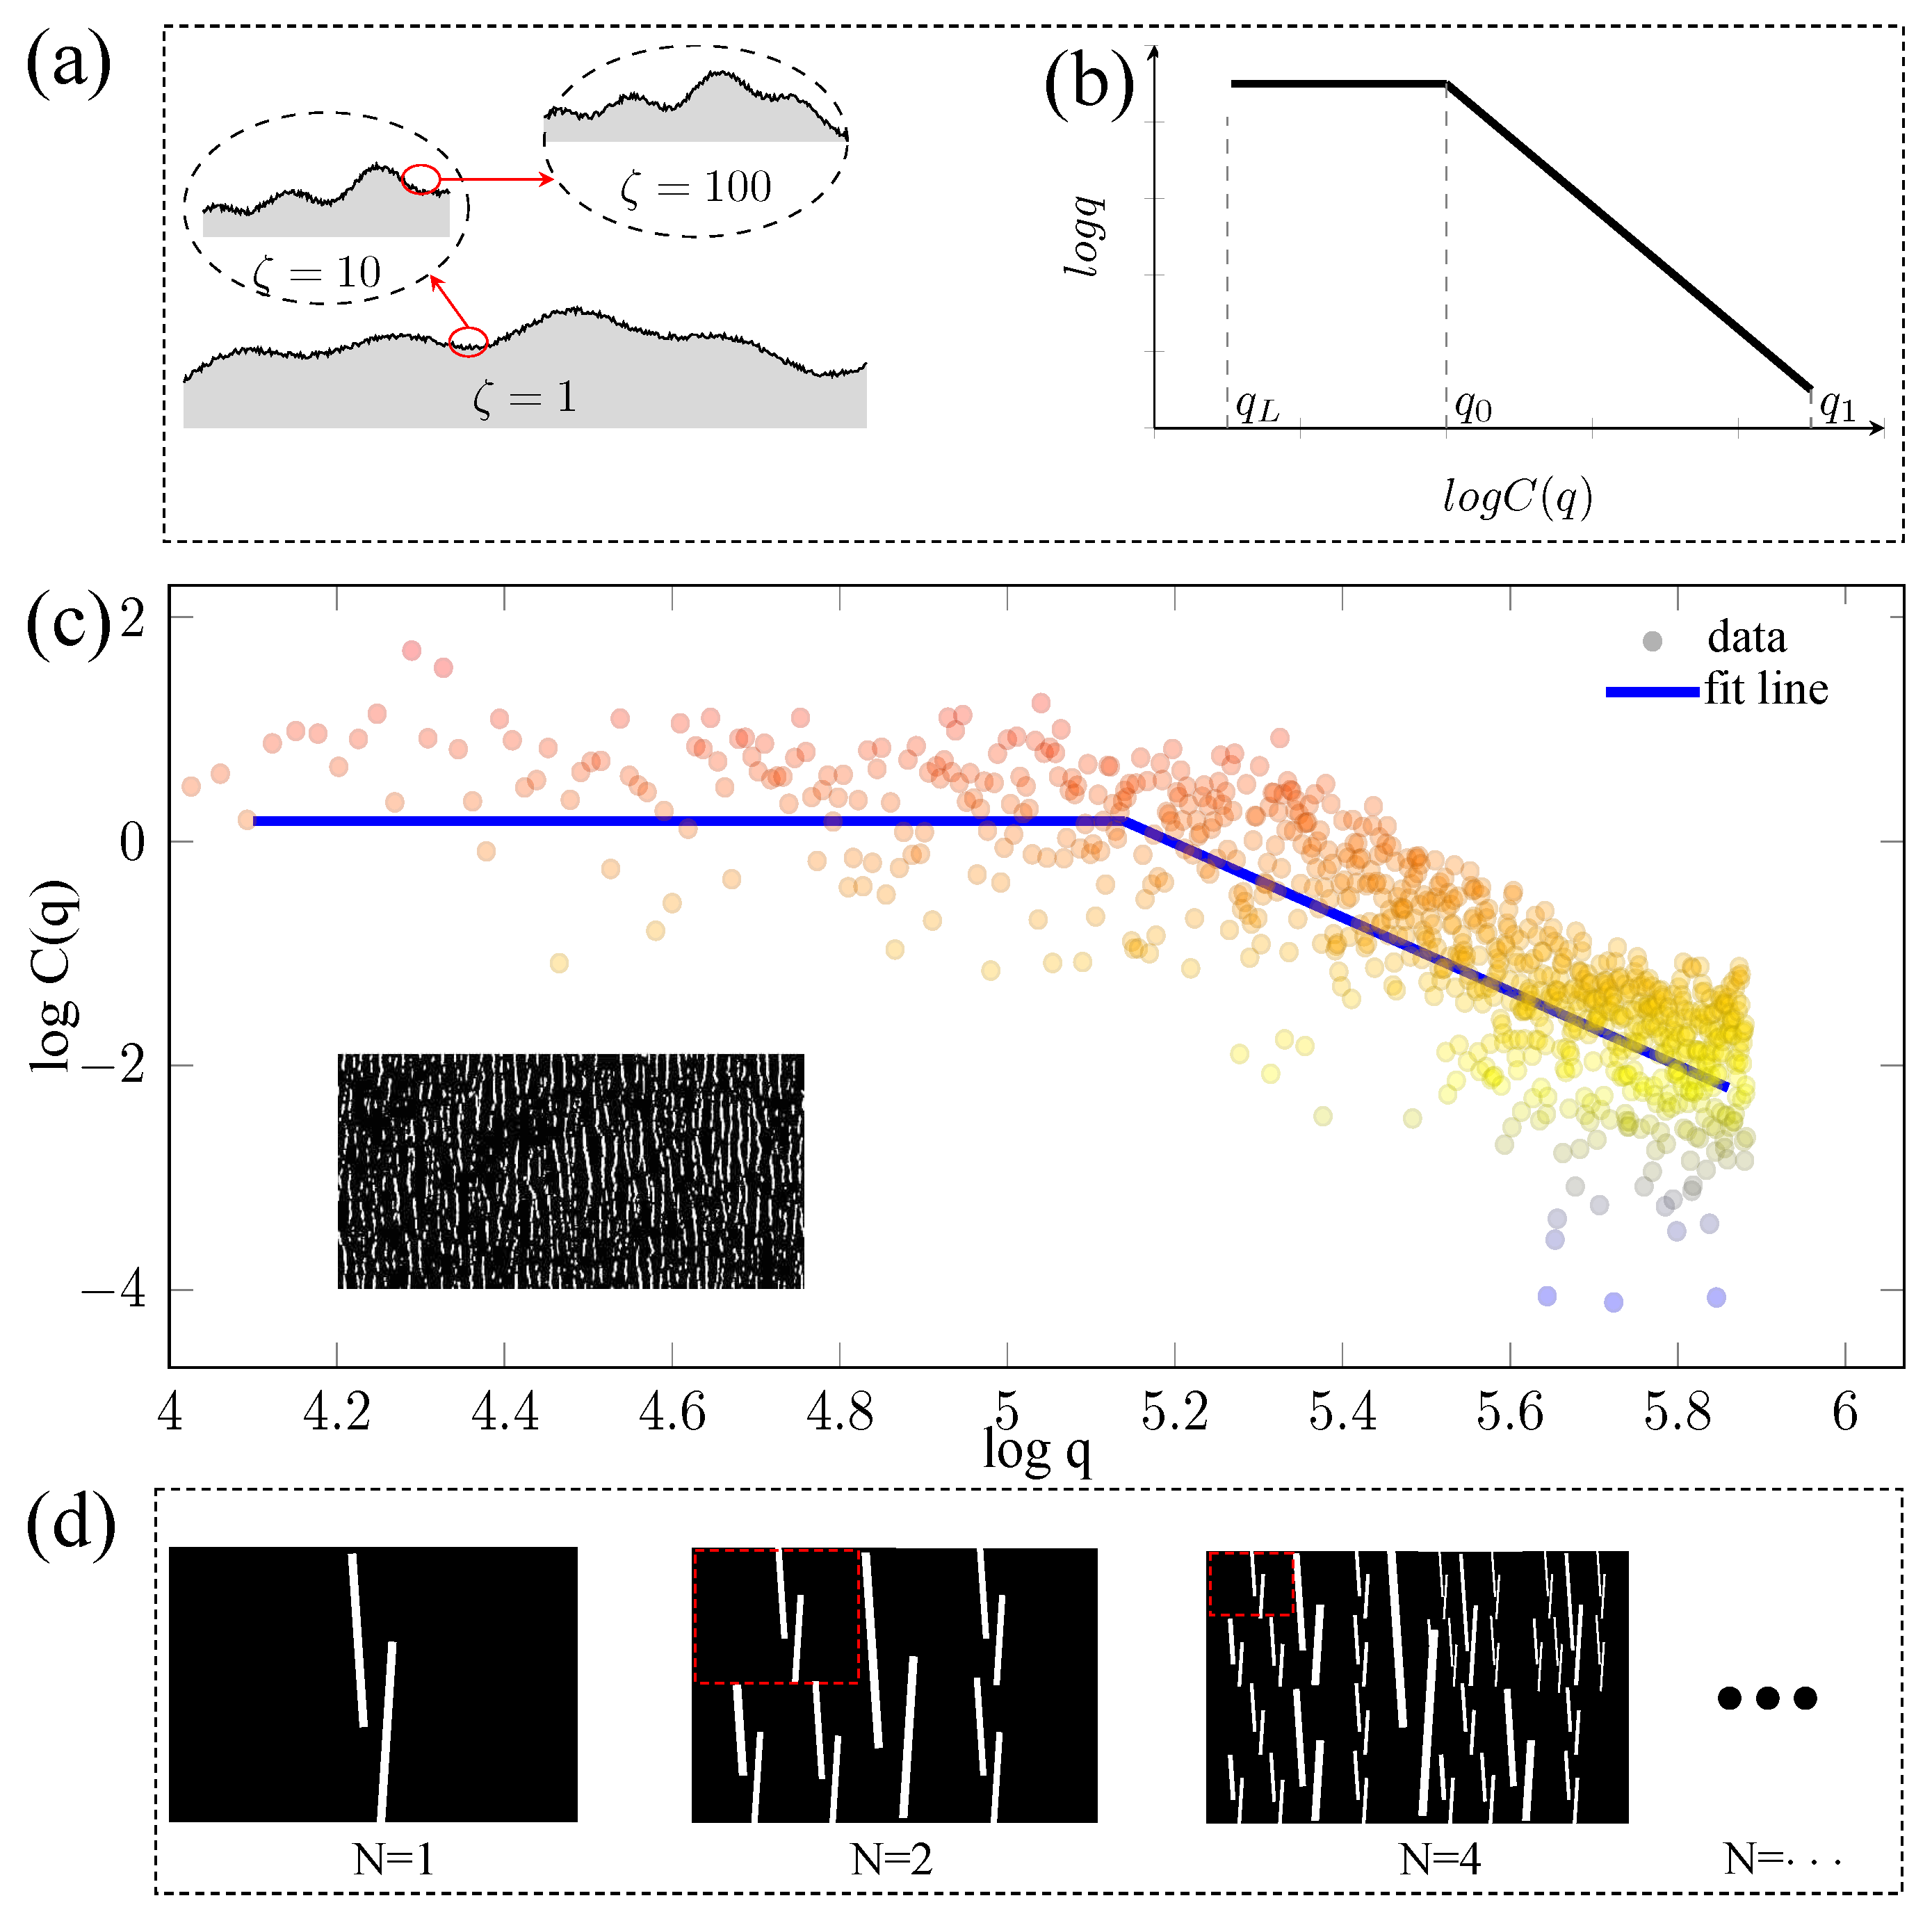
The aforementioned power spectrum essentially represents the Fourier transform of the autocorrelation function of the height function h(x). Typically, random rough surfaces exhibit self-fractal characteristics, as illustrated in
Figure 2a, showing random surface images at different magnification levels, where the surface morphology remains similar at any magnification. The power spectrum function C(q) of self-fractal surfaces has a specific relationship with the wave vector q, which can be expressed as follows [
14]:
where the exponent H and fractal dimension
are related by
= 3 − H.
It is important to note that fractal characteristics are not present at all magnification scales. As shown in
Figure 2b, the relationship between wave vector and power spectrum function in logarithmic coordinates exhibits fractal characteristics within the curve range where the slope is −2H + 1. Similarly, by setting the heights in crack images to 0 and 1 and analyzing the relationship between wave vector and power spectrum function of crack images as illustrated in
Figure 2c, it is demonstrated that the cracks in flexible sensing films also possess self-fractal characteristics, yielding a fractal dimension of Df = 2.5, which provides a solid foundation for modeling.
As shown in
Figure 2d, the self-fractal schematic of crack images demonstrates that as the fractal multiplication factor increases, the cracks progressively refine to the micron scale, effectively reflecting the strain-sensing mechanism of nanomaterials. The fractal circuit model means that the electrical pathway follows a repetitive pattern where each resistor component contains smaller-scale versions of the same circuit arrangement.
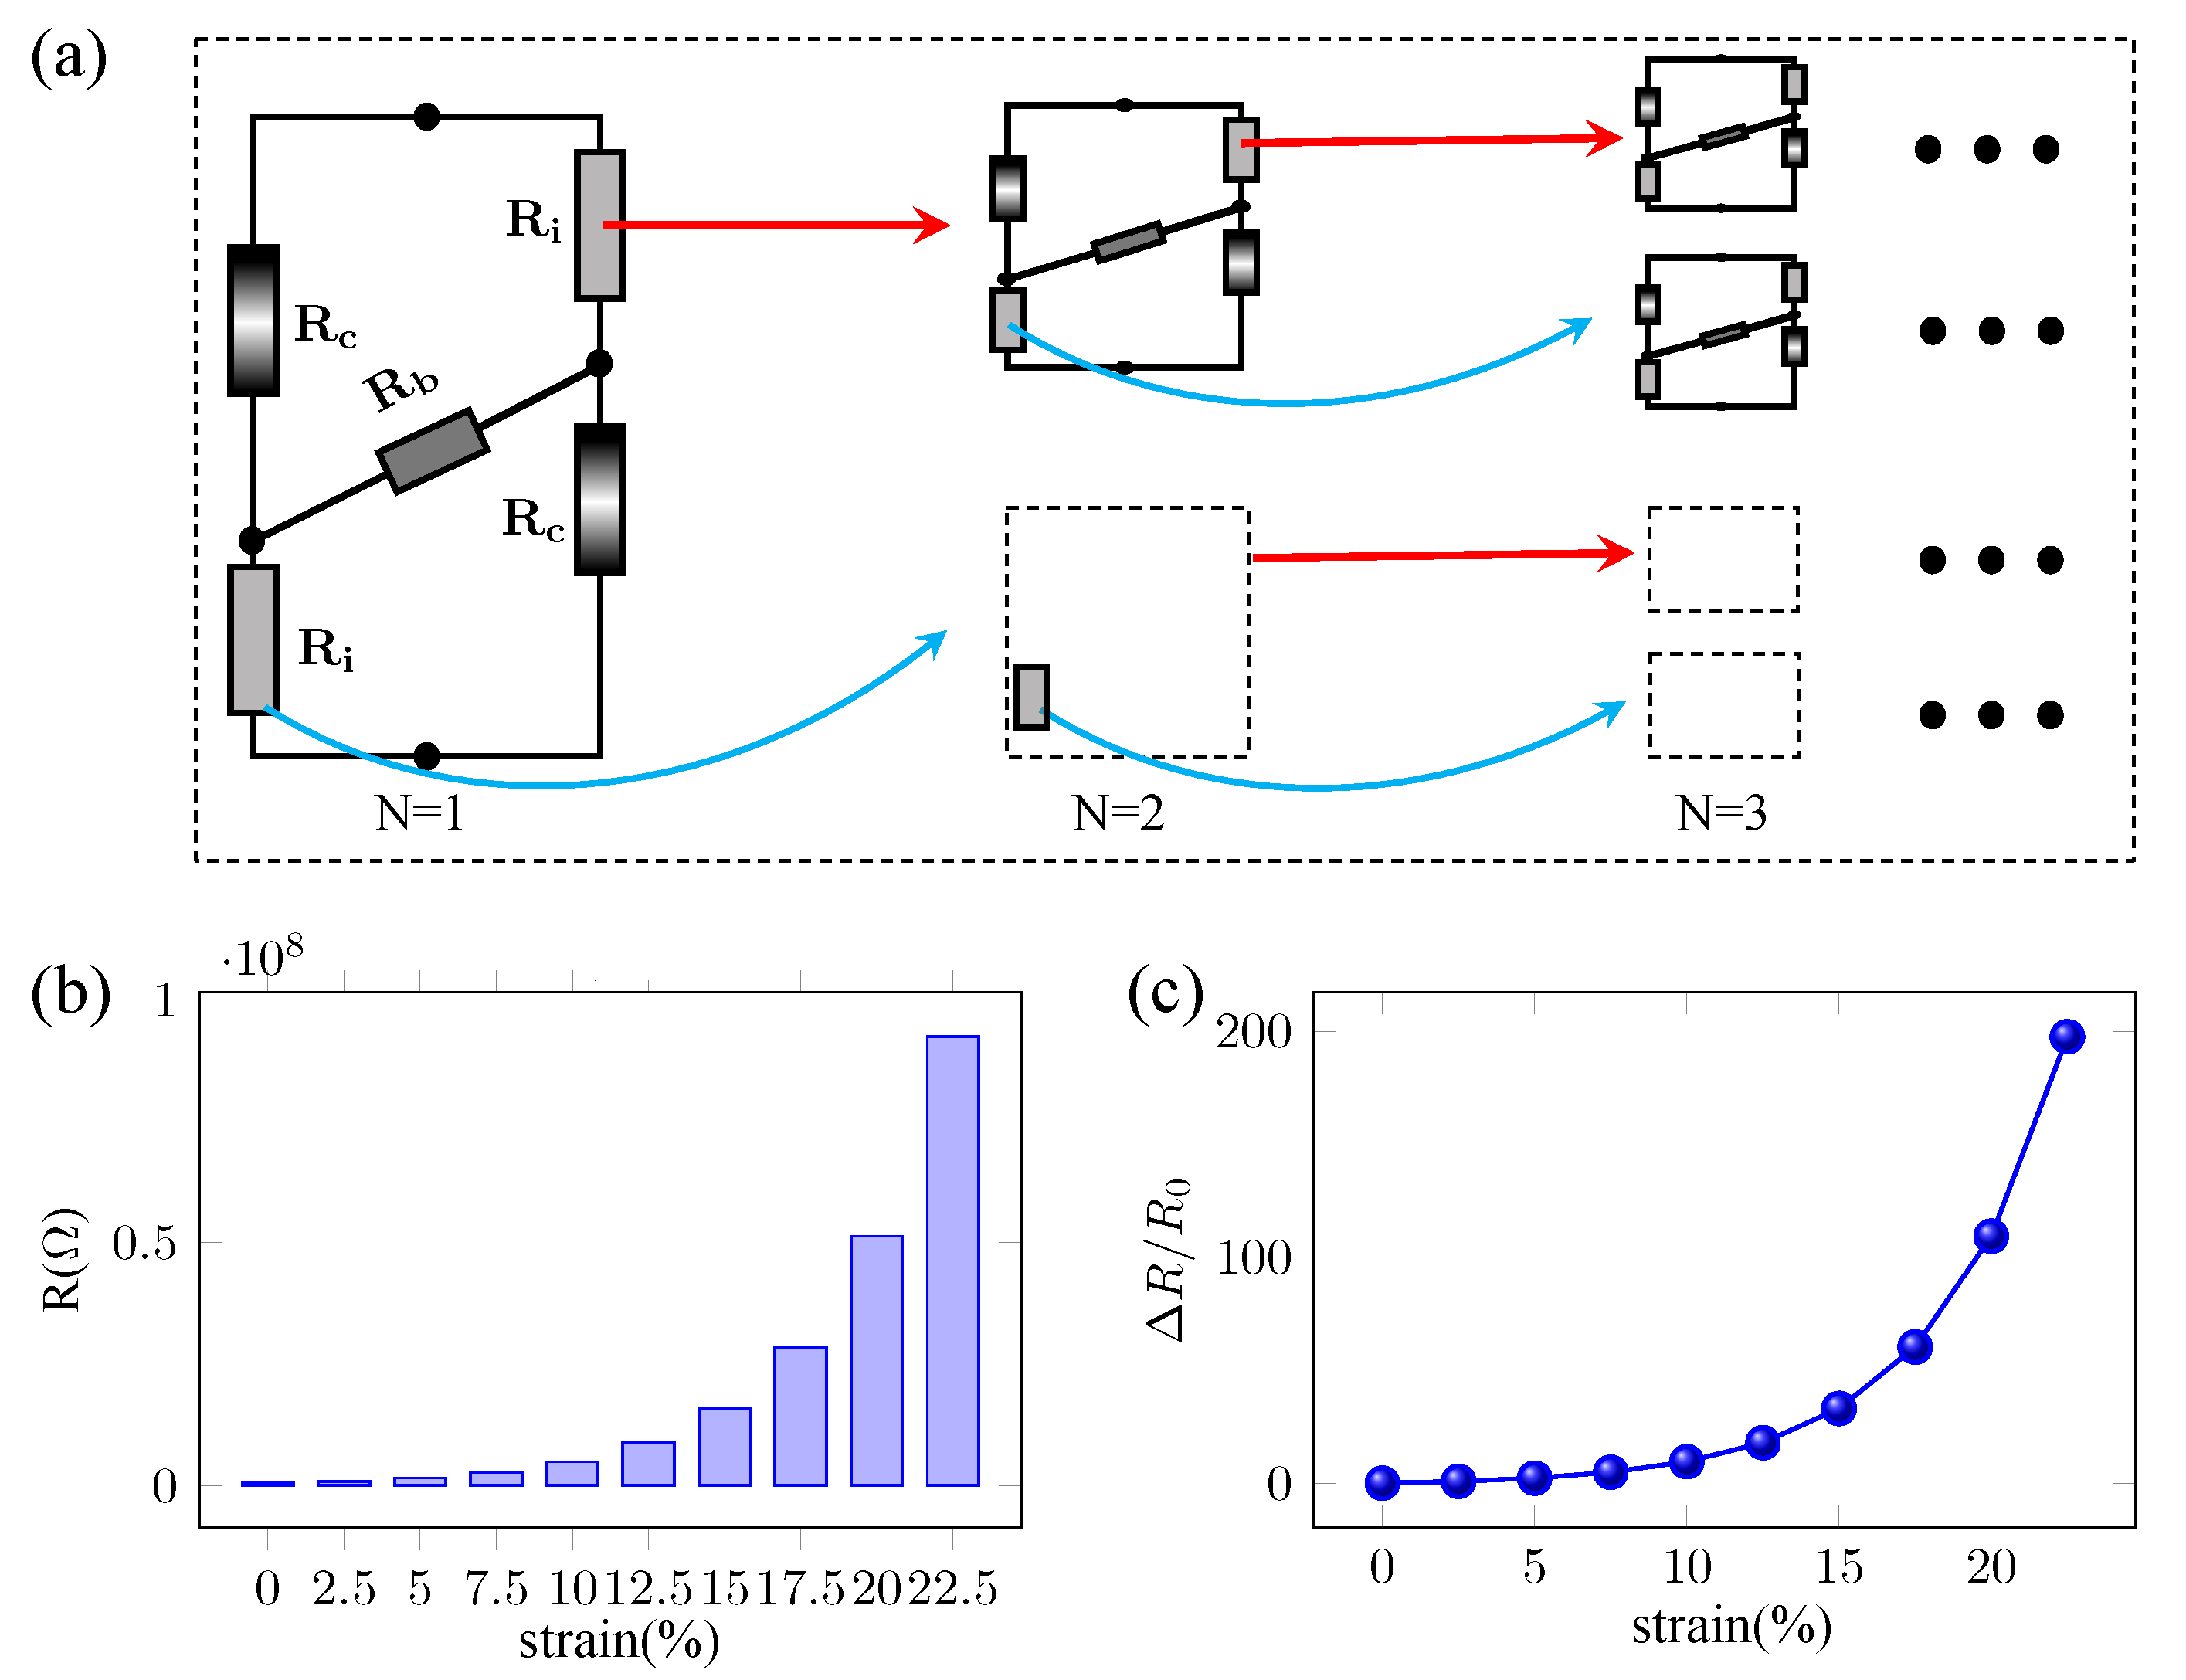
Figure 3a presents the equivalent circuit diagram based on crack images and its fractal process, achieving sensitive circuit calculations at the nanoscale through self-fractal iteration. The relationship between resistance and strain of flexible sensing film is calculated using a 40-layer recursive algorithm, which is shown in
Figure 3b,c, with resistance variation trends consistent with the experimental curves in
Figure 1. The details of the calculation process can be found in the
Supplementary Materials. This self-fractal circuit equivalent model not only accurately calculates macroscopic film resistance changes but also considers the electrical characteristics of microscopic nanomaterials, successfully establishing a flexible strain sensing mechanism model that conforms to physical properties.
3. Pressure Sensing Model of Low-Dimensional Materials Based on the Slip Effect
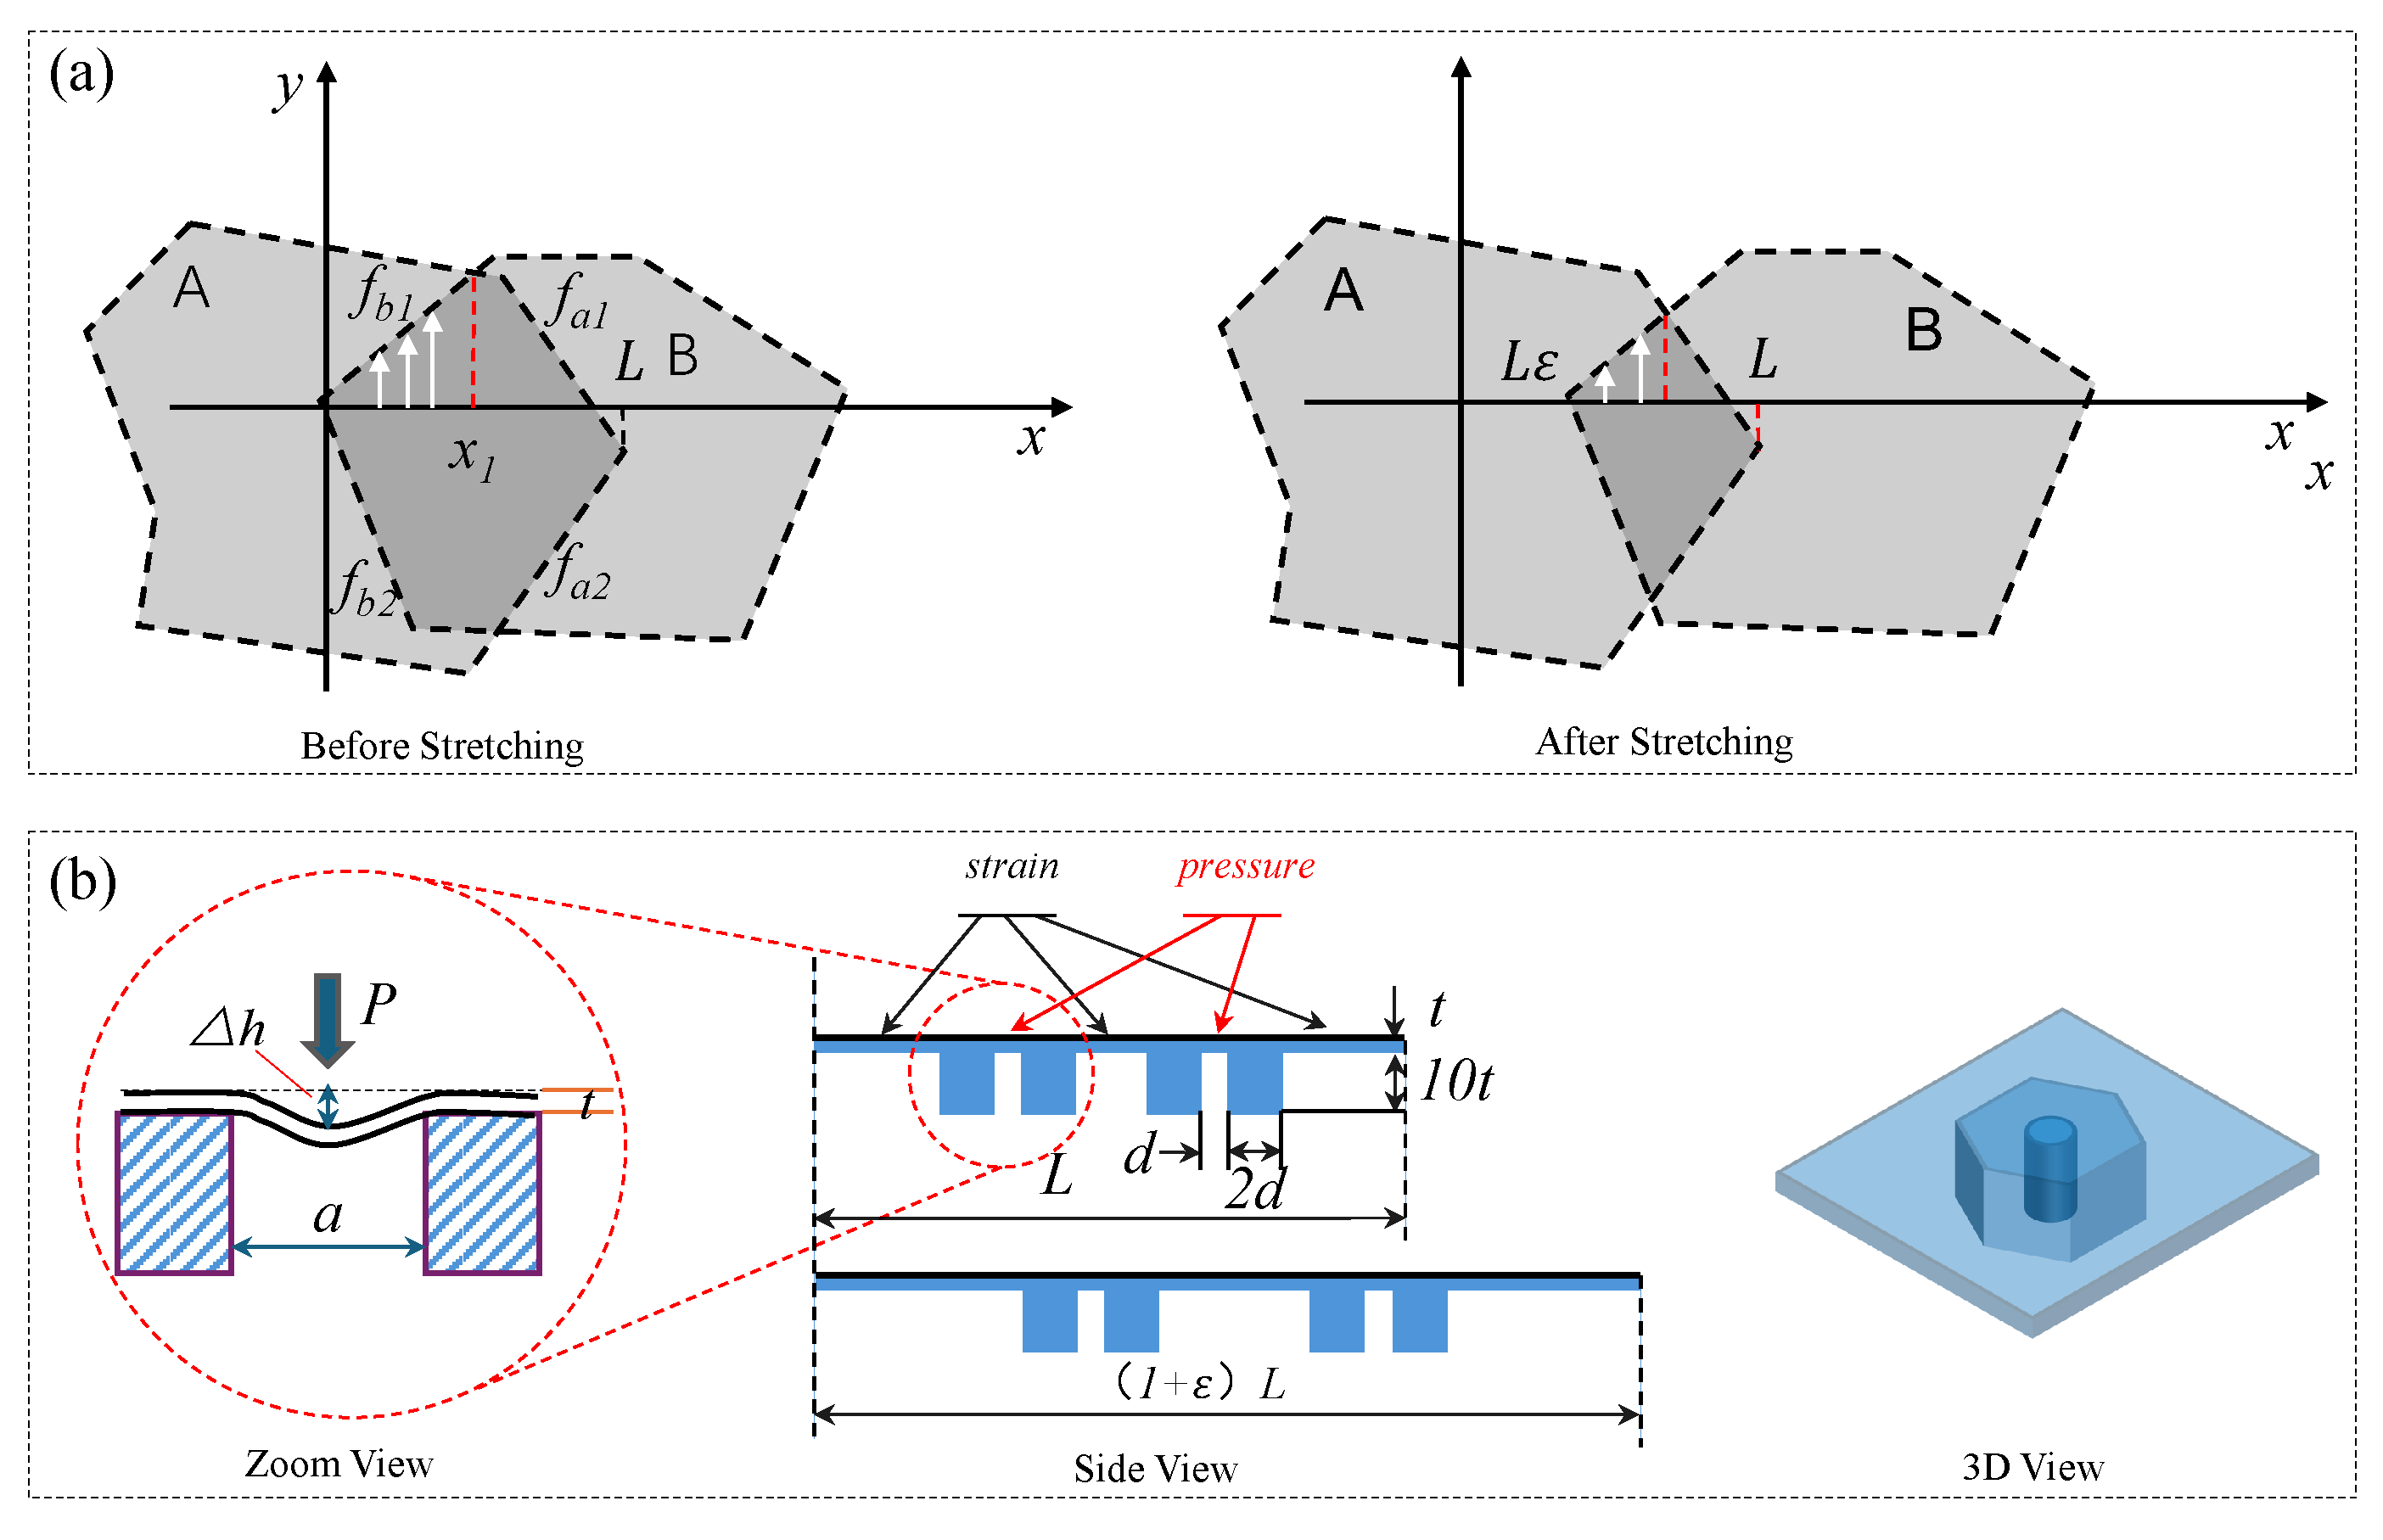
The main difference between pressure sensing and strain sensing in flexible sensing films lies in the deformation scale. Therefore, resistive pressure sensing relies primarily on the slip effect and tunneling effect of the nanomaterials themselves. When pressure is applied to the sensing film, the low-dimensional nanosheets within the film slide relative to each other, causing changes in the overlapping area with strain, ultimately leading to resistance changes. Generally, assuming the boundary functions of the contact area are fa1(x), fa2(x), fb1(x), and fb1(x), as shown in
Figure 4a, belonging to nanosheets A and B, respectively, the initial contact area
before stretching can be obtained through integration as follows:
After stretching, assuming nanosheet A remains stationary while nanosheet B slides to the right by
, the overlapping area s (
) can be calculated in the same manner:
The relationship between resistance and contact area s is = .
Assuming the antiderivatives of
and
are
and
, respectively, the ratio between
and
can be calculated as follows:
In Equation (
5),
represents the intersection coordinate after stretching, which is related to strain and can be expressed as
, k ∈ [−1, 1], while x1 has no direct relationship with strain. Therefore, the relationship between
and
depends entirely on the power of the original boundary functions
,
: if the original function has a power of n, then according to the integral relationship in Equation (
4),
R and
exhibit an inverse relationship with the power of (n + 1). Typically, due to the linear characteristics of grain boundaries, the boundaries of nanosheets manifest as first-order linear functions, thus yielding the following:
Since the mutual sliding of nanosheets occurs at small strains, according to the Taylor series expansion estimation, higher-order terms can be directly eliminated while retaining the first-order term, ultimately yielding the relationship between post-stretching resistance
and
:
where
and
are related to parameters such as nanosheet properties, contact pressure, and temperature. We have experimentally determined
m and
for our system.
At the macroscopic level,
Figure 4b illustrates the fundamental principle of flexible pressure sensing. The flexible sensing film adheres to a flexible substrate with cavities. When external pressure changes, the flexible sensing film undergoes bending deformation due to the presence of cavities, resulting in pressure-dependent resistance variations. In our analysis, we consider the deformed sensing film as a segment of a complete spherical shell. Given that the axial and circumferential stresses in a complete spherical shell are equal, analyzing the cross-sectional force distribution enables us to effectively examine the relationship between the sensing film strain
and pressure change
P:
where
represents initial prestress,
represents Poisson’s ratio, and E represents the elastic modulus.
Substituting the gauge factor (GF =
) sensitivity formula into Equation (
8) yields the following relationship between the resistance change
R =
and pressure change
for the pressure sensing unit:
The formal part of Equation (
9) is very small compared to the second part of the equation, which can be ignored as the following:
Thus, the relationship between resistance change
and pressure change
is determined by Equation (
10).
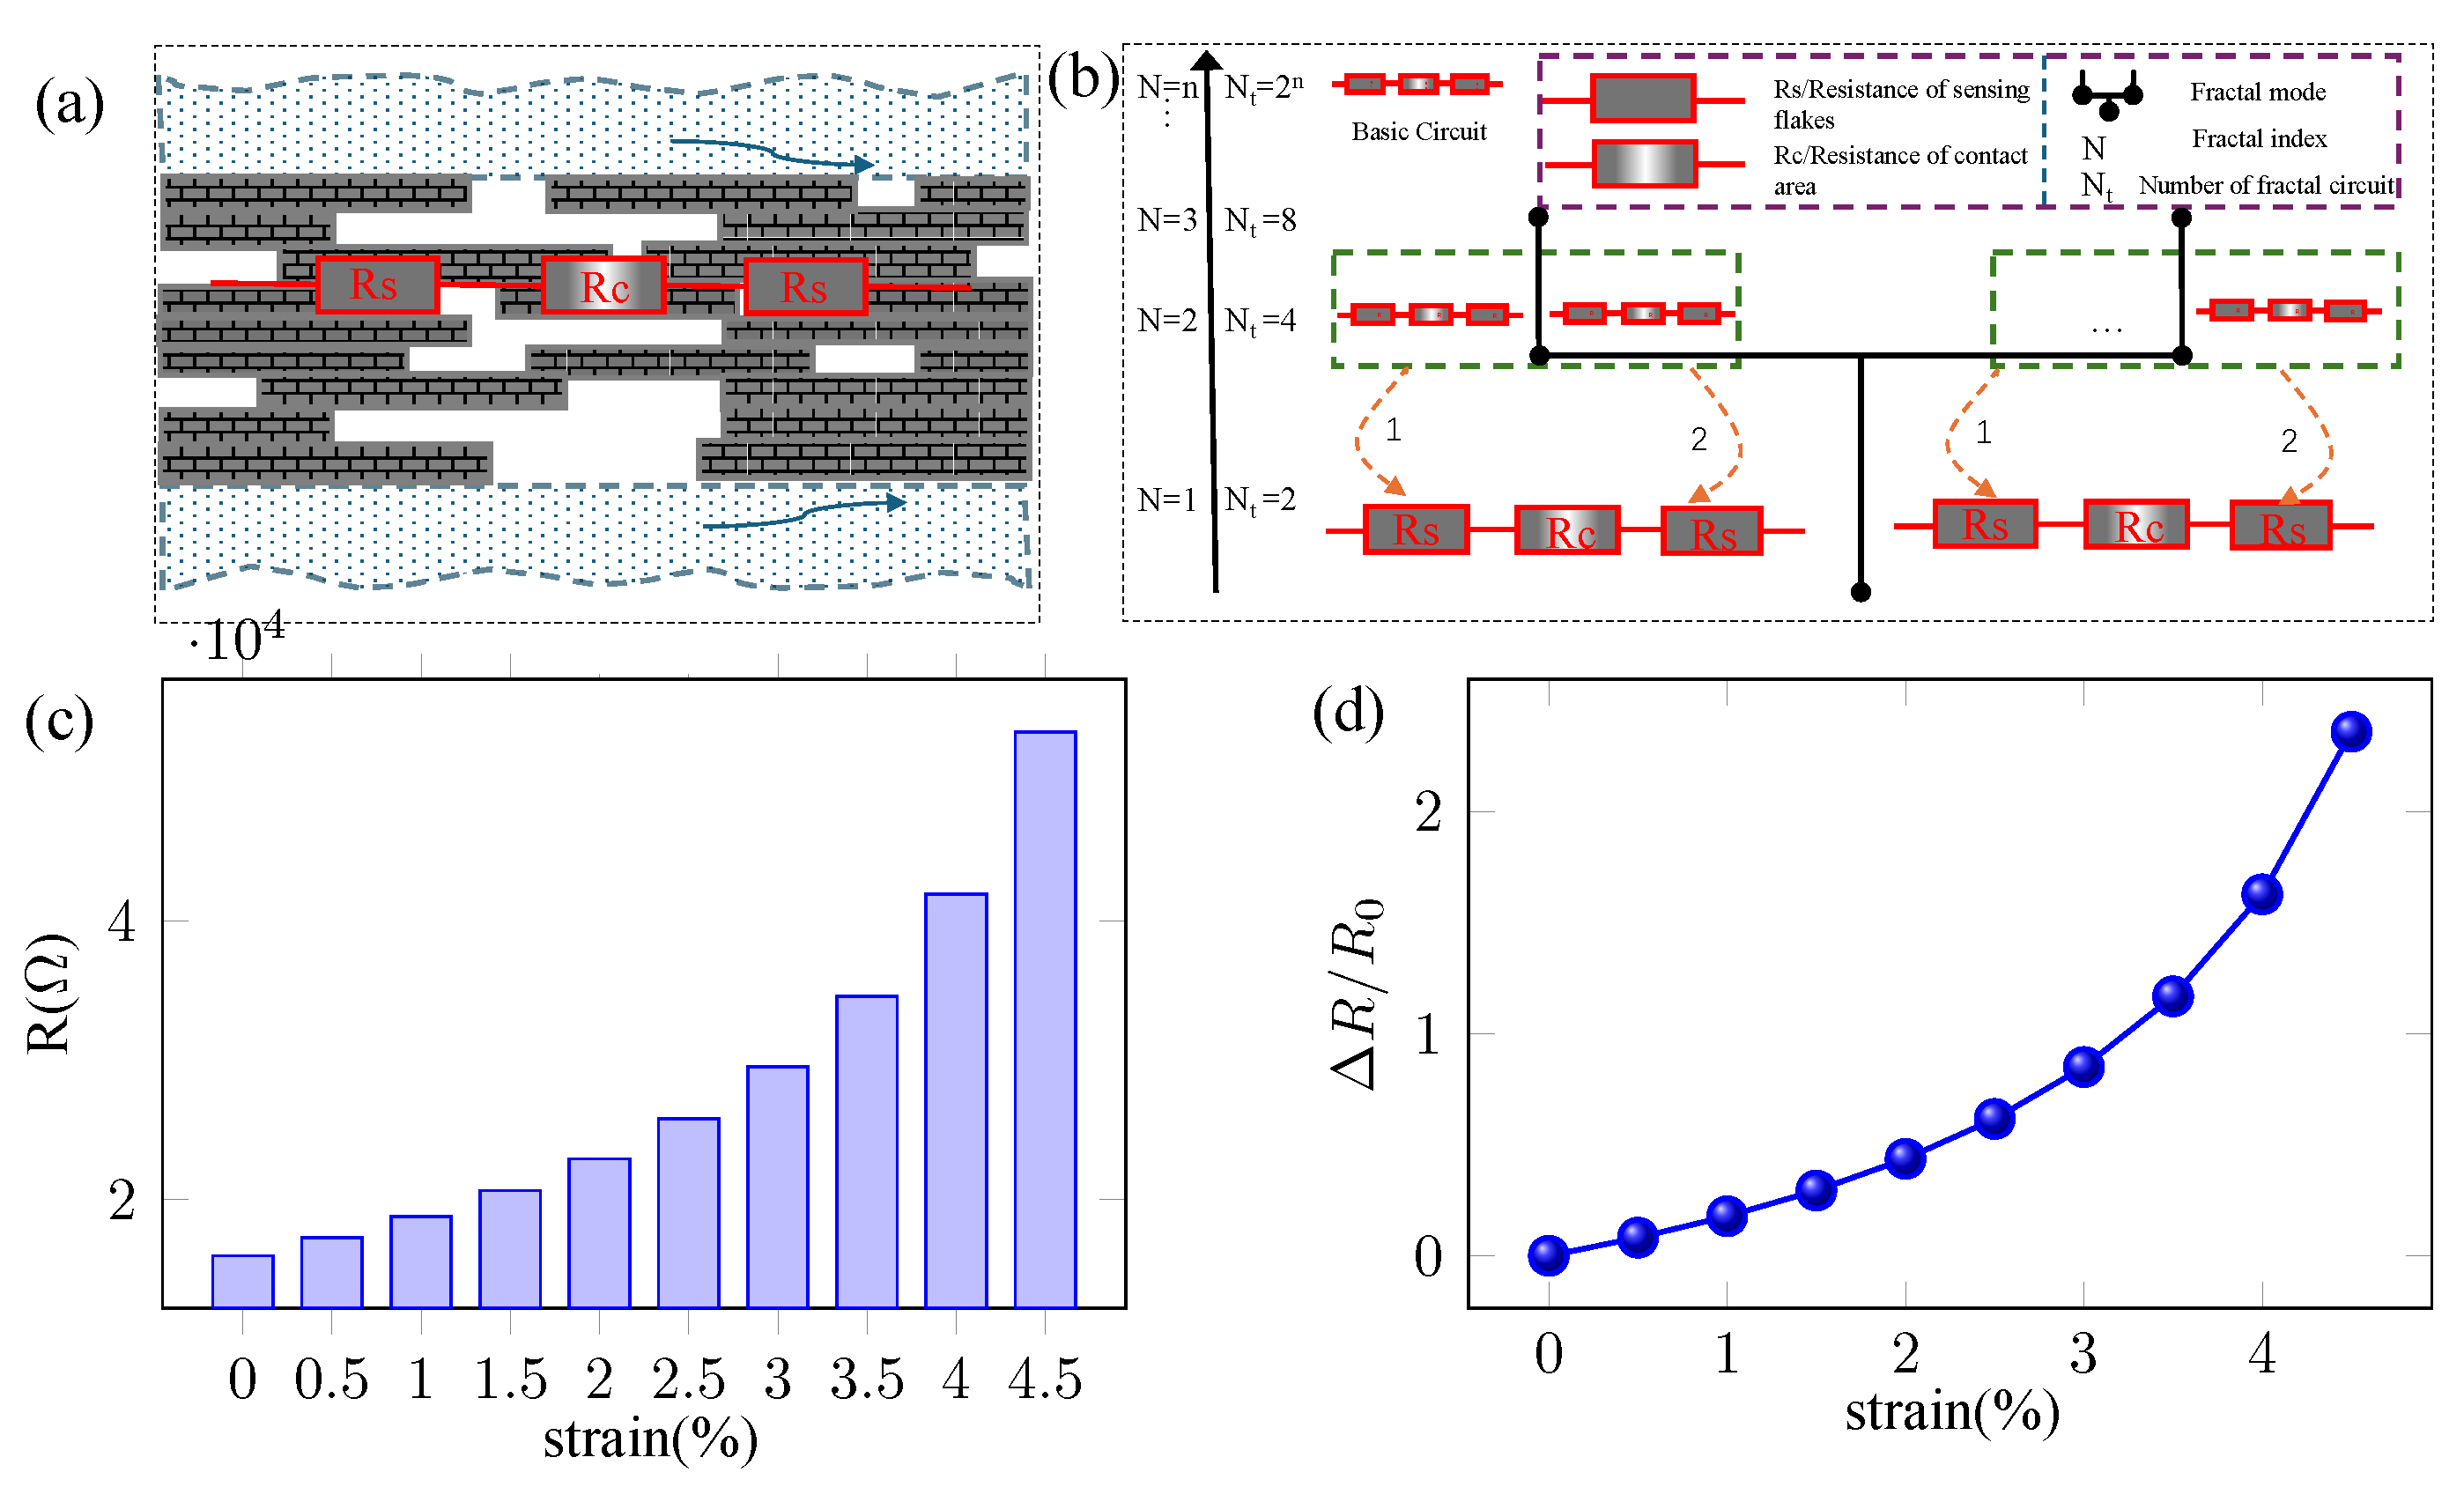
Based on the aforementioned analysis, the pressure sensing mechanism primarily relies on the relative sliding between nanosheets to generate resistance changes. According to this structural characteristic, an H-type circuit equivalent model was constructed in the microstructure schematic shown in
Figure 5a to quantitatively describe the relationship between pressure and resistance variations. The total resistance of this H-type circuit equivalent model can be calculated using the series resistance formula:
where
,
, and
are the total resistance, the resistance of sensing flakes, and the contact area, respectively.
The series circuit equivalently represents the basic pressure-sensitive structure of the 2D films in the longitudinal cross-section. This circuit model can be extended to the entire film through self-fractal characteristics, with the fractal process illustrated in
Figure 5b. Each resistor in the series circuit can be decomposed through self-similarity into smaller scales, ultimately becoming the resistance calculation between two nanosheets. At this point, Equation (
7) can be used to calculate both the contact resistance and total resistance. Specifically, as the circuit model extends to smaller scales through fractal iterations, the resistance between adjacent nanosheets becomes the fundamental unit of calculation. These microscale resistances combine according to the series-parallel rules established by the fractal pattern, allowing us to derive the overall resistance of the sensing structure.
After solving Equation (
7) and subsequently calculating its relationship with pressure using Equation (
10), we obtain the absolute resistance values and relative change sensitivity curves for the flexible sensing film during pressure sensing, as shown in
Figure 5c,d. The total resistance of the fractal circuit model at different strain levels is calculated using the recursive algorithm described in
Section 2. The processes and modeling parameters can be found in the
Supplementary Materials.
4. Interface Physics-Based Instability Analysis and Stabilization Methods
There are numerous factors causing instability in flexible strain/pressure sensing, including microstructural changes, interface delamination effects, material fatigue, environmental influences, stress concentration, and conductive network reconstruction, as shown in
Table 1.
These instability factors lead to degradation in sensor repeatability, consistency, and reliability, necessitating improvements through interface engineering optimization and structural design methodologies.
4.1. Complete Contact Encapsulation Technology
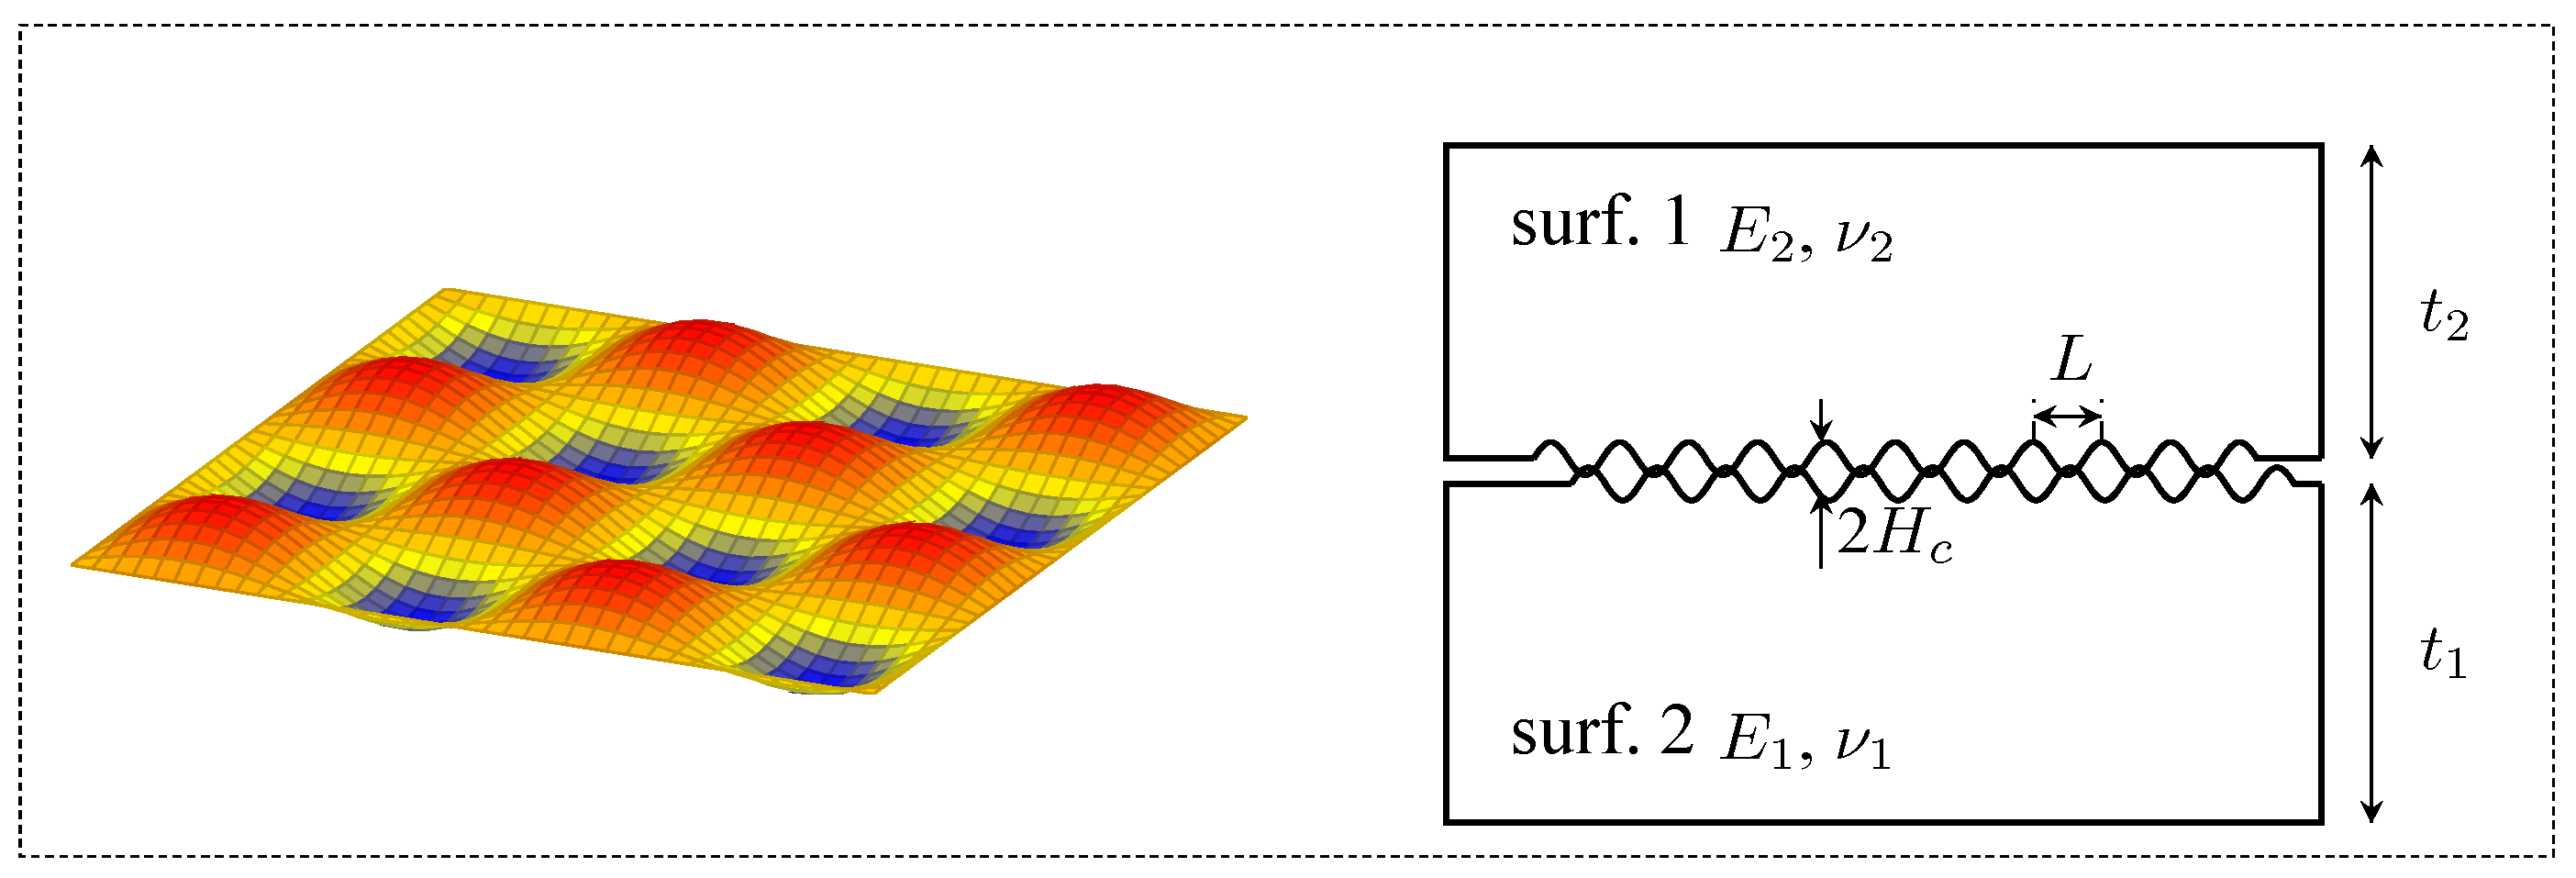
Typically, flexible strain/pressure sensors are composed of sensing materials combined with flexible substrates and encapsulated using flexible materials, involving contact and bonding between two surfaces. As illustrated on the left of
Figure 6, a schematic diagram shows the roughness of the surface of a typical flexible substrate. To achieve effective encapsulation when two rough surfaces make contact, complete surface contact and intermolecular force formation are required. Due to surface roughness, initial contact between the two surfaces exhibits misfit phenomena, creating gaps, as shown in the right of
Figure 6. This misfit can be overcome through elastic deformation, plastic deformation, or mass transfer of materials. Complete contact can be achieved when the surface energy between the two surfaces exceeds the additional elastic energy. From a quantitative perspective, the initial gap for complete contact between two surfaces must be satisfied [
15].
where
represents the change in surface energy during contact between two planes, given by
=
1 +
12, where
denotes surface energy. In practice, this can be approximated by
1 +
2 [
16]. L represents the wavelength of surface roughness, and Ē denotes the effective elastic modulus calculated by Ē = E/(
2), where E is Young’s modulus and
is Poisson’s ratio. Equation (
12) becomes the following:
The equation demonstrates that materials with lower elastic modulus exhibit enhanced capability to overcome gaps and achieve contact, thereby facilitating reliable encapsulation. Consequently, when selecting flexible materials, it is advisable to choose those with relatively low elastic modulus and thickness, as this can effectively improve the stability of flexible sensing systems.
Based on an analysis of published encapsulation materials, PDMS stands out as the optimal choice, offering excellent chemical stability, strong aging resistance, reliable adhesion to various substrates, minimal hysteresis during cyclic loading, and straightforward curing conditions. Furthermore, the elastic modulus of PDMS is closely related to its base-to-curing agent mass ratio and curing conditions (temperature and time). Our experiments show that optimal encapsulation effects are achieved within a specific elastic modulus range (0.5–1.0 MPa), which ensures complete contact between the encapsulation material and sensing material while maintaining sufficient structural support and elastic properties. Too low of a curing degree would result in inadequate support and compromised elastic performance. We partially cured PDMS at 80 °C for 30 min during the transfer process of sensor films [
13], while its elastic modulus is lower and better processing results are achieved.
4.2. Stabilization Methods Through Redundant Structural Design
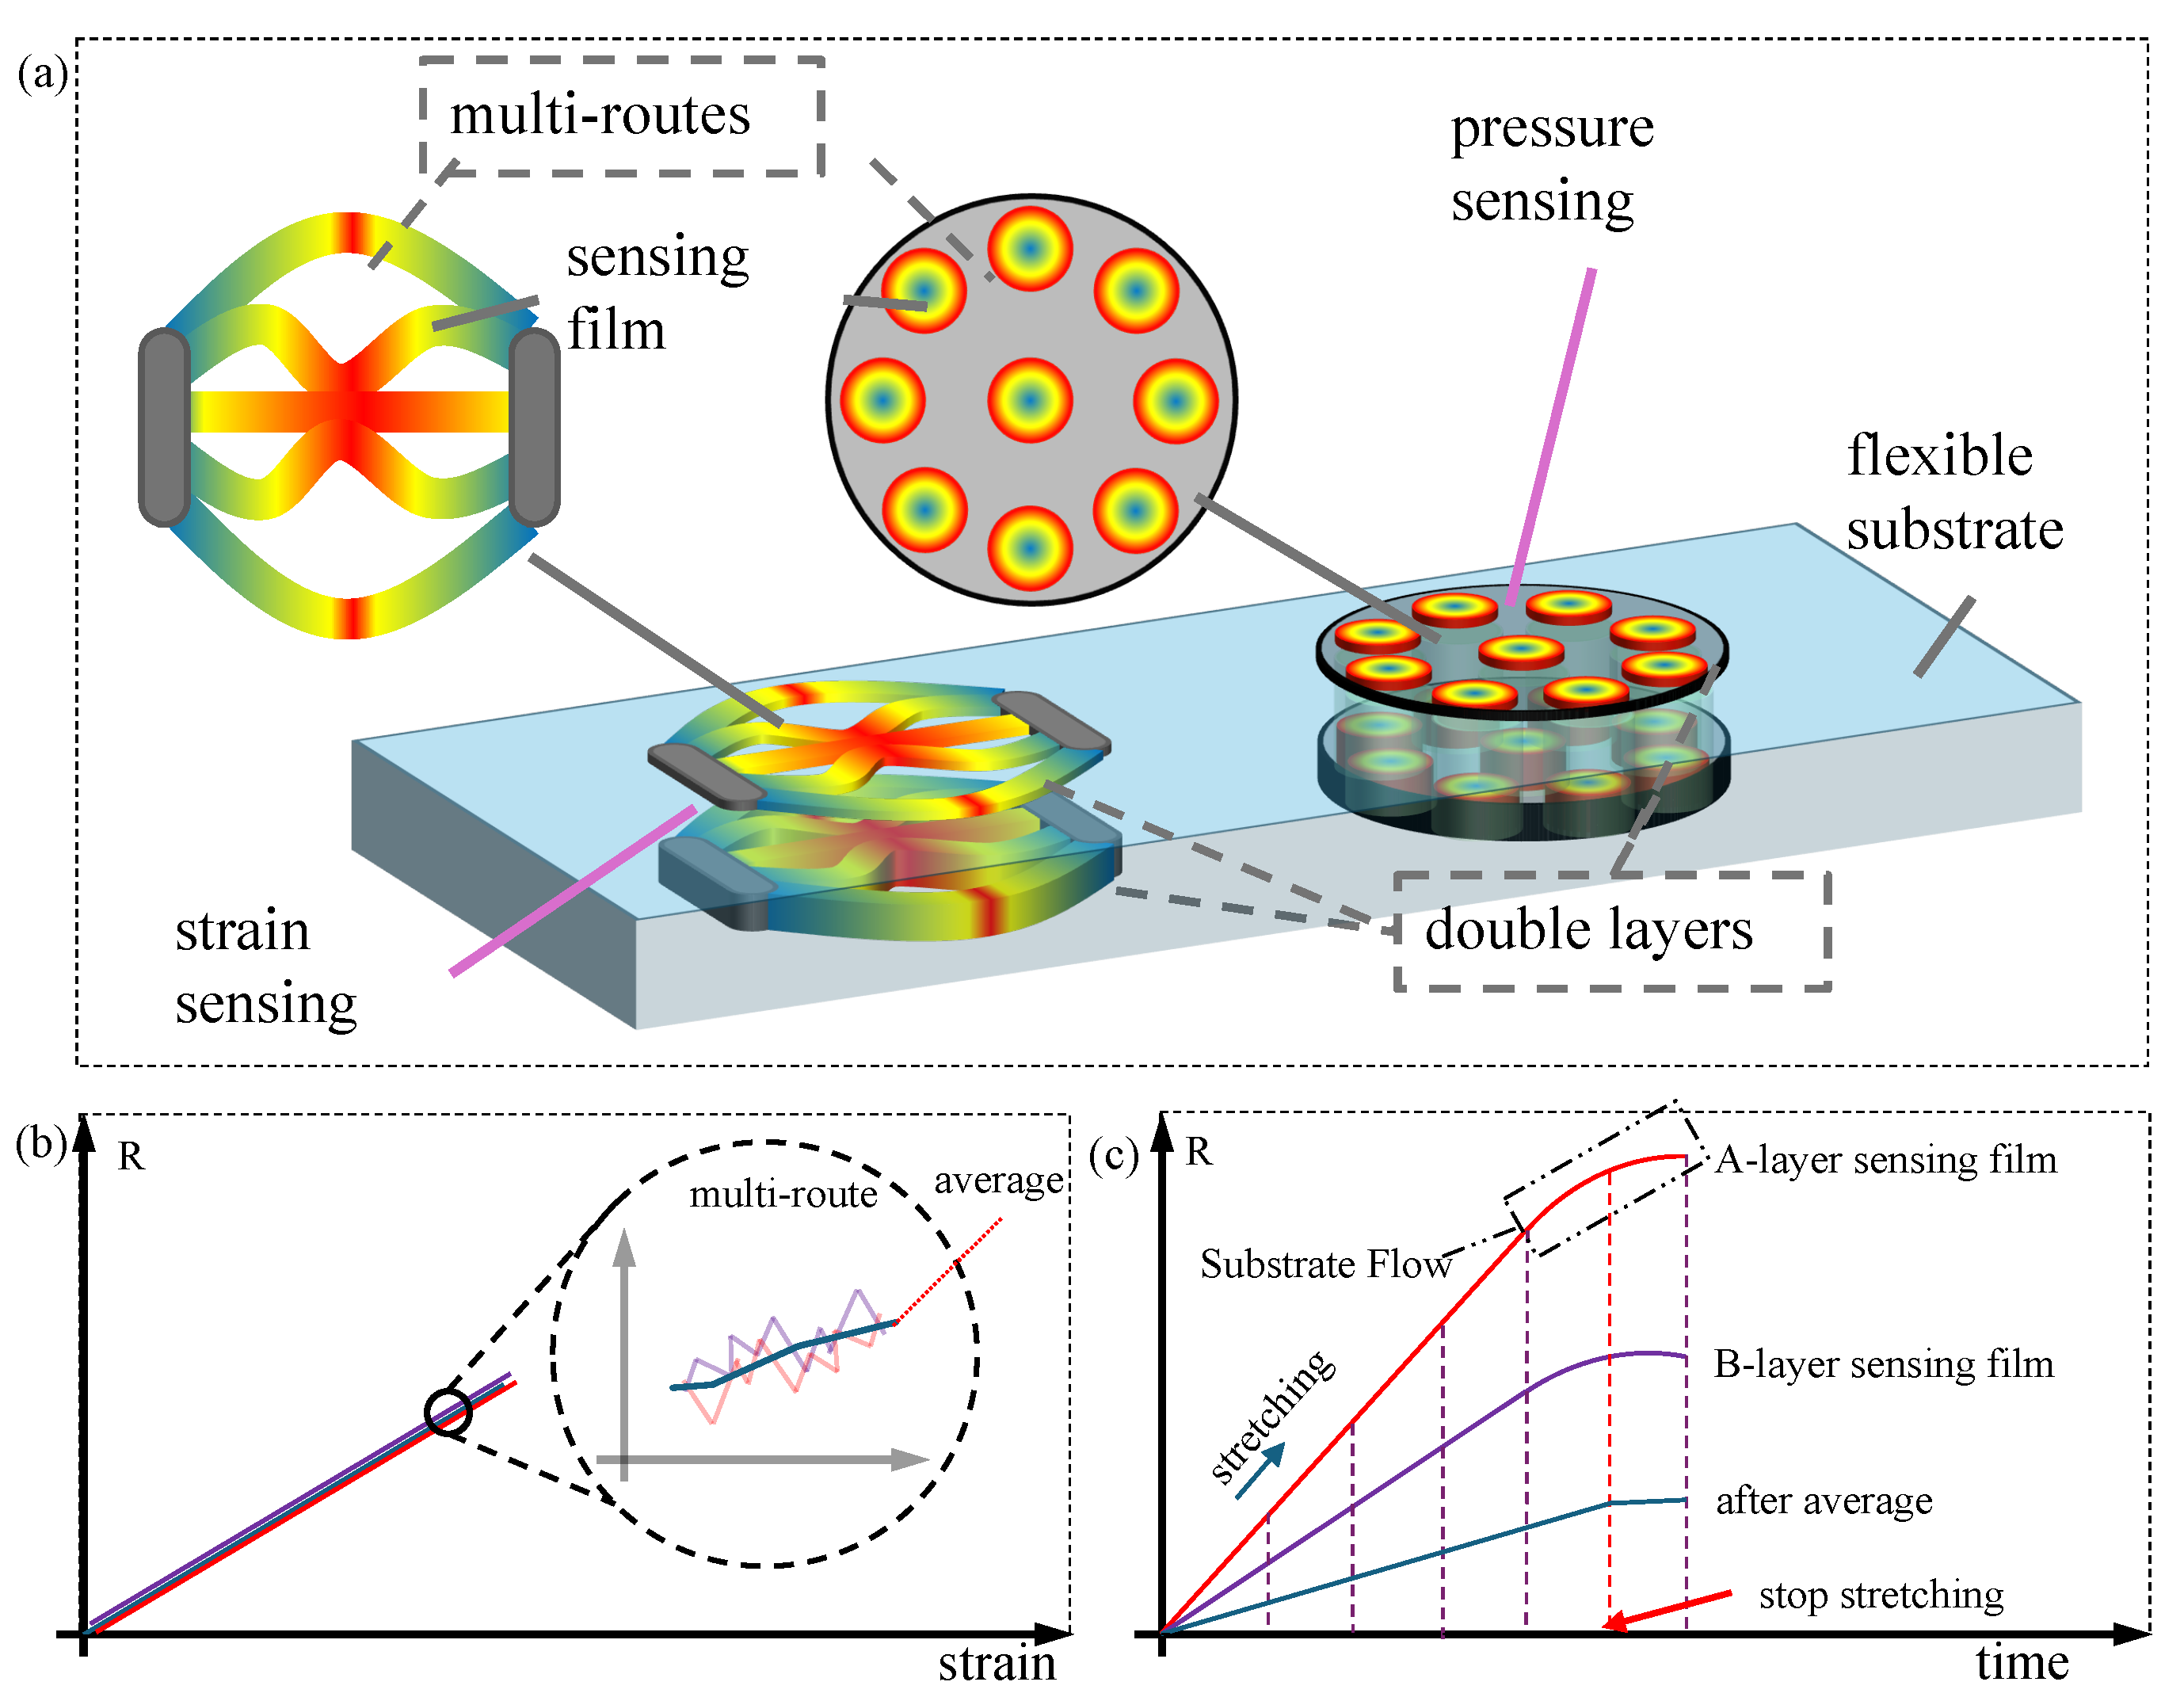
The key to achieving flexible stabilization in structure lies in averaging and differentiation, with redundancy methods providing an effective solution for flexible sensing stabilization. This paper develops stabilization designs based on redundancy methods from both horizontal and vertical dimensions. Horizontally, the strain/pressure sensing unit employs a multi-channel sensitive structure (cavity structure for pressure measurement), using the averaging effect of multiple channels to suppress instability caused by sensing film non-uniformity. Vertically, a dual-layer sensitive structure design with different film thicknesses is adopted, utilizing the upper and lower dual-layer sensitive structures for differentiation to suppress instability caused by flexible substrate, temperature drift, and degradation of sensitive materials, as shown in
Figure 7a.
The aforementioned stabilization mechanism employs a dual-layer multi-channel redundant sensing structure, which can effectively enhance sensor stability from both theoretical and methodological perspectives. To further evaluate this redundancy-based stabilization mechanism, we conduct a quantitative analysis of the stabilization characteristics of the dual-layer multi-channel sensing structure from two aspects: flexible sensing characteristic curves and statistical analysis.
Regarding the instability issues caused by non-uniform sensor film preparation, the macroscopic electrical characteristics of flexible sensors manifest as significant random measurement noise. As shown in
Figure 7b, the sensing characteristic curves of different channels in flexible strain sensing exhibit notable noise when magnified. From a quantitative perspective, after parallel summing the multiple channels with random noise, the characteristic curve demonstrates more stable properties, effectively suppressing the instability caused by non-uniform film preparation. From a statistical perspective, as larger sample sizes yield observations closer to true values, the multi-channel planar structure significantly improves system stability.
In terms of instability issues caused by flexible substrate fluidity, the macroscopic electrical characteristics of flexible sensors manifest as temporal drift in measurements. As shown in
Figure 7c, the resistance variation curves of upper and lower sensitive films with different thicknesses exhibit drift after stretching stops due to the fluidity and rebound effects of the flexible substrate. Quantitative analysis reveals that since sensitive films of different thicknesses possess different sensitivities (slopes), the measurement drift caused by the flexible substrate can be effectively eliminated through differential operations on the resistance of dual-layer sensitive films. From a statistical perspective, differential operations on multiple sample groups can effectively eliminate systematic errors.
Our temperature compensation design incorporates three synergistic mechanisms for superior thermal stability. The symmetric thermal expansion ensures both top and bottom sensing layers experience identical temperature changes, enabling effective common-mode rejection. This is complemented by a differential readout architecture that measures the difference between layers, effectively canceling out temperature-induced resistance variations. Additionally, multiple parallel sensing channels facilitate sophisticated signal averaging, which substantially reduces random thermal noise and enhances measurement stability.
As for sensing materials, graphene-based composites and MXene films have shown superior performance. Specifically, graphene with thickness <5 μm exhibited high sensitivity (gauge factor > 200) while maintaining mechanical stability. For protective layers, we suggest using polydimethylsiloxane (PDMS) with a thickness < 200 μm and elastic modulus of 0.5–1.5 MPa, which provides excellent protection while minimizing interference with sensor performance. We have also added a new table in the
Supplementary Materials comparing the mechanical properties and sensing performance of these materials.


