Abstract
The general procedure for measurement of impurities in hot zones of high-temperature growth setups is proposed and developed. In the first step, we prepared extra-pure 15 × 15 × 8 mm collecting cubes from composite graphite by high-temperature annealing in dry dynamic vacuum. The collecting cubes were placed in different parts of the hot zones of growth setups. We tested two types of crystal growth setups: single- and multi-crucible growth setups of a VGF configuration for AIIIBV semiconductors’ crystal growth. The hot zones of the setups were built from different types of graphite materials and high-temperature dielectric ceramics (BN and Al2O3) as insulators. The growth setups with collecting cubes without raw crystal materials were heated to operating temperatures, exposed for certain operating periods, and cooled to room temperature. The cubes were taken off and analyzed by extraction of condensed impurities into an analytic super-pure acid. The extracted impurities in the acid were determined by ICP-MS analysis. We showed that the hot zone of a single-crucible growth setup was nearly twice as pure (averaged 2.45 mg/g) compared with the hot zone of a multi-crucible setup (averaging 4.06 mg/g) because of the different graphite materials of the constructions.
1. Introduction
In recent decades, the VGF method [1] has become widely used for the industrial growth of high-quality III–V semiconductor crystals (GaAs, InP, etc.). Historically, the development of this method began with crystals with a diameter of 2″ [2]. At the same time, a chemical purity of 5N made it possible to obtain crystals of acceptable quality. The transition to crystals with diameters of 4″ and 6″ required increasing the chemical purity to 7N to obtain structurally perfect crystals [3]. For example, when growing silicon, the main impurity is oxygen. Various methods for reducing its concentration using numerical modeling have allowed for a significantly better understanding of the process of oxygen dissolution in silicon single crystals and the discovery of ways to control it [4]. The technological process of growing 8″-diameter GaAs crystals requires a high chemical purity of the initial batch and purity control of the growth environment, including hot-zone construction materials. But in the case of GaAs crystal growth, there is no reliable information on this matter, since it constitutes the know-how of manufacturing companies such as Freiberger Compound Materials GmbH [5].
Numerous attempts to obtain high-quality CdTe and CdZnTe crystals for uncooled matrix detectors of ionizing radiation using the VGF method also faced the problem of increasing the chemical purity of the source material to 8–9N [6,7]. But in the case of CdTe and CdZnTe single crystals, the problem has now been solved by changing the growth method. Instead of directional crystallization methods [8], it was proposed to use the solution-melt growth process, THM [9,10,11,12]. The THM process is implemented at temperatures below 900 °C. In this situation, the requirements for the chemical purity of construction materials are significantly simplified. High-purity quartz glass is quite sufficient for producing high-purity single crystals of up to 100 mm in diameter [13,14]. However, the process’s productivity is extremely low, leading to high crystal costs. Therefore, developing VGF technology to produce structurally perfect CdTe and CdZnTe single crystals remains a pressing issue [15].
In the designs of hot zones of VGF installations, various carbon materials (hard graphite, soft felt, composite graphite, etc.), as well as dielectric materials based on aluminum oxide and boron nitride [16], are used. However, according to information from manufacturers of both carbon and dielectric materials, their chemical purity is typically not better than 5N–5N5 (99.999–99.9995 wt%) [17,18], measured by electro-thermal vaporization with inductively coupled plasma and optical emission spectrometry application (ETV-ICP-OES) [19]. But impurity certificates for structural materials, with rare exceptions, are not provided. Therefore, the question of conducting background contamination tests on high-purity raw materials remains open. It should be noted that the linear dimensions of graphite insulation, heaters, crucibles, and supports are measured in tens of centimeters. Many of these parts are not always made of a homogeneous material, so conducting an objective analysis of micro-impurities in such large parts is a separate and rather complex task. This problem is solved by sequentially carrying out growth processes, followed by analysis of impurities in the obtained samples. During the III–V VGF crystal growth process, high-purity boron oxide with a controlled residual water content is used as a flux [16]. Water migrates from the boron oxide to the vapor phase and, at an argon pressure of 10 atm in the growth system, acts as a carrier, facilitating the transfer of dopants from the gas phase through the liquid flux layer to the melt surface. Along this pathway, impurities from graphite materials can easily penetrate the melt zone, contaminating it. Therefore, monitoring the penetration of uncontrolled impurities from thermal zone materials and quantifying such contaminants is important.
Moreover, at high temperatures, B2O3 partially evaporates and settles in the pores of the graphite thermal insulation. This increases the thermal conductivity of the graphite thermal insulation, requiring its periodic replacement. This necessitates repeated testing of the chemical purity of the thermal-zone materials.
The procedure of impurity determination in graphite and dielectric materials is labor-intensive and expensive; therefore, in this work, a method was developed and tested that allows one to estimate the level of background impurities in the thermal units of installations for high-temperature processes, as well as to study the behavior of background impurities without the use of expensive high-purity raw materials.
2. General Idea
The basic concept of the developed method is to obtain a high-purity material in the form of composite graphite cubes as impurity collectors. The produced collecting cubes are placed in various parts of the hot zones of growth systems. Systems without high-purity raw materials are brought into a growth mode. Under high temperatures and in an atmosphere of process gases, the system is maintained according to a predetermined growth regime. For GaAs crystal growth, the typical conditions are as follows: a 1300 °C maximum temperature in a hot zone, vacuum at the start of the process up to 10−3 Pa, and argon pressure during the growth process of 10 bar. All the experiments in the present research were conducted under these conditions. After that, the system is cooled, the pressure is released, and the collecting cubes are removed for analysis of trace impurities by extraction into high-purity acid, followed by the impurities’ determination by inductively coupled plasma mass spectrometry (ICP-MS).
3. Materials and Methods
3.1. Collecting Elements’ Characterization
The 15 × 15 × 8 mm collecting cubes (Figure 1) were made from UUKM Hardcarb composite graphite (GMK Ltd., Taganrog, Russia). The cubes were cut from a UUKM sheet and annealed under dry dynamic vacuum at 10−5 Pa at 2000 °C for 10 h.
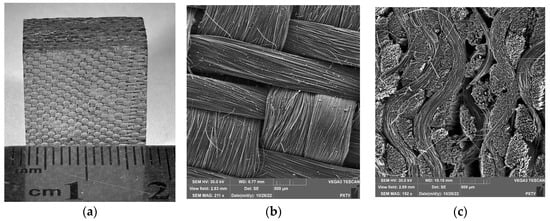
Figure 1.
Photo (a) and SEM image of planar (b) and cross-section (c) of UUKM Hardcarb collecting cube.
The structural characteristics of the collecting cubes were studied using low-temperature nitrogen adsorption (77 K) by a TOP-200 specific surface area and porosity analyzer (Altamira Instruments LLC, Pittsburgh, PA USA). Before analysis, the samples were degassed at 358 K and <0.5 Torr for 1 h to remove adsorbed moisture. The specific surface area (SBET) was determined by the Brunauer–Emmett–Teller (BET) method and was found to be 1.351 m2/g.
3.2. Preparation of High-Purity Collecting Cubes
A collecting cube made of UUKM Hardcarb was purified by carrying out extractions of impurity elements in a high-purity acid solution until the results of the ICP-MS analysis of the solutions obtained after the extraction were convergent. Impurity extraction was performed in polypropylene test tubes. An amount of 10 mL of a mixture of high-purity concentrated acids (HCl–HNO3 = 3:1 in volume) was added to a collecting cube of UUKM Hardcarb weighing ~2 g. The tube was placed in an ultrasonic bath, and impurity extraction was performed at 80 °C for 1 h. After cooling the solution to room temperature, the resulting solution was diluted with deionized water produced by an Aquapuri 5—551 Series (Young Lin Instruments Co., Ltd., Hogye, Republic of Korea) and had an 18.2 MΩ cm electrical resistance and 99.999999 wt% purity (based on 68 elements) and was analyzed by inductively coupled plasma mass spectrometry (ICP-MS). After each extraction step, the collecting cubes of UUKM Hardcarb were rinsed with deionized water to remove any remaining acid mixture. An amount of 10 mL of deionized water was then added to the test tube, which was then placed in an ultrasonic bath at 80 °C and held for 1 h. This step was repeated three times, after which the samples were dried in a vacuum oven before proceeding to the next extraction.
Analysis of the impurity element concentrations in the solution obtained after the first extraction of the as-prepared collecting cubes made it possible to establish that the concentrations of Al, Si, Ca, Ti, Fe, Zr, and W in the UUKM Hardcarb collecting cubes had maximum values and ranged from 100 to 1500 ng/g (Figure 2).
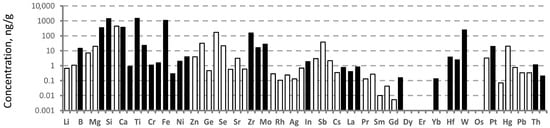
Figure 2.
Impurity concentrations of the collecting cube after the first extraction determined by ICP-MS. Here and after, the empty bars show the limits of determination of the elements.
The results from analyzing a series of solutions obtained after sequential extraction of impurity elements from a UUKM Hardcarb collecting cube indicate that some impurity elements, such as W, were removed from the sample after two extractions under the conditions described above (Figure 3). After the third extraction, the W concentration in the solution was found to be below the ICP-MS limit of determination (LD). A group of elements, including Zr, was removed after three consecutive extractions. The concentration of these elements was also below the LD. The sample also contained elements (Al and W) whose concentrations decreased from extraction to extraction and reached a constant level.
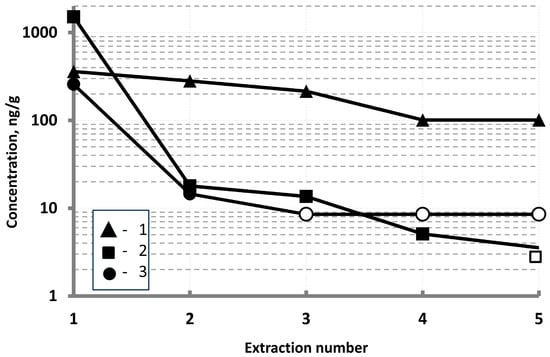
Figure 3.
Concentrations of various elements (1—Al, 2—Ti, and 3—W) in the UUKM Hardcarb collecting cube determined from sequential extractions. Solid markers indicate measured concentrations; empty markers indicate limits of determination.
Based on the obtained results, it can be concluded that five consecutive extractions are sufficient to extract most of the impurity elements from the UUKM Hardcarb collecting cube or to bring their concentration to a constant level. After the fifth extraction, the concentration of most of the elements was about 100 ng/g and less, except Al (Figure 4).
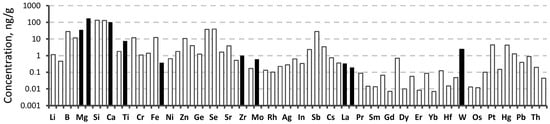
Figure 4.
Impurity concentrations of the collecting cube after the fifth extraction determined by ICP-MS (for more details, see Table S2, column 5).
3.3. Impurity Determination by ICP-MS
To analyze the chemical purity of the extraction, we used the inductively coupled plasma mass spectrometry (ICP-MS) technique. Analytical measurements were carried out with a NexION300D inductively coupled plasma mass spectrometer (PerkinElmer Inc., Waltham, MA, USA). The mass spectrometer was equipped with a spray chamber and a conical nebulizer made of perfluoroalkoxide (PFA) polymers, a platinum injector, and cones.
The TotalQuant method [20,21] was used for determination of 68 chemical elements’ concentrations. The standard solutions (PerkinElmer Inc.) were used for calibration. The optimized operating mode of the NexION300D spectrometer for impurity analysis of the samples is presented in Table 1. Polyatomic ionization was eliminated using a collision cell filled with an inert gas (helium (He)). When colliding with inert gas molecules, polyatomic ions lose a significant portion of their kinetic energy, making it impossible to overcome the potential barrier. This phenomenon underlies the device’s kinetic energy discrimination (KED) mode of operation [22].

Table 1.
The operating mode of the NexION300D instrument for conducting impurity analysis.
3.4. Hot-Zone Configuration of VFG Setups
We tested two types of VGF facilities: a single-crucible VGF SC setup and a multi-crucible VGF MC setup.
In the case of the SC setup (Figure 5), resistive heaters with casings (1, 2, and 4) were made from Sigratherm CFRC high-density graphite (SGL CARBON SE, Limburg, Germany). The same graphite material was used for a crucible casing (12) and a crucible lid (10). The outer thermoinsulation (5) was made from a CBCF-14VF-2000 cylinder (Mersen—FTCAP GmbH, Husum, Germany). The top thermoinsulation (6) was made from a CBCF-14VF-2000 board (Mersen—FTCAP GmbH, Husum, Germany). The bottom thermoinsulation (7 and 8) was built from two materials: a CBCF-14VF-2000 board (Mersen—FTCAP GmbH, Husum, Germany) and Sigratherm Soft Felts (SGL Carbon SE, Limburg, Germany). Besides the carbon materials, BN ceramics (Beijing Himop Technology Development Co., Ltd., Beijing, China) as dielectric parts (15) were used.
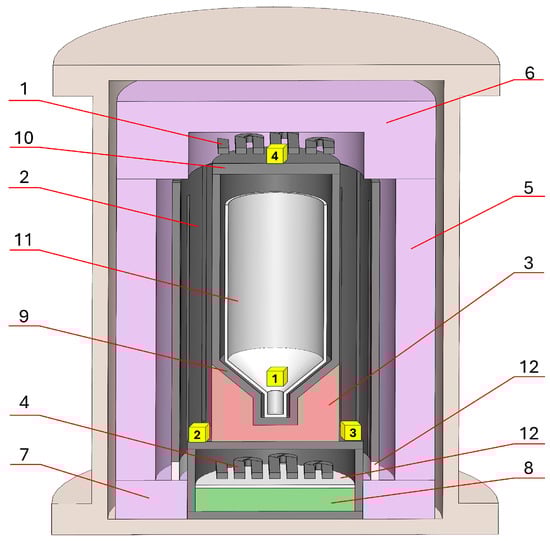
Figure 5.
Hot-zone scheme of a single-crucible VGF SC setup. 1—upper heater, 2—middle heater, 3—crucible stand, 4—lower heater with casing, 5, 6, 7, and 8—thermoinsulation, 9—crucible casing, 10—crucible lid, 11—pBN crucible, and 12—BN ceramic dielectric.
In the case of the MC setup (Figure 6), resistive heaters with casings (1, 2, and 4) were made from GIP-4 high-density (HD) graphite [23] (Karbosil Ltd., Moscow, Russia). The same GIP-4 material was used for the current leads, crucible casings (10), and a crucible lid (12). The outer thermoinsulation (7) was made from UKMT (Karbosil Ltd., Moscow, Russia). The top thermoinsulation (6) was made from UKMT (Karbosil Ltd., Moscow, Russia). The bottom thermoinsulation was built from two materials: UKMT (8) and soft carbon felt (9) (Karbosil Ltd., Moscow, Russia). The dielectric parts were made from BN (13) and Al2O3 (14) ceramics [24] (Thermocomponents Ltd., Moscow region, Mytishchi, Russia).
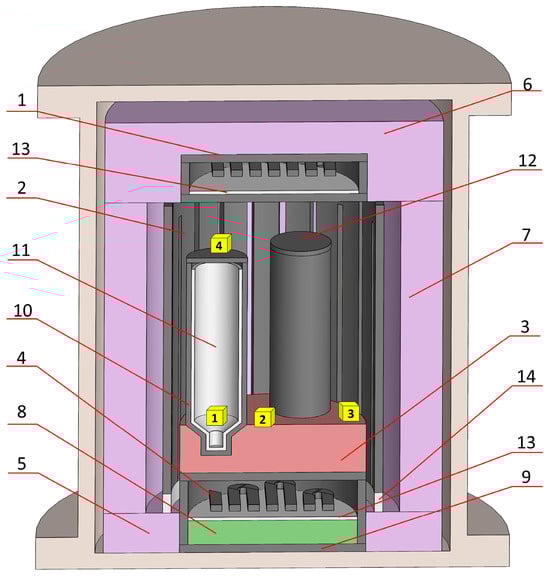
Figure 6.
Hot-zone scheme of a multi-crucible VGF MC setup. 1—upper heater with casing, 2—middle heater, 3—crucible stands, 4—lower heater with casing, 5, 6, 7, and 8—thermoinsulation, 9—bottom soft felt thermoinsulation, 10—crucible casing, 11—pBN crucible, 12—crucible lid, 13—BN ceramic dielectric, and 14—Al2O3 ceramic dielectric.
In both setups, the crucibles for raw functional AIIIBV materials (11) were made from pBN (Beijing Himop Technology Development Co., Ltd., Beijing, China).
3.5. Impurity Determination in Hot Zone of VFG Setup
After five extractions, the UUKM Hardcarb collecting cubes were vacuum-dried and packaged in 50 mL polypropylene vessels. Immediately before testing, the cubes were removed from the vessels and placed in the hot zones of the VGF setups. In Figure 5 and Figure 6, the locations of the collection cubes are marked with yellow cubes. The collecting cubes were notated as 0N-S(M), where 0N is the collecting cube number and S(M) is the attribution with the single-crucible SC setup or the multi-crucible MC setup (S or M, correspondingly).
4. Results and Discussion
At the time of the commencement of this study, the single-crucible setup had been in operation for several years, while the multi-crucible setup had just been installed and had not undergone any actual growth processes.
To assess the impact of contaminants from the VGF MC setup’s hot-zone construction materials, we were provided with samples of the materials used to construct the unit. A corresponding analysis was fulfilled.
An analysis of the purity of the construction materials using ICP-MS (Figure 7) revealed that all graphite materials used in the construction of the hot zone of the multi-crucible VGF MC setup contained large amounts of Na, Al, and Ca impurities. A group of impurity elements in the Ba and REE range was also presented. The graphite materials were contaminated with W and Mo impurities from the heating elements used in the heat treatment process. The GIP-4 material proved to be the purest. The content of most impurities in this material was less than 10 ppb, and only the concentrations of “household” impurities of Na, Mg, and Ca were above 100 ppb.
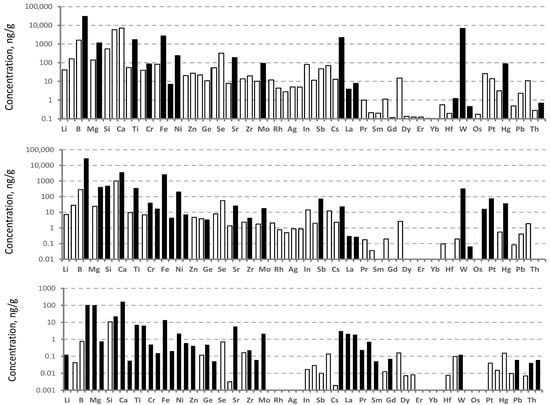
Figure 7.
Impurity concentrations of the initial graphite materials from Karbosil Ltd., determined by ICP-MS: top—soft carbon felt, middle—UKMT, and bottom—GIP-4.
It should be taken into account that both the tested VGF setups were located in the same technological area; therefore, the cleanliness of the technological area had the same effect on the results of the assessment of the cleanliness of the hot zone.
The representativeness of the analysis can be assessed by the change in the composition of the collecting cube before and after testing in the hot zone during growth mode. It is evident that after annealing, in the collecting cube in a pBN crucible located in the hot zone of a multi-crucible growth system, the concentrations of adsorbed impurities significantly exceeded the concentrations of impurities in the original, purified collecting cube (Table 2).
Table 2.
Results of impurities’ determination in the collecting cube placed in the crucible of the multi-crucible VGF MC setup before and after the growth process (for details, see Table S1, columns 1 and 2).
Analysis revealed that in the multi-crucible VGF MC setup, the primary contamination was associated with the original graphite materials (Figure 7), which were heavily contaminated with sodium impurity. Contamination with aluminum impurity was also observed in all zones (Figure 8). The aluminum impurity was likely inherited from the Al2O3 ceramics used as a dielectric material. The crucible zone covered by the lid was the most contaminated. The lowest contamination was observed in the crucible.
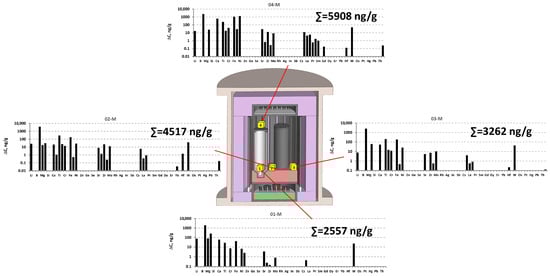
Figure 8.
ICP-MS results of determination of impurities’ concentrations in different parts of the hot zone of the single-crucible VGF MC setup after the growth process in the collecting cubes, subtracting background values (for more details, see Table S1 in the Supplementary Materials).
Contrary to the VGF MC setup, the total impurity concentration in the collecting cubes before and after testing of the hot zone of the VGF SC setup (Figure 9) was nearly equal in all parts of the setup.
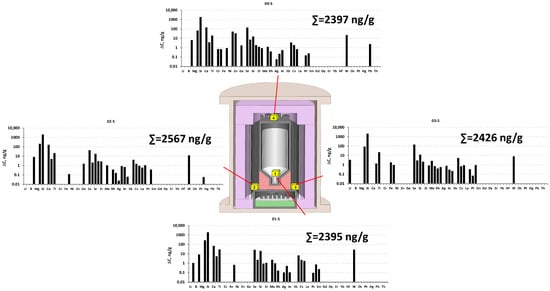
Figure 9.
ICP-MS results of determination of impurities’ concentrations in different parts of the hot zone of the single-crucible VGF SC setup after the growth process in the collecting cubes, subtracting background values (for more details, see Table S2 in the Supplementary Materials).
In the single-crucible VGF SC setup, the overall contaminant levels in the hot zone were lower. We attributed this to the VGF SC setup’s long operating period, during which most of the impurities were self-released from the graphite components at high temperatures. The highest concentrations were observed for Al, Si, Ca, and Ti (Figure 9). The overall impurity level was 1.5–2 times lower than in the multi-crucible setup. Moreover, the distribution of light-mass elements throughout the hot zone was virtually identical, both in profile and concentration.
In the case of the collecting cube in the VGF SC setup crucible, the Al, Si, Ca, and Ti contents increased significantly after annealing (Table 3).
Table 3.
Results of impurities’ determination in the collecting cube placed in the crucible of the single-crucible VGF SC setup before and after the growth process (for details, see Table S2, columns 1 and 2).
An assessment of the average contamination level in hot zones revealed that the average contamination level for the hot zone of the SC setup was 2.45 mg/g, while for the hot zone of the MC setup, it was approximately 4.06 mg/g. This difference of more than 1.5 times can be explained by the use of different graphite materials in the units.
We assessed the potential contamination of functional growth materials by impurities generated in the hot zones of the tested VGF systems. In the case of the 6″ crystal diameter, the crucible contents were contaminated by at least 4.7 and 5.1 mg in the SC setup and MC setup crucibles, respectively. Knowing the crucible loading data, it is possible to estimate the influence of the recorded contaminants on the purity of an as-grown crystal.
5. Conclusions
Analyzing the impurity of various construction materials used in the hot-zone structures of high-temperature VGF setups is a labor-intensive and expensive process that does not provide complete information on the potential contamination of the raw high-purity functional substances from which structurally perfect single crystals are obtained. To solve the problem, we proposed and developed a method for extracting impurities from the entire set of construction materials in a single process. The proposed impurity collectors are 15 × 15 × 8 mm elements made of UUKM Hardcarb composite graphite material, pre-cleaned to remove impurities. It was demonstrated that five extraction purification cycles are sufficient to reduce background impurity levels in collector elements to a minimum steady-state value of 10 ng/g for 65 impurity elements.
An analysis of the impurity background in the hot zones of single-crucible and multi-crucible VGF setups, factory-made using graphite and dielectric materials from various manufacturers, allowed us to construct a pattern of the impurity distribution across the hot zones. It was found that in the case of materials from SGL CARBON SE and Mersen—FTCAP GmbH, the contamination of the hot zone of the VGF growth setup was 1.5–2 times less compared with the VGF setup built using graphite materials from Karbosil Ltd.
Supplementary Materials
The following supporting information can be downloaded at https://www.mdpi.com/article/10.3390/cryst15121059/s1. Table S1: Impurity concentrations in the collecting cubes before and after the growth process in different parts of the hot zone of the multi-crucible VGF MC setup, determined by ICP-MS; Table S2: Impurity concentrations in the collecting cubes before and after the growth process in different parts of the hot zone of the single-crucible VGF SC setup, determined by ICP-MS.
Author Contributions
Conceptualization, E.M.; methodology, E.V. and E.M.; software, V.S. and O.N.; validation, K.K. and I.A.; formal analysis, E.M.; investigation, E.V., K.K., O.N. and E.M.; resources, I.A.; data curation, E.M.; writing—original draft preparation, I.A. and E.M.; writing—review and editing, O.N. and I.A.; visualization, E.M., V.S. and K.K.; supervision, I.A.; project administration, E.M.; funding acquisition, I.A. All authors have read and agreed to the published version of this manuscript.
Funding
This research was funded by the Ministry of Science and Higher Education of Russia through the project FSSM-2025-0006.
Data Availability Statement
The original contributions presented in this study are included in the article/Supplementary Material. Further inquiries can be directed to the corresponding authors.
Acknowledgments
The authors are grateful to the National Analytic Certification Laboratory of Mendeleev Center of D. Mendeleev University of Chemical Technology of Russia for the ICP-MS measurements.
Conflicts of Interest
The authors declare no conflicts of interest.
References
- Stefan, E.; Thomas, B.; Michael, B.; Rico Rihmann, M.S. Arrangement and Method for Producing a Crystal from the Melt of a Raw Material and Single Crystal. Patent DE 10 2007 026 298 A1, 11 December 2008. [Google Scholar]
- Scheel, H.J.; Fukuda, T. Crystal Growth Technology; Scheel, H.J., Fukuda, T., Eds.; Wiley-VCH: Hoboken, NJ, USA, 2004; p. 694. ISBN 0-471-49524-7. [Google Scholar]
- Gallium Arsenide|CMK Ltd.—The Gallium Arsenide Company. Available online: https://cmk.sk/products/gallium-arsenide/ (accessed on 17 November 2025).
- Ansari Dezfoli, A.R.; Adabavazeh, Z. Adjustment of Oxygen Transport Phenomena for Czochralski Silicon Crystal Growth. Heliyon 2024, 10, e29346. [Google Scholar] [CrossRef] [PubMed]
- GaAs Wafer Technologie—Freiberger Compound Materials. Available online: https://freiberger.com/en/technology/ (accessed on 15 November 2025).
- Shkir, M.; Ganesh, V.; AlFaify, S.; Black, A.; Dieguez, E.; Bhagavannarayana, G. VGF Bulk Growth, Crystalline Perfection and Mechanical Studies of CdZnTe Single Crystal: A Detector Grade Materials. J. Alloys Compd. 2016, 686, 438–446. [Google Scholar] [CrossRef]
- Balbaşı, Ö.B.; Ünal, M.; Genç, A.M.; Çelik, G.; Parlak, M.; Turan, R. Investigation of Seeded Vertical Gradient Freeze (VGF) Growth of CdZnTe Bulk Crystals. J. Cryst. Growth 2022, 584, 126573. [Google Scholar] [CrossRef]
- Robert, T.; Paul, S. (Eds.) CdTe and Related Compounds; Physics, Defects, Hetero-and Nano-Structures, Crystal Growth, Surface and Applications; Elsevier: Amsterdam, The Netherlands, 2010. [Google Scholar]
- Roy, U.N.; Weiler, S.; Stein, J. Growth and Interface Study of 2in Diameter CdZnTe by THM Technique. J. Cryst. Growth 2010, 312, 2840–2845. [Google Scholar] [CrossRef]
- Roy, U.N.; Burger, A.; James, R.B. Growth of CdZnTe Crystals by the Traveling Heater Method. J. Cryst. Growth 2013, 379, 57–62. [Google Scholar] [CrossRef]
- Roy, U.N.; Weiller, S.; Stein, J.; Gueorguiev, A. Unseeded Growth of CdZnTe: In by THM Technique; James, R.B., Franks, L.A., Burger, A., Eds.; SPIE: Bellingham, WA, USA, 2009; p. 74490U. [Google Scholar] [CrossRef]
- Ünal, M.; Turan, R. A Path to Produce High-Performance CdZnTe Crystals for Radiation Detection Applications: Crystal Growth by THM, Surface Preparation, and Electrode Deposition. In High-Z Materials for X-Ray Detection; Springer International Publishing: Cham, Germany, 2023; pp. 227–243. [Google Scholar]
- Iniewski, K. CZT Sensors for Computed Tomography: From Crystal Growth to Image Quality. J. Instrum. 2016, 11, C12034. [Google Scholar] [CrossRef]
- Zhang, S.; Hong, B.; Zheng, L.; Zhang, H.; Wang, C.; Zhao, B. Solution Growth of CdZnTe Crystals for X-Ray Detector. In High-Z Materials for X-Ray Detection: Material Properties and Characterization Techniques; Abbene, L., Iniewski, K., Eds.; Springer International Publishing: Cham, Germany, 2023; pp. 59–85. [Google Scholar] [CrossRef]
- Nefedov, O.; Dovnarovich, A.; Kostikov, V.; Mozhevitina, E.; Bocharnikov, D.; Avetissov, I. Numerical Simulation of CdTe Crystal Growth Using the Vertical Gradient Freeze Technique Assisted by Axial Low-Frequency Oscillations of the Melt. Crystals 2024, 14, 72. [Google Scholar] [CrossRef]
- Dropka, N.; Holena, M.; Thieme, C.; Chou, T. Development of the VGF Crystal Growth Recipe: Intelligent Solutions of Ill-Posed Inverse Problems Using Images and Numerical Data. Cryst. Res. Technol. 2023, 58, 2300125. [Google Scholar] [CrossRef]
- Smart Solutions in Graphites & Fiber Composites|SGL Carbon. Available online: https://www.sglcarbon.com/en/ (accessed on 15 November 2025).
- Rigid and Soft Carbon Insulation Carbon Insulation|Mersen. Available online: https://www.mersen.com/en/products/carbon-insulation/rigid-and-soft-carbon-insulation (accessed on 15 November 2025).
- ETV-ICP-OES The Most Accurate Detection Limits—For High Purity Carbon and Graphite. Available online: https://www.mersen.com/sites/default/files/files_imported/2-gs-etv-icp-oes-mersen.pdf (accessed on 14 November 2025).
- Pruszkowski, E.; Life, P. Total Quant Analysis of Teas and Wines by ICP-MS, Perkin Elmer Life and Analytical Sciences, Field Application Report, ICP Mass Spectrometry, USA. 2004. Available online: https://ru.scribd.com/document/102447386/TotalQuant-Analysis-of-Teas-and-Wines-by-ICP-MS (accessed on 1 July 2021).
- Wilbur, S.M.; Sugiyama, N.; McCurdy, E. Optimizing Performance for a Collision/Reaction Cell ICP-MS System Operating in Helium Collision Mode. Spectrosc. Appl. ICPICP-MS Suppl. 2010, 25, 11. Available online: http://www.spectroscopyonline.com/optimizing-performance-collisionreaction-cell-icp-ms-system-operating-helium-collision-mode (accessed on 30 June 2021).
- Tanner, S.D.; Baranov, V.I.; Bandura, D.R. Reaction Cells and Collision Cells for ICP-MS: A Tutorial Review. Spectrochim. Acta Part B At. Spectrosc. 2002, 57, 1361–1452. [Google Scholar] [CrossRef]
- Karbosil LLC—Official Website|Graphite Production|Carbon Thermal Insulation|Graphite Felt|Carbon-Carbon Composite|UUKM. Available online: https://karbosil.com/ (accessed on 14 November 2025).
- Thermal Components—A Full Range of High-Temperature Products. Available online: https://thermocomponents.ru/ (accessed on 13 November 2025).
Disclaimer/Publisher’s Note: The statements, opinions and data contained in all publications are solely those of the individual author(s) and contributor(s) and not of MDPI and/or the editor(s). MDPI and/or the editor(s) disclaim responsibility for any injury to people or property resulting from any ideas, methods, instructions or products referred to in the content. |
© 2025 by the authors. Licensee MDPI, Basel, Switzerland. This article is an open access article distributed under the terms and conditions of the Creative Commons Attribution (CC BY) license (https://creativecommons.org/licenses/by/4.0/).