Abstract
In this paper, the moving heat transfer boundary method is adopted to establish a three-dimensional solidification microstructure model based on the coupling technology of the cellular automata method (CA) and finite element method (FE), simulate the ingot growth process, and optimize the nucleation parameters. In addition, this study also explored the influence of process parameters such as melting rate, molten pool temperature, and cooling intensity on the solidification structure of ingots, providing a theoretical basis for process optimization. The results show that the maximum nucleation undercooling degree and the maximum nucleation density have significant effects on different crystal regions of the ingot solidification structure, while the maximum nucleation variance has no obvious effect on the changes in the solidification structure. When the maximum bulk nucleus undercooling degree = 4 K, the bulk nucleus standard deviation = 5 K, and the maximum bulk nucleus density = 3 × 10⁷, the simulation results of the solidification structure can be well consistent with the experimental results. With the increase in smelting speed, the number of grains in the ingot structure gradually increases, while the average area of grains gradually decreases. The melting temperature and the intensity of side wall cooling have no obvious influence on the solidification structure of the ingot.
1. Introduction
In pressurized water reactor nuclear power plants, Mn-Ni-Mo series low alloy steel materials are widely used in the manufacturing of nuclear island equipment shells due to their advantages, such as high strength, good toughness, and low price. Among them, 18MND5, with its excellent comprehensive mechanical properties, is a relatively typical steel for nuclear reactor pressure vessels internationally and is widely used in key equipment of nuclear islands [1,2]. In order to ensure product quality and meet the requirements of large-scale ingots, the slab produced by the continuous casting process is refined by the electroslag remelting process. Combined with the characteristics of electrode raw materials and product shape, the bipolar series electroslag furnace is used for production [3,4]. As a secondary refining process, electroslag remelting refines the steel after the initial refining, and the refining object is the consumable electrode. The electroslag remelting process is used to remelt the consumable electrode and achieve the purpose of purification and refining during the melting process. At the same time, because the ingot is solidified layer by layer during the electroslag remelting process, the crystallization structure of the ingot can be improved so as to obtain high-quality metal products [5,6,7,8].
The experimental research equipment and process of electroslag remelting are complicated, the experimental cost is high, and the measured data are relatively difficult. At the same time, with the continuous development of the manufacturing industry, the demand for large electroslag ingots is increasing. It is more difficult to explore the solidification process of large electroslag remelting ingots by traditional research methods, which are not only time-consuming and labor-intensive but also costly. Therefore, metallurgical workers in various countries use mathematical methods to study the experimental results [9,10,11,12,13]. Based on the CAFE method, Lyu Bin et al. [14] used ProCAST to numerically simulate the microstructure of the GCr15 bearing steel ingot produced by the electroslag remelting method. The grain growth process, shape change in the molten pool, and distribution of the crystal zone of the electroslag ingot were obtained, and the influence of different process parameters on the shape of the molten pool and solidification structure was analyzed. An Ruidong et al. [15] established a three-dimensional CAFE model for the microstructure evolution during the electroslag remelting solidification process of GH984G, taking into account both heat transfer and solute diffusion, based on the combination of the CAFE method and C language. They also simulated and predicted the temperature field and microstructure evolution during the solidification process. Shi et al. [16] established an axially symmetric multi-scale and multi-component transient model based on the CAFE method, predicting grain structure and macroscopic segregation by coupling macroscopic phenomena (including fluid flow, heat, and solute transfer) and mesoscopic structure evolution (such as nucleation and grain growth). Yang W et al. [17] took the high filling ratio electroslag remelting ingot of 06Cr18Ni11Ti steel as the research object. By establishing a multiphase and multiphysical field coupling model of the transient electroslag remelting process, they explored the influence of melting rate on the electromagnetic, heat transfer, flow, and solidification behaviors during the electroslag remelting process.
Although many scholars at home and abroad have conducted numerical simulation studies on various electroslag remelting processes of different metal materials, few scholars have carried out systematic and in-depth numerical simulation studies on the solidification structure of bipolar series electroslag remelting slabs [18,19,20]. In this paper, an electroslag remelting solidification microstructure model of an 18MnD5 steel ingot was established. The entire solidification process of the steel ingot was simulated and calculated. The microstructure morphology obtained from the simulation calculation was compared with the actual production results to verify the accuracy of the model. It provides a theoretical basis for the reasonable control of the solidification microstructure of electroslag remelted steel ingots. On this basis, the effects of different electrode melting rates, cooling conditions of the steel ingot side walls, and smelting temperatures on the solidification structure of electroslag remelted steel ingots were further investigated [21,22,23,24,25].
2. Mathematical Model
The CAFE method is a coupling approach of cellular automata technology and finite element technology. Firstly, the macroscopic temperature field of the casting is calculated by the finite element method, and then the microstructure changes are calculated by the cellular automata method. This method can accurately predict processes such as the structure of columnar crystals and equiaxed crystals, the transformation between columnar crystals and equiaxed crystals, and the evolution of crystal structure during solidification. The finite element (FE) heat flow calculation was coupled with the CA model to analyze and predict the nucleation and growth of columnar and equiaxed crystals. This calculation method has been implemented in the Procast (2021 Edition) software. During the solidification simulation process, it is based on the physical mechanism of nucleation and the theory of crystal growth kinetics and uses the principle of randomness to handle the distribution of crystal nuclei and the direction of crystallization, thereby simulating the microstructure of the solidification process. This makes it highly suitable for describing the formation of free dendrites and columnar crystals, as well as the transformation between columnar crystals and equiaural crystals. This paper simulates and calculates the solidification structure of electroslag remelted steel ingots based on the Procast commercial software. The moving boundary method is adopted to describe the gradually rising solid–liquid interface in terms of time and space, thereby simulating the microstructure formed by the layer-by-layer growth of the steel ingot.
2.1. Governing Equations
Electroslag remelting is a process in which the electrode gradually melts, and the steel ingot solidifies simultaneously. The main equations used in the simulation process include the heat transfer equation, solute diffusion equation, nucleation equation, and dendrite growth equation.
The main equations used in the model were as follows:
- (1)
- Heat transfer equation
To simplify the simulation process, the focus was on the calculation of the microstructure simulation. In this model, the heat transfer model was simplified, and the temperature field of the molten pool was recalculated. The heat transfer of the entire steel ingot was described by the heat conduction equation, while the influence of convection was reflected by the effective thermal conductivity. In the three-dimensional rectangular coordinate system, the dominant equation is as follows:
where ρ represents density, kg·m−3; CP is the specific heat capacity, J·kg−1·K−1; T represents temperature, K; k is the thermal conductivity, W m−1·K−1; ST is the latent heat of solidification, J·kg−1; Mz represents the melting rate of the electrode, kg·s−1; Az represents the cross-sectional area of the steel ingot, m2; and Vz represents the rising speed of the slag–metal interface, m·s−1.
- (2)
- Solute diffusion equation
The solute diffusion model in the calculation ignores natural convection in the liquid phase. The diffusion control equations of the solid phase and the liquid phase are as follows:
In the formula, Dl represents the diffusion coefficient of the liquid-phase solute, m2·s−1; k0 is the equilibrium distribution coefficient; fs represents the solid-phase separation rate; and Ds is the diffusion coefficient of the solid-phase solute, m2·s−1.
- (3)
- Nucleation equation
The relationship between grain density and undercooling degree in the continuous nucleation model proposed by Rappza and Gandin [26] is shown in Formula (6), and the influence of liquid phase flow on nucleation is ignored:
At a certain degree of undercooling, the grain density can be calculated by the following formula:
In the formula, n is the grain density; when it is the surface nucleation density, the unit is m−2; when it is the bulk nucleation density, the unit is m−3; ΔT represents the subcooling degree, K; and nmax represents the maximum nucleation density. The unit for the maximum nucleation density of a surface is m−2, and that for a volume is m−3; ΔTσ represents the standard deviation, K; ΔTmax represents the maximum nucleation undercooling degree, K.
- (4)
- Dendrite growth equation
The undercooling degree of dendrite tips is usually composed of the following four parts:
where ΔTc represents the degree of subcooling of the components, K; ΔTl represents the degree of heat undercooling, K; ΔTk represents the degree of dynamic undercooling, K; and ΔTr represents the degree of curvature undercooling, K.
In general, the component undercooling ΔTc plays a major role, and the latter three undercoolings are very small and have little effect. They are usually ignored in the calculation. Therefore, the simplified relationship between the tip growth rate ν and ΔT can be expressed as follows:
a2, a3 is the growth kinetics coefficient, a constant related to the alloy.
2.2. Assumptions and Simplified Mathematical Model
In view of the characteristics of the numerical simulation in this paper, the boundary conditions and related physical parameters of electroslag remelting are simplified as follows:
- (1)
- The process from remelting to stabilization, assuming that the temperature of the slag pool is uniform;
- (2)
- Assume that the thickness of the slag shell on the side surface of the steel ingot is uniform;
- (3)
- The convective heat transfer problem in the metal molten pool is reflected by the effective thermal conductivity;
- (4)
- The formation of shrinkage porosity and shrinkage cavities was not taken into account in the calculation of the solidification structure.
2.3. Model and Its Related Parameters
The ingot in this study is cuboid, so in order to simplify the calculation, a quarter of the whole ingot is taken as the research object, as shown in Figure 1. Firstly, the solid modeling is carried out in the drawing software Solidworks 2024, the geometric model is established, and then the mesh is divided into the Procast.
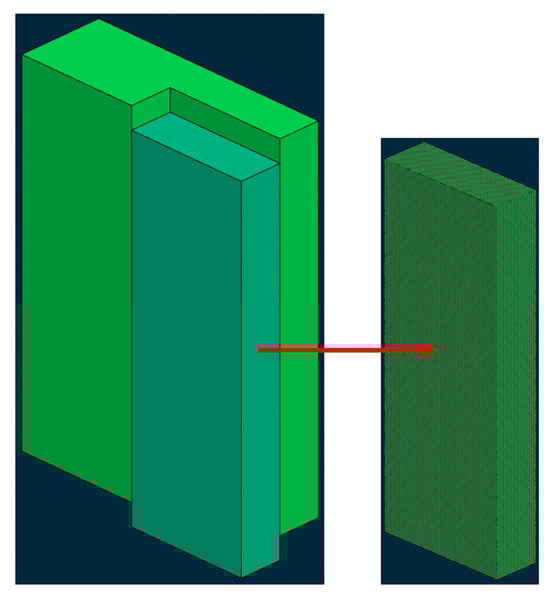
Figure 1.
Geometric model and mesh division.
The relevant parameters of the model are shown in Table 1.

Table 1.
Model correlation parameter.
2.4. Boundary Conditions
At the initial stage of solidification, assuming the initial temperature is the liquidus temperature of the steel, the boundary conditions are divided into the slag–metal interface, the side of the steel ingot, and the bottom of the steel ingot, as shown in Table 2.
Table 2.
Electromagnetic physical property parameters of materials.
Among them, and respectively represent the average temperature of the slag pool and the average temperature of the cooling water at the bottom of the mold. , and respectively represent the heat transfer coefficient at the slag–metal interface, the heat transfer coefficient on the side of the steel ingot, and the heat transfer coefficient at the bottom of the steel ingot, and represents the thermal conductivity of the steel ingot. The heat transfer coefficient on the side of the steel ingot is a function that varies with the height from the slag–metal interface.
2.5. Material Physical Property Parameters
The 18MnD5 steel in this study can be decomposed into multiple binary alloy systems such as Fe-C, Fe-Si, Fe-Mn, and Fe-Cr. The physical parameters of this steel grade were calculated using the Hill model based on the Procast thermodynamic database. The relationships of thermal conductivity, viscosity, enthalpy, density, etc., with temperature are shown in Figure 2.
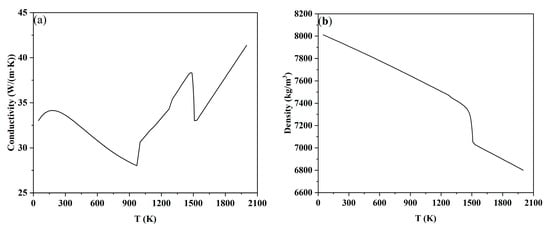
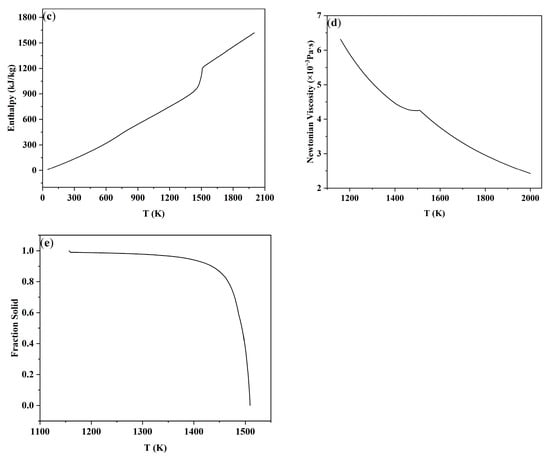
Figure 2.
Physical property parameters of 18MnD5 steel calculated by the model: (a) thermal conductivity, (b) density, (c) enthalpy, (d) viscosity, and (e) fraction solid.
3. Results and Discussion
3.1. The Influence of Nucleation Parameters on the Solidification Structure of Ingots
To obtain accurate nucleation parameters, the influence of different nucleation parameters on the solidification structure was studied in this paper. Two sets of different nucleation parameters are used on the surface and inside of the ingot. To simplify the calculation, this paper only studies the bulk nuclear parameters that have a significant impact on the solidification structure of the ingot. The surface nucleation parameters are all taken as fixed values: the maximum surface nucleation subcooling degree = 10 K, the standard deviation of the surface nucleation = 5 K, and the maximum surface nucleation density = 1 × 10⁶.
To study the influence of three core parameters, namely the maximum core undercooling degree , the core standard deviation , and the maximum core density , on the solidification microstructure, seven schemes were set up in the simulation calculation for comparative analysis, as shown in Table 3. Among them, schemes a, b, and c are schemes under different maximum nuclear subcooling degrees; schemes d, b, and e are schemes with different maximum nuclear densities; and schemes f, b, and g are schemes under different maximum nuclear standard deviations.
Table 3.
Calculation scheme of different bulk nucleation parameters.
3.1.1. Effect of Maximum Nucleation Undercooling on Solidification Structure
In order to study the effect of the maximum nucleation undercooling on the solid phase structure of the ingot, the maximum nucleation undercoolings of schemes a, b, and c are set to 1, 4, and 8 K, respectively, and other nucleation parameters and process parameters remain unchanged. Figure 3 is the comparison of solidification structure under different maximum nuclear undercooling on the longitudinal section of the model after solidification. It can be seen from the figure that the solidification structure is divided into an obvious columnar crystal zone and a central equiaxed crystal zone. With the increase in the maximum nucleation undercooling, the proportion of columnar crystals in the solidification structure gradually increases, and the proportion of central equiaxed crystals gradually decreases. At the same time, columnar crystals and central equiaxed crystals gradually become larger.
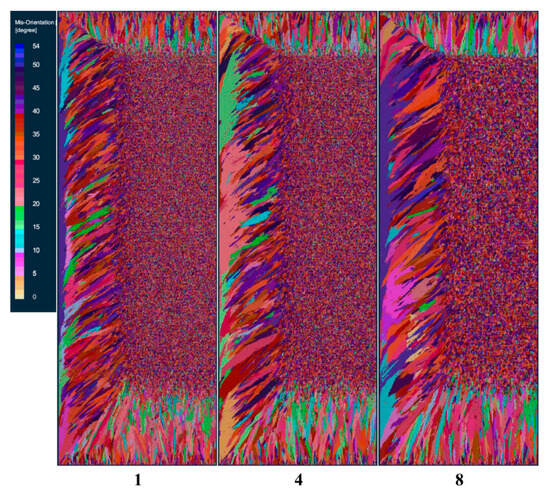
Figure 3.
Changes in solidified structures at different maximum nucleation undercooling degrees.
Figure 4 shows the comparison of the statistical results of the number of grains and the average area of grains at different maximum nucleation undercooling degrees at the longitudinal section of the model at the end of solidification. It can be intuitively seen from the figure that when the maximum nucleation undercooling degree increased from 1 K to 8 K, the number of grains in the solidified structure decreased sharply from 52,871 to 18,518, with a reduction rate of 65.0%. The average grain area increased from 0.584 cm2 to 1.667 cm2, and the increase was equally significant.
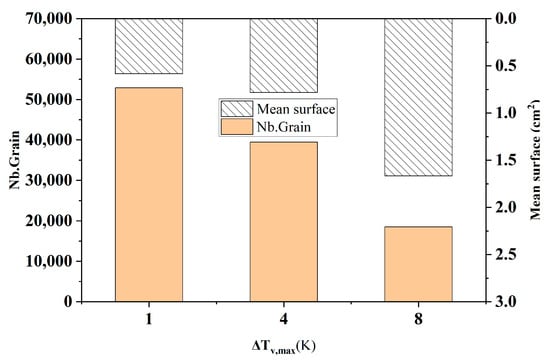
Figure 4.
Comparison of grain number and average grain area at different maximum nucleation subcooling degrees.
3.1.2. Effect of Maximum Nucleation Density on Solidification Structure
To study the influence of the maximum bulk nucleation density on the solidification structure of ingots, under the condition that other nucleation parameters and process parameters remain unchanged, schemes d, b, and e set the maximum bulk nucleation density to 3 × 10⁶, 3 × 10⁷, and 3 × 10⁸, respectively, for solidification structure calculation.
Figure 5 shows the comparison of solidification structures at different maximum bulk nucleation densities at the longitudinal section of the model after smelting. It can be seen from the figure that when the maximum bulk nucleation density is 3 × 10⁶, the columnar crystal zone and the central equiaxed crystal zone of the solidified structure are relatively coarse. When the maximum bulk nucleation density increases to 3 × 10⁷, the grains are obviously refined. When the maximum nucleation density is further increased to 3 × 10⁸, the equiaxed grain zone in the center of the solidification structure becomes larger, the grains in the equiaxed grain zone become very small, and the columnar grain zone becomes smaller. This shows that as the nucleation density of the grains in the melt increases, the grain size becomes smaller in a certain cross-section, the equiaxed grain zone gradually increases, and the columnar grain zone is suppressed.
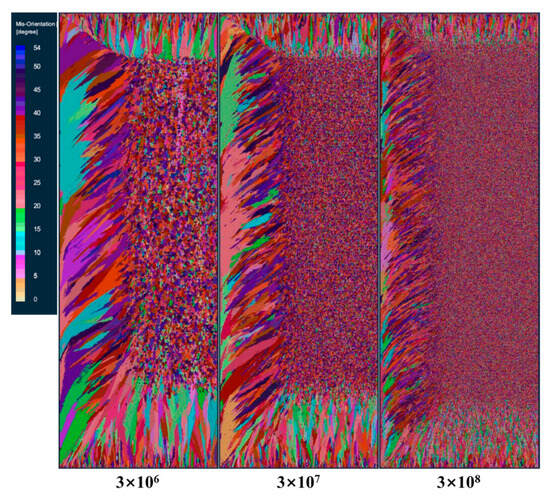
Figure 5.
Solidification microstructure at different maximum bulk nucleation densities.
Figure 6 shows the comparison of the statistical results of the number of grains and the average area of grains at different maximum bulk nucleation densities at the longitudinal section of the model at the end of solidification. It can be seen from the figure that when the maximum nucleation density increases from 3 × 10⁶ to 3 × 10⁸, the number of grains in the solidified structure increases sharply from 10,505 to 222,101, with an increase of 95.3%. The average area of grains decreased from 2.94 cm2 to 0.139 cm2, and the decrease was also obvious. This corresponds to the simulation results of Figure 5.
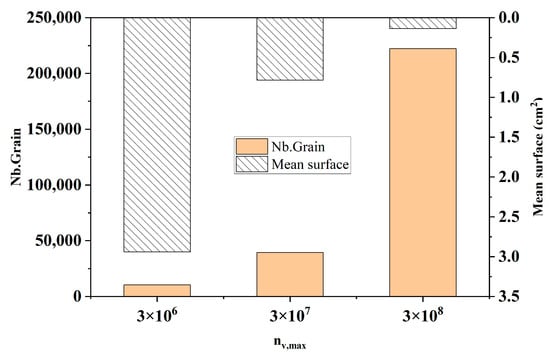
Figure 6.
Changes in grain number and average grain area at different maximum bulk nucleation densities.
3.1.3. The Influence of the Standard Deviation of the Maximum Body Nucleation on the Solidification Structure
To study the influence of the maximum nucleation standard deviation on the solidification structure of ingots, under the condition that other nucleation parameters and process parameters remain unchanged, schemes f, b, and g set the maximum nucleation standard deviation at 1 K, 5 K, and 10 K, respectively, for solidification structure calculation. Figure 7 shows the comparison of solidification structures at different maximum nucleation standard deviations at the longitudinal section of the model after smelting. It can be seen from the figure that the standard deviation of the maximum body nucleation increased from 1 K to 10 K, and the solidification structure did not change significantly.
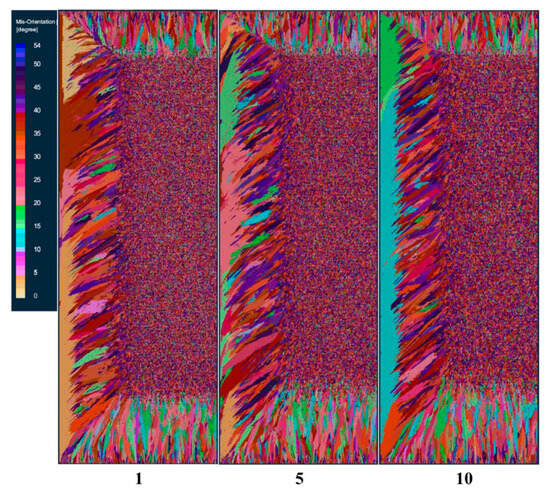
Figure 7.
Solidification microstructure at different maximum nucleation standard deviations.
Figure 8 shows the comparison of the statistical results of the number of grains and the average area of grains at different maximum nucleation standard deviations at the longitudinal section of the model after solidification. It can be seen from the figure that with the increase in the standard deviation of the maximum nucleation, the number of grains in the solidified structure was 40,078, 39,445, and 37,280, respectively, which decreased slightly by 1.6% and 5.5%, respectively. The average grain area was 0.771 cm2, 0.783 cm2 and 0.828 cm2, respectively, which increased slightly. This shows that the maximum body nucleation variance has no obvious effect on the change in solidification structure.
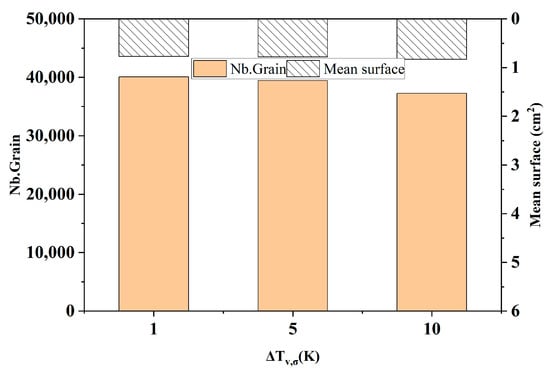
Figure 8.
Changes in grain number and average grain area at different maximum nucleation standard deviations.
3.2. Model Validation
In order to determine the nucleation parameters of the ingot solidification structure simulation, it is necessary to compare and verify the simulation results with the actual production results. The experimental furnace was smelted using the same process parameters as the numerical simulation. After the smelting, the longitudinal section of the ingot was subjected to low-magnification analysis to obtain the solidification structure of the ingot. As the actual production cast billet was too large, a low-magnification experiment was conducted by taking 1/4 of the narrow surface at the center of the cast billet. Figure 9 shows the sampling position of the ingot and the comparison between the low-magnification experimental results of the solidification structure and the simulation results. The core parameters used in the simulation are the maximum core undercooling = 4 K, core standard deviation = 5 K, and maximum core density = 3 × 10⁷. The solidification structure simulation results using this nucleation parameter are in good agreement with the experimental results and can accurately reflect the distribution position, proportion, and size of equiaxed crystals and columnar crystals, etc.
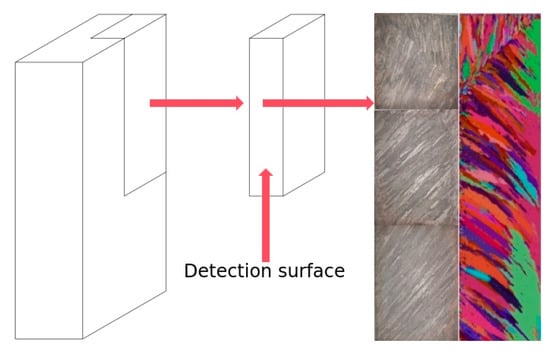
Figure 9.
The sampling position of the ingot and the comparison between the low-magnification experimental results of the solidification structure and the simulation results.
3.3. The Changes in Temperature Field, Solid Fraction, and Solidification Structure During the Electroslag Remelting Process
3.3.1. The Changes in Temperature Field and Solid Fraction During the Melting Process
Figure 10 and Figure 11, respectively, show the temperature field and solid phase rate distribution at different times at the longitudinal section of the model during the smelting process. It can be seen from the picture that at the beginning of the smelting stage, as the bottom of the mold can effectively cool the molten pool, the molten metal solidifies rapidly after entering the mold, forming a flat and relatively shallow molten pool. As the ingot gradually increases in height, the heat transfer to the bottom of the mold is slowed down. The heat dissipated through the mold is less than the heat released by the solidification of the molten metal. The accumulation of heat causes the molten pool to gradually deepen. As the depth of the molten pool increases, the contact area between the molten pool and the mold wall expands. The generation and dissipation of heat within the ingot gradually reach equilibrium, forming a stable molten pool. After that, the shape and depth of the molten pool no longer undergo significant changes until the melting is completed. After the electrode was completely melted, the top surface of the ingot began to solidify under the influence of radiant heat transfer, and the liquid core gradually contracted until it was completely solidified.
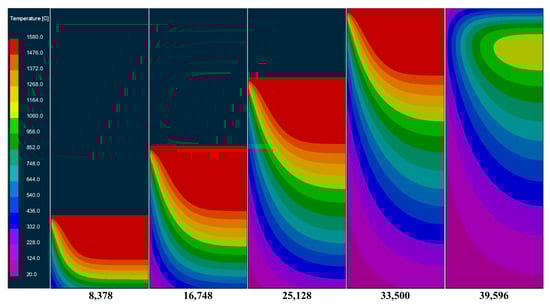
Figure 10.
Temperature field changes at different times in the longitudinal section of the model during melting.
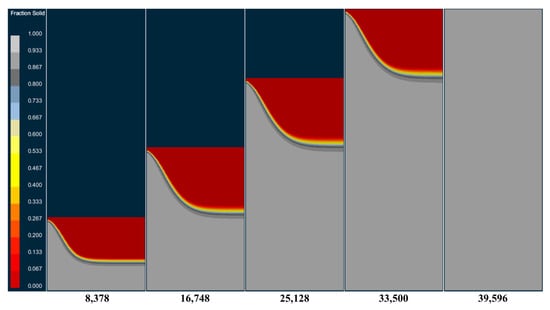
Figure 11.
Changes in solid phase ratio at different times in the longitudinal section of the model during melting.
3.3.2. The Change in Solidification Structure During the Electroslag Remelting Process
The solidification microstructure of steel ingots at different times during the electroslag remelting process is shown in Figure 12. At the initial stage of smelting, a very thin layer of fine equiaxed crystal zone rapidly forms on the surface of the mold, and at this time, the shape of the metal molten pool is shallow and flat. As the solidification height increases, a large amount of heat is transferred from the bottom water tank, with a significant temperature gradient radially, and columnar crystal zones appear on the bottom surface. As the smelting progresses, the slag–metal interface keeps rising, and the depth of the metal molten pool also increases continuously. U-shaped columnar crystal zones appear on both sides of the steel ingot. Due to the large cross-section of the ingot, a large isothermal zone is formed in the middle area of the ingot, thus forming an equiaxed crystal zone. After the smelting is completed, the top of the steel ingot solidifies relatively slowly due to the insulation effect of the slag pool. The heat dissipation from the top of the steel ingot mainly relies on the thermal radiation of the air in the slag pool. Therefore, at the end of the solidification of the steel ingot, columnar crystals that grow downward from the top of the steel ingot are formed.
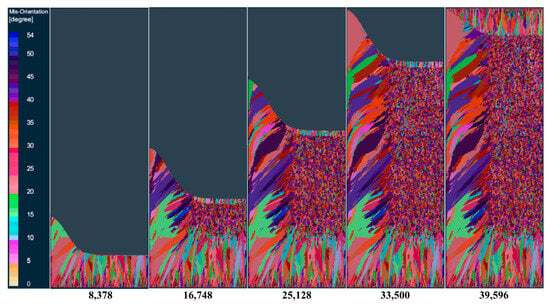
Figure 12.
Changes in the solidification structure of the ingot at different times in the longitudinal section of the model during melting.
3.4. Effect of Smelting Process Parameters on Solidification Structure
In this study, the effects of melting process parameters on the solidification structure of ingots were studied from three aspects: melting speed, melting temperature, and sidewall cooling strength. To quantitatively illustrate the functions of the three parameters, seven calculation schemes were adopted for comparison in the simulation calculation, as shown in Table 4. Among them, schemes 1, 2, and 3 are examples under different melting speeds; schemes 2, 4, and 5 are examples under different melting temperatures; and schemes 2, 6, and 7 are examples under different sidewall cooling intensities.
Table 4.
Calculation schemes under different melting processes.
3.4.1. Effect of Melting Speed on Solidification Structure
Figure 13 shows the comparison of the changes in the number of grains and the average area of grains in the solidified structure under different melting speeds. It can be seen from the figure that with the increase in melting speed, the number of grains in the ingot structure increases gradually, and the average area of grains decreases gradually. When the melting speed increases from 0.068 mm/s to 0.088 mm/s, the grain number increases by 15.9%. When the melting speed increases from 0.088 mm/s to 0.108 mm/s, the grain number increases by 5.7%. This shows that with the increase in melting speed, the rate of increase in grain number decreases gradually. The change in average grain area shows the opposite law.
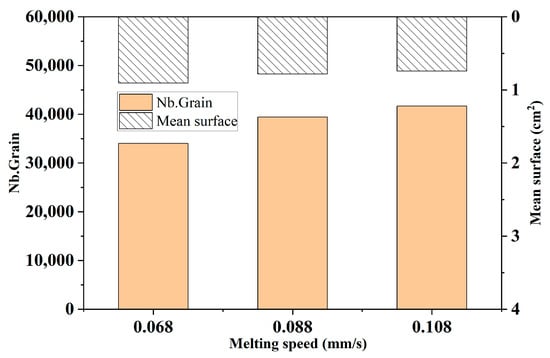
Figure 13.
Comparison of grain number and average grain area in the solidified microstructure of ingots at different melting speeds.
3.4.2. Effect of Melting Temperature on Solidification Structure
Figure 14 shows the comparison of the number of grains and the average area of grains in the solidification structure of ingots under different melting temperatures. It can be seen from the figure that when the melting temperature increases, the number of ingot grains slightly decreases, which indicates that the change in melting temperature has a relatively small impact on the solidification structure.
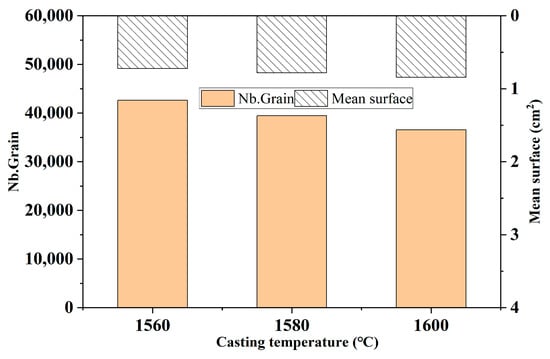
Figure 14.
Comparison of grain number and average grain area in the solidification structure of the ingot at different melting temperatures.
3.4.3. Effect of Sidewall Cooling Intensity on Solidification Structure
Figure 15 shows the comparison of the number of grains and the average area of grains in the solidification structure of ingots under different side wall cooling intensities. It can be seen from the figure that, as the cooling intensity of the side wall of the ingot increases, the number of ingot grains changes very little, which indicates that the change in the cooling intensity of the ingot has a relatively small impact on the solidification structure.
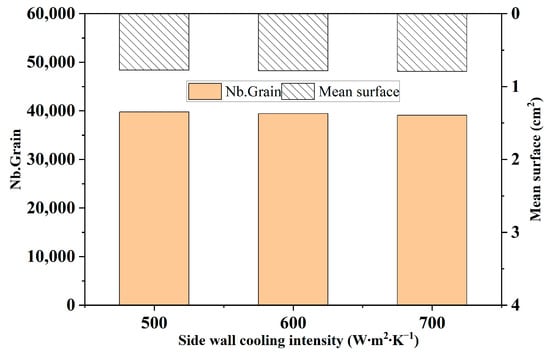
Figure 15.
Comparison of grain number and average grain area in the solidified microstructure of ingots under different sidewall cooling intensities.
4. Conclusions
- (1)
- The maximum nucleation undercooling degree has a significant impact on different crystal regions of the ingot solidification structure. The greater the maximum nucleation undercooling degree, the larger the proportion of columnar crystal regions in the ingot solidification structure. When the maximum nucleation undercooling degree increased from 1 K to 8 K, the number of grains in the solidified structure decreased sharply from 52,871 to 18,518, with a reduction rate of 65.0%.
- (2)
- As the maximum bulk density increases, the equiaxed crystal regions gradually expand, the grain size decreases, and the columnar crystal regions are suppressed and correspondingly reduced. When the maximum bulk density increased from 3 × 10⁶ to 3 × 10⁸, the number of grains in the solidified structure rose sharply from 10,505 to 222,101, with an increase rate of 95.3%. The maximum size nuclear variance has no obvious influence on the changes in the solidified structure.
- (3)
- When the maximum bulk nucleus undercooling degree = 4 K, the standard deviation of the bulk nucleus = 5 K, and the maximum bulk nucleus density = 3 × 10⁷, the simulation results of the solidification structure can be well consistent with the experimental results.
- (4)
- With the increase in melting speed, the overall morphology of the ingot structure remains basically the same, the number of grains in the ingot structure gradually increases, while the average area of grains gradually decreases. The melting temperature and the intensity of side wall cooling have no obvious influence on the solidification structure of the ingot.
Author Contributions
Simulations, formal analysis, and validation, Q.L. and Z.J.; review, editing, and experiments, Y.D.; conceptualization, supervision, and project administration, Y.S. All authors have read and agreed to the published version of the manuscript.
Funding
This research received no external funding.
Data Availability Statement
The original contributions presented in this study are included in the article. Further inquiries can be directed to the corresponding authors.
Conflicts of Interest
Author Qi Li was employed by the company Shanghai Electric SHMP Casting & Forging Co., Ltd. The remaining authors declare that the research was conducted in the absence of any commercial or financial relationships that could be construed as a potential conflict of interest.
References
- Wang, L.; Liu, F.; You, L.; Zeng, X.; Hu, Y. Safety evolution and investigation of dynamic strain aging effect on tensile property of 18MND5 low alloy steel used in nuclear island equipment. At. Energy Sci. Technol. 2018, 52, 1831. [Google Scholar] [CrossRef]
- Liu, X.; Wang, J.; Jia, W.; Gao, J.; Zhao, L.; Tang, Z. Modeling electroslag remelting process of large ingot for nuclear power station and its application. Foundry 2010, 59, 1315–1319. [Google Scholar]
- Dong, Y.; Jiang, Z.; Liu, H.; Chen, R.; Song, Z. Simulation of multi-electrode ESR process for manufacturing large ingot. ISIJ Int. 2012, 52, 2226–2234. [Google Scholar] [CrossRef]
- Li, B.; Wang, B.; Tsukihashi, F. Modeling of electromagnetic field and liquid metal pool shape in an electroslag remelting process with two series-connected electrodes. Metall. Mater. Trans. B 2014, 45, 1122–1132. [Google Scholar] [CrossRef]
- Li, Z. Development process, current situation and trends of electroslag metallurgy. J. Mater. Metall. 2011, 10, 1–7. [Google Scholar] [CrossRef]
- Wang, Y.; Chen, C.; Ren, R.; Xue, Z.; Wang, H.; Zhang, Y.; Wang, J.; Wang, J.; Chen, L.; Mu, W. Ferrite formation and decomposition in 316H austenitic stainless steel electro slag remelting ingot for nuclear power applications. Mater. Charact. 2024, 218, 114581. [Google Scholar] [CrossRef]
- Wang, Y.; Gao, G. Features and application of electroslag metallurgy process. Metall. Equip. 2010, S1, 54–56. [Google Scholar]
- Li, C.; Xu, Y.; Han, D.; Fan, G.; Yang, C. Study on properties of 18MND5 steel forgings for PWR steam generator. J. Phys. Conf. Ser. 2021, 2085, 012034. [Google Scholar]
- Li, B.; Wang, F.; Tsukihashi, F. Current, magnetic field and joule heating in electroslag remelting processes. ISIJ Int. 2012, 52, 1289–1295. [Google Scholar] [CrossRef]
- Du, J.; Lv, X.; Dong, J.; Sun, W.; Bi, Z.; Zhao, G.; Deng, Q.; Cui, C.; Ma, H.; Zhang, B. Research progress of wrought superalloys in China. Acta Metall. Sin. 2019, 55, 1115–1132. [Google Scholar] [CrossRef]
- Chen, M.; Li, B.; Zhao, L. The cellular automata model of electroslag remelting ingot structure. J. Mater. Metall. 2011, 10 (Suppl. S1), 139–146. [Google Scholar] [CrossRef]
- Kharicha, A.; Karimi--Sibaki, E.; Wu, M.; Ludwig, A.; Bohacek, J. Review on modeling and simulation of electroslag remelting. Steel Res. Int. 2018, 89, 1700100. [Google Scholar]
- Cao, H.; Yang, W.; Li, Y.; Huang, X.; Liu, Z.; Li, B. Review on Macrosegregation in Electroslag Remelting Ingot. Steel Res. Int. 2025, 2500593. [Google Scholar] [CrossRef]
- Lv, B.; Li, Z.; Yang, Z.; Liu, X.; Li, W.; Han, J. Effect of ESR Process on the Solidification Structure of GCr15 Bearing Steel. Mater. Rep. 2021, 35, 24134–24141. [Google Scholar] [CrossRef]
- An, R.; Liu, F.; Chen, K.; Gao, J.; Kang, C.; Jiang, Z. CAFE Simulation of Electroslag Remeling GH984G Directional Solidification Structure. Iron Steel 2021, 56, 56–64+71. [Google Scholar] [CrossRef]
- Shi, H.; Chen, Q.; Li, K.; Shen, H. Numerical simulation of grain structure and macrosegregation of electroslag remelting process based on cellular automaton-finite element method. Metall. Mater. Trans. B 2022, 53, 107–120. [Google Scholar] [CrossRef]
- Yang, W.; Liu, Z.; Wang, F.; Huang, X.; Lang, Y.; Li, B. Effect of Melting Rate on Solidification Process of High Filled Ratio 06Cr18Ni11Ti Electroslag Remelting Ingot. Spec. Steel 2024, 45, 28–36. [Google Scholar] [CrossRef]
- Yang, W.; Liu, Z.; An, T.; Li, Y.; Wang, F.; Li, B.; Chi, H. Effect of Melting Rate on Macrosegregation Behavior in the Electroslag Remelting Process of 06Cr18Ni11Ti. Metall. Mater. Trans. B 2025, 56, 3214–3229. [Google Scholar] [CrossRef]
- Wu, J.; Wang, F.; Li, S.; Liu, Z.; Li, B. Numerical Simulation of Solidification Mmicrostructure of Electroslag Remelted Alloy for Heavy-duty Gas Turbine Engine Turbine Disk. J. Mater. Metall. 2025, 24, 15–23. [Google Scholar] [CrossRef]
- Wang, Y.; Chen, C.; Yang, X.; Zhang, Z.-R.; Wang, J.; Li, Z.; Chen, L.; Mu, W.-Z. Solidification modes and delta-ferrite of two types 316L stainless steels: A combination of as-cast microstructure and HT-CLSM research. J. Iron Steel Res. Int. 2025, 32, 426–436. [Google Scholar] [CrossRef]
- Zhong, J.; Jiang, H.; Dong, J. Influence of Melting Parameters on the Electroslag Remelting Process of GH4151 Alloy. Spec. Steel 2025, 46, 18–27. [Google Scholar] [CrossRef]
- Li, X.; Li, W.; Zou, X.; Li, Z.; Zang, X. Evolution law of slag shell in bipolar tandem electroslag remelting process. Iron Steel 2024, 59, 89–101. [Google Scholar] [CrossRef]
- Yan, Y.; Gu, Y.; Jia, L.; Zhao, P.; Li, M.; Yang, S. Microstructure Evolution Behavior in Electroslag Remelting Ingot of GH3536 Alloy. China Metall. 2024, 34, 59–71+87. [Google Scholar] [CrossRef]
- Jia, L.; Cui, H.; Yang, S.; Lv, S.; Xie, X.; Qu, J.; Miao, Q. Numerical simulation and process optimization of Ni-based GH4151 superalloy for electroslag remelting. Chin. J. Nonferrous Met. 2023, 33, 2873–2889. [Google Scholar] [CrossRef]
- Chen, L.; Wang, Y.; Li, Y.; Zhang, Z.; Xue, Z.; Ban, X.; Hu, C.; Li, H.; Tian, J.; Mu, W.; et al. Effect of Nickel Content and Cooling Rate on the Microstructure of as Cast 316 Stainless Steels. Crystals 2025, 15, 168. [Google Scholar] [CrossRef]
- Rappaz, M.; Gandin, C.-A. Probabilistic modelling of microstructure formation in solidification processes. Acta Metall. Mater. 1993, 41, 345–360. [Google Scholar] [CrossRef]
Disclaimer/Publisher’s Note: The statements, opinions and data contained in all publications are solely those of the individual author(s) and contributor(s) and not of MDPI and/or the editor(s). MDPI and/or the editor(s) disclaim responsibility for any injury to people or property resulting from any ideas, methods, instructions or products referred to in the content. |
© 2025 by the authors. Licensee MDPI, Basel, Switzerland. This article is an open access article distributed under the terms and conditions of the Creative Commons Attribution (CC BY) license (https://creativecommons.org/licenses/by/4.0/).