Abstract
Two single-crystal X-ray structure determinations of 2-aminopyrimidinium hydrogen tri oxofluorophosphate, (C4H6N3)+·(HFO3P)−, (I), and bis(2-aminopyrimidinium) trioxofluorophosphate, 2(C4H6N3)+·(FO3P)2−, (II), as well as their vibration spectra (FTIR on powder samples and the Raman spectra on unoriented single crystals) with a detailed assignment of vibrational modes are reported. The structure (I) consists of one independent 2-aminopyrimidinium cation and one hydrogen trioxofluorophosphate anion, while (II) consists of two symmetry independent 2-aminopyrimidinium cations and one trioxofluorophosphate anion. In (I), there is an O-H···O hydrogen bond of a moderate strength. A pair of these hydrogen bonds is situated about the symmetry centre and involved in the graph set motif R22(8). There are also N-H···O hydrogen bonds of a moderate strength, which are present in both structures while being involved in the graph set motifs R22(8), too. In addition, the N-H···O hydrogen bonds form R34(10) graph set motifs in (II). The latter motifs form ribbons which propagate parallel to the unit-cell axis a. In both structures, there are present π···π-electron ring interactions into which the primary amine groups are involved. In both structures, there are also present weak C-H···N hydrogen bonds with participation of the non-protonated ring N-atoms. The fluorine participates in the C-H···F hydrogen bonds in both title structures. The P-F distances are normal in both anions. The structure (I) differs from the known structure of 2-aminopyrimidinium hydrogen phosphite, the compositional isomer, though the main hydrogen bonds show similar geometry in both structures. The crystal of (I) was twinned.
1. Introduction
Crystals with non-linear optical properties attract continuous interest for possible wide-range applications. This situation provoked hunt for structures with such desired properties. Probability of finding new structures with the desired properties in this field of concern is enhanced by presence of the cations with lone pairs as well as by presence of ions with π-electron conjugated bonds, especially if they are coplanar. The more polarizable are the structural units the better, e.g., [,].
Compounds with 2-aminopyrimidinium cation fit to this scheme and they have been studied for different reasons. The first one was motivated by studies of the hydrogen bonds as it is testified by the following examples: 2-aminopyrinmidine-succinic acid (1/1) [], 2,4,6-trinitrobemoic acid 2-aminopyrimidine []; 2-aminopyrimidinium salicylate [], 2-aminopyridinium 2,6-dihydroxybenzoate [], 2-aminopyrimidine (3,4-dichlorophenoxy)acetic acid [], 2-aminopyrimidine bis (phenoxyacetic acid) [], 2-aminopyrimidine 4-aminobenzoic acid [], 2-aminopyrimidinium 2,6-dihydroxybenzoate []. It was recognized that the prominent feature of the hydrogen bonding of the 2-aminopyrimidinium cation with carboxylic acids is the formation of the graph set motifs R22 (8), in which the hydrogen bonds Nprimary-H···O [,] or Nprimary-H···O [] and O-H···Nsecondary [] participate.
The hydrogen bonding affects the way in which constituting molecules are arranged and, therefore, 2-aminopyrimidine is a suitable candidate for studying crystal structures from the aspect of supramolecular chemistry. A few examples of studies of this kind are given: [,,,,].
Moreover, there has been observed non-linear optical activity in the adduct of 2-aminopyrimidine-boric acid (3/2), (C4H5N3)3(H3BO3)2, with the space group P3221 [] and in 2-aminopyrimidinium hydrogen phosphite, (C4H6N3)+(H2PO3)−, with the space group P21 []. The same structure was redetermined by Matulková et al. [] at 150 K. In [], the phase matching condition for the second harmonic generation (SHG) as well as anomalous dispersion of the refractive indices in 2-aminopyrimidinium hydrogen phosphite has been determined, too. The structure published in [] used inaptly applied refinement constraints for O-H and N-H distances, and therefore, the preference is given to the structural model which is given in [].
There are known structures where the hydrogen phosphite/phosphite anion can be substituted by the hydrogen trioxofluorophosphate/trioxofluorophosphate, see [,,]. The mixed structures tend to form isomorphic (crystal-chemically isotypic) structures []. Therefore, the hydrogen trioxofluorophosphate anion has been selected for the present study with the hope that the 2-aminopyrimidinium hydrogen trioxofluorophosphate would also be non-centrosymmetric while showing non-linear optical activity. The motivation for the synthesis of the title structures was also supported by the tendency of trioxofluorophosphates to show non-linear optical properties [].
However, it turned out that both title structures, (I) and (II), are centrosymmetric. Moreover, the title structure 2-aminopyrimidinium hydrogen trioxofluorophosphate, (I), is not structurally isomorphous to the known 2-aminopyrimidinium hydrogen phosphite [,]. As it has already been stated above, the latter structure is non-centrosymmetric in contrast to (I) despite the fact that both structures share similar structural features, namely the hydrogen bonds of the primary and secondary amine groups N-H···O, which are involved in the graph set motifs R22(8). The schemes of the title compounds are as follows (Scheme 1):
Scheme 1.
Schemes of the title compounds (I) and (II).
2. Materials and Methods
2.1. Synthesis and Crystallization
The 2-aminopyrimidine (97%, Aldrich) was purified by active carbon and repeated crystallizations. The title crystals were prepared by neutralization of water solution of 2-aminopyrimidine by H2PO3F in stoichiometric ratios of 2-aminopyrimidine: H2PO3F 4:1, 3:1, 2:1 and 1:1. H2PO3F was prepared by exchange of water-diluted (NH4)2PO3F·H2O on a column filled with cation-exchange resin (Amberlite) in the H-cycle and immediately and quantitatively added drop-by-drop into water solution of 2-aminopyrimidine. [(NH4)2PO3F·H2O was prepared by a method described in [], then the product was recrystallized from water; it turned out that our product transformed into a mixture of (NH4)2PO3F·H2O and (NH4)2PO3F in the molar ratio 7:3; this ratio was determined by a powder diffraction experiment. [The determined stoichiometry of (NH4)2PO3F·H2O and (NH4)2PO3F was taken into account during preparation of the title structures.] The mixed solutions of H2PO3F and 2-aminopyrimidine were concentrated over P2O5 in a desiccator until crystals developed in several weeks.
An overview of the amounts of the used reactants for preparation of the title structures is given in Table S1 (Supplementary Materials). Table S2 (Supplementary Materials) contains information about preparation of the related system of 2-aminopyrimidine and H3PO3. All the prepared crystals were colourless and transparent. (C4H6N3)+.(H2O3P)− and (C4H6N3)+.(HFO3P)- seem not to be hygroscopic while forming needles, the length of which was about 1 mm. (C4H6N3)+2·(FO3P)2− is hygroscopic and forms plates of several mm of length. The plates were about 0.3 mm thick. (C4H6N3)+.(HFO3P)− seems to be harder than (C4H6N3)+2·(FO3P)2−.
2.2. Structure Determination and Refinement
Information about the crystal data, experiment and indicators of the refinement are given in Table 1. The phase problem was solved by SUPERFLIP [] and SIR97 [] for (C4H6N3)+.(HFO3P) −, (I), and (C4H6N3)+2(FO3P)2−, (II), respectively.
Table 1.
Experimental details.
The structure was refined by JANA 2006 []. All the hydrogens were discernible in the difference electron density maps. The aryl hydrogens were constrained using Caryl-Haryl = 0.95 Å while Uiso(Haryl) = 1.2Ueq(Caryl) for both structures. The coordinates of the primary and the secondary amine hydrogens were refined freely while their displacement parameters were constrained by the condition Uiso(Hamine) = 1.2Ueq(Namine). The coordinates of the hydroxyl hydrogen in (I) were refined freely while its displacement parameter was constrained by the condition Uiso(Hhydroxyl) = 1.5Ueq(Ohydroxyl). Other computer programs: Bruker Instrument Service 2, Saint []–data collection and reduction, SADABS []–absorption correction, DIAMOND [], PLATON [], Origin 6.1 []–graphics. The structure (I) was twinned by non-merohedral twinning. The twinning matrix was determined by the program Bruker Instrument Service 2, Saint []. The twinning matrix and the proportion of the minor domain state are given in Table 1.
Supplementary publications CCDC 2471957 and CCDC 2280620 for 2-aminopyrimidinium hydrogen trioxofluorophosphate and bis (2-aminopyrimidinium) trioxofluorophosphate, respectively, were deposited by the Cambridge Crystallographic Data Centre. The data can be obtained free of charge from the via www.ccdc.cam.ac.uk/data_request/cif, accessed on 11 July 2025.
2.3. Vibrational Spectroscopy Instrument
The single crystals, which had been previously used for the crystal structure determination, were measured by a Raman microscope in arbitrary positions. The obtained Raman spectra were compared with carefully selected crystals from the crystallization mixture. In this way we obtained the single-phase Raman spectra on unoriented crystals of the title phases.
These crystals which had been used for the Raman spectroscopy were crushed and their powder was used for Fourier transform infrared spectroscopy (FTIR spectroscopy).
The Raman spectra of unoriented single crystals were collected by a Thermo Scientific DXR Raman microscope interfaced to an Olympus microscope (objective 50×) in the 50–3410 cm−1 spectral region using frequency-stabilized 780 nm single-mode diode laser excitation. The gratings with 400 lines/mm were used. The spectrometer was calibrated by a software-controlled calibration procedure [] employing multiple neon emission lines (wavelength calibration), multiple polystyrene Raman bands (laser frequency calibration) and standardized white light sources (intensity calibration).
The Fourier transform infrared spectra (FTIR spectra) of the powder samples were recorded by a Thermo Fisher Scientific (Madison, WI, USA) Nicolet iS50 FTIR spectrometer (4 cm−1 resolution, Happ-Genzel apodization) in the 400–4000 cm−1 (KBr beamsplitter) and 100–1800 cm−1 (Solid SubstrateTM beamsplitter) regions using the ATR (Attenuated total reflectance) technique (diamond crystal). Standard ATR correction was also applied to the recorded spectra.
3. Results and Discussion
3.1. Crystal Structure Determination
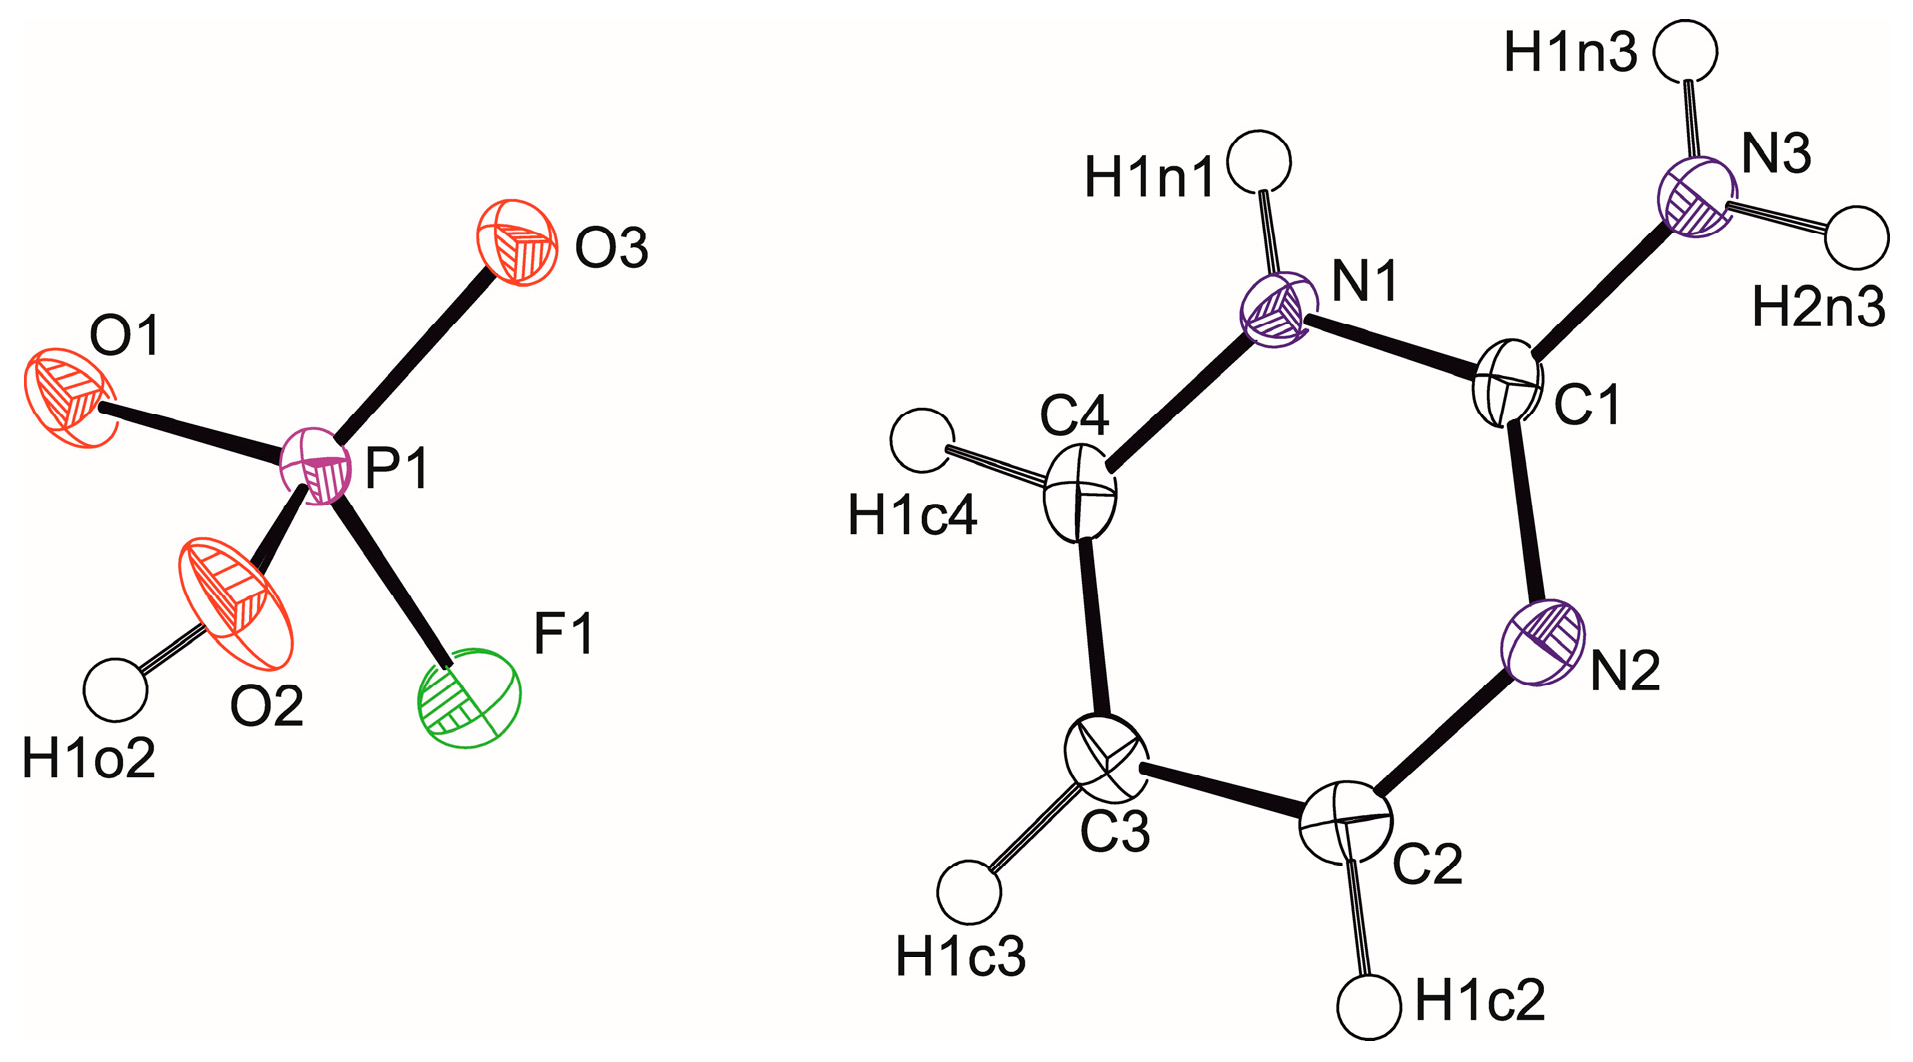
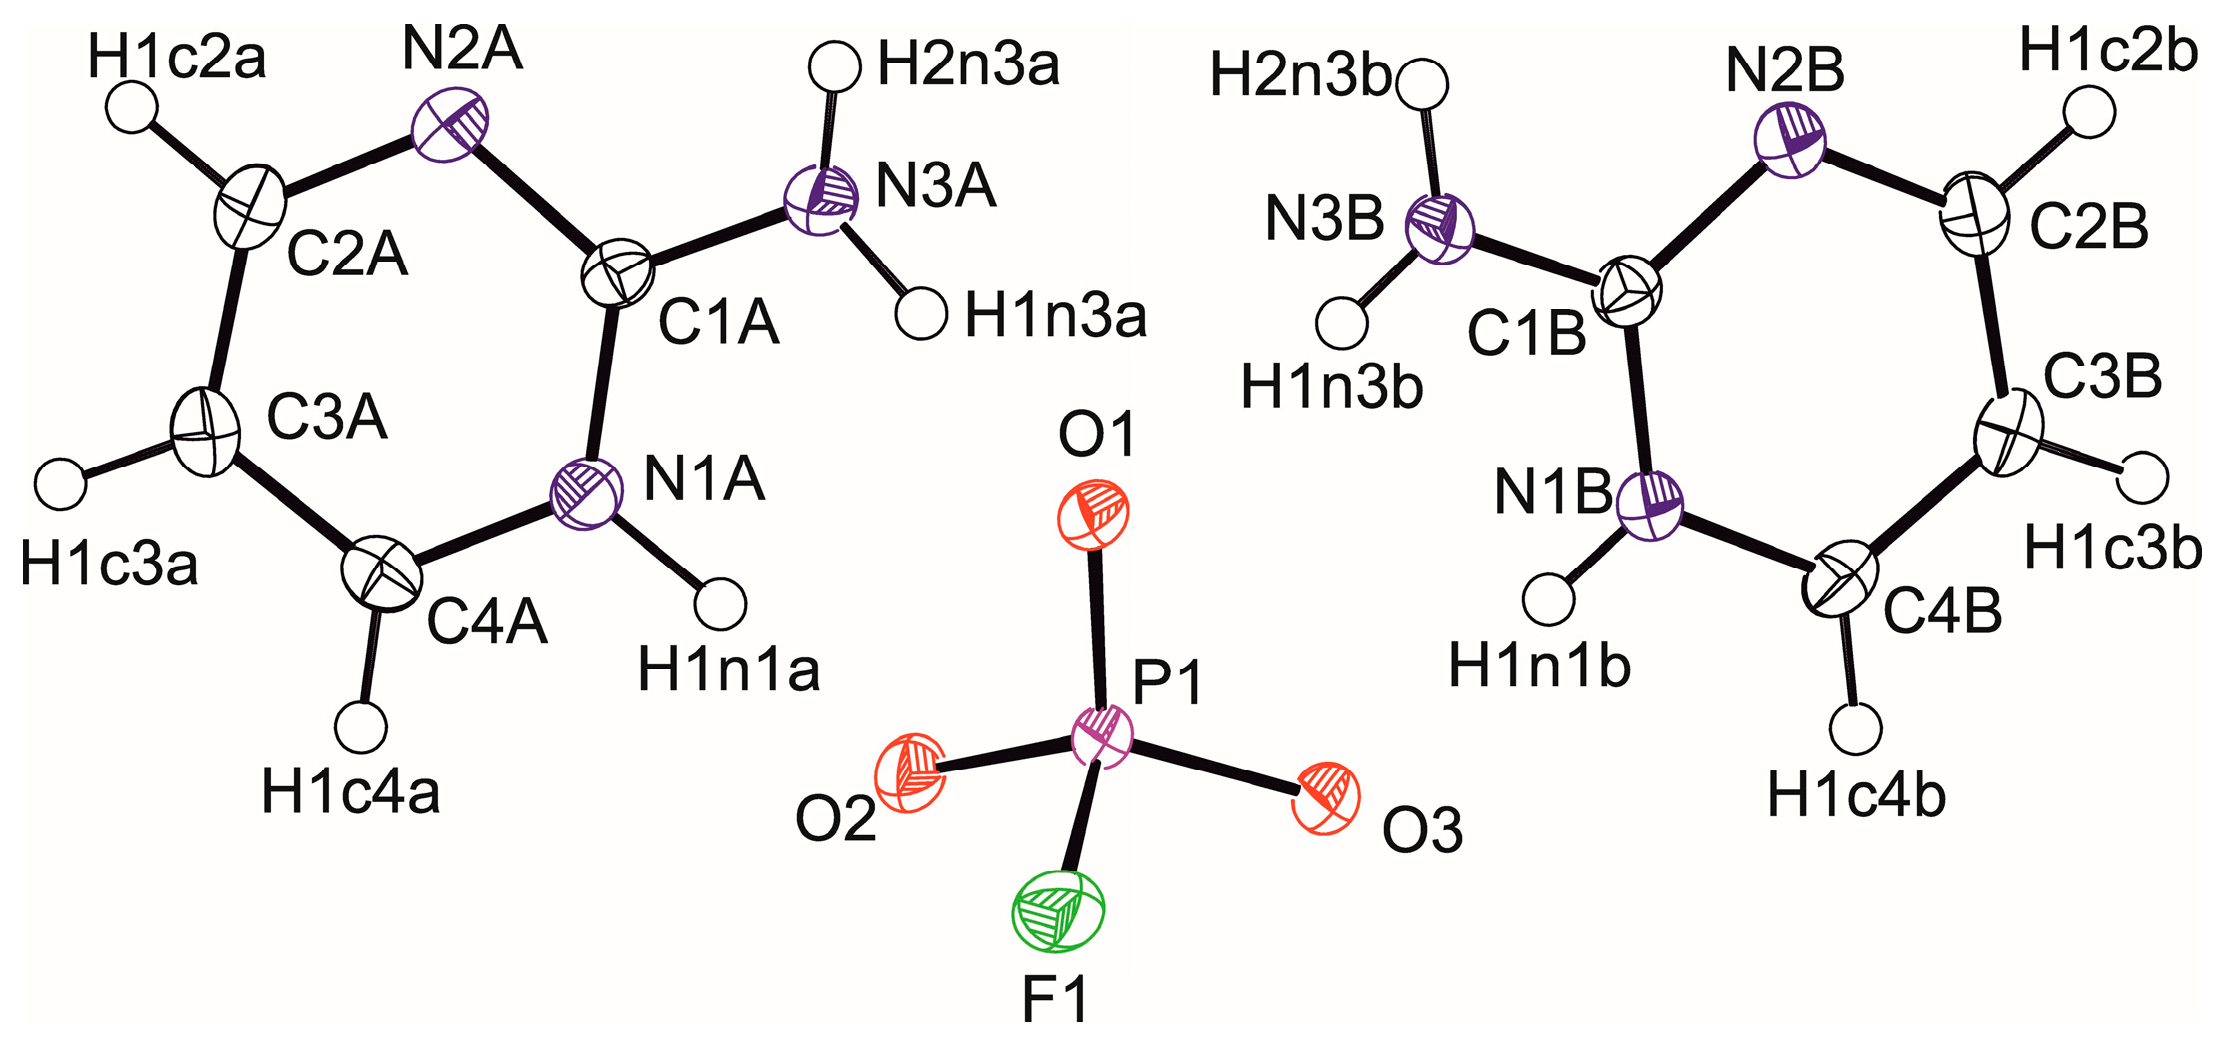
The structure (I) consists of one independent 2-aminopyrimidinium cation and one hydrogen trioxofluorophosphate anion (Figure 1), while the structure (II) consists of two symmetry independent 2-aminopyrimidinium cations and one trioxofluorophosphate anion (Figure 2).
Figure 1.
Title molecules of 2-aminopyrimidinium hydrogen trioxofluorophosphate (I), with the non-hydrogen atoms’ anisotropic atomic displacements parameters which are shown at the 50% probability level []. The hydrogens are depicted by circles of arbitrary radii.
Figure 2.
Title molecules of bis (2-aminopyrimidinium) trioxofluorophosphate, (II), with the non-hydrogen atoms’ anisotropic atomic displacements parameters which are shown at the 50% probability level []. The hydrogens are depicted by circles of arbitrary radii.
The main cohesion forces are provided by N-H···O hydrogen bonds, which are present in both structures, as well as by an O-H···O hydrogen bond, which is present in (I) only (Table 2 and Table 3).
Table 2.
Hydrogen bonds in 2-aminopyrimidinium hydrogen trioxofluorophosphate, (I).
Table 3.
Hydrogen bonds in bis(2-aminopyrimidinium) trioxofluorophosphate, (II).
(The N-H···N hydrogen bonds are missing in both title structures.) All these bonds are of moderate strength [], though the O-H···O hydrogen bond (O2-H1o2···O1i) is the strongest among the hydrogen bonds present in (I). (Hereafter, all the symmetry codes used throughout this article are summarized in Table 4.)
Table 4.
Symmetry codes used throughout the article.
In (I), the O2-H1o2···O1i hydrogen bond is involved in the graph set motif R22(8) [,] with these atoms: P1-O2-H1o2···O1i-P1-O2-H1o2···O1. The R22(8) motif is situated about the crystallographic symmetry centre.
In (II), however, this motif is naturally absent since there is no O-H···O hydrogen bond available in this structure.
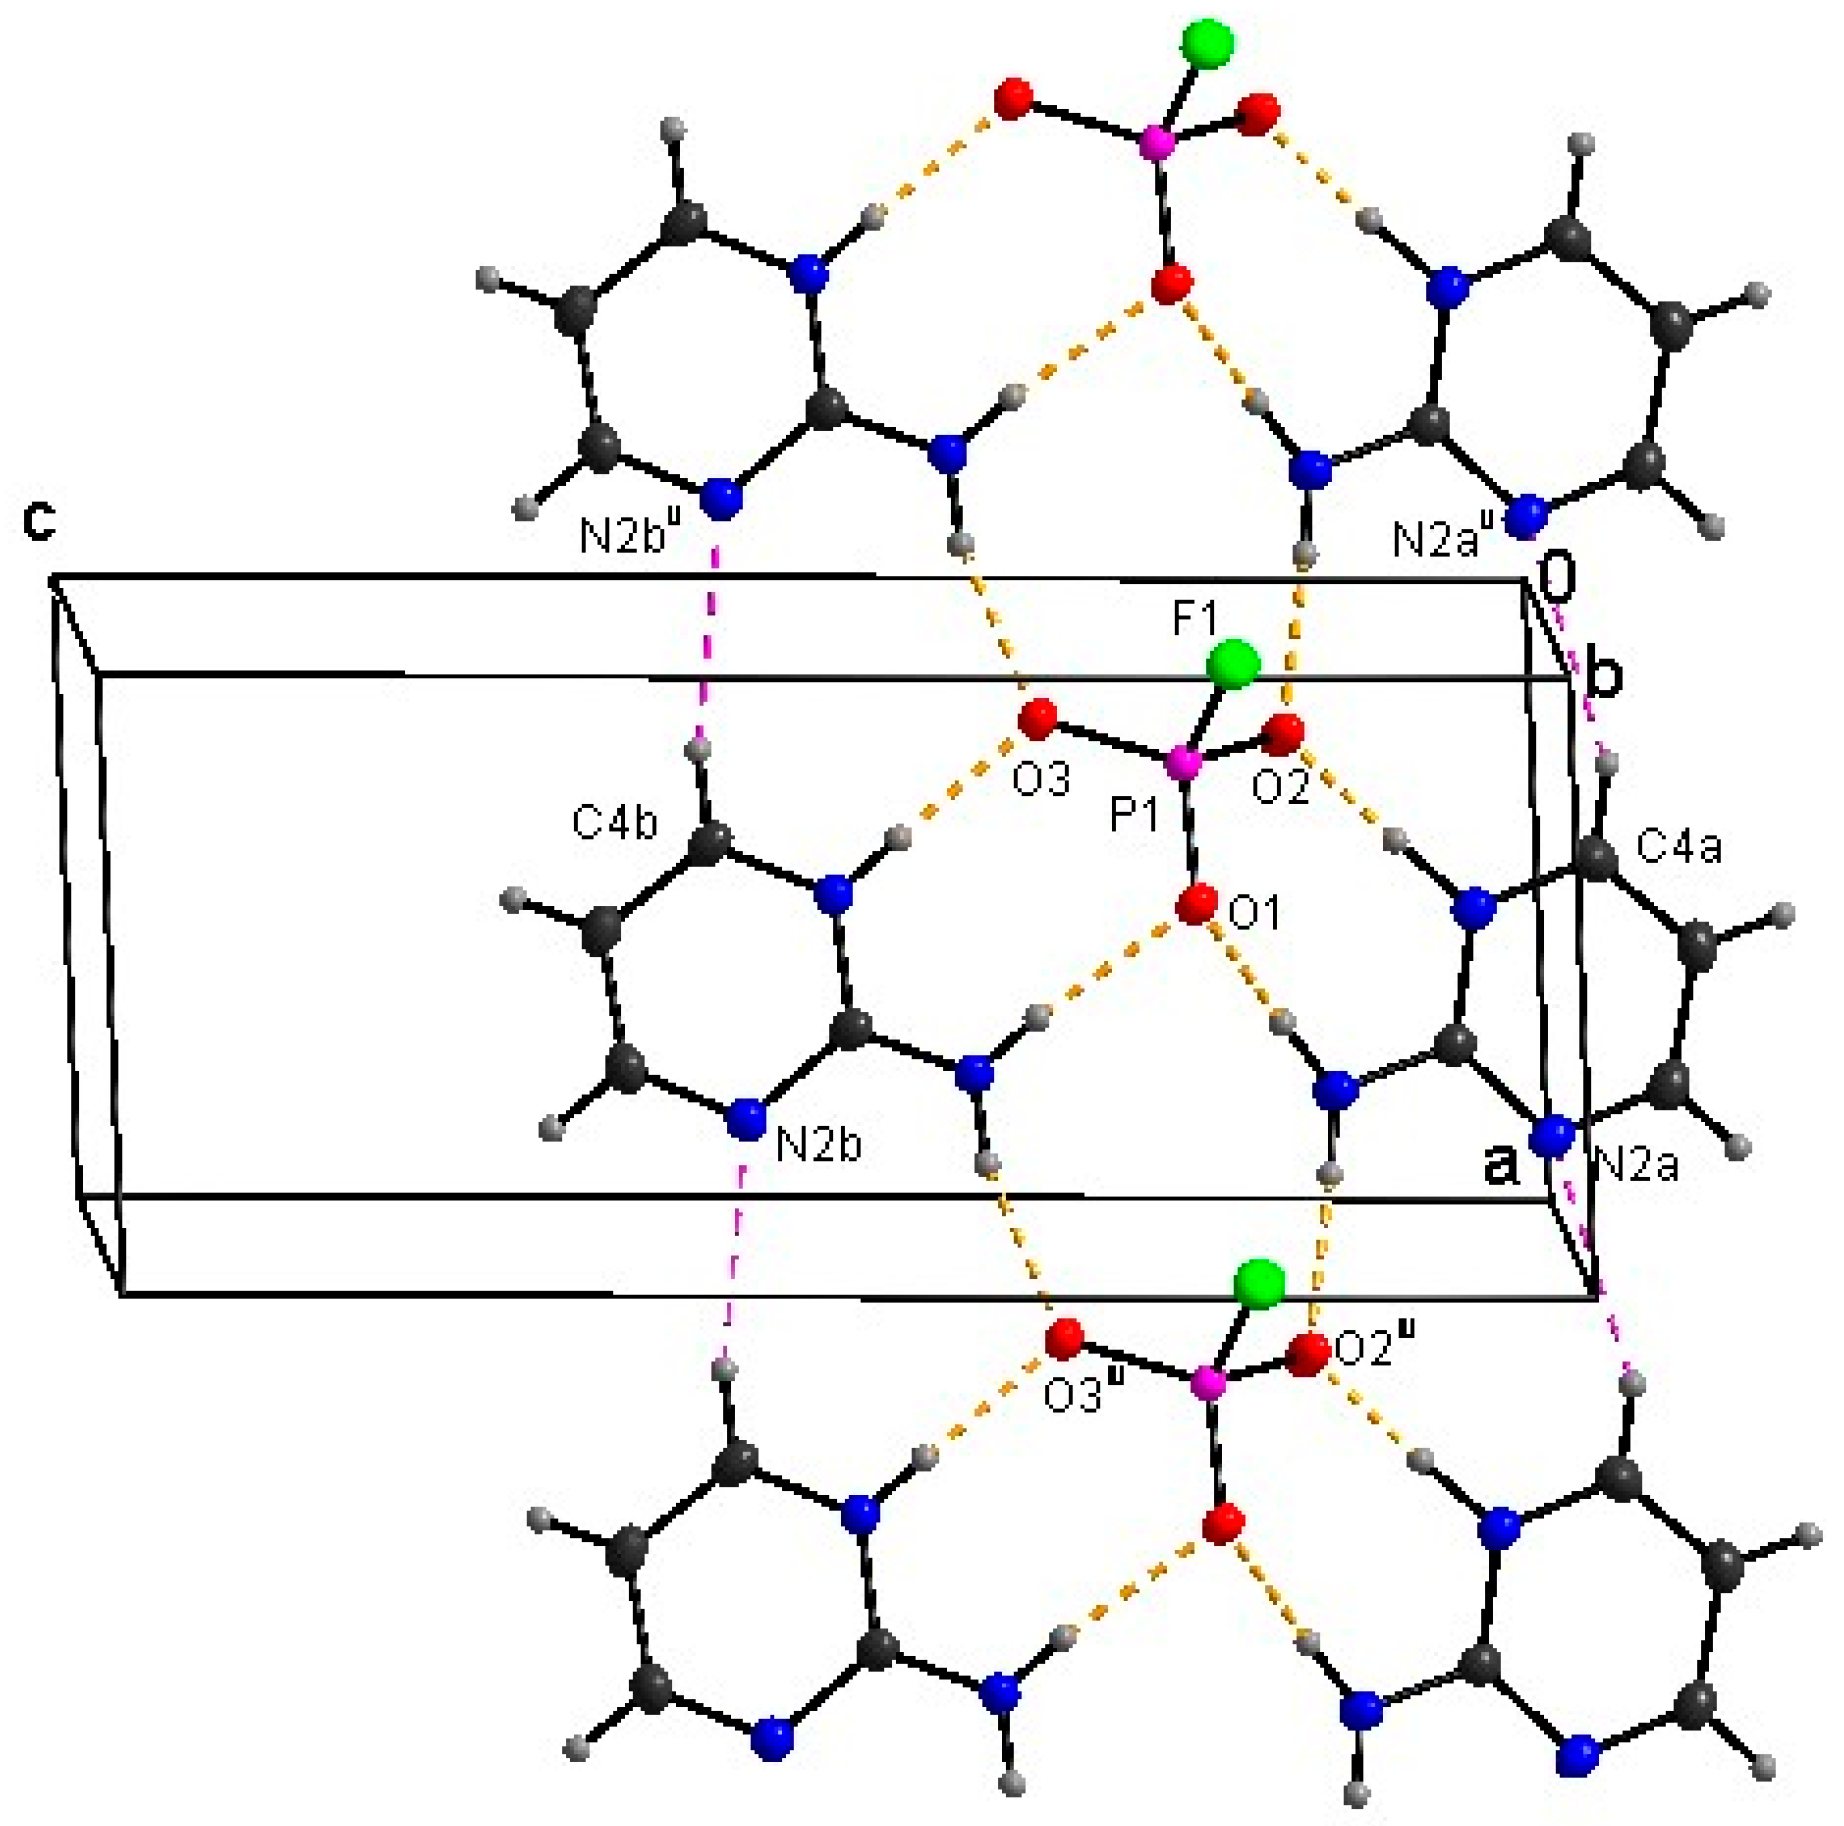
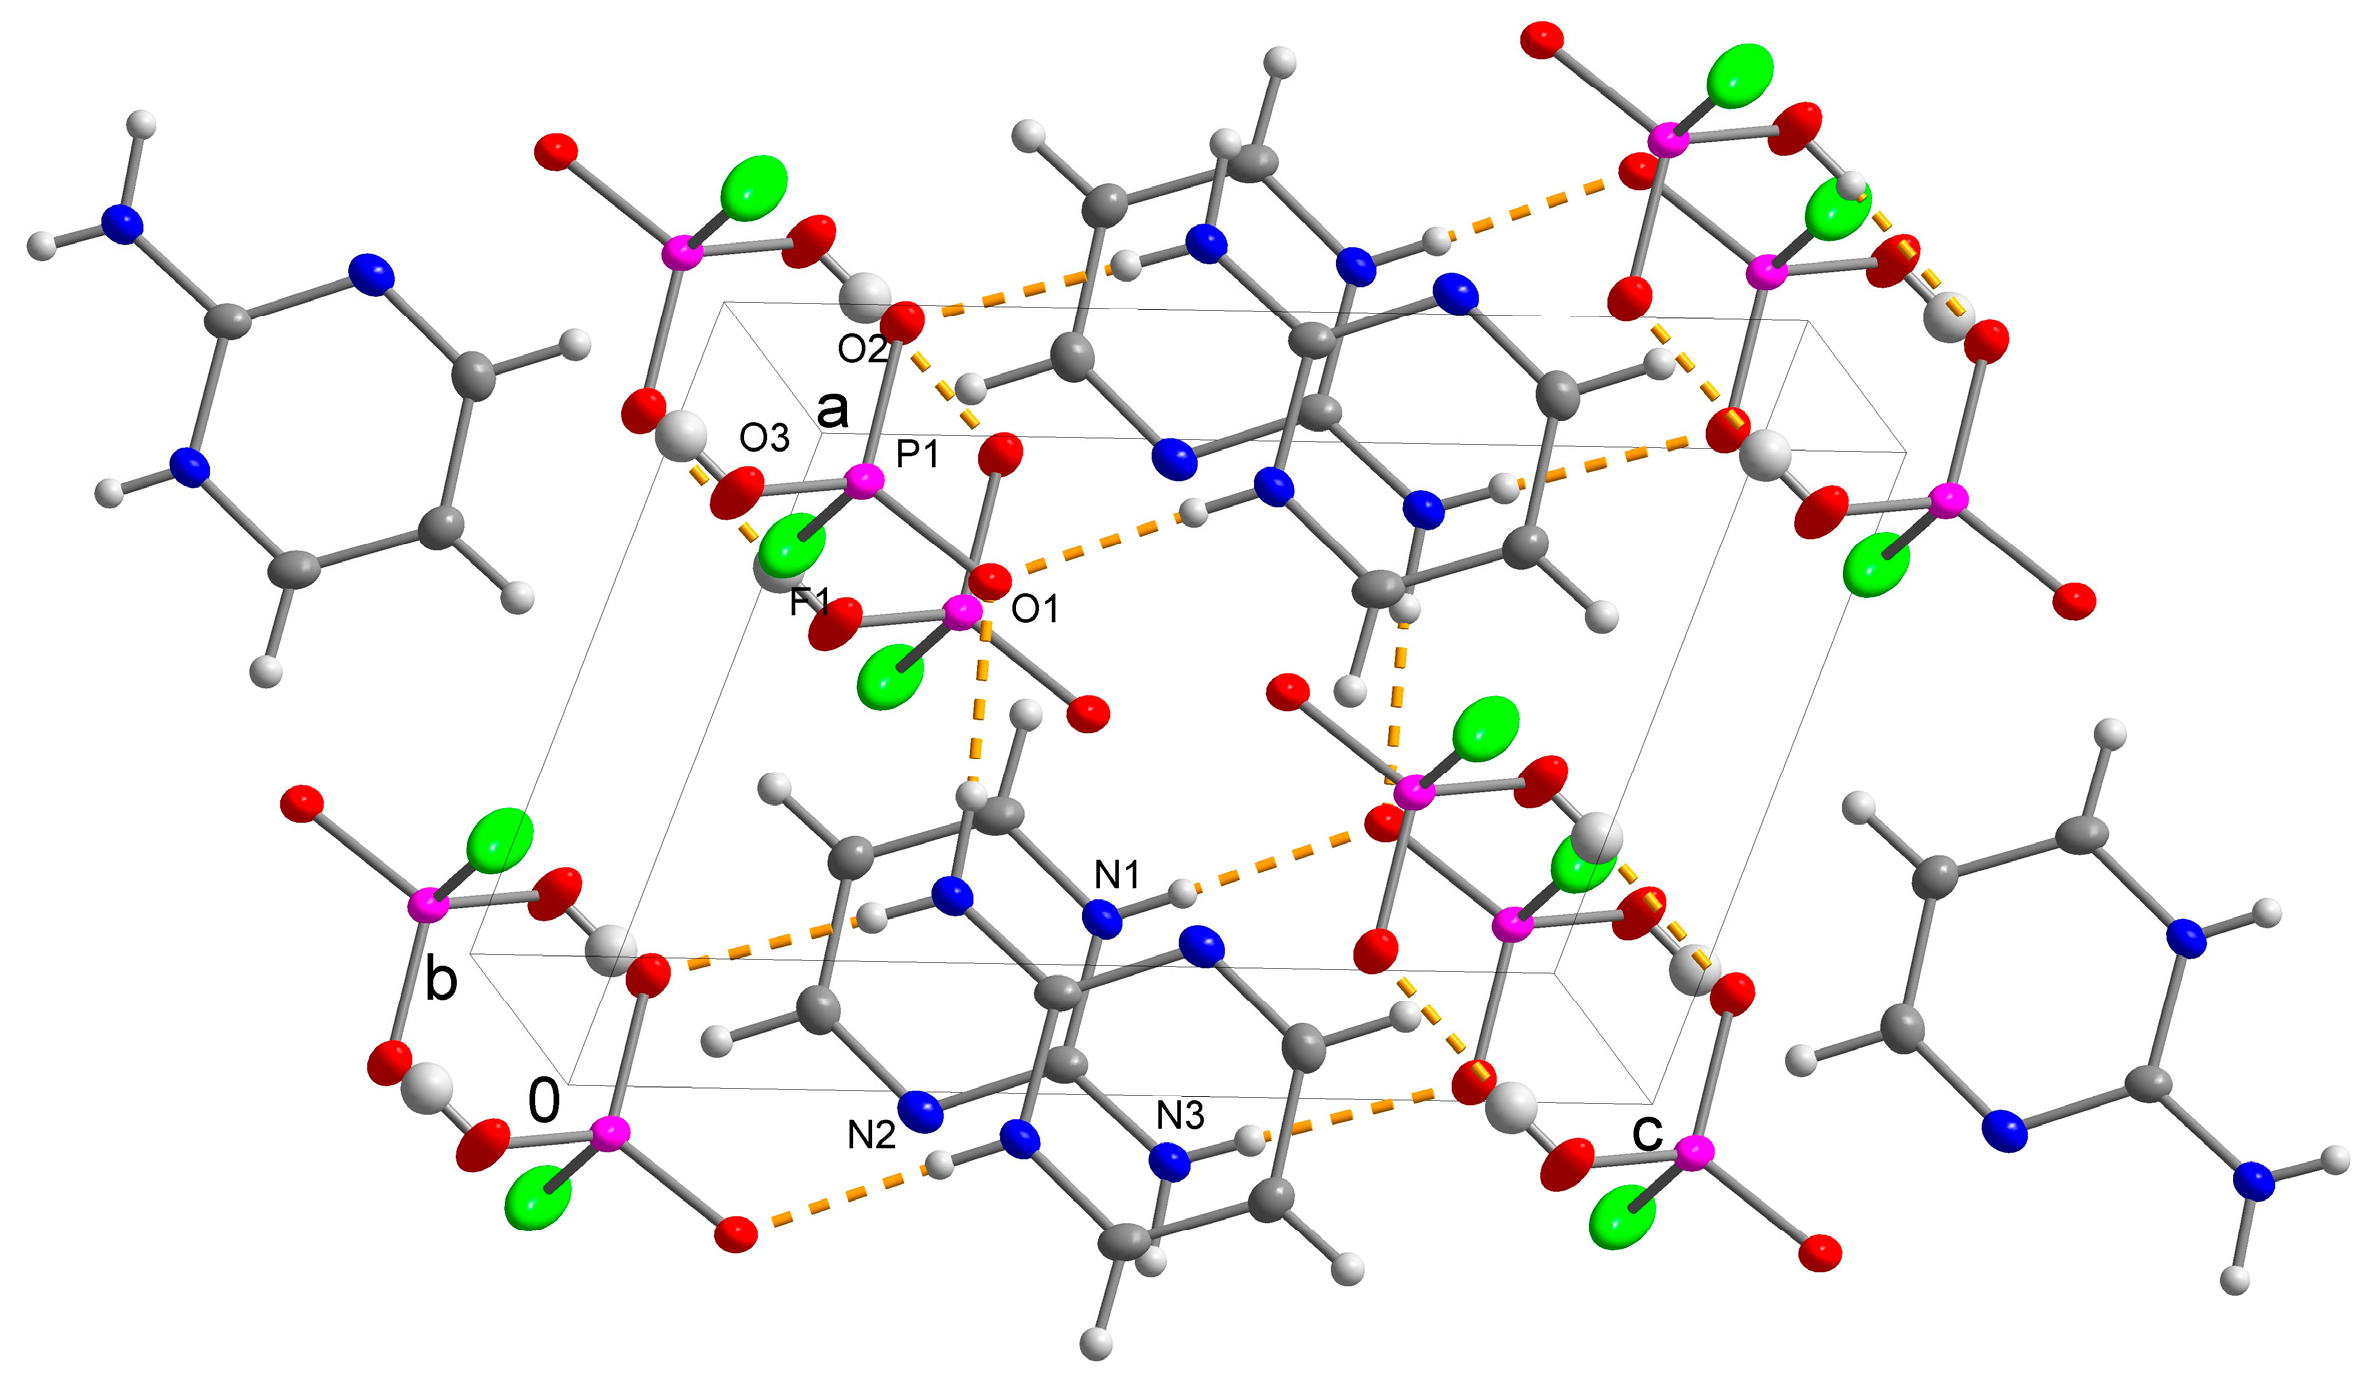
The N-H···O bonds are involved in the graph set motifs R22(8), which are present in both structures (Figure 3 and Figure 4). [The atoms involved into the R22(8) motif in (I) are C1ii–N1i–H1n1ii···O1-P1-O2···H1n3–N3 while for (II) the constituting atoms are C1a-N1a-H1n1a···O2-P1-O1···H1n3a-N3a and C1b-N1b-H1n1b···O2-P1-O1···H1n3b-N3b.]
Figure 3.
View of 2-aminopyrimidinium hydrogen trioxofluorophosphate, (I), along the b axis. The anisotropic displacements parameters are shown at the 50% probability level. C, H, F, N, O and P atoms are represented by grey, light grey, green, blue, red and magenta ellipsoids, respectively. The hydrogen atoms are shown as grey spheres of arbitrary size. N-H···O and O-H···O hydrogen bonds are shown as yellow dashed lines while C-H···N hydrogen bonds as violet dashed lines [].
Figure 4.
View of bis(2-aminopyrimidinium) trioxofluorophosphate, (II), along the b axis. The anisotropic displacements parameters are shown at the 50% probability level. C, H, F, N, O and P atoms are represented by grey, light grey, green, blue, red and magenta ellipsoids, respectively. The hydrogen atoms are shown as grey spheres of arbitrary size. Hydrogen bonds are shown as yellow dashed lines while C-H···N hydrogen bonds as violet dashed lines [].
This motif is typical for the molecules which contain the primary amine group attached to the pyrimidine or pyrimidinium rings in the vicinity of the ring’s N atoms [,,].
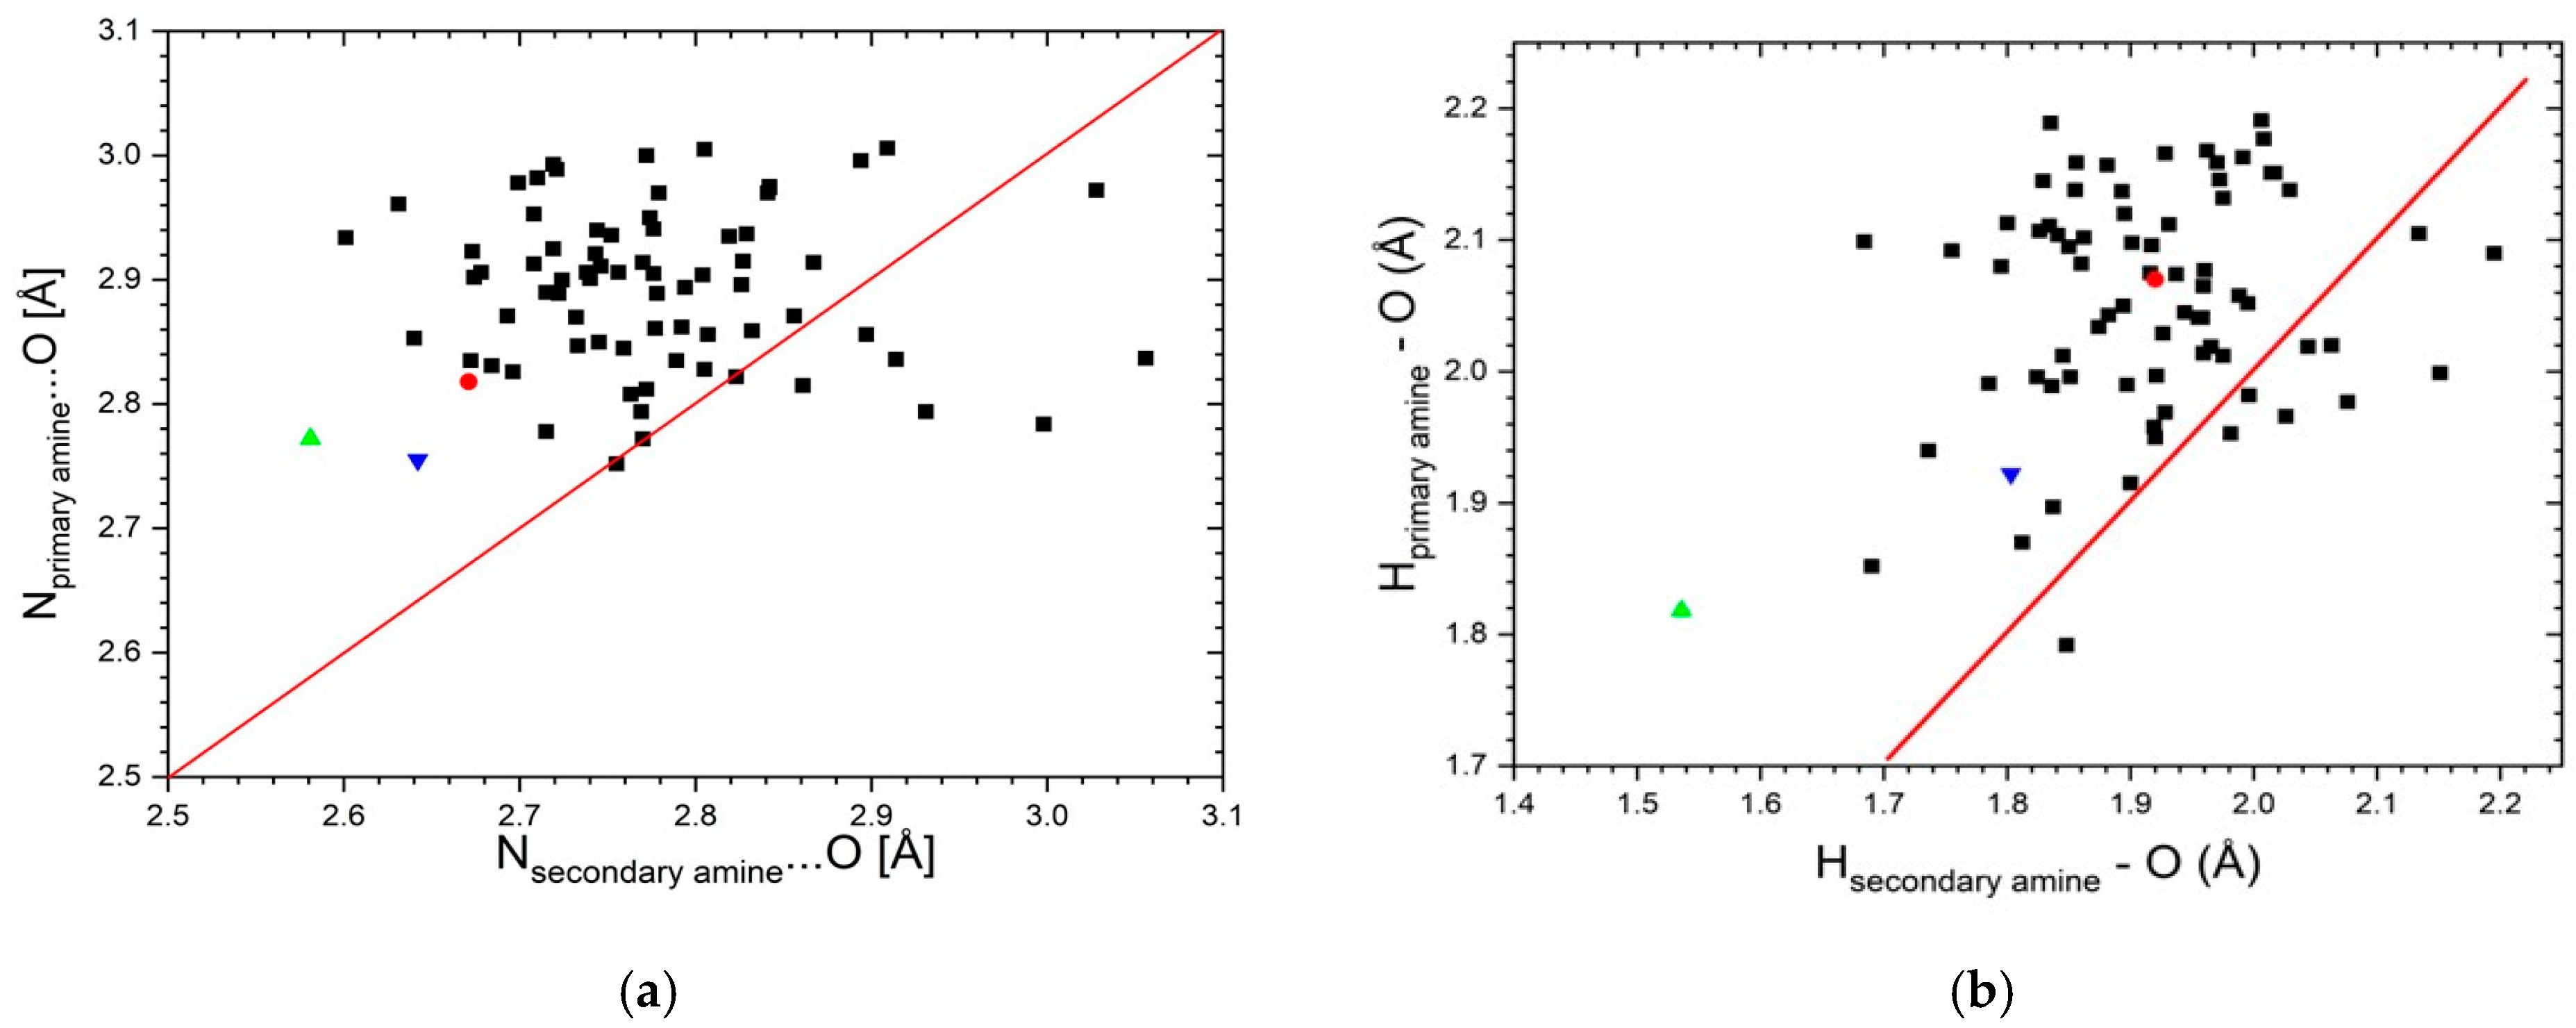
In this motif, the secondary amine groups form shorter N-H···O hydrogen bonds than the primary amine groups (Table 2 and Table 3). This is a general feature as it is indicated by the result of the search in the Cambridge Structural Database []. The search, which was carried out on the structures containing a motif of a potentially substituted 2-aminopyrimidinium cation and the sulfonyl group, offered 53 different structures with 73 motifs; the sulfonyl group was used in this case because it is most similar to the trioxoflurophosphate anion. The results of this search (Figure 5a,b) compare the N···O distances as well as H···O distances for the primary and the secondary amine groups, which are present in each hit. It can be seen in Figure 5a,b that especially the hydrogen bonds of (II) are outliers. This is because of unusually Nprimary···O and Nsecondary···O short hydrogen bonds which measure 2.7779(14) and 2.5810(15) Å for the “a” molecule, respectively, and in the case of the “b” molecule 2.7536(14) and 2.6415(15) Å, respectively. The hits offered by the Cambridge Crystallographic Database [] indicate that the reason for the exceptional position of the title structure in Figure 5a,b is due to a small size of the unsubstituted 2-aminopyrimidinium molecules, which are present in (I) and (II) and which may get closer to the hydrogen trioxofluorophosphate and trioxofluorophosphate molecules than the substituted ones.
Figure 5.
The correlation diagrams for H···O or N···O distances (Å) involved in the graph set motif R22(8) for the secondary and the primary amines in the structures containing 2-aminopyrimidinium and sulfonyl group; the data were retrieved from []: (a) Each black square represents Hsecondary amine···O vs. Hprimary amine···O distances in a given structure. (b) Each black square represents Nsecondary amine···O vs. Nprimary amine···O distances in a given structure. The title molecule in 2-aminopyrimidinium hydrogen trioxofluorophosphate is symbolized by red points; green and blue triangles are related to the “a” and “b” cations in bis(2-aminopyrimidinium) trioxofluorophosphate; in particular they show the distances within the hydrogen bonds N1-H1n1···O3ii and N3-H1n3···Oii (I); N1a-H1n1a···O2 and N3a-H1n3a···O1 (the “a” molecule of (II)); N1b-H1n1b···O3 and N3b-H1n3b···O1 (the “b” molecule of (II)). The red lines are situated in the loci with the same distances on the x and y axes [].
The N-H distances within the primary amine group cannot be well compared because of the frequent occurrence of inaptly applied refinement constraints. Wrong or inapt refinement constraints are often applied in the refinement of the secondary amine and hydroxyl groups; as to the critique, see e.g., []. Thus, the distances in Figure 5b are biased in many cases.
In (II), there is also present a motif R34(10) (Figure 4). The atoms involved in R34(10) are P1-O2···H2n3a-N3a-H1n3a···O1···H1n3b-N3b-H2n3b···O3.
In (I), the hydrogen atom of the primary amine group which does not participate in the R22(8) motif, is involved in the hydrogen bond N3iii-H2n3iii···O3. In (II), similarly, the hydrogens of the primary amine groups, which are not involved in the R22(8) motifs, i.e., H2n3a and H2n3b, take part in the N-H···O hydrogen bond system: N3a-H2n3a···O2iv and N3b-H2n3b···O3iv.
The title structures also contain weak hydrogen bonds []. Despite the chemical difference due to the presence of the O-H···O bond in (I) and its absence in (II), these weak hydrogen bonds are quite similar in either structure: There is quite a short C4-H1c4···N2iv hydrogen bond with quite a large D-H···A angle in (I) (Table 2, Figure 3). This hydrogen bond has counterparts in (II), i.e., C4a-H1c4a···N2av and C4b-H1c4b···N2biv (Table 3, Figure 4). The latter nitrogen atoms in both structures are non-protonated ring N-atoms. Similarly, there are four C-H···F weak interactions in which each F atom is involved as an acceptor of four C-H···F hydrogen bonds in a distorted tetrahedral symmetry (Table 2 and Table 3; Figure 6a,b). In (I), the H1c3 atom is donated to two F atoms (F1 and F1vi). The respective graph set motif R22(4) is formed by the atoms F···H1c3···Fvi···H1c3i. The value of the angle F1···H1c3···F1vi measures 110.6°, i.e., it is close to the tetrahedral angle.
Figure 6.
C-H···F interactions (a): 2-aminopyrimidinium hydrogen trioxofluorophosphate (I); (b): bis(2-aminopyrimidinium) trioxofluorophosphate, (II). C, H, F, N, O and P atoms are represented by grey, light grey, green, blue, red and magenta ellipsoids, respectively []. The hydrogen atoms are shown as grey spheres of arbitrary size. The anisotropic displacements parameters are shown at the 50% probability level.
In (II), the analogous weak hydrogen bonds are: C2avii–H1C2avii···F1; C3aviii-H1C3a viii···F1; C3bix -H1C3bix···F1; C4bix-H1C4bix···F1 (Table 3).
The weakness of these C-H···F bonds which are listed in Table 2 and Table 3 fits to previous observations. As it has been recognized earlier [,], the C-F bonded fluorine is reluctant in participate in hydrogen bonding. It can also be extended to cases with P-F bonded fluorine as it has been shown for (NH4)2PO3F []. The weakness of the hydrogen bonds is manifested by rather long donor-acceptor (D···A) distances as well as by rather acute D-H···A angles as it is the case of the items given in Table 2 and Table 3 [].
There are also present π-electron···π-electron interactions in both structures, which are depicted in Figures S1–S3 (Supplementary Materials). The distances between the ring centroids, which usually serve as a criterion for description of such interactions, are rather meaningless in the present cases because the primary and the secondary amine groups are also involved in the stacking of the rings. In (I), the rings are parallel-displaced [] while the primary amine nitrogen atoms are well situated above the centroids of the rings (Figure S1; Supplementary Material). In (II), there are two ring systems labelled by “a” and “b”. In the system of the “a-labelled” molecules, the rings are displaced while the N atoms of the primary amine groups form a close contact with the C atom of the adjacent ring (N3a---C3avii, Figure S2; Supplementary Materials). The carbon atoms are close to the centroids of the adjacent rings. In the “b-labelled” ring system of (II), the rings are displaced while the secondary amine nitrogen is below the centroid of the adjacent ring (Figure S3; Supplementary Material). Tables S3–S5; Supplementary Material, list the closest distances between the atoms of the adjacent rings as well as that regarding the N-atom of the primary amine group.
Comparison of (I) with 2-aminopyrimidinium hydrogen phosphite [] shows that both structures are not isostructural, i.e., crystal-chemically isotypic [], though there is a large number of examples of isostructural trioxofluorophosphates and phosphites or hydrogen trioxofluorophosphates and hydrogen phosphites, e.g., [,,].
Figure 3 and Figure 7 show that the main difference between (I) and 2-aminopyrimidinium hydrogen phosphite consists in the fact that in (I), the anions form dimers interconnected by the O-H···O hydrogen bonds which participate in the graph set motif R22(8) in contrast to 2-aminopyrimidinium hydrogen phosphite with the O-H···O bonds forming the chains with the graph set motif C(4) along the c axis. (The atoms involved in C(4): O2-P1-O1-H1O [].)
Figure 7.
View of the unit cell of 2-aminopyrimidinium hydrogen phosphite along the b axis. The anisotropic displacements parameters are shown at the 50% probability level. C, H, N, O and P atoms are represented by grey, light grey, blue, red and magenta ellipsoids, respectively. The hydrogen atoms are shown as grey spheres of arbitrary size. Hydrogen bonds are shown as yellow dashed lines []. The data in [] were used for the structure refinement by JANA 2006 [].
On the other hand, in (I) as well as in 2-aminopyrimidinium hydrogen phosphite, there are present Nprimary-H···O and Nsecondary-H···O hydrogen bonds which are involved in R22(8) graph set motif, too. (Here, the data from our own refinement of the experiment given in [] are used. This experiment was carried out at 150 K. Cf. Figure 5a,b.)
The hydrido hydrogen in 2-aminopyrimidinium hydrogen phosphite is not involved even in a weak hydrogen bonding, in contrast to the fluorine atoms, as it happens in both title structures (I) and (II).
The longest distances P-O in hydrogen trioxofluorophosphates or in trioxofluorophosphates are correlated to the length of P-F in these anions [,]. The longer is P-F, the shorter is P-Olongest and vice versa. The [P-Olongest, P-F] distances measure [1.5304(17), 1.5671(17)] and [1.5205(12), 1.5840(8)] Å in (I) and (II), respectively. These values situate the title structures fairly into the regions of the structures with (HFO3P)- and (FO3P)2−, respectively, in agreement with the previous structure determinations (Figure S4, Supplementary Materials). More specifically, (I) is situated on the boundary between the hydrogen trioxofluorophosphates and trioxofluorophosphates because of the relatively short P-Olongest distance (Å).
Final note regarding the structure determination: In many cases, one of the N-H distances present in the primary amine group is shorter than the accepted value of 0.86 Å [] at room temperature. This frequent occurrence of quite a short N-H bond in the primary amine group is the reason why these distances have not been constrained or restrained in the title structures (I) and (II).
3.2. Vibrational Spectroscopy
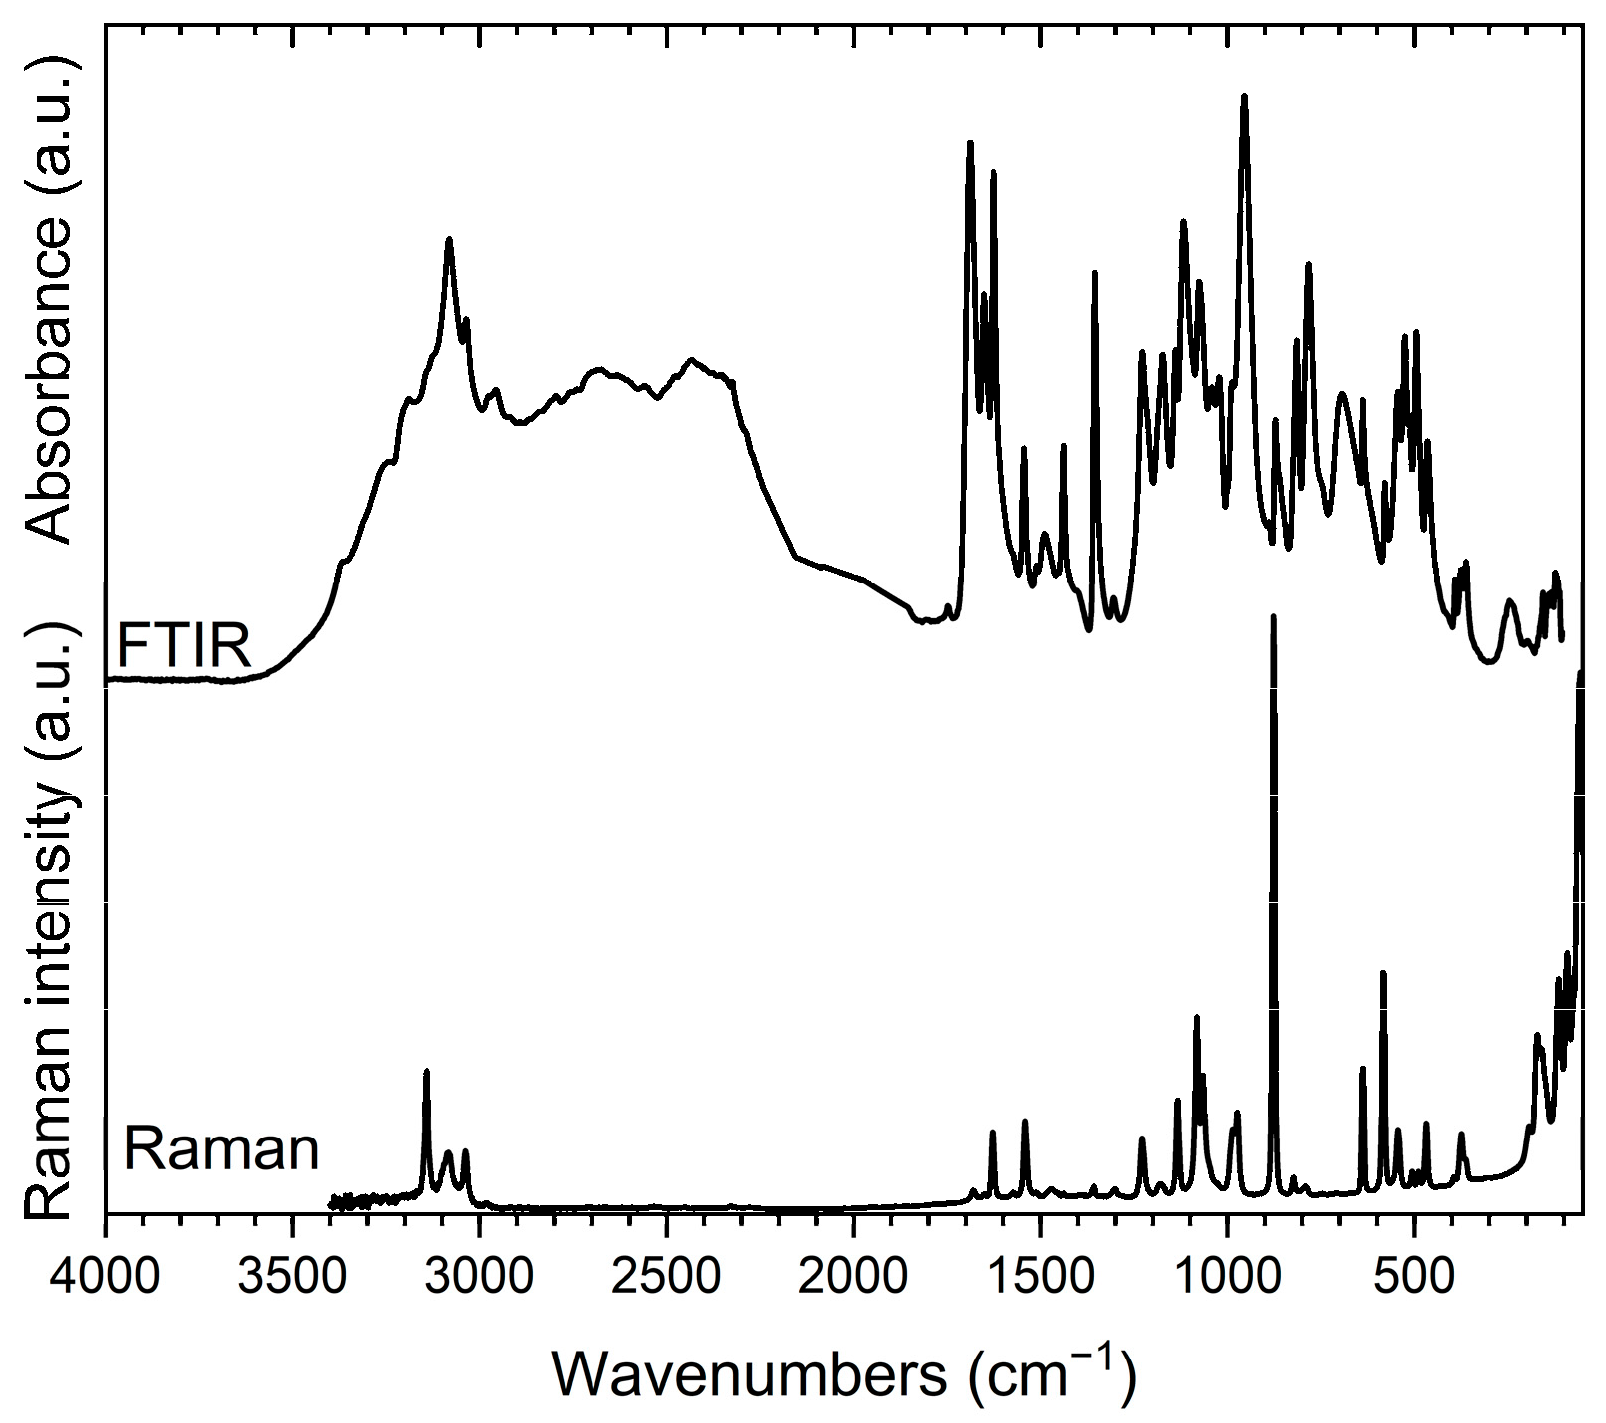
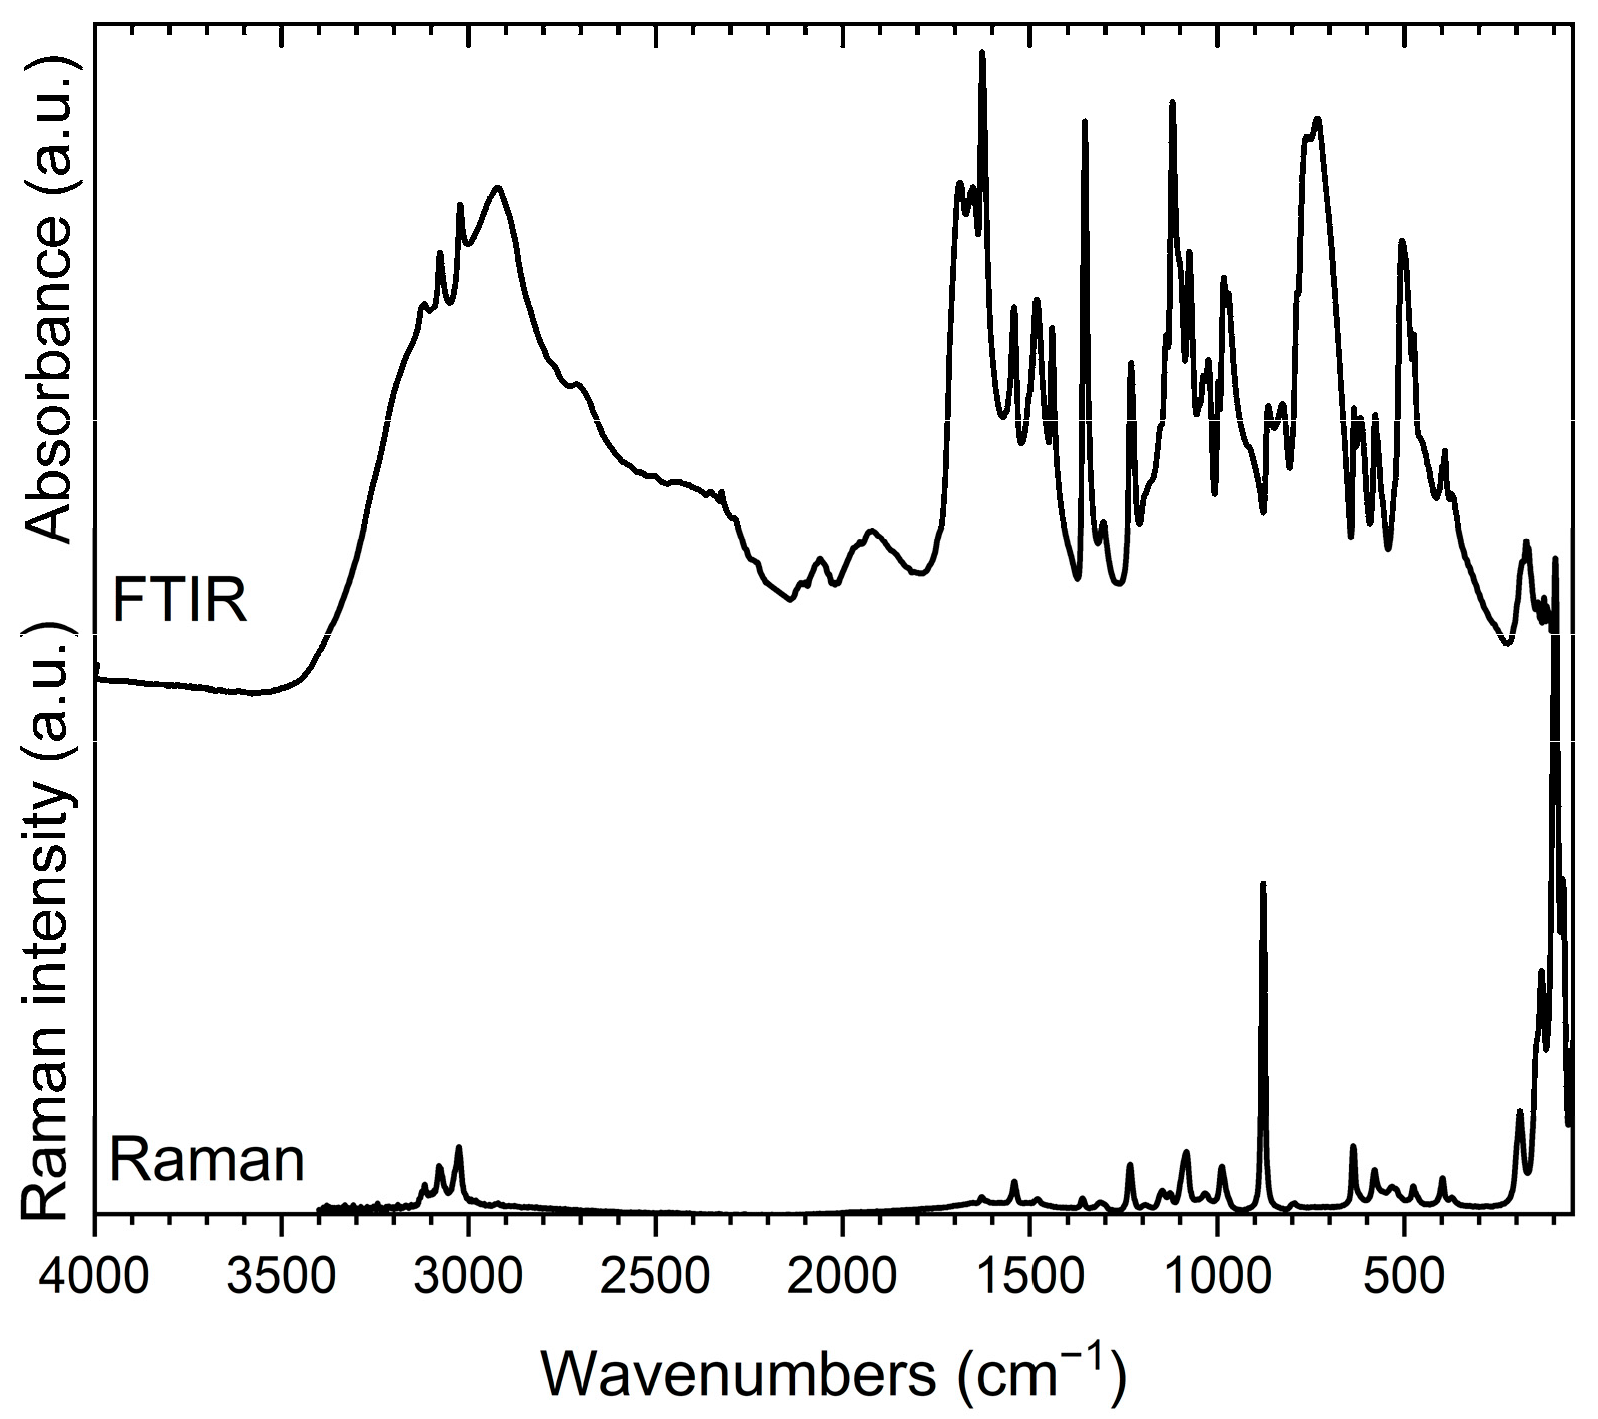
The vibrational spectra (FTIR and Raman) of both title compounds (I) and (II) are depicted in Figure 8 and Figure 9. As it was written above, the asymmetric units of (I) and (II) contain one cation and one anion, and two cations and one anion, respectively, while all the atoms occupy the Wyckoff positions i (C1). A detailed assignment of the recorded vibrational bands follows previously published results, which are focused on the 2-aminopyrimidinium cation [,] and trioxofluorophosphate anion [,,,]–see Table 5 and Table 6.
Figure 8.
Micro-FTIR (ATR) and micro-Raman spectra of 2-aminopyrimidinium hydrogen trioxofluorophosphate crystals, (I). The Raman spectrum was recorded using 780 nm laser excitation.
Figure 9.
Micro-FTIR (ATR) and micro-Raman spectra of bis(2-aminopyrimidinium) trioxofluorophosphate crystals, (II). The Raman spectrum was recorded using 780 nm laser excitation.
The number of expected normal modes in the studied 2-aminopyrimidinium salts (Table S6, Supplementary Materials) was determined by the nuclear site group analysis []. The structures of 2-aminopyrimidinium hydrogen trioxofluorophosphate, (I), and bis(2-aminopyrimidinium) trioxofluorophosphate, (II), belong to the space group P−1 (Ci1) with 19 atoms (Z = 2) and 31 atoms (Z = 2), respectively, which are contained in the asymmetric unit. The correlation diagrams in Tables S7 and S8, Supplementary Materials, list symmetry and internal modes of both anions (hydrogen trioxofluorophosphate and trioxofluorophosphate).
The vibrational spectra of the title compounds (see Figure 8) contain structured broad bands of strong to medium intensity, which are situated mainly in the 3450–2800 cm−1 region. These bands correspond to the stretching modes of the NH bonds in the primary and the secondary amine groups, as well as to the hydroxyl groups which are present in (I). As the present structure analysis has revealed, these groups are involved in the N-H···O (the structures (I) and (II)) or the O-H···O hydrogen bonds (the structure (I)), see Table 2, Table 3, Table 5 and Table 6. The frequencies are in good agreement with the correlation curves [,] concerning the wavenumbers of the X-H (X = O, N) stretching vibrational bands and the pertinent donor-acceptor distances.
Manifestation of the cation in (I) in the vibrational spectra is similar to that in 2-aminopyrimidinium hydrogen phosphite [] (see Figure S5, Supplementary Materials) despite the fact that both structures are not isostructural. Analogous situation takes place in the case of (II) and 2-aminopyrimidinium dihydrogen phosphate monohydrate [,], see Figure S6, Supplementary Materials. The similarity between the vibrational spectra in both cases arises from the similarity of the bond patterns regarding the same cation.
As expected, the main difference between the spectra of (I) and 2-aminopyrimidinium hydrogen phosphite, as well as between (II) and 2-aminopyrimidinium dihydrogen phosphate monohydrate, regards vibrational manifestations of the different anions which are present in these pairs of structures (Table S9 and Figure S7, Supplementary Material). The correlation diagrams in Tables S7 and S8, Supplementary Materials, list symmetry and internal modes of both anions (hydrogen trioxofluorophosphate and trioxofluorophosphate). (For a detailed description, see “Comparison of (I) and 2-aminopyrimidinium hydrogen phosphite []” in the Supplementary Material and “Comparison of (II) and 2-aminopyrimidinium dihydrogen phosphate monohydrate []” in the Supplementary Material, too. Supplementary Materials also contains “Comparison of the interpretation of the vibrational spectra of 2-aminopyrimidinium dihydrogen phosphate monohydrate in [] and in the present study”.)
3.2.1. Vibrational Bands Associated with 2-Aminopyrimidinium Hydrogen Trioxofluorophosphate, (I)
For a more detailed assignment of the vibrational maxima recorded in the studied salt (I), see Table 5.
Table 5.
Recorded ATR-FTIR and Raman bands maxima (cm−1) of 2-aminopyrimidinium hydrogen trioxofluorophosphate and their assignment.
Table 5.
Recorded ATR-FTIR and Raman bands maxima (cm−1) of 2-aminopyrimidinium hydrogen trioxofluorophosphate and their assignment.
| FTIR cm−1 | Raman (780 nm) cm−1 | Assignment | FTIR cm−1 | Raman (780 nm) cm−1 | Assignment |
|---|---|---|---|---|---|
| 56 vs | External modes | 1076 s | 1082 s | ρNH2, νrg, δrg | |
| 75 sh | 1118 s | νasPO2 | |||
| 91 s | 1139 m | 1133 m | δCH, νrg | ||
| 114 s | 1173 mb | 1178 w | νasPO2 | ||
| 161 s | 1228 mb | 1228 m | δPOH, δCH, νrg | ||
| 172 s | 1305 wb | 1301 w | δCH, νrg, δNHx | ||
| 198 wb | 193 m | γrg | 1355 s | 1358 w | δCH, νrg, δNH |
| 245 wb | 1407 wb | νC-NH2, νrg, δNHx, δCH | |||
| 362 w | 366 sh | ρPO2 | 1438 m | 1437 vw | |
| 376 w | 375 m | 1455 w | 1457 sh | δCH, νrg, δNHx | |
| 392 w | 395 vw | γrg, γCH, γNHx | 1488 mb | 1470 w | |
| 465 m | 469 m | δCNC | 1511 w | 1512 vw | |
| 495 m | 489 w | δFPO2 | 1544 m | 1541 m | νrg, δCH, δNHx, δNCN |
| 514 m | 506 w | 1575 sh | 1574 vw | ||
| 526 m | δPO2 | 1626 s | 1628 m | νrg, δNHx, δCH | |
| 545 m | 544 m | 1651 mb | 1650 vw | νC-NH2, νrg, δNHx, δrg | |
| 580 m | 583 s | δrg | 1688 sb | 1680 w | |
| 638 m | 638 m | 1748 vw | |||
| 694 mb | γNH, τNH2 | 2430 mb | νO-H(···O), νN-H(···O) | ||
| 755 mb | γN-H(···O) | 2560 mb | |||
| 783 m | 791 wb | γCH, γrg, δCN3 | 2675 mb | ||
| 815 m | 823 w | νPF | 2795 sb | ||
| 860 mb | δNH | 2957 s | |||
| 872 m | 876 vs | νsrg, δsrg, δNH | 2975 s | ||
| 889 sh | 3036 s | 3038 m | νCH, νN-H(···O) | ||
| 955 sb | νsPO2 | 3081 s | 3083 m | ||
| 974 m | νsPO2 | 3121 sh | |||
| 988 m | 985 m | δrg, νrg, δNH | 3140 sh | 3142 s | νN-H(···O) |
| 1000 sh | 3190 s | ||||
| 1022 m | γCH, γrg | 3240 sh | |||
| 1042 m | 3366 sh | ||||
| 1066 m | ρNH2, νrg, δrg |
Note: Abbreviations and symbols: vs, very strong; s, strong; m, medium; w, weak; b, broad; sh, shoulder; rg, ring; ν, stretching; δ, deformation or in-plane bending; γ, out-of-plane bending; ρ, rocking; τ, torsion; s, symmetric; as, antisymmetric.
Three main regions, which are associated with vibrational modes of the 2-aminopyrimidinium cation, are present in the infrared spectrum of (I). In the first region 1690–1350 cm−1, medium to strong infrared intensity maxima (medium to weak intensity maxima in the Raman spectrum) are related to the mixed modes of νC-NH2, νrg, νNHx and δrg characteristic vibrations of the cation. The manifestations of the mixed δCH, νrg, δNHx were observed at 1355 and 1139 cm−1 in the infrared spectrum (1133 and 1082 cm−1 in the Raman spectrum).
In the second region 1080–1020 cm−1, medium to strong intensity bands in the infrared and Raman spectra are attributed to ρNH2, νrg, δrg and γCH, γrg mixed modes. The most characteristic manifestation of the symmetric stretching vibration of the aminopyrimidinium ring is recorded in the Raman spectrum as a very strong maximum at 876 cm−1 (872 cm−1 infrared spectrum).
In the third region, medium intensity maxima between 870–540 cm−1 are present in the infrared as well as the Raman spectra. They correspond to the manifestations of the mixed γCH, γrg, δCN3 and γNH, τNH2 and δrg vibrations.
As to the anion, the medium-intensity maxima recorded in both spectra at 1228 cm−1 are assigned to the deformation vibration δPOH, which is overlapped by 2-aminopyrimidinium cation modes. The manifestations of antisymmetric νasPO2 modes were located at 1173 and 1118 cm−1 as strong and medium broad maxima in the infrared spectrum (weak maximum at 1178 cm−1 in the Raman spectrum), respectively. The maximum at 974 cm−1 in the Raman spectrum (955 cm−1 in the infrared spectrum) corresponds to the symmetric νsPO2 vibration. The stretching νPF mode was observed at 815 cm−1 in the infrared spectrum (823 cm−1 in the Raman spectrum). The pairs of maxima recorded at 535, 526 cm−1 (544 cm−1 Raman spectrum; both peaks have not been resolved) and 376, 362 cm−1 (375, 366 cm−1 Raman spectrum) represent the manifestations of δPO2 and ρPO2 modes, respectively. The medium intensity band in the infrared spectrum observed at 495 cm−1 (489 cm−1 in the Raman spectrum) represents the δFPO2 mode.
3.2.2. Vibrational Bands Associated with bis(2-Aminopyrimidinium) Trioxofluorophosphate, (II)
For a more detailed assignment of vibrational bands of (II), see Table 6.
Table 6.
Recorded ATR-FTIR and Raman bands maxima (cm−1) of bis(2-aminopyrimidinium) trioxofluorophosphate and their assignment.
Table 6.
Recorded ATR-FTIR and Raman bands maxima (cm−1) of bis(2-aminopyrimidinium) trioxofluorophosphate and their assignment.
| FTIR cm−1 | Raman (780 nm) cm−1 | Assignment | FTIR cm−1 | Raman (780 nm) cm−1 | Assignment |
|---|---|---|---|---|---|
| 76 s | External modes | 1037 m | γCH, γrg | ||
| 96 vs | 1075 s | 1083 mb | νasPO3, ρNH2, νrg, δrg | ||
| 133 s | 1105 sh | δCH, δNHx | |||
| 145 sh | 1120 s | 1126 m | νasPO3 | ||
| 174 wb | 191 m | γrg | 1137 m | δCH, νrg | |
| 374 w | 373 w | ρPO3 | 1152 sh | 1147 m | νasPO3 |
| 392 sh | 398 m | γrg, γCH, γNHx | 1180 mb | ||
| 400 m | 1231 m | 1234 m | δCH, νrg | ||
| 475 m | 476 m | δFPO3, δCNC | 1305 m | 1314 wb | δCH, νrg, δNHx |
| 507 mb | 528 sh | δPO3 | 1354 s | 1361 w | δCH, νrg, δNH |
| 533 mb | 1442 s | νC-NH2, νrg, δNHx, δCH | |||
| 579 mb | 580 m | δPO3, δrg | 1482 s | 1481 w | δCH, νrg, δNHx |
| 618 mb | δPO3 | 1542 m | 1541 m | νrg, δCH, δNHx, δNCN | |
| 635 m | 637 m | δrg | 1627 s | 1629 w | νrg, δNHx, δCH |
| 732 mb | δFPO3 | 1651 s | νC-NH2, νrg, δNHx, δrg | ||
| 761 mb | γCH, γrg, δCN3 | 1687 m | |||
| 786 sh | 794 w | νPF, γCH | 1925 wb | νN-H(···O) | |
| 826 mb | νPF | 2060 mb | |||
| 864 m | 878 s | νsrg, δsrg, δNH | 2700 mb | ||
| 925 mb | γCH | 2922 sb | |||
| 971 m | δrg, νrg, δNH | 3023 sb | 3026 m | νCH, νN-H(···O) | |
| 983 m | 988 mb | νsPO3 | 3076 s | 3079 m | |
| 998 m | 3118 m | 3118 m | |||
| 1024 sh | 1033 m | νsPO3, γrg, γCH | 3160 sh | νN-H(···O) |
Also, as in the case of (I), three main regions of strong structured bands are discernible in the infrared spectrum of (II). They are associated with vibrational modes of the 2-aminopyrimidinium cation.
The first region (1750–1600 cm−1) contains the maxima at 1651 and 1627 cm−1 (a weak band 1629 cm−1 Raman spectrum), which are associated with νC-NH2, νrg, δNHx, δrg and νrg, δNHx, δCH.
The second region (1600–1500 cm−1) reveals the maxima at 1576, 1556 and 1542 cm−1, (medium intensity band at 1541 cm−1 Raman spectrum), which are associated with the νrg, δCH, δNHx and δNCN vibrational modes of the cation.
In the third region, the vibrational manifestations of δCH, νrg, δNHx and νC-NH2, νrg, δNHx, δCH are attributed to the bands at 1482, 1442 cm−1 (1481 cm−1 Raman spectrum). The characteristic vibrational mixed modes (δCH, νrg, δNH) are located in the infrared spectrum at 1354 cm−1 as a strong narrow band. The medium intensity band at 1231 cm−1 (1234 cm−1 Raman spectrum) is assigned to the δCH, νrg mixed modes of the cation.
As to the anion, the vibrational bands with medium intensity at 1180, 1120 and 1075 cm−1 recorded in the infrared spectrum (1147, 1126, 1083 cm−1 Raman spectrum) correspond to νasPO3 and ρNH2, νrg, δrg mixed modes. The manifestation of the symmetric stretching vibration νsPO3 is attributed to the bands at 998, 983 cm−1 with a shoulder at 1029 cm−1 (1033 cm−1 Raman spectrum). A very strong Raman active band collected at 878 cm−1 and a medium intensity band at 868 cm−1 observed in the infrared spectrum are mainly attributed to the symmetric ring vibration and νsrg, δsrg, δNH mixed modes. In the infrared spectrum, a broad band at 826 cm−1 is assigned to the νPF, while a shoulder at 786 cm−1 (794 cm−1 Raman spectrum) is assigned to νPF and γCH. The vibrational manifestation of δFPO3 deformation modes is located at 732 cm−1 as a broad medium intensity band and a medium band at 475 cm−1 in the infrared spectrum. The latter band overlaps with the δCNC vibrational mode and has a counterpart in the Raman spectrum at 476 cm−1. The vibrational manifestation of δPO3 is recorded in the infrared region 630–480 cm−1 with maxima at 618, 579 and 507 cm−1 (580 and 533 cm−1 Raman spectra).
4. Conclusions
The structural properties of the title structure turned out to be usual, with exception of a rather short N-H···O hydrogen bonds in comparison to those bonds present in the sulphates of substituted 2-aminopyrimidinium cations. This short N-H···O bond is due to the fact that the unsubstituted 2-aminopyrimidinium molecules present in the title structures are relatively small and may get closer to the hydrogen trioxofluorophosphate or trioxofluorophosphate anions. However, the pertinent plots regarding the distances N···O in Nprimary-H···O vs. Nsecondary-H···O, as well as the distances HN-primary···O vs. HN-secondary···O, situate the second structure into an extremal position due to a relatively very short Nsecondary-H···O bond.
The vibrational spectra of both title structures, 2-aminopyrimidinium hydrogen trioxofluorophosphate, (I), and bis(2-aminopyrimidinium) trioxofluorophosphate, (II), show similarity to the vibrational manifestations of the 2-aminopyrimidinium cation in 2-aminopyrimidinium hydrogen phosphite and 2-aminopyrimidinium dihydrogen phosphate monohydrate, respectively.
Supplementary Materials
The following supporting information associated with this article can be found can be downloaded at: https://www.mdpi.com/article/10.3390/cryst15110952/s1, Table S1: Details regarding preparation of the title structures that have been isolated from the crucible, Table S2: Details regarding preparation of the compounds of 2-aminopyrimidine (C4H5N3) and H3PO3 that have been isolated from the crucible, Table S3: Closest distances between the atoms from the adjacent rings in 2-aminopyrimidinium hydrogen trioxofluorophosphate, (I), Table S4: Closest distances between the atoms from the adjacent “a” rings in 2-aminopyrimidinium trioxofluorophosphate, (II), Table S5: Closest distances between the atoms from the adjacent “b” rings in 2-aminopyrimidinium trioxofluorophosphate, (II), Table S6: Results of the nuclear site group analysis for 2-aminopyrimidinium hydrogen trioxofluorophosphate, (I), and bis(2-aminopyrimidinium) trioxofluorophosphate, (II), Table S7: Correlation diagram of [HPO3F]− internal modes in 2-aminopyrimidinium hydrogen trioxofluorophosphate crystals, (I), Table S8: Correlation diagram of [PO3F]2− internal modes in bis(2-aminopyrimidinium) trioxofluorophosphate crystals, (II), Table S9: Recorded ATR-FTIR and the Raman bands maxima (cm−1) of bis(2-aminopyrimidinium) trioxofluorophosphate and their assignment, Figure S1: Stacking of the rings in 2-aminopyrimidinium hydrogen trioxofluorophosphate. (I), Figure S2: Stacking of the rings in bis(2-aminopyrimidinium) trioxofluorophosphate, (II), the molecules “a”, Figure S3: Stacking of the rings in bis(2-aminopyrimidinium) trioxofluorophosphate, (II), the molecules “b”, Figure S4: The dependence of the longest P—O bond length on the P—F bond length in trioxofluorophosphates, as well as in hydrogen trioxofluorophosphates, Figure S5: Comparison of vibrational spectra of 2-aminopyrimidinium hydrogen trioxofluorophosphate and 2-aminopyrimidinium hydrogen phosphite, Figure S6: Comparison of vibrational spectra of bis(2-aminopyrimidinium) trioxofluorophosphate and 2-aminopyrimidinium dihydrogen phosphate monohydrate, Figure S7: Micro-FTIR (ATR) and micro-Raman spectra of 2-aminopyrimidinium dihydrogen phosphate monohydrate crystals, Figure S8: Comparison of the recorded (298 K) powder diffraction patterns of 2-aminopyrimidinium dihydrogen phosphate monohydrate (black line; 2-HAMPH2PO4H2O) with the theoretical diffraction pattern (red line) calculated using single-crystal diffraction data 120 K; Paragraphs: Crystallization of 2-aminopyrimidinium dihydrogen phosphate monohydrate, Powder X-ray diffraction, Comparison of vibrational spectra of (I) and 2-aminopyrimidinium hydrogen phosphite [], Comparison of vibrational spectra of (II) and 2-aminopyrimidinium dihydrogen phosphate monohydrate [], and Comparison of the interpretation of the vibrational spectra of 2-aminopyrimidinium dihydrogen phosphate monohydrate in [] and in the present study.
Author Contributions
Conceptualization, I.M. and J.F.; methodology, I.M., I.C. and J.F.; investigation, I.M. and J.F.; resources, I.M. and J.F.; writing—original draft preparation, I.M. and J.F.; writing—review and editing, I.M. and J.F.; visualization, I.M. and J.F.; supervision, I.M. and J.F. All authors have read and agreed to the published version of the manuscript.
Funding
Financial support from the Ministry of Education Youth and Sports, CUCAM Centre of Excellence (OP VVV “Excellent Research Teams” project No.CZ.02.1.01/0.0/0.0/15_003/0000417) is gratefully acknowledged.
Data Availability Statement
The data presented in this study are available upon request from the corresponding author.
Acknowledgments
Support by the funding organizations is gratefully acknowledged.
Conflicts of Interest
The authors declare no conflicts of interest.
References
- Yang, D.-X.; Lv, Y.-L.; Guo, J.-D.; Gao, W.-Y.; Liu, W.; Tang, R.-L. From (C6H5N2)2CdCl4 to (C6H5N2)2ZnCl4, Chirality Transformation to Realize a Nonlinear Optical Organic-Inorganic Hybrid Halide with Balanced Comprehensive Performance. Inorg. Chem. 2025, 64, 3643–3648. [Google Scholar] [CrossRef]
- Tang, R.L.; Yang, D.X.; Ma, L.; Lv, Y.L.; Liu, W.L.; Guo, S.P. (C6H5N2)HgCl3: Discovery of a Polar Hg-Based Hybrid Halide as Preeminent Nonlinear Optical and Birefringent Material Activated by π-Conjugated Organic Cation Substitution. Adv. Opt. Mater. 2025, 13, 2403044. [Google Scholar] [CrossRef]
- Etter, M.C.; Adsmond, D.A.; Britton, D. 2-Aminopyrimidine Succinic Acid (1/1) Cocrystal. Acta Crystallogr. Sect. C Cryst. Struct. Commun. 1990, 46, 933–934. [Google Scholar] [CrossRef]
- Byriel, K.A.; Kennard, C.H.L.; Lynch, D.E.; Smith, G.; Thompson, J.G. Molecular Cocrystals of Carboxylic-Acids. 9. Carboxylic-Acid Interactions with Organic Heterocyclic Bases-the Crystal-Structures of the Adducts of (2,4-Dichlorophenoxy)Acetic Acid with 3-Hydroxypyridine, 2,4,6-Trinitrobenzoic Acid with 2-Aminopyrimidine, and 4-Nitrobenzoic Acid with 3-Amino-1,2,4-Triazole. Aust. J. Chem. 1992, 45, 969–981. [Google Scholar] [CrossRef]
- Lynch, D.E.; Smith, G.; Freney, D.; Byriel, K.A.; Kennard, C.H.L. Molecular Cocrystals of Carboxylic-Acids. 15. Preparation and Characterization of Heterocyclic Base Adducts with a Series of Carboxylic-Acids, and the Crystal-Structures of the Adducts of 2-Aminopyrimidine with 2,6-Dihydroxybenzoic Acid, 4-Aminobenzoic Acid, Phenoxyacetic Acid, (2,4-Dichlorophenoxy)Acetic Acid, (3,4-Dichlorophenoxy)-Acetic Acid and Salicylic-Acid, and 2-Aminopyridine with 2,6-Dihydroxybenzoic Acid. Aust. J. Chem. 1994, 47, 1097–1115. [Google Scholar] [CrossRef]
- Jin, S.; Wang, D. Hydrogen Bonded 3D Supramolecular Architectures of Two Organic Salts Assembled from 2-Aminoheterocyclic Compounds and Phosphoric Acid. J. Chem. Crystallogr. 2012, 42, 276–282. [Google Scholar] [CrossRef]
- Shan, N.; Bond, A.D.; Jones, W. Supramolecular architectures of cyclohexane-1, 3, 5-tricarboxylic acid in acid:base complexes. N. J. Chem. 2003, 27, 365–371. [Google Scholar] [CrossRef]
- Goswami, S.; Mahapatra, A.K. Molecular recognition induced supramolecular array of 2-aminopyrimidine with terephthalic acid, 1,4-phenylenediacetic acid and fumaric acid in solid state H-bonding and π-stacking interactions. Supramol. Chem. 1999, 11, 25–33. [Google Scholar] [CrossRef]
- Mirzaei, M.; Sadeghi, F.; Molcanov, K.; Zareba, J.K.; Gomila, R.M.; Frontera, A. Recurrent Supramolecular Motifs in a Series of Acid Base Adducts Based on Pyridine-2,5-Dicarboxylic Acid-Oxide and Organic Bases: Inter- and Intramolecular Hydrogen Bonding. Cryst. Growth Des. 2020, 20, 1738–1751. [Google Scholar] [CrossRef]
- Thangarasu, S.; Kumar, S.S.; Athimoolam, S.; Sridhar, B.; Bahadur, A.A.; Shanmugam, R.; Thamaraichelvan, A. Synthesis, structure, spectral, thermal analyses and DFT calculation of a hydrogen bonded crystal: 2-Aminopyrimidinium dihydrogenphosphate monohydrate. J. Mol. Struct. 2014, 1074, 107–117. [Google Scholar] [CrossRef]
- Kloda, M.; Matulková, I.; Císařová, I.; Becker, P.; Bohatý, L.; Němec, P.; Gyepes, R.; Němec, I. Cocrystals of 2-Aminopyrimidine with Boric Acid—Crystal Engineering of a Novel Nonlinear Optically (NLO) Active Crystal. Crystals 2019, 9, 403. [Google Scholar] [CrossRef]
- Zhang, Z.-P.; Liu, X.; Liu, X.; Lu, Z.-W.; Sui, X.; Zhen, B.-Y.; Lin, Z.; Chen, L.; Wu, L.-M. Driving nonlinear optical activity with dipolar 2-aminopyrimidinium cation in (C4H6N3)+(H2PO3)−. Chem. Mater. 2022, 34, 1976–1984. [Google Scholar] [CrossRef]
- Matulková, I.; Bohatý, L.; Becker, P.; Císařová, I.; Gyepes, R.; Fridrichová, M.; Kroupa, J.; Němec, P.; Němec, I. Extended study of crystal structures, optical properties and vibrational spectra of polar 2-aminopyrimidinium hydrogen phosphite and three centrosymmetric salts-bis(2-aminopyrimidinium) sulfate monohydrate and two 2-aminopyrimidinium hydrogen sulfate polymorphs. Opt. Mater. 2025, 164, 117033. [Google Scholar] [CrossRef]
- Fábry, J.; Fridrichova, M.; Dušek, M.; Fejfarová, K.; Krupková, R. Mixed crystals of 2-carbamoylguanidinium with hydrogen fluorophosphonate and hydrogen phosphite in the ratios 1:0, 0.76 (2):0.24 (2) and 0.115 (7):0.885 (7). Acta Crystallogr. Sect. C Cryst. Struct. Commun. 2012, 68, o76–o83. [Google Scholar] [CrossRef]
- Matulková, I.; Andreoni, R.; Císařová, I.; Němec, I.; Fábry, J. Crystallographic aspects of hydrated salts of 4,6-diaminopyrimidine with the first five dicarboxylic acids. Z. Krist. Cryst. Mater. 2017, 232, 471–484. [Google Scholar] [CrossRef]
- Matulková, I.; Fábry, J.; Eigner, V.; Dušek, M.; Kroupa, J.; Němec, I. Isostructural crystals of bis(guanidinium) trioxofluoro- phosphate/phosphite in the ratio 1/0, 0.716/0.284, 0.501/0.499, 0.268/0.732, 0/1–crystal structures, vibrational spectra and second harmonic generation. Crystals 2022, 12, 1694. [Google Scholar] [CrossRef]
- Lima-de-Faria, J.; Hellner, E.; Liebau, F.; Makovicky, E.; Parthe, E. Nomenclature of Inorganic Structure Types—Report of the International-Union-of-Crystallography Commission-on-Crystallographic-Nomenclature Subcommittee on the Nomenclature of Inorganic Structure Types. Acta Crystallogr. A 1990, 46, 1–11. [Google Scholar] [CrossRef]
- Xiong, L.; Chen, J.; Lu, J.; Pan, C.-Y.; Wu, L.-M. Monofluorophosphates: A New Source of Deep-Ultraviolet Nonlinear Optical Materials. Chem. Mater. 2018, 30, 7823–7830. [Google Scholar] [CrossRef]
- Schülke, U.; Kayser, R. Herstellung von Fluorophosphaten, Difluorophosphaten, Fluorophsophonaten und Fluorophosphiten in fluoridhaltigen Harnstoffschmelzen. Z. Anorg. Allg. Chem. 1991, 600, 221–226. [Google Scholar] [CrossRef]
- Palatinus, L.; Chapuis, G. SUPERFLIP—A computer program for the solution of crystal structures by charge flipping in arbitrary dimensions. J. Appl. Crystallogr. 2007, 40, 786–790. [Google Scholar] [CrossRef]
- Burla, M.C.; Caliandro, R.; Carrozzini, B.; Cascarano, G.L.; Cuocci, C.; Giacovazzo, C.; Mallamo, M.; Mazzone, A.; Polidori, G. Crystal structure determination and refinement via SIR2014. J. Appl. Crystallogr. 2015, 48, 306–309. [Google Scholar] [CrossRef]
- Sevvana, M.; Ruf, M.; Usón, I.; Shedrick, G.M.; Herbst-Irmer, R. Non-merohedral twinning: From minerals to proteins. Acta Crystallogr. D 2019, 75, 1040–1050. [Google Scholar] [CrossRef]
- Bruker. SADABS, Bruker/Siemens Area Detector Absorption Program, version 2014/2; Bruker AXS: Madison, WI, USA, 2005.
- Becker, P.J.; Coppens, P. Extinction within the Limit of Validity of the Darwin Transfer Equations. I. General Formalisms for Primary and Secondary Extinction and Their Application to Spherical Crystals. Acta Crystallogr. A 1974, 30, 129–147. [Google Scholar] [CrossRef]
- Petříček, V.; Dušek, M.; Palatinus, L. Crystallographic Computing System JANA2006: General features. Z. Krist. Cryst. Mater. 2014, 229, 345–352. [Google Scholar] [CrossRef]
- Bruker. SAINT. Data Reduction and Correction Program, version 8.40B; Bruker AXS Inc.: Madison, WI, USA, 2016.
- Brandenburg, K. Diamond, version 3.2q; Crystal Impact GbR: Bonn, Germany, 1997.
- Spek, A.L. Structure validation in chemical crystallography. Acta Crystallogr. Sect. D Struct. Biol. 2009, 65, 148–155. [Google Scholar] [CrossRef]
- OriginPro, version v6.1052; OriginLab Corporation: Northampton, MA, USA, 2015.
- Omnic for Dispersive Raman 8. Omnic for Dispersive Raman 8.2.121, version 8.2; Thermo Fisher Scientific Inc.: Waltham, MA, USA, 2010.
- Gilli, G.; Gilli, P. The Nature of the Hydrogen Bond, Outline of a Comprehensive Hydrogen Bond Theory; Oxford University Press: Oxford, UK; New York, NY, USA, 2009. [Google Scholar]
- Bertolasi, V.; Pretto, L.; Gilli, P.; Ferretti, V.; Gilli, G. Hydrogen-bonded supramolecular structures in co-crystals of β- or ζ-diketone enols with 2,6-diaminopyridine or 2,4-diaminopyrimidine. N. J. Chem. 2002, 26, 1559–1566. [Google Scholar] [CrossRef]
- Matulková, I.; Fábry, J.; Němec, I.; Císařová, I.; Vaněk, P. Migrating hydrogen in 2,4,6-triaminopyrimidinium(1+)x hydrogen trioxofluorophosphate(-)x monohydrate/2,4,6-triaminopyrimidinium(2+)1–x trioxofluorophosphate(2–)1–x monohydrate (0.0 < x < 0.73) with changing temperature. Acta Crystallogr. Sect. B Struct. Sci 2017, 73, 1114–1124. [Google Scholar] [CrossRef]
- Groom, C.R.; Bruno, I.J.; Lightfoot, M.P.; Ward, S.C. The Cambridge Structural Database. Acta Crystallogr. Sect. B Struct. Sci 2016, 72, 171–179. [Google Scholar] [CrossRef]
- Fábry, J. A resonance-assisted intra molecular hydrogen bond in compounds containing 2-hydroxy-3,5-di nitro benzoic acid and its various deprotonated forms: Redetermination of several related structures. Acta Crystallogr. E 2018, 74, 1344–1357. [Google Scholar] [CrossRef]
- Dunitz, J.D.; Taylor, R. Organic Fluorine Hardly Ever Accepts Hydrogen Bonds. Chem. Eur. J. 1997, 3, 89–98. [Google Scholar] [CrossRef]
- Shimoni, L.; Glusker, J.P. The Geometry of Intermolecular Interactions in Some Crystalline Fluorine-Containing Organic-Compounds. Struct. Chem. 1994, 5, 383–397. [Google Scholar] [CrossRef]
- Krupková, R.; Fábry, J.; Císarová, I.; Vanek, P. Bis(ammonium) fluorophosphate at room temperature. Acta Crystallogr. Sect. C Struct. Chem. 2002, 58, i66–i68. [Google Scholar] [CrossRef]
- Thakuria, R.; Nath, N.K.; Saha, B.K. The Nature and Applications of π-π Interactions: A Perspective. Cryst. Growth Des. 2019, 19, 523–528. [Google Scholar] [CrossRef]
- Sheldrick, G.M. Crystal structure refinement with SHELXL. Acta Crystallogr. Sect. C Cryst. Struct. Commun. 2015, 71, 3–8. [Google Scholar] [CrossRef]
- Weil, M.; Baran, E.J.; Kremer, R.K.; Libowitzky, E. Synthesis, Crystal Structure, and Properties of Mn(PO3F)(H2O)2. Z. Anorg. Allg. Chem. 2015, 641, 184–191. [Google Scholar] [CrossRef]
- Bühler, K.; Bues, W. Schwingungsspektren von Fluorophosphatschmelzen und -kristallen. Z. Anorg. Allg. Chem. 1961, 308, 62–71. [Google Scholar] [CrossRef]
- Weil, M.; Puchberger, M.; Baran, E.J. Preparation and Characterization of Dimercury(I) Monofluorophosphate(V), Hg2PO3F: Crystal Structure, Thermal Behavior, Vibrational Spectra, and Solid-State 31P and 19F NMR Spectra. Inorg. Chem. 2004, 43, 8330–8335. [Google Scholar] [CrossRef]
- Nelson, D.G.A.; Williamson, B.E. Raman Spectra of Phosphate and Monofluorophosphate Ions in Several Dentally-Relevant Materials. Caries Res. 1985, 19, 113–121. [Google Scholar] [CrossRef]
- Rousseau, D.L.; Bauman, R.P.; Porto, S.P.S. Normal Mode Determination in Crystals. J. Raman Spectrosc. 1981, 10, 253–290. [Google Scholar] [CrossRef]
- Novak, A. Hydrogen Bonding in solids Correlation of Spectroscopic and Crystallographic Data. In Large Molecules. Structure and Bonding; Springer: Berlin/Heidelberg, Germany, 1974; Volume 18, pp. 177–216. [Google Scholar] [CrossRef]
- Lautié, A.; Froment, F.; Novak, A. Relationship between NH Stretching Frequencies and N···O Distances of Crystals Containing NH···O Hydrogen-Bonds. Spectrosc. Lett. 1976, 9, 289–299. [Google Scholar] [CrossRef]
- Votrubcová, I. Novel Prospective Materials for Nonlinear Optics. Bachelor’s Thesis, Charles University, Prague, Czech Republic, 2010. [Google Scholar]
Disclaimer/Publisher’s Note: The statements, opinions and data contained in all publications are solely those of the individual author(s) and contributor(s) and not of MDPI and/or the editor(s). MDPI and/or the editor(s) disclaim responsibility for any injury to people or property resulting from any ideas, methods, instructions or products referred to in the content. |
© 2025 by the authors. Licensee MDPI, Basel, Switzerland. This article is an open access article distributed under the terms and conditions of the Creative Commons Attribution (CC BY) license (https://creativecommons.org/licenses/by/4.0/).