Abstract
High temperature oxidation is considered to play an essential role in the thickness debit effect on the creep rupture life of Ni-based single crystal (SC) superalloys. In order to clarify thickness effects, thin-walled specimens of different thickness (t = 0.1, 0.3, 1.0 mm) were prepared. Cyclic and isothermal oxidation tests of a high-Al Ni-based SC superalloy IC21 were carried out at 900 °C and 1100 °C in order to study the thickness effects on the oxidation behavior and consequent microstructural degradation. Thin-walled specimens of S01-N exhibited a good oxidation resistance when the protective scale-forming elements were enough in the matrix. Specimen thickness tuned the oxidation kinetics by changing the spallation behavior but had few influences on the thermodynamics. The easier stress relief via creep deformation in thin specimens is the main reason behind this phenomenon. Moreover, the obvious temperature effects on the multilayer oxide scales caused the different thickness-related spallation behaviors. Weaker microstructural degradation appeared and was further mitigated by reduced specimen thickness. Sufficient Al content is considered to be indispensable for the formation of protective α-Al2O3 scale with less degradation of matrix during the high temperature oxidation of thin-walled Ni-based SC superalloy castings.
1. Introduction
Ni-based single crystal (SC) superalloys have been extensively applied in the turbine blades of advanced aero-engines owing to their outstanding creep resistance at high temperature [1]. In order to improve the service performances of these hot sections further, decreasing the casting wall thickness of blades has become an efficient way to meet the requirements of metal cooling schemes and lower overall weight [2,3]. However, reduced wall thickness has been verified to increase the strain rate and decrease the creep rupture life of Ni-based superalloys, which is known as the thickness debit effect and brings a new challenge for the materials design of superalloys [4,5,6,7,8,9,10,11]. Based on many previous studies focusing on this issue, high temperature oxidation has been considered to be one of the critical factors responsible for this effect [12,13,14,15]. The obviously shortened creep life of a thin specimen might be attributed to the notable microstructure degradation as well as the formation of brittle oxide scales in a service environment [4,11,12,13,14,15]. Nevertheless, the synergistic effects of other factors with high temperature oxidation make the mechanisms behind the phenomenon unclear. Therefore, it is essential to study the specimen thickness effects on the oxidation behavior of a high-aluminum Ni-based single crystal superalloy and consequent degradation of the γ’-Ni3Al phase.
In the literature [16,17,18,19], many studies report the oxidation behavior of superalloys at lower (800~900 °C) and higher temperatures (1050~1150 °C). At higher temperatures, the oxide scale formed on alloy is composed of α-alumina, spinel and rutile, but that is not the case at lower temperature. At lower temperatures, the formation of a protective alumina scale may be not achieved. On the other hand, the outside of the blade was serviced under cyclic oxidation conditions at 1100 °C. However, the inside of the blades was subjected to lower temperatures [20]. In order to quantify the thickness effect on the oxidation kinetics at lower and higher temperatures, the typical temperatures of 900 °C and 1100 °C were used in this study. The oxidation resistances of Ni-based SC superalloys at high temperature are generally provided by the formation of protective alumina (Al2O3) and/or chromic oxide (Cr2O3) scales. Due to the lower diffusion in alumina and the certain amount of Al required to form the γ’-Ni3Al strengthening precipitates, Al content is more crucial to maintain the oxidation resistances of superalloys, while Cr is usually micro-alloyed for further improvement. Previous studies have shown that the specimen thickness has negligible influence on the initial oxidation of Ni-based alloys before the oxide scale has reached a critical thickness [12]. However, the specimen thickness effects on the oxidation kinetics and spallation behavior become significant with increasing exposure time [12]. By applying a probabilistic spallation model, the thickness effect on the corrosion behavior of CMSX-4 was attributed to the differences in spallation mechanisms [21]. The distinct thermal stresses generated in the oxide scale of the specimens with different thicknesses, which resulted from the mismatch in thermal expansion and elastic modulus between oxide and matrix alloy, were considered to be the main reasons [12,21]. On the other hand, the near-surface microstructures of alumina-forming Ni-based SC superalloys were considered to be strongly altered by high-temperature oxidation, which has been verified both by modelling and experiments [13,14]. Moreover, this microstructure degradation was found to be enhanced with increasing temperature and decreasing specimen thickness. However, the thickness effects associated with high-temperature oxidation might be different due to varied compositions of superalloys, especially the Al content closely related to the formation of protective alumina scale. To our best knowledge, few studies focus on this composition-related thickness effect on the oxidation behavior and microstructural evolution, which are actually important for the materials design of modern Ni-based SC superalloys for thin-walled blades. The novelty of this research was combining thickness with different Al content together to suggest an alloy design for a thin-walled blade.
In the present work, the thickness effects on the oxidation behavior and consequent microstructure degradation of a newly designed Ni-based SC superalloy with high Al content (IC21) were studied via high-temperature oxidation tests. The oxidation behaviors at different temperatures were evaluated by focusing on the oxidation kinetics and spallation mechanisms. We also paid close attention to the composition effects of Al content on the γ’ degradation caused by oxidation in thin specimens, based on extensive investigations on the specimens with different original microstructures. The rest of the present paper is organized as follows. The specimen preparation and experimental methods are described firstly in Section 2. Then, the oxidation behaviors of the specimens with different thicknesses at 900 °C and 1100 °C are evaluated by oxidation kinetics, and the composition and microstructure of the oxide scale are examined in Section 3.1. The oxidation mechanisms are also discussed from the aspects of thermodynamics and kinetics related to spallation behavior. In Section 3.2, the variation trends in the thickness of the γ’ degradation zone caused by oxidation are analyzed and further compared among the alloy specimens with different thicknesses. The microstructural degradation during oxidation that varied with the original Al content in the thin specimen is also discussed in order to study the composition related thickness effects. Finally, all the main findings are summarized in Section 4.
2. Experimental Methods
2.1. Specimen Preparation
A newly designed Ni-based SC superalloy with the nominal composition of Ni-(6.5~8.2), Al-(8.0–12.6), Mo-(1.0–4.5), Ta-(0.8–1.8), Re-(1.3–3.2), Cr-(0.1–0.4) Hf -minor Ce and Y (in wt.%) is studied in the present work. The main feature of the studied alloy is its high content of Al, which results in a higher volume fraction of γ’ precipitates up to 82%. A casting plate of this superalloy was prepared by high rate solidification. The specimens with the crystal orientation bias within 5° from [001] direction were chosen for the oxidation tests at high temperature. In order to eliminate the composition segregation, subsequent heat treatments were conducted following the regime below: 1315 °C/4 h + 1320 °C/6 h + 1325 °C/6 h (air cooling) + 1100 °C/2 h (air cooling) + 870 °C/32 h (air cooling). Different thicknesses (t = 0.1, 0.3, 1.0 mm) of specimens were cut from the core section of the heat-treated superalloy plate paralleling the solidification direction. Here, it is worth mentioning that we intended to obtain different microstructures from surface to core in the heat-treated plate by applying the highest solid solution temperature of 1325 °C in air. Additional thin specimens with a thickness of 0.1 mm were cut further from the plate with different distances away from the surface in order to obtain a variational Al content and microstructure during solid solution in an air environment. All the detailed information of the specimens for oxidation tests are shown in Table 1. Before the oxidation tests, all the specimen surfaces were ground with 2000-grit SiC paper and cleaned ultrasonically in acetone for 5 min.

Table 1.
Detailed information of studied superalloy specimens for oxidation tests at high temperature.
2.2. Oxidation Tests at High Temperature
Cyclic oxidation tests were conducted in a tube furnace at 900 °C and 1100 °C for 100 h. The length and width of the thin-walled specimen were 10 mm and 8 mm with a different thickness. The specimen was put in a pre-annealed Al2O3 crucible to protect it from pollution. During the cyclic oxidation, the specimen was exposed for 50 min in the furnace and cooled for 10 min to room temperature by an air fan. The heating rates and cooling rates were about 10 °C/s and 20 °C/s, respectively. The mass of every specimen was measured three times before and after different duration times of oxidation by an electronic balance with a precision of 10−5 g. The average values were used to calculate the mass gain per unit area and plot the kinetic curves. In addition, the mass change was also weighted in order to evaluate the spallation behavior. For the thin specimens with different original compositions and microstructures, isothermal oxidation tests were carried out at 900 °C and 1100 °C for 100 h as well.
The microstructural morphologies of oxide scales were observed by using a Supra 55 scanning electron microscopy (SEM), and all the images were collected in backscattered electron (BSE) mode. Composition analyses were also carried out by a D/Max type X-ray diffractometer (XRD), an energy-dispersive spectroscopy (EDS) and a JXA-8230 electron microprobe analysis (EPMA). In order to evaluate the spallation mechanism during oxidation, the residual stress in oxide scale was measured via the shifts of the corresponding XRD spectral peaks. The shift of the XRD spectral peak toward the low angle direction indicates the generation of tensile stress. The value of biaxial stress is calculated by using the so-called sin2ψ method as follows,
in which σϕ is stress in direction ϕ, E is Young’s modulus, ν is the Poisson ratio, θ0 and θ are the standard and real diffraction angles, respectively, and ψ is the tilt angle.
For the oxides far away from the surface, which usually have weaker XRD spectral peaks, a laser Raman microprobe (LabRAM HR Evolution) was used to determine the residual stress in oxide scale instead. The measurements were conducted at ten different locations on the specimen surface after oxidation by using a He-Ne laser beam. The biaxial stress σ (in GPa) was calculated by the following equation,
in which Δν (in cm−1) represents the frequency shift of the characteristic luminescence line of a specific oxide.
3. Results and Discussion
3.1. Thickness Effects on Oxidation Behavior at Different Temperatures
3.1.1. Oxidation Kinetics
The cyclic oxidation kinetics of the superalloy specimens with different thicknesses was evaluated by the mass gains per unit area as a function of exposure time at 900 °C and 1100 °C. In order to eliminate the effects of the original microstructure (i.e., composition effects), the specimens cut from the core section (S01-N, S03-N, S10-N) were tested. Figure 1 shows the microstructure of the core section (the matrix alloy) from which specimens S01-N, S03-N and S10-N were cut.
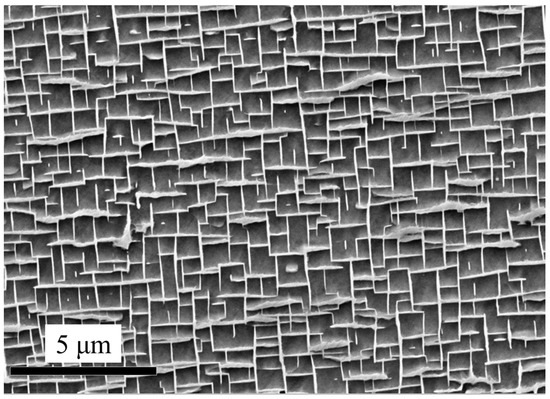
Figure 1.
Microstructure of the core section from which the specimens S01-N, S03-N and S10-N were cut.
As shown in Figure 2a, the mass gain curves basically follow the parabolic law at 900 °C. However, the oxidations at 1100 °C reached a steady stage after 20 h, although their initial stage also followed the parabolic law but with obviously higher rates than those at 900 °C. In order to facilitate the comparison between different oxidation temperatures, the parabolic rate constant kp was calculated based on the equation for parabolic law,
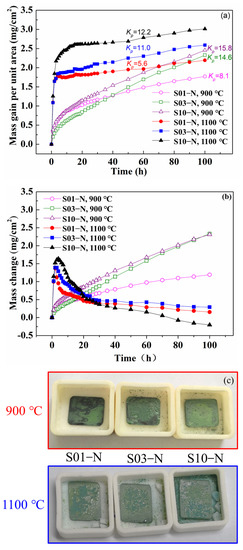
Figure 2.
Cyclic oxidation kinetic curves of the specimens of IC21 alloy with different thicknesses at 900 °C and 1100 °C: (a) mass gain; (b) mass change. Parabolic rate constant kp is also calculated according to Equation (2) and shown in (a) with a unit of 10−12 g2·cm−4·s −1; (c) macrostructure after 100 h cycle oxidation at 900 °C and 1100 °C.
The results shown in Figure 2 indicate that the parabolic rate constant was smaller for the specimens with smaller thicknesses both at 900 °C and 1100 °C. The mass gain of S01-N, S03-N and S10-N specimens were 1.77, 2.32 and 2.45 mg/cm2 at 900 °C and 2.19, 2.59 and 3.01 mg/cm2 at 1100 °C. Moreover, the differences in the oxidation rate caused by varied specimen thickness were more obvious for 900 °C because of the faster achievement of a steady stage at 1100 °C. On the other hand, the absolute values of mass gain per unit area at specific exposure time were also remarkably lower for the thinner specimens. This is especially true for the cyclic oxidation at 1100 °C with a larger change of 0.81 mg/cm−2 between S01-N and S10-N after 100 h compared with that of 0.69 mg/cm−2 at 900 °C. As a result, the mass gain of the thin specimen (S01-N) after 100 h of cyclic oxidation at 1100 °C was even smaller than those of the thicker specimens (S03-N and S10-N) at 900 °C. The spallation behaviors were further analyzed by measuring the mass of spalling oxides varied with exposure time (Figure 2b). The mass change values close to mass gain suggest that there was almost no spallation at 900 °C. However, powdery spallation of oxides was still observed in the crucibles containing S03-N and S10-N samples as Figure 2c showed. In contrast, oxide spallation is proved to evidently happen at 1100 °C, which was enhanced by longer exposure time and larger specimen thickness. The oxide spallation of S10-N was more obvious than S01-N and S03-N.
3.1.2. Composition and Microstructure of Oxide Scale
The oxidation products formed after 100 h of cyclic oxidation at 900 °C and 1100 °C were identified by XRD. As shown in Figure 3, NiO and Al2O3 were detected both at 900 °C and 1100 °C, but the spectral peak intensity of Al2O3 was higher for 1100 °C. However, Cr2O3, NiMoO4 and MoO3 only presented for the oxidation at 900 °C, while spectral peaks of NiTa2O6 were detected for that at 1100 °C. Moreover, the spinel oxide of NiCr2O4 formed at 900 °C mostly changed to NiAl2O4 for the oxidation at 1100 °C. It is worth noting that the type of oxides was quite similar for the specimens with different thicknesses oxidized at the same temperature except for the slight variations in content. This phenomenon suggests that the thermodynamics process of cyclic oxidation at a specific temperature was hardly changed by the specimen thickness.
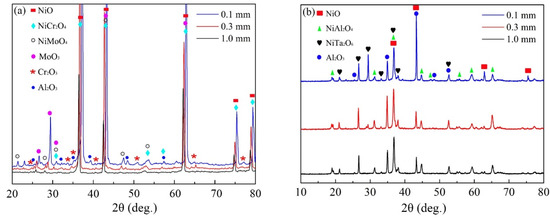
Figure 3.
XRD patterns of oxides formed on the specimens of IC21 alloy with different thicknesses after 100 h of cyclic oxidation: (a) 900 °C; (b) 1100 °C.
The cross-section morphologies and compositions of the oxide scales formed after 100 h of cyclic oxidation were investigated and compared further among the specimens with different thicknesses as well as between 900 °C and 1100 °C. Multilayer oxide scales presented in all the specimens with an outmost layer of single oxide NiO (Figure 4 and Figure 5). The columnar layer of NiO was discontinuous at 1100 °C due to the oxide spallation (Figure 5), while cracking was observed mainly at the interface between NiO and the oxide layer beneath in the thicker specimens for the cyclic oxidation at 900 °C (Figure 4b,c). Complex oxide layer of NiAl2O4 following a layer of Al2O3 formed beneath at 1100 °C, which became more continuous and denser for the thinner specimen. A small amount of oxide particles with relatively higher concentrations of Ta were detected at 1100 °C, which are consistent with the XRD spectral peaks of NiTa2O6. Instead, a complex oxide layer of NiCr2O4 and NiMoO4 formed during the cyclic oxidation at 900 °C (Figure 4). A thin discontinuous layer of Cr2O3 and MoO3 was also detected along with an internal oxidation zone of Al2O3 with dendritic morphology beneath. These two layers penetrated to each other at some locations of the thicker specimen (Figure 5b) and resulted in a blurred interface in between. Moreover, the internal oxidation of Al is considered to be enhanced in the thick specimen (Figure 5c) compared with that in the thin one (Figure 5a). Here, we should emphasize that there were only a few scattered internal Al2O3 formed after 100 h of cyclic oxidation at 1100 °C. Nevertheless, the preferable oxidation of Al in γ’ still resulted in the formation of an Al-depletion zone between the oxide scale and the matrix alloy at 1100 °C, similar to the residual part among the dendritic internal oxides at 900 °C. This Al-depletion zone is commonly known as the γ’-free layer, and the near surface area of matrix alloy might have a reduced fraction of γ’ precipitates as well (so-called γ’-reduced layer). The detailed behaviors of these microstructural degradations varied with specimen thickness and oxidation temperature and will be discussed separately in Section 3.2.
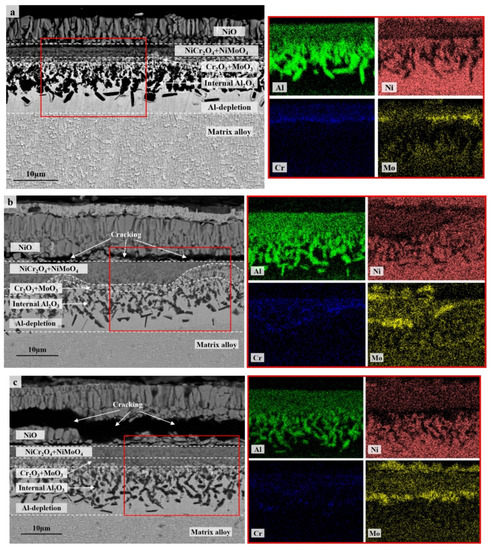
Figure 4.
Cross-section morphologies (BSE) and composition distributions (EDS map scanning) of the oxide scales on the specimens of IC21 alloy with different thicknesses after 100 h of cyclic oxidation at 900 °C: (a) S01-N, 0.1 mm; (b) S03-N, 0.3 mm; (c) S10-N, 1.0 mm. The red square is the area of EDS map scanning.

Figure 5.
Cross-section morphologies (BSE) and composition distributions (EDS map scanning) of the oxide scales on the specimens of IC21 alloy with different thicknesses after 100 h of cyclic oxidation at 1100 °C: (a) S01-N, 0.1 mm; (b) S03-N, 0.3 mm; (c) S10-N, 1.0 mm. The red square is the area of EDS map scanning.
3.1.3. Oxidation Mechanisms
Thermodynamics
Based on the results of the oxidation products and oxide scales above, the oxidation mechanisms of IC21 alloy are considered to be different for 900 °C and 1100 °C. The relationship between the parabolic rate constant and the temperature is able to roughly predict the type of oxide formed for Ni-based superalloys [22,23]. The curves for the formations of NiO, Cr2O3, θ- and α-Al2O3 approximated in linear law are plotted in Figure 6 according to previous data [24]. As shown in Figure 6, the parabolic rate constants of IC21 alloy for the oxidation at 900 °C are all close to the line for Cr2O3. For the oxidation at 1100 °C, the rate constants in the initial stage locate between the lines for NiO and Cr2O3, while those in steady stage evidently move toward the Al2O3 zone (θ- and α-Al2O3). Based on the fast transition from θ-Al2O3 to α-Al2O3 during the cyclic oxidation of the IC21 alloy at high temperature [25], these results are in good agreement with the formation of Cr2O3 at a lower temperature but the occurrence of a protective α-Al2O3 layer at a higher temperature. In general, formation of Al2O3 is preferable over that of Cr2O3 especially at temperatures above 1000 °C due to the slower diffusion of reactive elements in Al2O3 and the volatility of Cr2O3 [26]. As a result, lower rates of the oxidation steady state appeared for 1100 °C, with even smaller mass gain than that at 900 °C for long-time exposure (Figure 2a). Moreover, NiMoO4 and meta-stable MoO3 were only detected with the effective protection of Cr2O3 at 900 °C, owing to the accelerated volatilization of these oxides at a higher temperature. Unfortunately, the weaker protection of discontinuous Cr2O3 still caused the formation of internal Al2O3 owing to the faster inward diffusion of oxygen ions. Nevertheless, the specimen thickness hardly changed the formation propensities of oxides at 900 °C and 1100 °C. This has been verified by almost the same oxide products with similar cross-section microstructures forming on the specimens with different thicknesses at a specific temperature.
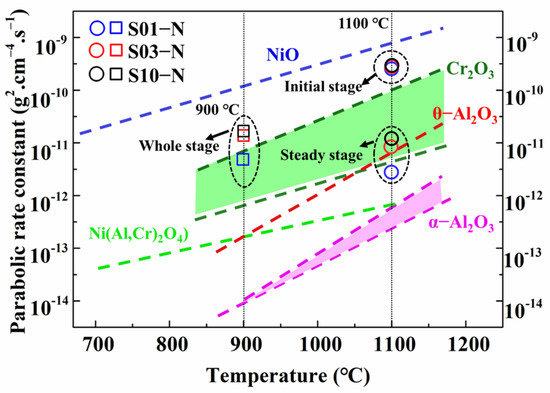
Figure 6.
Comparison of the parabolic rate constants kp for the specimens of IC21 alloy with different thicknesses at 900 °C and 1100 °C with the kp for pure oxides varied with the temperature [24].
Kinetics Tuned by Spallation Behavior
The oxidation kinetics of the studied alloy is considered to be tuned by changing the oxide spallation behaviors with specimen thickness, especially at 1100 °C. For the oxidation at 900 °C, the residual stress in the outmost layer of NiO was evaluated by the shifts of its XRD spectrum compared with the standard one. As shown in Table 2, the results indicate that tensile stress presented in NiO decreased with increasing specimen thickness. The larger stress relaxation due to more cracking happening in the thicker specimen (Figure 4b,c) is considered to be responsible for this phenomenon. Consequently, more oxygen ions diffused inward via the cracks and enhanced the internal oxidation of Al in the thicker specimen due to the weak protection of discontinuous Cr2O3. On the other hand, the residual stress in the Al2O3 layer at 1100 °C was measured by a Raman microprobe instead due to the extensive spallation of NiO and the farther location of Al2O3 from the surface. Compressive stresses were detected with much higher absolute values than those in NiO formed at 900 °C. Moreover, lower compressive stress presented in the severe spallation area of the thicker specimen, which was similar to the case of NiO formed at 900 °C. However, a contrary trend appeared in the area with scarce spallation and weak residual stress relaxation. In other words, decreasing specimen thickness reduced the stress concentration in the oxide scale, which in turn decreased the amount of spallation and improved the oxidation resistance of the IC21 alloy at high temperature. This is also verified by less mass gain and a more continuous Al2O3 layer in the thin specimen.
Table 2.
Residual stresses (GPa) in the oxide scales of the studied alloy specimens with different thicknesses.
Oxide spallation is generally caused by misfits in thermal expansion and elastic deformation between oxide scale and matrix alloy [27,28,29]. However, the much larger thermal expansion coefficient of NiO compared to those of other oxides (e.g., Cr2O3 and Al2O3) [30,31,32] made the exfoliation of NiO take place firstly along the weaker interface between oxide layers via a buckling route [27,29]. As a result, tensile stress normal to the alloy surface was generated in NiO, while compressive stress resided in the oxide layer beneath during cooling. The specimen thickness effects on oxide spallation behavior can be ascribed to the easier stress relief in the thin specimen via creep deformation [21]. The internal or continuous Al2O3 oxides adhered to the Al-depletion zone rendered the cooperative deformation of the bottomed oxide layers and matrix alloy. Moreover, the less spallation but more cracking found at 900 °C compared with 1100 °C is considered to be caused by the different types of oxides formed under the NiO layer as well as the smaller temperature drop during cyclic oxidation.
3.2. Composition Related Thickness Effects on Microstructural Degradation
3.2.1. Thickness Effects under Fixed Composition
Besides the specimen thickness effects on oxidation behavior, the microstructural degradation caused by high-temperature oxidation is also crucial to the creep resistances of superalloys, especially for thin-walled components. Based on the cross-section microstructures after cyclic oxidation at 900 °C and 1100 °C illustrated in Figure 4 and Figure 5, the cubic morphology of the matrix alloy in all the specimens hardly changed, except for the γ’-free layer with depletion of Al. However, a careful investigation of the statistics of the volume fraction of γ’ precipitates along the depth of the specimen confirms the existence of a γ’-reduced layer after 100 h of cyclic oxidation at 1100 °C (Figure 7), which is in agreement with the cases in other traditional Ni-based superalloys [13,14,15,21]. The γ’-reduced layer consisted of an 8 μm wide region with a sharply decreased volume fraction of γ’ right beneath the γ’-free layer and another much wider region with gentle variation. Although the sharply γ’-reduced region was almost identical for the specimens with different thicknesses, a narrower γ’-free layer and a gently γ’-reduced region with a smaller linear slope (Sl) presented obviously in the thin specimen (S01-N). Here, we should mention that the bottom of the γ’-reduced layer in the thin specimen was already close to its core (mirror plane) because of its limited original thickness (0.1 mm). Moreover, the volume fraction of γ’ in the core of the thin specimen (~70% in S01-N) was still lower than those in the thicker specimens (~80% in S03-N and S10-N), which were almost the same as the original one before oxidation (82%). The higher consumption of Al to promote the fast formation of α-Al2O3 in the thin specimen is considered to be the reason behind this finding. It is important to emphasize that the γ’-reduced layer in the studied IC21 alloy was much narrower than those found in CMSX-4 an3d René N5 [14,21,22], regardless of specimen thickness. In addition, there was even no γ’-reduced layer formed during the oxidation of the IC21 alloy at 900 °C. These discrepancies in the γ’ degradation zones after high temperature oxidation among the IC21 alloy and other Ni-based superalloys are ascribed to the high-Al content in the studied alloy, which will be discussed in detail below.
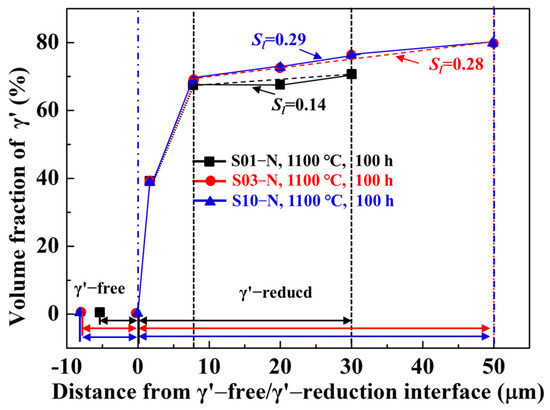
Figure 7.
Volume fractions of γ’ precipitates along the depth of the specimens of the IC21 alloy with different thicknesses after 100 h of cyclic oxidation at 1100 °C. The γ’-free layer was defined as the region with zero volume fraction of γ’, while the γ’-reduced layer was defined as the region with a lower volume fraction of γ’ than the original one (or that in the core). The fitted linear slopes of the gentle variation region in the γ’-reduced layer Sl are shown as well.
3.2.2. Composition Effects in Thin-Walled Specimen
The composition effects on the microstructural degradation were studied by the oxidation tests of a series of specimens with different original Al contents and γ/γ’ morphologies. The variations in composition and microstructure were achieved by cutting the specimens from the heat-treated plate with different distances away from the surface. We paid close attention to the microstructural evolution in the thin-walled situation by only isothermal oxidizing the specimens with a thickness of 0.1 mm at 1100 °C for 100 h. As the detailed information of these thin specimens (S01-1, 2, 3, N) shows in Table 1, the increasing original Al content resulted in increasing the volume fraction and average size of γ’ precipitates, the morphologies of which changed from sphere to cube. However, inhomogeneous Al contents and γ/γ’ microstructures might exist in each single specimen due to the relatively larger scale of the specimen thickness (0.1 mm) compared to those of the γ’ degradation regions near the surface after heat treatments. After 100 h of cyclic oxidation at 1100 °C, similar oxide products formed in all the specimens, but a much denser α-Al2O3 layer was observed in the specimen with higher original Al content. In other words, there was a critical value of Al content to support the formation of a protective and continuous α-Al2O3 scale to maintain the oxidation resistance of the superalloy.
On the other hand, the microstructural degradation caused by the isothermal oxidation was affected by the original Al content of the specimen even more. As shown in Figure 8, most of the matrix alloy in S01-1 became the γ’-free layer, while residual γ/γ’ microstructures were still left in the core of the specimens with higher original Al content.
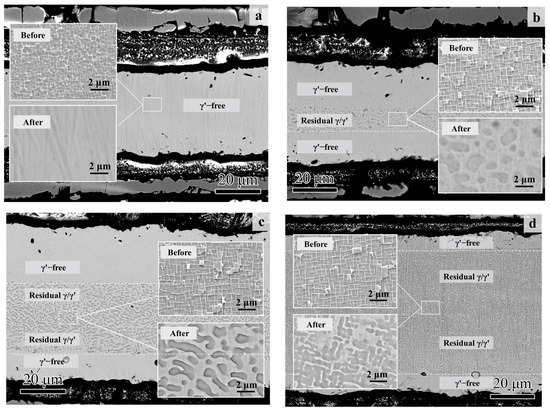
Figure 8.
Cross-section morphologies of the thin specimens (thickness of 0.1 mm) with different original Al contents after 100 h of isothermal oxidation at 1100 °C: (a) S01-1; (b) S01-2; (c) S01-3; (d) S01-N. The magnified morphologies in the core are shown as inner figures in order to reveal the microstructure degradation more clearly. The original microstructures before oxidation are also shown for comparison.
The matrix of the S01-N specimen still had a coarsened γ’ content of 70 vol% and a thickness of 74 μm matrix residual after 100 h cycle oxidation. However, the spherical combined with rounded cubic morphologies of γ’ precipitates in S01-2 changed to spherical morphologies with a larger size of 1 μm. Moreover, γ’ precipitated with a strip shape formed after oxidation in S01-3 instead of the original cubic morphology. It is worth noting that only a slight coarsening of γ’ precipitates happened in S01-N, which also had the thickest residual γ/γ’ zone but the thinnest γ’-free layer. Further analysis results on the thicknesses of the residual matrix alloy, especially the residual γ/γ’ zone, reveal their upward trends with increasing original Al content (Figure 9). In addition, the slope of the thickness of the residual γ/γ’ zone was higher than that of the whole residual matrix alloy. As a result, the thickness of the γ’-free layer reduced in turn. Accordingly, the Al content at the γ’-free/γ’-reduced interface after isothermal oxidation also followed a similar increasing trend but with a much smaller slope than that in the core as a function of the original Al content (Figure 10). Consequently, the difference in the Al content between the γ’-reduced layer and the core section was larger for the thin specimen with higher original Al content. In other words, the formation of protective α-Al2O3 can only be supplied by the sufficient Al contents in the near surface area without deteriorating the γ/γ’ microstructure in the core which was the same as that reported in the literature [33,34,35]. The obtained results discussed above verified that the high-Al content was the main reason for the weaker microstructural degradation during the high temperature oxidation of the IC21 alloy. Furthermore, this composition effect of Al was even more important for the oxidation behavior and microstructural evolution of the thin specimen. Nevertheless, only the variation trend of the γ’ degradation zones has been disclosed in this study, while further works need to be carried out to determine the critical value of Al content quantitatively. The present study lays a foundation for the design of high-Al Ni-based SC superalloys, which are beneficial to improve oxidation resistance and mitigate the thickness debit effects in a service environment. In order to decease the degree of thin-wall blade oxidation, a method was proposed by adopting a NiPtAl coating and a thermal barrier deposited by EB PVD (electron beam physical vapor deposition). However, the inside of the blades which were subjected to lower temperatures may use CVD (chemical vapor deposition coating) to protect the matrix.
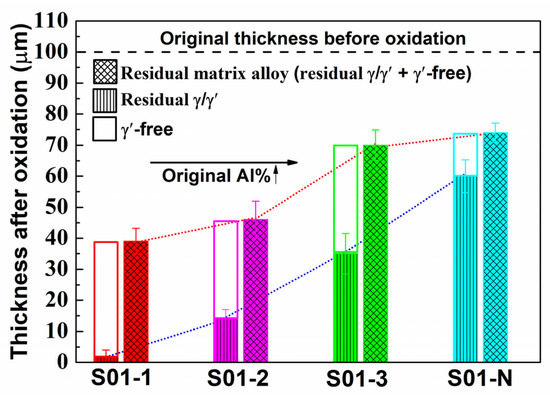
Figure 9.
Thicknesses of the residual matrix alloy region in the thin specimens (thickness of 0.1 mm) with different original Al contents after 100 h of isothermal oxidation at 1100 °C. The thicknesses of the residual γ/γ’ zone and the γ’-free zone, which make up the residual matrix alloy region, are also plotted.
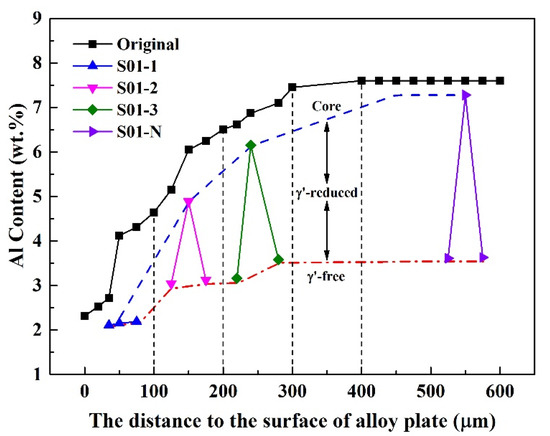
Figure 10.
Variation of Al content in the thin specimens (thickness of 0.1 mm) with different original Al contents after 100 h of isothermal oxidation at 1100 °C. The values measured in the core and at the γ’-free/γ’-reduced interface are plotted in accordance with the distances to the surface of alloy plate, from which the specimens were cut. The vertical dashed lines are plotted to distinguish the sampling areas with different original Al contents. The original Al contents in the alloy plate as a function of distance are also plotted for comparison.
4. Conclusions
The thickness effects on the oxidation behavior and microstructural degradation of a high-Al Ni-based SC superalloy IC21 were studied via cyclic and isothermal oxidation tests at 900 °C and 1100 °C. The mass gain of S01-N, S03-N and S10-N specimens were 1.77, 2.32 and 2.45 mg/cm2 at 900 °C and 2.19, 2.59 and 3.01 mg/cm2 at 1100 °C. Temperature was found to have obvious influences on the oxidation thermodynamics and kinetics of the IC21 alloy. Compared with the discontinuous Cr2O3 and internal dendritic Al2O3 observed after the cyclic oxidation at 900 °C, the continuous Al2O3 layer without oxides of Mo formed instead at 1100 °C. As a result, the IC21 alloy achieved a steady stage of oxidation faster at 1100 °C, within 20 h. Specimen thickness also showed evident effects with higher oxidation resistance presented in the thinner specimen both at 900 °C and 1100 °C. However, the specimen thickness hardly changed the oxidation thermodynamics but did tune the kinetics by altering the oxide spallation behavior of the IC21 alloy. The easier stress relief in the thin specimen via creep deformation is considered to be the main mechanism, while the severe spallation at 1100 °C was ascribed to the different oxidation products as well as the larger temperature variation. Moreover, the microstructural degradation during oxidation, which was characterized by the γ’-free and γ’-reduced layers in the residual matrix alloy, was weaker in the studied IC21 alloy than those in CMSX-4 and René N5 due to its high Al content. This γ’ degradation was further mitigated by smaller specimen thickness due to the higher consumption of Al. The matrix of the S01-N specimen still had a coarsened γ’ content of 70 vol% and a thickness of 74 μm matrix residual after a 100 h cycle oxidation. The composition effects on the microstructural degradation studied via the isothermal oxidation tests of thin specimens with different original microstructures verified the indispensable role of sufficient Al in the achievement of higher oxidation resistance and microstructural stability, especially for a thin-walled situation. The results obtained in the present study shed light on the mechanisms of the composition-related thickness debit effects and lay a foundation for the materials design of modern Ni-based SC superalloys.
Author Contributions
Conceptualization, H.Z., W.Z., J.W. and S.G.; Methodology, H.Z., Y.R., S.G. and S.L.; Validation, Y.R.; Formal analysis, W.G., W.Z. and Y.P.; Investigation, Y.R.; Resources, J.W.; Writing—original draft, H.Z.; Writing—review & editing, W.G. and W.Z.; Project administration, S.L.; Funding acquisition, W.G., Y.P., S.G. and S.L. All authors have read and agreed to the published version of the manuscript.
Funding
This paper is supported by National Natural Science Foundation (No. 52103358), National Science and Technology Major Project (2017-VI-0012-0084) and Science Center for Gas Turbine Project (No. P2021-A-IV-001-003).
Data Availability Statement
The data presented in this study are available on request from the corresponding and first author. The data are not publicly due to [Alloy material sensitivity problem].
Conflicts of Interest
The authors declare no conflict of interest.
References
- Reed, R.C. The Superalloys: Fundamentals and Applications; Cambridge University Press: Cambridge, MA, USA, 2006. [Google Scholar]
- Koff, B.L. Gas turbine technology evolution: A designers perspective. J. Propuls. Power 2004, 20, 577–595. [Google Scholar] [CrossRef]
- Xu, L.; Bo, S.; Hongde, Y.; Lei, W. Evolution of Rolls-Royce air-cooled turbine blades and feature analysis. Procedia Eng. 2015, 99, 1482–1491. [Google Scholar] [CrossRef]
- Hu, Y.; Zhang, L.; Cheng, C.; Zhao, P.; Cao, T.; Guo, G.; Zhao, J. Influence of specimen thickness on the creep behavior of a directional solidification nickel-based superalloy. Vacuum 2018, 150, 105–115. [Google Scholar] [CrossRef]
- Srivastava, A.; Needleman, A. Phenomenological modeling of the effect of specimen thickness on the creep response of Ni-based superalloy single crystals. Acta Mater. 2013, 61, 6506–6516. [Google Scholar] [CrossRef]
- Srivastava, A.; Gopagoni, S.; Needleman, A.; Seetharaman, V.; Staroselsky, A.; Banerjee, R. Effect of specimen thickness on the creep response of a Ni-based single-crystal superalloy. Acta Mater. 2012, 60, 5697–5711. [Google Scholar] [CrossRef]
- Wen, Z.; Pei, H.; Li, D.; Yue, Z.; Gao, J. Thickness influence on the creep response of DD6 Ni-based single-crystal superalloy. High Temp. Mater. Process. 2016, 35, 871–880. [Google Scholar] [CrossRef]
- Brunner, M.; Bensch, M.; Völkl, R.; Affeldt, E.; Glatzel, U. Thickness influence on creep properties for Ni-based superalloy M247LC SX. Mater. Sci. Eng. A 2012, 550, 254–262. [Google Scholar] [CrossRef]
- Hüttner, R.; Gabel, J.; Glatzel, U.; Völkl, R. First creep results on thin-walled single-crystal superalloys. Mater. Sci. Eng. A 2009, 510, 307–311. [Google Scholar] [CrossRef]
- Cassenti, B.; Staroselsky, A. The effect of thickness on the creep response of thin-wall single crystal components. Mater. Sci. Eng. A 2009, 508, 183–189. [Google Scholar] [CrossRef]
- Seetharaman, V.; Cetel, A.D. Thickness debit in creep properties of PWA 1484 [A]. In Proceedings of the 10th International Symposium on Superalloys (Superalloys 2004), Champion, PA, USA, 19–23 September 2004; pp. 207–214. [Google Scholar]
- Duan, R.; Jalowicka, A.; Unocic, K.; Pint, B.A.; Huczkowski, P.; Chyrkin, A.; Grüner, D.; Pillai, R.; Quadakkers, W.J. Predicting oxidation-limited lifetime of thin-walled components of NiCrW alloy 230. Oxid. Met. 2017, 87, 11–38. [Google Scholar] [CrossRef]
- Bensch, M.; Konrad, C.H.; Fleischmann, E.; Rae, C.M.; Glatzel, U. Influence of oxidation on near-surface γ′ fraction and resulting creep behaviour of single crystal Ni-base superalloy M247LC SX. Mater. Sci. Eng. A 2013, 577, 179–188. [Google Scholar] [CrossRef]
- Bensch, M.; Preußner, J.; Hüttner, R.; Obigodi, G.; Virtanen, S.; Gabel, J.; Glatzel, U. Modelling and analysis of the oxidation influence on creep behaviour of thin-walled structures of the single-crystal nickel-base superalloy René N5 at 980 °C. Acta Mater. 2010, 58, 1607–1617. [Google Scholar] [CrossRef]
- Dryepondt, S.; Monceau, D.; Crabos, F.; Andrieu, E. Static and dynamic aspects of coupling between creep behavior and oxidation on MC2 single crystal superalloy at 1150 °C. Acta Mater. 2005, 53, 4199–4209. [Google Scholar] [CrossRef]
- Pour-Ali, S.; Tavangar, R.; Akhtari, F.; Hejazi, S. High-temperature oxidation behavior of GTD-111 Ni-based superalloy with an ultrafine-grained surface at 900 °C. Corros. Sci. 2022, 212, 110935. [Google Scholar] [CrossRef]
- Hu, Y.; Cheng, C.; Cao, T.; Zhang, L.; Zhao, J. A study on the multiple stages of oxidation kinetics in a single crystal nickel-based superalloy. Corros. Sci. 2021, 188, 109512. [Google Scholar] [CrossRef]
- Li, P.; Jin, X.; Zhao, J.; Lu, P.; Hu, N.; Liu, D.; Dong, J.; Fan, X. Oxidation behaviors and compressive strength evolution of DD6 Ni-based single-crystal superalloy at 1100 °C. Corros. Sci. 2022, 208, 110684. [Google Scholar] [CrossRef]
- Pistor, J.; Hagen, S.P.; Virtanen, S.; Körner, C. Influence of the microstructural homogeneity on the high-temperature oxidation behavior of a single crystalline Ni-base superalloy. Scr. Mater. 2022, 207, 114301. [Google Scholar] [CrossRef]
- Perez, T.; Monceau, D.; Desgranges, C. Kinetic oxidation model including the transient regime for a single crystal nickel-based superalloy over the temperature range 750–1300 °C. Corros. Sci. 2022, 206, 110485. [Google Scholar]
- Orosz, R.; Krupp, U.; Christ, H.J.; Monceau, D. The influence of specimen thickness on the high temperature corrosion behavior of CMSX-4 during thermal-cycling exposure. Oxid. Met. 2007, 68, 165–176. [Google Scholar] [CrossRef]
- Bensch, M.; Sato, A.; Warnken, N.; Affeldt, E.; Reed, R.; Glatzel, U. Modelling of high temperature oxidation of alumina-forming single-crystal nickel-base superalloys. Acta Mater. 2012, 60, 5468–5480. [Google Scholar] [CrossRef]
- Sato, A.; Chiu, Y.-L.; Reed, R.C. Oxidation of nickel-based single-crystal superalloys for industrial gas turbine applications. Acta Mater. 2011, 59, 225–240. [Google Scholar] [CrossRef]
- Qin, L.; Pei, Y.; Li, S.; Zhao, X.; Gong, S.; Xu, H. Role of volatilization of molybdenum oxides during the cyclic oxidation of high-Mo containing Ni-based single crystal superalloys. Corros. Sci. 2017, 129, 192–204. [Google Scholar] [CrossRef]
- Yang, T.T.; Zhou, X.; Li, S.S.; Pei, Y.L.; Gong, S.K. Cyclic oxidation behavior of Ni3Al-based single crystal alloy IC21. Rare Met. 2017, 1–7. [Google Scholar] [CrossRef]
- Akhtar, A.; Hegde, S.; Reed, R.C. The oxidation of single-crystal nickel-based superalloys. JOM 2006, 58, 37–42. [Google Scholar] [CrossRef]
- Evans, H.E. Modelling oxide spallation. Mater. High Temp. 1994, 12, 219–227. [Google Scholar] [CrossRef]
- Jedliński, J.; Bennett, M.J.; Evans, H.E. Experimental data on the spallation of protective oxide scales: A brief literature survey. Mater. High Temp. 1994, 12, 169–175. [Google Scholar] [CrossRef]
- Evans, H.E.; Lobb, R.C. Conditions for the initiation of oxide-scale cracking and spallation. Corros. Sci. 1984, 24, 209–222. [Google Scholar] [CrossRef]
- Wang, Y.; Fang, H.; Zacherl, C.L.; Mei, Z.; Shang, S.; Chen, L.-Q.; Jablonski, P.D.; Liu, Z.-K. First-principles lattice dynamics, thermodynamics, and elasticity of Cr2O3. Surf. Sci. 2012, 606, 1422–1425. [Google Scholar] [CrossRef]
- Nielsen, T.H.; Leipold, M.H. Thermal expansion of nickel oxide. J. Am. Ceram. Soc. 1965, 48, 164. [Google Scholar] [CrossRef]
- Touloukian, Y.S. Thermophysical Properties of High Temperature Solid Materials. Volume 4. Oxides and Their Solutions and Mixtures. Part 1. Simple Oxygen Compounds and Their Mixtures; Thermostatical and Electronic Properties Information Analysis Center: Lafayette, Indiana, 1966. [Google Scholar]
- Shen, Y.; Ju, Q.; Xu, G.; Du, X.; Zhang, Y.W.; Zhu, Y.; Huang, J.; Wang, T.Y.; Liu, Z. Improved oxidation resistance and excellent strength of nickel-based superalloy at 1100 °C by determining critical Cr-Al value. Mater. Lett. 2022, 328, 133226. [Google Scholar] [CrossRef]
- Yun, D.; Seo, S.; Jeong, H.; Yoo, Y.S. Effect of refractory elements and Al on the high temperature oxidation of Ni-base superalloys and modelling of their oxidation resistance. J. Alloys Compd. 2017, 710, 8–19. [Google Scholar] [CrossRef]
- Yu, H.; Ukai, S.; Hayashi, S.; Oono, N. Effect of Al content on the high-temperature oxidation of Co-20Cr-(5, 10) Al oxide dispersion strengthened superalloys. Corros. Sci. 2017, 118, 49–59. [Google Scholar] [CrossRef]


Disclaimer/Publisher’s Note: The statements, opinions and data contained in all publications are solely those of the individual author(s) and contributor(s) and not of MDPI and/or the editor(s). MDPI and/or the editor(s) disclaim responsibility for any injury to people or property resulting from any ideas, methods, instructions or products referred to in the content. |
© 2023 by the authors. Licensee MDPI, Basel, Switzerland. This article is an open access article distributed under the terms and conditions of the Creative Commons Attribution (CC BY) license (https://creativecommons.org/licenses/by/4.0/).