Abstract
The instantaneous response of liquid crystal (LC) molecules near the dye-adsorbed layer of azo dye-doped LCs (ADDLCs) in early-stage photoexcitation was observed through the pumped-attenuated total reflection (PATR) method. As the sensing depth of the attenuated total reflection (ATR) method is in the order of hundreds of nm, in situ observation using the PATR method directly inspected the restructuring of the adsorbed layer in the early-stage photoexcitation, which demonstrated the competition between adsorption and desorption on the isotropic surface without the interference of the elastic continuum in the bulk of a cell. Analyzing the frequency of the oscillation-like PATR signal, which reflects the evolution of the orientation of the LC molecules, revealed that, depending on the dose of the pump light, the structural evolution of the adsorbed layer is fast at the beginning of photoalignment in ADDLCs and slows down with the accumulation of the adsorbed layer. A suitable intensity of the pump light in the early stage of the photoalignment process can improve the reform of the adsorbed layer to strengthen its anchoring.
1. Introduction
The liquid crystal (LC) alignment technique is a crucial subject in LC science. A well-known method of alignment uses a mechanical rubbed polymer surface to induce a preferable LC director orientation due to its simplicity [1,2]. However, this rubbing technique has several disadvantages, such as generating dust, electrostatic charge, and physical damage on the surface during the rubbing treatment [1,2]. The photoalignment technology without contact processes has become more important in the LC field in recent decades for replacing the rubbing process, with benefits such as its controllable strength and being patternable [3,4,5,6]. The photoalignment has been achieved with azo dye-doped LCs (ADDLCs) by the photoisomerization process when a pump light irradiates it [7,8]. The trans-cis isomerization of azo dye induced by exposure to visible light of an appropriate wavelength causes LC molecules to be reoriented by the light-induced torque [9,10,11,12]. Meanwhile, azo dyes undergo diffusion, adsorption, or desorption on the irradiated surface [13,14]. The final orientation of LC molecules on the surface is determined by the competition between light-induced and spontaneous adsorption and desorption [2,13,15,16]. The development of the adsorbed dye is strongly dependent on the dose of the pump light. Especially, the restructuring of the dye-adsorbed layer at the early stage of photoexcitation (the first several hundred seconds of irradiation) will affect the afterward evolution of the surface anchoring [17].
The actual phenomena of the photoexcitation of ADDLCs near the irradiated surface were hidden behind the elastic continuum in a traditional pump-probe experiment [7,8,16,18,19,20]. The fine evolution of the adsorbed layer and anchoring in the early stage should be time-dependent and only detectable in the local region without the influence of the elastic continuum of the entire LC cell [21,22]. However, related experiments on the dynamics at the surface region of the early-stage photoexcitation are lacking, even though the evolution of the dye-adsorbed layer is important for sequent photoalignment. Attenuated total reflection (ATR) is a sensitive sampling technique for observing the motion of the LC director near the surface because the variation in the dielectric constant is probed by an evanescent wave, with a penetration depth of only a few hundred nanometers [23,24]. The pumped ATR (PATR) method was improved from ATR to detect the photoexcitation of ADDLCs in the local region by leading a pump light into a coupled prism [21,25]. The variation in the PATR intensity reveals the average reaction of LC directors near the surface at the photoexcitation process. The fast response of the PATR experiment in the ADDLC cell is based on elimination from the influence of the elastic continuum, which emerges when observed throughout the cell [21]. Owing to the fast response of the LC directors in the PATR experiment, the PATR result shows a quick response from the change of the surface anchoring, which demonstrates evidence of the photoexcitation of ADDLCs in the limited region and a possible solution in analyzing the kinetics of azo dye adsorbing and desorbing on the isotropic surface. Undoubtedly, the adsorption behavior during the photoexcitation process is the key issue for the photoalignment. Based on the merit of PATR technology and further improvements from previous work [21,25], our findings show that the competitive adsorption-desorption phenomenon at the early stage of the photoexcitation is strongly dependent on the intensity of the pumped laser, which influences the final morphology and effective anchoring of the dye-adsorbed layer at the early stage of the photoexcitation.
2. Experiments
2.1. Materials and Methods
The experimental setup of the PATR measurement and related operations were described in the previous work [21,25]. Figure 1 shows a schematic representation of the ADDLC cell with a Kretschmann configuration. Silver film with a thickness of 67 nm was evaporated on a prism (SF11, np = 1.78) with a thermal evaporator. The substrate on the opposite (ITO glass) was coated with N, N-dimethyl-n-octadecy-3-aminopropyltrimethoxysilyl chloride (DMOAP) to raise a tilt angle. Coating on the top substrate (silver film) was not allowed, because the coated DMOAP will occupy the sensing region and thus invalidate the measurement. In the present study, the initial tilt angle of LC near the Ag film was controlled at approximately 20° to reach a smaller optical torque and form a stable vibration of LC while the pump laser irradiates the ADDLC cell. The cell with a thickness of and 15 μm, controlled with Mylar spacers (Dupont Teijin Films, Chester, US), was filled with LC (ZLI-4792 form Merck, = 1.57 and = 1.47 [26]) doped with azo dye (methyl red (MR) from Aldrich) at a concentration of 0.5 wt%. The optical absorption of MR lies between the blue and green lights [27].
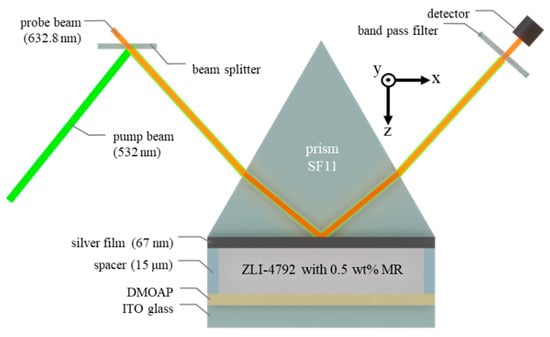
Figure 1.
Kretschmann configuration of the ADDLC cell.
In the geometry of PATR, the pump light (green light, 532 nm) and probe light (red light, 632.8 nm) were incident on the same position of the prism bottom to ensure the occurrence of photoexcitation. The irradiated area on the prism bottom was approximately 0.1 cm2, depending on the incident angle. The actual intensity of the pump light that passed through the prism bottom was only 3% of the value noted due to the reflection from the prism surface and bottom.
2.2. Analysis Mechanism
Figure 2a shows the configuration of the LC and dye molecules in ADDLCs in the Kretschmann configuration. At the initial state, the directions of the LC and dye molecules near the Ag surface were inclined to the normal of the surface due to the DMOAP coated properly on the bottom surface. An evanescent wave induced by the probe beam penetrated several hundred nm in depth, which determined the sensing region of the ATR method. Figure 2b shows that, in the PATR experiment, a pump beam irradiated the prism–Ag interface—namely, the top surface of the ADDLC cell—and induced an evanescent wave polarized normal to the surface. Then, the azo dye molecules near the surface of the prism, aligned along the polarization of the light due to the guest–host effect [28], would undergo photoisomerization induced by the pump beam-induced evanescent wave. The excited azo dye molecules then rotated perpendicular to the electrical field, which consequently induced lower elevation angles of the LC molecules, referred to as light-induced torque and shown in Figure 2b [9].
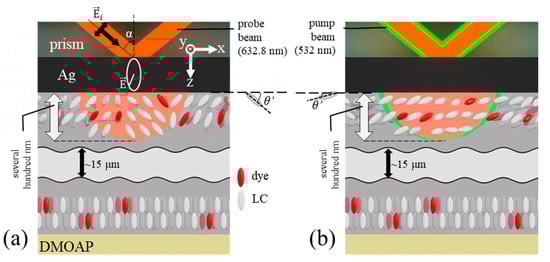
Figure 2.
Orientation of LC molecules near the Ag surface of the prism and the DMOAP surface in the ADDLC cell (a) without and (b) with the irradiation of green pump light.
In the mechanism of ATR, the evanescent wave at the Ag–LC boundary is of elliptic polarization on the x–z plane and propagates along the x-direction, as shown in Figure 2a [29]. Surface plasma can only be excited by p-wave incident light, and the wave vector of incident light along the surface should satisfy the resonance condition [25]:
where k0 is the wave number of light in vacuum, np is the refraction index of prism, α is the incident angle, ω is the frequency of the probe light, εm is the dielectric constant of the metal film, and is the effective dielectric constant of LC. The obtained value of the effective refractive index is an average value over the measuring region, which is at a depth of a few hundred nanometers from the interface, and dependent on both the tilt and azimuthal angle of the LC directors relative to the direction of the polarization and propagation of the wave. Therefore, we only obtain an effective tilt angle θ′ dependent on the variation in the θ and directions to describe the rotational motion in 3D space [21]. At the resonance dip of the ATR curve, the incident angle corresponding to the effective tilt angle θ′ is expressed as:
where no and ne are the ordinary and extraordinary refractive indices of LC, respectively. As LC molecules near the adsorbed surface vibrate both in the azimuthal direction and the tilt direction, the effective tilt angle θ′ varies with both.
The PATR result was obtained by recording the shifting ATR curve with a fixed incident angle, as shown in Figure 3. From the state I to II, the decrease in the reflectivity indicates a left-shift in the ATR curve along with the dip angle α, which implies the mean effective tilt angle of the LCs near the silver surface is reduced by the relation shown in Equation (2). From state II to III, by contrast, the increase in the reflectivity reveals that the mean effective tilt angle of the LC molecules near the silver surface is increased [18]. The PATR intensity varying with time reflects the dynamic behavior of LC and involves the adsorption-desorption effect during photoisomerization.
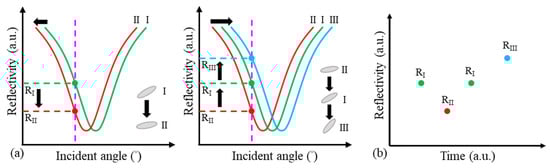
Figure 3.
(a) As the average effective tilt angle decreases, the resulting decrease in the resonance angle α, along with the left-shift in the whole curve, reflects a decrease in the reflectivity R measured at a fixed angle (dash line). Conversely, the reflectivity R increases with the effective angle . (b) The evolution of the reflectivity was recorded continually with time.
3. Results and Discussion
3.1. Vibration and Quick Response of LC
PATR was used to exhibit a sequent behavior of photoalignment as the pump beam irradiated the ADDLC cell of Kretschmann configuration, including photoisomerization, diffusion, adsorption, and desorption. Figure 4a–e show the PATR intensity versus time measured with the pump laser intensity of (a) 0.3, (b) 0.6, (c) 1.0, (d) 3.0, and (e) 5.0 mW. The duration of the laser irradiation in time intervals I, II, III, and IV are laser-on (30 min), laser-off (30 min), laser-on (30 min), and laser-off (1 h), respectively. Figure 4f–j present the ATR curve measured (A) before the irradiation of the pump laser and (B) after the entire experiment process, normalized based on the maximum value to (A).
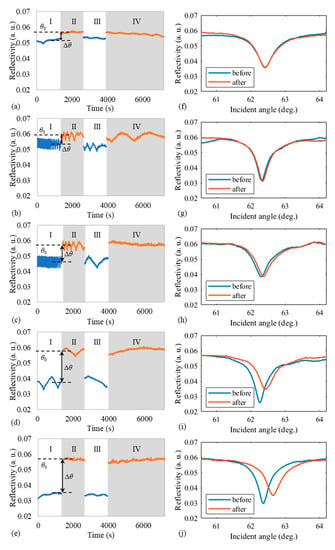
Figure 4.
(a–e) PATR results and (f–j) ATR curve before and after the whole experiment process, with different intensities of the pump laser: (a,f) 0.3, (b,g) 0.6, (c,h) 1.0, (d,i) 3.0, and (e,j) 5.0 mW. The time intervals II and IV, when the pump laser did not irradiate, are marked with gray backgrounds.
While the pump laser irradiated the prism/ADDLC cell, the azo dye molecules inclined to the polarization were photoisomerized and then reoriented the neighboring LC molecules, which led to the ATR dip shift toward a lower angle and resulted in a quick drop between regions (II) and (III). Briefly, the quick drop between regions (II) and (III) indicates the light-induced torque in bulk while the pump laser irradiated. The elapsed time of the response was approximately 2 ms, which indicates the quick response of the LC molecules to the irradiation and the independence to the elastic continuum in the bulk of the cell [21].
Based on the analysis mechanism of PATR, the oscillation in the reflectivity (Figure 4b–d) reflects the vibration of the LC molecules in orientation, which is expressed in as:
where is the pretilt angle of LC near the surface without the irradiation of the pump laser, Δθ is contributed by the pump laser, and is the vibration with amplitude A and frequency ω, which implies a change in the effective tilt angle during the competition between adsorption and desorption. At the start of region II, the first irradiation stopped and a quick rise showed the contribution of the value where the rise stopped is taken as , and the unpredictable LC orientation in the initial condition due to the rough surface of the Ag film [24] was initialized within region I. The variation in the vibration frequency ω can be acquired from that of the reflectivity.
3.2. Evolution of Anchoring Caused by Dye-Adsorbed Layer via Photoexcitation
The quick response of the LC to the anchoring validated itself as an indicator of the state of the surface. Namely, the vibration in reveals the evolution of anchoring caused by photoexcitation. As pump light irradiates the ADDLCs, the LCs near the Ag surface will be reoriented accompanied by the light-induced bulk torque during the photoexcitation process. is the optical torque induced by the photoisomerization of ADDLCs [9], and is expressed as:
where χ is a quantity that measures the strength of interaction between dye and LC [7,9]. Γopt,0 drives LCs to instantaneously rotate from to as the pump laser irradiates the ADDLCs. As the orientation of LCs near the surface is not parallel to the surface, will not be zero. is also the balance angle for competition between the local elastic force, the photoexcited force, and the rearranged anchoring force.
During the photoexcitation process, the surface anchoring torque, Γs, induced by the dye-adsorbed layer, influenced the effective tilt angle of the LCs near the adsorbed layer. The surface anchoring was time-dependent because the amount of adsorption and morphology of the adsorbed layer developed at the early stage of photoexcitation. The surface anchoring energy, taking the form of the Rapini–Papoular potential [30], is expressed in as:
where w is the anchoring coefficient for the adsorbed azo dye, σ is the surface density of the adsorbed dye, and p is a factor to reflect the morphology, which drastically increases for a well-ordered layer [31]. With the definition of in Equation (3), the surface anchoring torque is derived from the surface energy and expressed as:
As a result of the small variation in the effective tilt angle at the early stage of photoexcitation, the variation in the surface torque due to the surface restructure of the adsorbed layer is expressed as:
Equation (7) provides a physical concept and a dynamic model to survey the photoexcitation of ADDLC under the PATR configuration. reveals the evolution of the state of the adsorbed dye in the irradiated surface in the surface density σ and degree of order p. The parameter p is related to the surface arrangement and the denseness, varying with the irradiated time. Herein, we can only treat p as a surface parameter to illustrate the state of restructure of the dye-adsorbed layer. When the construction of the adsorbed layer completes, σ and p will stop varying with time, and ΔΓs and will fall to zero as a result.
3.3. Adsorption and Desorption of Azo Dyes on Isotropic Surface
For an LC cell azo dye-doped by a concentration of , the irradiation of a pump light induces the trans-cis isomerization and the desorption of the dark-adsorbed azo dye [6]. The kinetic equation of the surface density of adsorbed dye on the irradiated surface is:
where κ is the parameter of the quantum efficiency of the photoisomerization; α is the adsorption coefficient of pump light in ADDLCs; E is the magnitude of the electric field of the pump evanescent wave; is the unit vector giving the orientation of the azo dye molecules near the isotropic surface; is the direction of the electrical field; L is the distance the evanescent wave extends, a few hundred nm; l is the effective length of the diffusion; and is the diffusion coefficient along the direction of the light intensity gradient, which is parallel to the z axis [23,24,32]. is the effective relaxation time of the adsorbed layer, and is expressed as:
where is the spontaneous relaxation time of the adsorption layer, which also involves the lifetimes of the cis-state of adsorbed dye, and is the relaxation time of the adsorbed dye desorbed from the surface while the pump laser is irradiating, which involves the dark adsorption and is affected by the laser intensity [33]. In this work, the diffusion was initialized when the pump laser illuminated the ADDLCs and remained even after the pump laser switched off due to the convection [32].
Based on the model described, the source of the oscillation of the PATR intensity was due to the competition between adsorption and desorption. Triggered by the exposure, the adsorption, desorption, and accompanying diffusion dominated the variation in the surface by turns at the early stage, as illustrated in Equation (8). This kinetic equation illustrates the dependency of the whole adsorption/desorption process on the intensity of the pump light. The variation in the surface properties, such as surface density and morphology p, results in the variation in the anchoring torque . The balance between the anchoring torque and the local elastic torque reflects the effective tilt angle of the LCs near the Ag surface. Equation (7) reveals the correlation of with , which exhibits an oscillation-like intensity of PATR.
3.4. Depecdencies on Intensity
The dependency on the intensity of the pump laser reflected in the difference between the results shown in Figure 4a–e as the vibration in reflectivity is more recognizable in the cases of 0.6 and 1.0 mW. In Figure 4a, light-induced desorption dominated at a lower pump beam intensity, while, oppositely in Figure 4d–e, adsorption dominated at higher intensities. The vibration, as a sign of the process to the balance, during which adsorption and desorption dominated the variation in the orientation of the LC by turn, was observable at a specific pump intensity, as shown in Figure 4b–c.
Figure 5a,b show the enlargements of Figure 4b,c in region (I) for 0.6 and 1.0 mW, respectively. According to the evolution of the surface dye density expressed in Equation (8) and the fact that the effective tilt angle reflects the state of the surface, the time-dependent variation in is attributed to the competition between the adsorption and desorption. Figure 5c,d exhibit the vibration frequency of the reflectivity, slowing down with time, as shown in Figure 5a,b, respectively.
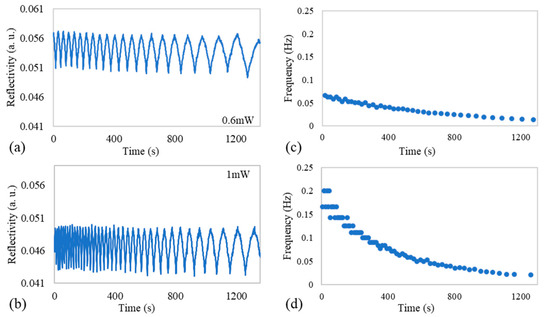
Figure 5.
(a,b) Enlarged PATR results in region (I) of Figure 4b,c; (c,d) oscillation frequency in (a,b).
The frequency of the oscillation-like intensity in the PATR spectrum is dependent on the dose of the pump beam, which determines the surface morphology and the corresponding dye adsorption and desorption. ω is an index to describe the rate of the competition between adsorption and desorption. As the net surface-adsorbed layer and corresponding anchoring are strongly dependent on the dose of the pump beam, the oscillation-like reflectivity reveals the restructuring and stability of the dye-adsorbed surface, which involves the surface density σ(t) and parameter of the adsorbed azo dye layer morphology p in Equations (5)–(7) during the dye diffusion, adsorption, and desorption processes. Evidently, ω and A are not constant during the entire process. In the early-stage photoexcitation, ω decreased as the dye-adsorbed layer was gradually formed, and then the results suppressed the rate of competition between adsorption and desorption. Inspecting Figure 5c,d, the frequency of the oscillation corresponding to the beam intensity of 0.6 mW exhibited a slower decrease relative to the beam intensity of 1 mW. The competitive adsorption and desorption behavior would last longer in the case of 0.6 mW. This fact agrees with the idea that the vibration was still observable in region (IV) in Figure 4b, while it was not in Figure 4c. More phenomena of the competitive adsorption-desorption on the surface of ADDLCs would be revealed in the further analysis of PATR results with different doses of the pump laser [25].
In region (II) of Figure 4a–e, the PATR intensity instantaneously increased and the gap between regions (I) and (II) corresponds to . The observation of θ0 was clearer after the pump laser was switched off, thereby avoiding the violation of the transient LC reorientation near the isotropic surface because the LCs near the isotropic surface were not well ordered at the initial condition. The phenomena of the vibrating PATR intensity continued with the slowing down oscillation at the laser intensity of 0.6 mW and 1.0 mW due to the restructuring of the adsorbed layers, which resulted from the competition between the adsorption caused by the residual diffusion and the desorption caused by the spontaneous relaxation. The restructuring of the dye-adsorbed layer would be sustained even without the irradiation of the pump laser after the early-stage photoalignment process.
In region (III), the PATR intensity decreased due to optical torque. In the case of 0.6, 1.0, and 3.0 mW, the oscillation of the PATR results still happened, but its frequency was lower than those in regions (I) and (II) because the morphology of the dye-adsorbed layer was more ordered and its change was slower. In region (IV), the pump light was switched off. The LC molecules near the adsorbed layer maintained a constant tilt angle because the surface anchoring of the adsorbed layer was stabilized. However, the oscillating PATR results occurred in the case of 0.6 mW, which means that the competition between adsorption and desorption kept happening in this region.
3.5. Source of Error—Thickness of the Adsorbed Layer
Figure 4f–j present the ATR curve before the irradiation of the pump laser and after the entire experiment processes. The obvious shift in the ATR curve was due to the increase in the thickness of the dye-adsorbed layer, which was positively correlated to the intensity of the pump laser [13]. Table 1 exhibits the dip angle corresponding to the curves shown in Figure 4f–j for different intensities of the pump laser. The adsorbed layer of azo dye can cause an ATR dip right-shift owing to the fact that its refractive index is higher than that of the LC. The dip and shape of ATR were influenced by the effective tilt angle of LC and the thickness of the adsorbed MR layer, which cannot be exactly determined.

Table 1.
Dip angle and their shifts corresponding to the ATR curves shown in Figure 4f–j.
Based on the space charge effect, the actual anchoring of the dye adsorbed layer was modified by the surface field induced by the surface charge to reflect the evolution of dye adsorption and desorption during the photoisomerization [33,34]. However, directly inspecting the dynamic information of the rearrangement of the dye-adsorbed layer caused by the influence of the surface field in the PATR experimental configuration is difficult. Besides, two issues occurred in the PATR technique when the adsorption phenomena of ADDLCs were analyzed. One was that the initial arrangement of the LC molecules near the Ag thin film was not well ordered due to the high roughness of the deposited Ag film [24]. The other difficulty was that the ATR curve would shift due to the increased thickness of the adsorbed layer. This would influence the incorrect quantity in the relation between the reflectivity and internal angle. Evidently, the competition between dye adsorption and desorption at early-stage photoexcitation can be observed only in the PATR method. The variation in the PATR intensity reveals the reorientation of the LC molecules near the adsorbed surface (several hundred nm). From the change in PATR intensity, the phenomena of the amount and morphology of the adsorbed dye developed with the irradiated time at early-stage photoexcitation were disclosed.
4. Conclusions
The fine modification of the dye-adsorbed layer during the photoexcitation process is key to the further investigation of the stability and anchoring of the adsorbed layer. The PATR method enables the in situ inspection of the dynamics of dye adsorption and desorption on the surface without the interference of the elastic continuum, which was encountered when observing through the entire LC cell. With the PATR technique, the modification of the dye-adsorbed layer at the early stage of photoexcitation can be observed. The regular vibration of LC near the dye-adsorbed layer exhibited the competition between adsorption and desorption on the surface of the ADDLC cells, where the rotation of LC directly reflected the change in morphology and the effective anchoring of the dye-adsorbed layer. A suitable intensity of pump light would accelerate the adsorption and desorption. The result of this study provides a method to achieve the in situ monitoring of the dynamic adsorption phenomena.
Author Contributions
Conceptualization, C.-Y.H. and K.Y.L.; methodology, C.-Y.H.; formal analysis, S.-C.J. and S.-H.C.; data curation, W.-T.C.; writing—original draft preparation, W.-T.C.; writing—review and editing, K.Y.L.; visualization, W.-T.C.; All authors have read and agreed to the published version of the manuscript.
Funding
This research was funded by Ministry of Science and Technology of the Republic of China, Taiwan, contract number MOST 107-2112-M-006-021.
Acknowledgments
The authors would like to thank Iam Choon Khoo (Pennsylvania State University) for his discussion.
Conflicts of Interest
The authors declare no conflict of interest.
References
- Bisoyi, H.K.; Li, Q. Light-Driven Liquid Crystalline Materials: From Photo-Induced Phase Transitions and Property Modulations to Applications. Chem. Rev. 2016, 116, 15089–15166. [Google Scholar] [CrossRef] [PubMed]
- Yaroshchuk, O.; Reznikov, Y. Photoalignment of liquid crystals: Basics and current trends. J. Mater. Chem. 2012, 22, 286–300. [Google Scholar] [CrossRef]
- Palomares, L.O.; Reyes, J.A.; Jánossy, I. Director reorientation in a nematic liquid crystal with a photosensitive layer. Phys. Rev. E 2014, 90, 062503. [Google Scholar] [CrossRef] [PubMed]
- Serak, S.; Bunning, T.; Tabiryan, N. Ultrafast Photoalignment: Recording a Lens in a Nanosecond. Crystals 2017, 7, 338. [Google Scholar] [CrossRef]
- Chigrinov, V.; Sun, J.; Wang, X. Photoaligning and Photopatterning: New LC Technology. Crystals 2020, 10, 323. [Google Scholar] [CrossRef]
- Nassrah, A.R.K.; Jánossy, I.; Tóth-Katona, T. Photoalignment at the nematic liquid crystal–polymer interface: The importance of the liquid crystalline molecular structure. J. Mol. Liq. 2020, 312, 113309. [Google Scholar] [CrossRef]
- Simoni, F.; Francescangeli, O. Effects of light on molecular orientation of liquid crystals. J. Phys. Condens. Matter 1999, 11, R439–R487. [Google Scholar] [CrossRef]
- Jánossy, I.; Szabados, L. Optical reorientation of nematic liquid crystals in the presence of photoisomerization. Phys. Rev. E 1998, 58, 4598–4604. [Google Scholar] [CrossRef]
- Francescangeli, O.; Slussarenko, S.; Simoni, F.; Andrienko, D.; Reshetnyak, V.; Reznikov, Y. Light-Induced Surface Sliding of the Nematic Director in Liquid Crystals. Phys. Rev. Lett. 1999, 82, 1855–1858. [Google Scholar] [CrossRef]
- Marusii, T.; Reznikov, Y.; Voloshchenko, D.; Reshetnyak, V. Surface Driven Orientation Effect in NLC Cell. Mol. Cryst. Liq. Cryst. Sci. Technol. Sect. A Mol. Cryst. Liq. Cryst. 1994, 251, 209–218. [Google Scholar] [CrossRef]
- Anderle, K.; Wendorff, J.H. Holographic Recording, Using Liquid Crystalline Side Chain Polymers. Mol. Cryst. Liq. Cryst. Sci. Technol. Sect. A Mol. Cryst. Liq. Cryst. 1994, 243, 51–75. [Google Scholar] [CrossRef]
- Rau, H. Photoisomerization of azobenzenes. In Photochemistry and Photophysics; Jan, F.R., Gary, W.S., Eds.; CRC Press: Boca Raton, FL, USA, 1990; Volume 2, pp. 119–141. [Google Scholar]
- Ouskova, E.; Fedorenko, D.; Reznikov, Y.; Shiyanovskii, S.V.; Su, L.; West, J.L.; Kuksenok, O.V.; Francescangeli, O.; Simoni, F. Hidden photoalignment of liquid crystals in the isotropic phase. Phys. Rev. E 2001, 63, 021701. [Google Scholar] [CrossRef] [PubMed]
- Lucchetti, L.; Difabrizio, M.; Francescangeli, O.; Simoni, F. Light-induced adsorption and desorption in dynamic and stable grating formation in methyl-red doped liquid crystals. J. Nonlinear Opt. Phys. Mater. 2002, 11, 13–23. [Google Scholar] [CrossRef]
- Fedorenko, D.; Ouskova, E.; Reshetnyak, V.; Reznikov, Y. Evolution of light-induced anchoring in dye-doped nematics: Experiment and model. Phys. Rev. E 2006, 73, 031701. [Google Scholar] [CrossRef]
- Lucchetti, L.; DiFabrizio, M.; Francescangeli, O.; Simoni, F. Colossal optical nonlinearity in dye doped liquid crystals. Opt. Commun. 2004, 233, 417–424. [Google Scholar] [CrossRef]
- Lucchetti, L.; Simoni, F. Light-induced adsorption and desorption in Methyl-Red-doped liquid crystals: A review. Liq. Cryst. Rev. 2015, 3, 79–98. [Google Scholar] [CrossRef]
- Huang, C.-Y.; Lin, Y.-R.; Lo, K.-Y.; Lee, C.-R. Dynamics of photoalignment in azo-dye-doped liquid crystals. Appl. Phys. Lett. 2008, 93, 181114. [Google Scholar] [CrossRef]
- Eichler, H.J.; Macdonald, R. Flow-alignment and inertial effects in picosecond laser-induced reorientation phenomena of nematic liquid crystals. Phys. Rev. Lett. 1991, 67, 2666–2669. [Google Scholar] [CrossRef]
- Voloshchenko, D.; Khyzhnyak, A.; Reznikov, Y.; Reshetnyak, V. Control of an Easy-Axis on Nematic-Polymer Interface by Light Action to Nematic Bulk. Jpn. J. Appl. Phys. 1995, 34, 566–571. [Google Scholar] [CrossRef]
- Lo, K.-Y.; Huang, C.-Y. Observation of transient reorientation of dye-doped liquid crystals by pumped attenuated total reflection. Appl. Phys. Lett. 2006, 89, 081114. [Google Scholar] [CrossRef]
- Huang, C.-Y.; Cheng, Z.-Z.; Lo, K.-Y.; Lee, C.-R. Determination of polar anchoring energy of dye-doped liquid crystals by measuring capacitance. J. Appl. Phys. 2010, 107, 123104. [Google Scholar] [CrossRef]
- Shinbo, K.; Ishikawa, J.; Baba, A.; Kaneko, F.; Kato, K.; Advincula, R.C. Alignments of Nematic Liquid Crystal Molecules on Azo-Dye-Containing Alternate Self-Assembled Films Investigated Using Attenuated Total Reflection Method. Jpn. J. Appl. Phys. 2002, 41, 2753–2758. [Google Scholar] [CrossRef]
- Lo, K.Y.; Huang, C.Y.; Chu, T.H.; Hsu, C.J.; Lin, C.H.; Fuh, A.Y.G. Variation of nematic liquid crystal on a silver surface. J. Opt. A Pure Appl. Opt. 2006, 8, 501–506. [Google Scholar] [CrossRef]
- Lo, K.Y.; Huang, C.Y. Dynamics of the photoexictation of azo dye-doped liquid crystals probing by pumped attenuated total reflection. In Proceedings of the Liquid Crystals and Applications in Optics, Prague, Czech Republic, 16 April 2007; Glogarova, M., Palffy-Muhoray, P., Copic, M., Eds.; SPIE: Bellingham, WA, USA; Volume 6587, p. 65870R. [Google Scholar] [CrossRef]
- Yakovlev, D.A.; Chigrinov, V.G.; Kwok, H.S. Modeling and Optimization of LCD Optical Performance; John Wiley & Sons, Inc.: Hoboken, NJ, USA, 2015. [Google Scholar]
- Thomas, O.; Brogat, M. Organic Constituents. In UV-Visible Spectrophotometry of Water and Wastewater, 2nd ed.; Thomas, O., Burgess, C., Eds.; Elsevier: London, UK, 2017; pp. 73–138. ISBN 978-0-444-63897-700003-2. [Google Scholar]
- Heilmeier, G.H.; Zanoni, L.A. Guest-Host Interactions in Nematic Liquid Crystals. A New Electro-Optic Effect. Appl. Phys. Lett. 1968, 13, 91–92. [Google Scholar] [CrossRef]
- Józefowski, L.; Fiutowski, J.; Kawalec, T.; Rubahn, H.-G. Direct measurement of the evanescent-wave polarization state. J. Opt. Soc. Am. B 2007, 24, 624. [Google Scholar] [CrossRef]
- Barbero, G.; Durand, G. On the validity of the Rapini-Papoular surface anchoring energy form in nematic liquid crystals. J. Phys. 1986, 47, 2129–2134. [Google Scholar] [CrossRef]
- Lee, C.-R.; Fu, T.-L.; Cheng, K.-T.; Mo, T.-S.; Fuh, A.Y.-G. Surface-assisted photoalignment in dye-doped liquid-crystal films. Phys. Rev. E 2004, 69, 031704. [Google Scholar] [CrossRef]
- Saad, B.; Denariez-Roberge, M.M.; Galstyan, T.V. Diffusion of photoexcited azo dye in a liquid-crystal host. Opt. Lett. 1998, 23, 727. [Google Scholar] [CrossRef]
- Kuksenok, O.V.; Shiyanovskii, S.V. Surface Control of Dye Adsorption in Liquid Crystals. Mol. Cryst. Liq. Cryst. Sci. Technol. Sect. A Mol. Cryst. Liq. Cryst. 2001, 359, 107–118. [Google Scholar] [CrossRef]
- Lucchetti, L.; Simoni, F. Role of space charges on light-induced effects in nematic liquid crystals doped by methyl red. Phys. Rev. E 2014, 89, 032507. [Google Scholar] [CrossRef]


© 2020 by the authors. Licensee MDPI, Basel, Switzerland. This article is an open access article distributed under the terms and conditions of the Creative Commons Attribution (CC BY) license (http://creativecommons.org/licenses/by/4.0/).