Abstract
This paper describes our recent results on light propagation in photonic crystal fibers (PCFs) partially infiltrated with W212 ferroelectric liquid crystal (FLC) doped with 1–3 nm gold nanoparticles (NPs) with a concentration in the range of 0.1–0.5% wt. Based on our previous results devoted to PCFs infiltrated with nematic liquid crystals (NLCs) doped with gold NPs (GNPs), we extend our research line with FLCs doped with these NPs. To enhance the proper alignment of the NP-FLC nanocomposites inside PCFs, we applied an additional photo-aligning layer of SD-1 azo-dye material (DIC, Japan). Electro-optical response times and thermal tuning were studied in detail. We observed an improvement in response times for NP-FLC nanocomposites in comparison to the undoped FLC.
1. Introduction
Since the end of 20th century, photonic crystal fibers (PCF) [1] have gained an unceasing research interest, benefiting from their diversity of geometries where periodically arranged micro-channels (MCs) surrounding the core region present as a solid rod or an air hole. Depending on the PCF’s geometry, two guiding mechanisms can be responsible for light propagation in the core region. The first guiding mechanism is caused by a higher core refractive index in comparison to the effective refractive index of the surrounding cladding region. This mechanism relies on the modified total internal reflection (mTIR) principle and is similar to that present in classical solid-core optical fibers. In the second guiding mechanism, based on the photonic bandgap effect (PBG), only selective wavelengths can be guided in the core region. This mechanism is observed when the core refractive index has a lower value than the effective refractive index of the cladding.
The PCF’s guiding properties depend not only on the PCF’s geometry but can also be modified by infiltration of their structure with liquid or gaseous substances. The most suitable substances for this purpose are liquid crystals (LCs), which are characterized by high electric field sensitivity caused by dielectric anisotropy and temperature dependence, resulting in optical birefringence. The optical waveguides, being a combination of PCFs and LCs and referred to as photonic liquid crystal fibers (PLCFs), have been a topic of extensive research activities for more than 17 years, leading to the development of modern photonic sensors and in-fiber telecommunication devices. Most of the published scientific reports devoted to PLCFs describe potential applications of PCFs infiltrated with nematic LCs [2,3,4,5,6,7,8,9]. However, other types of LCs, such as chiral smectic C LCs (SmC*), with their ferroelectric properties (FLCs) [10,11], or the LC blue phase exhibiting a three-dimensional double-twist structure [12,13,14], have also been considered as suitable materials for infiltrating the PCF structure. The most significant factor of the prospective PLCF-based optical systems is their rapid electro-optical response. For PLCFs infiltrated with NLCs, the typical values of response times are in the range of 20–30 ms [15,16], while for PLCFs infiltrated with FLCs, values may reach below 100 µs [17]. Another parameter crucial for designing PLCF-based optical devices is undistorted light propagation and fine-tuning properties that can be guaranteed by the proper alignment of LC molecules inside PLCFs. One of the promising techniques of aligning FLC molecules inside cylindrical structures was reported in [18] and relies on the application of photosensitive sulfonic azo-dye material SD-1 [19,20]. The application of SD-1 material provides an excellent alignment of LC molecules inside cylindrical structures and improves switching times in PCFs infiltrated with LCs [17].
In recent years, a significant amount of research reports has been devoted to another improvement of LC-based systems. It has been noticed that doping LCs with nanoparticles (NPs) can have an impact on their electro-optical properties. Our previous works devoted to NLCs doped with gold and silver NPs indicated an improvement in switching times and a decrease in threshold voltage [21,22,23]. However, it must be noted that different types of NPs, i.e., metallic, ferroelectric, and dielectric NPs dispersed in LCs, as well as their shape and surface coating do not always result in improved electro-optical properties for NP-LCs [24,25,26,27].
The effect of NPs on FLCs has also been widely reported. It was found that silica NPs dispersed in FLC result in an improvement of the switching times [28]. The same effect was observed for FLCs doped with ferroelectric barium titanate (BaTiO3) where, additionally, spontaneous polarization of the FLC decreased [29,30,31]. Much attention has been focused on titanium dioxide (TiO2) NPs dispersed in FLCs. It has been observed by Gupta [32] that the application of TiO2 NPs results in reduced DC conductivity of NP-FLC nanocomposites. Kumar [33] reported that doping FLC with TiO2 NPs with different concentrations results in a slight increase in the isotropic transition temperature and a decrease in the spontaneous polarization value with higher concentrations of NPs in NP-FLC systems. It was also reported that doping FLCs with palladium NPs can have a positive impact on electro-optical and dielectric characteristics [34,35]. Additionally, interesting results have been presented with gold or silver metallic NPs. It was reported that doping gold nanoparticles GNPs into FLC significantly increased the optical tilt and created a strong intrinsic field inside the LC sample under the influence of low electric field intensity [36]. The existence of GNPs in FLC can also enhance photo-luminescent properties [37]. The detailed review on GNP-LC nanocomposites was given by Choudhary [38].
In this paper, we have extended our research line by initiating an investigation of the electro-optical properties of PLCFs infiltrated with GNPs dispersed in FLCs. We have analyzed the spectral properties of the investigated PLCF under the influence of an external electric field and temperature.
2. Materials and Methods
For our studies, we selected an isotropic PCF, LMA-10, manufactured by NKT Photonics (Figure 1). The photonic lattice consists of six rings of hollow MCs with internal diameter d = 2.73 µm that surrounds a solid core. The distance between MCs, referred as pitch, is equal to Λ = 6.42 µm.
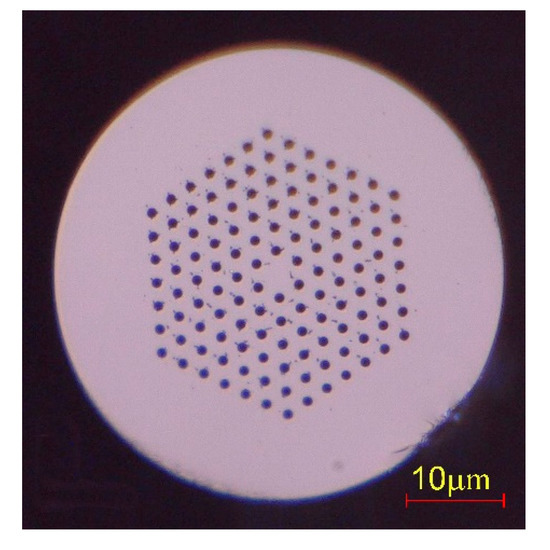
Figure 1.
A cross-section of photonic crystal fiber PCF LMA-10 used in our studies.
In the preparatory stage, the inner walls of the LMA-10 PCF were covered with photosensitive sulfonic azo-dye SD1 to induce a photo-aligned layer necessary for the proper alignment of the GNP-FLC nanocomposites. The detailed procedure of generating the photo-aligned layer and infiltration with FLC mixture is given in [17]. It should be emphasized that the application of SD1 layers not only in cylindrical structures but also on planar structures provides an excellent alignment of different types of LCs. Moreover, the alignment of SD1 molecules is possible by proper irradiation with linearly polarized UV light and can be rewritten by a secondary UV light dose.
The LC chosen for the present studies was W212 FLC, synthesized at the Military University of Technology. The W212 FLC is characterized with helical pitch ρ = 7 µm, spontaneous polarization Ps = 100 nC/cm2, and tilt angle θ = 40° (all measured at 20 °C). The phase transition scheme for the selected LC is as follows: Cr < 0 SmC* 49.3 SmA 126.6 Iso.
The selected GNPs were synthesized at the Military University of Technology and were employed to prepare four different concentrations of GNP-FLC mixtures: W212 + 0.1% wt. GNP, W212 + 0.2% wt. GNP, W212 + 0.3% wt. GNP and W212 + 0.5% wt. GNP.
The preparation of the GNP suspension in an organic solvent was based on a modified two-phase redox reaction described in [39]. The AuCl4− ions were transferred from aqueous solution to chloroform with the assistance of tetraoctylammonium bromide acting as a phase transfer reagent. Next, the solution was reduced with an aqueous solution of sodium borohydride in the presence of dodecanethiol. After reaction, the organic phase was separated and washed with diluted hydrochloric acid and deionized water to remove impurities and excess reactants. In the next step, the suspension of GNPs in chloroform was transferred to a centrifuge tube and mixed with methanol (1:10 v/v). After centrifugation, the supernatant was poured off and the obtained precipitate of GNPs was dispersed in pure chloroform. Finally, the suspension of 1–3 nm GNPs with a concentration of ca. 1.2 mg/mL was obtained. The diameters of GNPs were estimated using a disc centrifuge sedimentation method.
The FLC samples with different concentrations of GNPs (0.1%, 0.2%, 0.3%, 0.5%, all measured in % wt.) were prepared by mixing fixed proportions of GNPs in pure W212 FLC in presence of chloroform. After that, the mixture was sonicated until it reached a visible homogeneity and then it was left in the oven at ~50 °C until complete evaporation of the chloroform from the mixture. Before infiltration, the NP-FLC samples were optically examined to ensure that no NP aggregates existed.
For the stage of PLCF preparation, an LMA-10 PCF with created SD1 layer was infiltrated with GNPs-W212 FLC solution by the capillary forces with the assistance of a temperature above 130 °C, at which the W212 FLC remained in an isotropic phase. The length of the PLCF infiltrated part was 10 mm.
For the initial step, we verified the alignment of the GNPs-W212 FLC mixture in PLCFs. This step was divided into two parts: first, the alignment was verified in single silica glass MCs of 3-µm diameter with the generated photo-aligned SD-1 layer using optical microscopy measurement. The selected diameter of the MCs was similar to that of the LMA-10 PCF internal MCs. In the second part, the observations were repeated for the examined PLCFs. Both host materials were observed under the microscope with crossed polarizers under different azimuths (Keyence VHX-5000, Osaka, Japan).
The thermal properties of the NPs-W212 FLC mixture were studied in single silica glass MCs of 6-µm diameter using a computer-controlled hot stage (Linkam THM6000, Epsom, UK) with a resolution of 0.1 °C and an optical microscope (Nikon Eclipse TS-2R, Tokyo, Japan) with crossed polarizers.
3. Results and Discussion
The alignment observations for the 3-µm MCs infiltrated with undoped W212 FLC and with four FLC-GNP mixtures with different GNP concentrations are presented in Figure 2. The images of all observed MC samples exhibit good alignment that indicates an escaped-radial orientation of the GNPs-W212 FLC composites. However, some defects can be observed for the MC sample infiltrated with W212 FLC doped with 0.5% wt. GNPs (Figure 2m–o). The presence of the defect is especially visible in Figure 2n where a change in the GNPs-W212 FLC composite orientation occurred. This can be attributed either to a too high concentration of the GNPs that disabled proper alignment of the molecules or to a too weak SD1 layer interaction that was not strong enough to keep the NPs-FLC molecules in the desired alignment.
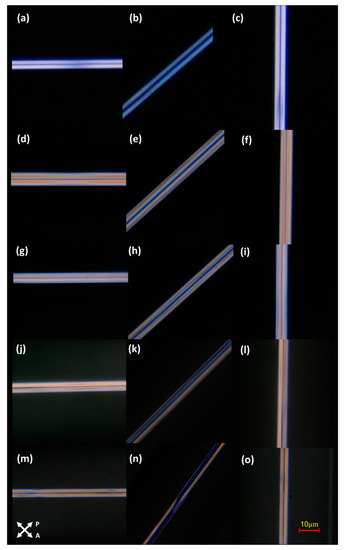
Figure 2.
The optical image under the microscope with crossed polarizers for 3-µm microcapillaries MCs infiltrated with undoped W212 ferroelectric liquid crystal FLC (a–c) and doped with gold nanoparticles GNPs at concentrations of 0.1% wt. (d–f), 0.2% wt. (g–i), 0.3% wt. (j–l), 0.5% wt. (m–o).
The thermal observations were carried out to investigate the phase transition for undoped and GNP-doped FLC in 6-µm MCs. Since the phase transition takes more time in cylindrical structures than in planar LC cells, we used two temperatures: one for the beginning and one for the end of the process. The beginning and the end of the phase transition correspond to the temperatures where isotropic droplets appear and when the isotropic phase is observed, respectively. The results for the selected MC infiltrated with 0.1% wt. GNP-doped W212 FLC are presented in Figure 3. The temperatures for all investigated samples are presented in Table 1.

Figure 3.
A mesophase–isotropic phase transition for a 6-µm microcapillary infiltrated with 0.1% wt. GNPs in W212 FLC. (a) Before the phase transition, (b) beginning of the phase transition, (c) during the phase transition, (d) end of the phase transition.

Table 1.
Mesophase–-isotropic phase transition for a 6-µm microcapillary infiltrated with different concentrations of GNPs in W212 FLC.
It can be noticed that doping W212 FLC with GNPs at different concentrations leads to decrease in the mesophase–isotropic phase transition temperatures in comparison to the undoped W212 FLC.
In the next step, we focused on the observation of the thermal effects in the PLCF doped with GNPs. The experimental setup is presented in Figure 4.

Figure 4.
Setup used for spectral measurements for the function of temperature.
All observations were carried out by using a broadband halogen light source (Mikropack HL-2000, Ocean Optics Mikropack, Ostfildern, Germany) projected into the investigated PLCF sample. The signal was collected by a fiber optic spectrum analyzer (Ocean Optics USB4000, Ocean Optics, Dunedin, FL, USA) and visualized on a PC. The infiltrated part of the PLCF was placed on the Peltier module whose temperature was registered by a handheld thermometer (Testo, Model 735, Testo SE &Co. KGaA, Lenzkirch, Germany) with a resolution of 0.1 °C. The optical spectra for PLCFs infiltrated with GNP-FLCs are presented in Figure 5. The spectra were registered for five temperatures between 20 °C and 100 °C.
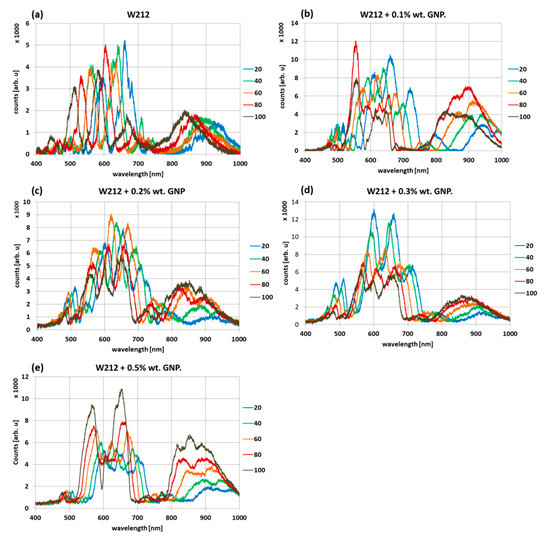
Figure 5.
Spectra for photonic liquid crystal fibers (PLCFs) infiltrated with (a) undoped W212 FLC and FLCs doped with GNPs at concentrations of (b) 0.1% wt., (c) 0.2% wt., (d) 0.3% wt., (e) 0.5% wt.
It can be observed that by increasing the temperature of the sample, the registered light spectra shifted towards shorter wavelengths (Table 2). This phenomenon is known as the blue-shift effect. The highest shift, equal to 88 nm, was observed for PLCF infiltrated with undoped W212 FLC, while for the PLCF sample with 0.5% wt. GNPs, this shift was 45 nm. It indicates that the concentration of GNPs dispersed in W212 FLC had an influence on spectrum shift effectivity.

Table 2.
A blue shift registered for PLCF samples infiltrated with W212 FLC at different concentrations of GNPs.
Another important observation is the existence of a strong peak within the range of 600–700 nm, which enabled us to select an appropriate wavelength for the next steps of our research. Based on the presented spectrograms, a laser diode (LD) operating at a wavelength of 660 nm (Thorlabs Inc. Newton, NJ, USA) was chosen for electro-optical measurements, since all the presented samples exhibited relatively good propagation at this wavelength.
The electro-optical influence of GNPs in W212 FLC on switching times in the presence of an external electric field can be considered as one of the most crucial issues in our studies. The experimental setup for the realization of this part of our studies is presented in Figure 6.
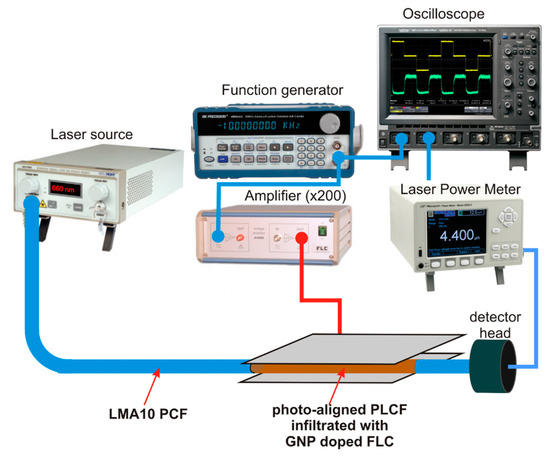
Figure 6.
The experimental setup used for electro-optical studies.
The infiltrated part of the PLCFs was placed between two metal electrodes coupled to a function generator (Rigol DG1022A, Rigol Technologies, Beijing, China) through a voltage amplifier (FLC A800DI, FLC Electronics AB, Partille, Sweden). The distance between electrodes was estimated to be 280 µm. A square-shaped signal at a frequency 10 Hz and an amplitude in the range of 1–7 Vpp was amplified 200 times, which correspond to an electric field intensity between electrodes in the range of 0.75–5.36 V/µm. These values of electric field intensity are necessary mainly due to the large distance between electrodes. The outgoing optical signal was collected by an optical power meter (Newport 2936-R, Newport Corporation, Irvine, CA, USA) and visualized on a digital oscilloscope (LeCroy WaveRunner 104MXi-A, LeCroy Corporation, Chestnut Ridge, NY, USA). Moreover, a direct electric signal from a function generator was registered on the second channel of the oscilloscope.
The switching time was presumed to be the time required to change the value of the signal from 10% to 90% (or vice versa) of the optical signal maximal value. The obtained results are presented in Figure 7.
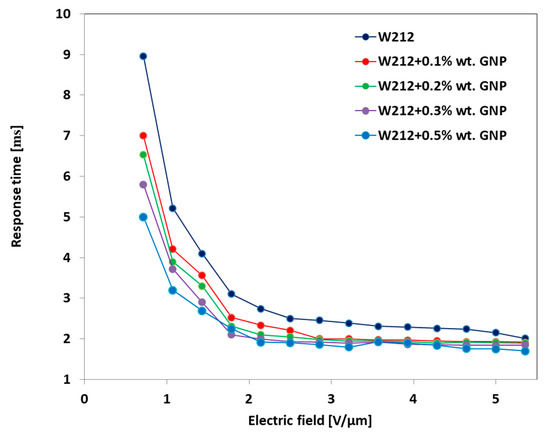
Figure 7.
The response times for PLCFs infiltrated with W212 FLC doped with different concentrations of GNPs as a function of applied electric field. Measurements registered at 25 °C.
Table 3 shows the response times for the lowest and the highest values of the electric field intensity for all the investigated PLCFs.

Table 3.
The response times for PCFs infiltrated with W212 FLC doped with different concentrations of GNPs. The values are given for the lowest and highest values of electric field intensity.
It can be observed that doping W212 FLC with GNPs with different concentrations has the highest influence on switching times for low intensities of the electric field. The switching time shortened by up to ~4 ms for the PLCF infiltrated with W212 FLC doped with 0.5% wt. GNPs in comparison to the undoped PLCF sample. However, for higher values of electric field intensity, the differences between response times for all investigated PLCF samples are relatively small. A similar effect was reported in [32] and it can be attributed to a change in the spontaneous polarization of the NP-FLC composites for different values of the electric field intensity. High values of spontaneous polarization at low electric field intensities can have an influence on significant changes in response times for NP-FLC composites with different concentrations of NPs. For higher electric field intensities, the value of spontaneous polarization exhibits a small deviation and hence the response times for the investigated NP-FLC samples are comparable.
4. Conclusions
The present research reports the influence of small (1–3 nm) GNPs dispersed in W212 FLC on the thermo-optical and electro-optical parameters of PLCFs. The results show that the guiding mechanism of light through the investigated PLCFs is based on the photonic bandgap effect. Moreover, a blue shift in the light spectrum is observed when the temperature of the PLCF samples increases. This effect can be applied when designing a simple in-fiber temperature sensor. Depending on the concentration of the GNPs, the sensitivity of such a sensor could be adjusted. It can be also observed that doping FLCs with GNPs has an impact on the reduction of the response times under the influence of an external electric field. This improvement depends on the intensity of the external electric field and can be attributed to the deviation of spontaneous polarization. This effect can be useful for the development of in-fiber switches and attenuators for telecommunication lines.
Author Contributions
Conceptualization, Methodology, Research—D.B.; Investigation—K.W.; Resources—B.J., B.B.; Validation, Funding acquisition—T.R.W. All authors have read and agreed to the published version of the manuscript.
Funding
This research was funded by the Polish National Science Centre, grant number 2011/03/B/ST7/02547 and 2015/19/B/ST7/03650.
Acknowledgments
The authors acknowledge fruitful collaboration with Roman Dąbrowski (Military University of Technology, Warsaw, Poland) and Vladimir Chigrinov (Foshan University, Foshan, China).
Conflicts of Interest
The authors declare no conflict of interest.
References
- Russell, P.S.J. Photonic-Crystal Fibers. J. Light. Technol. 2006, 24, 4729–4749. [Google Scholar] [CrossRef]
- Larsen, T.; Bjarklev, A.; Hermann, D.; Broeng, J. Optical devices based on liquid crystal photonic bandgap fibres. Opt. Express 2003, 11, 2589. [Google Scholar] [CrossRef] [PubMed]
- Woliński, T.R.; Szaniawska, K.; Bondarczuk, K.; Lesiak, P.; Domański, A.W. Propagation properties of photonic crystal fibers filled with nematic liquid crystals. Opto Electron. Rev. 2005, 13, 177–182. [Google Scholar]
- Woliński, T.R.; Szaniawska, K.; Ertman, S.; Lesiak, P.; Domański, A.W.; Dąbrowski, R.; Nowinowski-Kruszelnicki, E.; Wójcik, J. Influence of temperature and electrical fields on propagation properties of photonic liquid-crystal fibres. Meas. Sci. Technol. 2006, 17, 985–991. [Google Scholar] [CrossRef]
- Hu, J.J.; Shum, P.; Ren, G.; Yu, X.; Wang, G.; Lu, C.; Ertman, S.; Woliński, T.R. Investigation of thermal influence on the bandgap properties of liquid-crystal photonic crystal fibers. Opt. Commun. 2008, 281, 4339–4342. [Google Scholar] [CrossRef]
- Haakestad, M.W.; Alkeskjold, T.T.; Nielsen, M.D.; Scolari, L.; Riishede, J.; Engan, H.E.; Bjarklev, A. Electrically tunable photonic bandgap guidance in a liquid-crystal-filled photonic crystal fiber. IEEE Photonics Technol. Lett. 2005, 17, 819–821. [Google Scholar] [CrossRef]
- Du, F.; Lu, Y.-Q.; Wu, S.-T. Electrically tunable liquid-crystal photonic crystal fiber. Appl. Phys. Lett. 2004, 85, 2181–2183. [Google Scholar] [CrossRef]
- Lorenz, A.; Kitzerow, H.-S. Efficient electro-optic switching in a photonic liquid crystal fiber. Appl. Phys. Lett. 2011, 98, 241106. [Google Scholar] [CrossRef]
- Khan, K.R.; Bidnyk, S.; Hall, T.J. Tunable all optical switch implemented in a liquid crystal filled dual-core photonic crystal fiber. Prog. Electromagn. Res. M 2012, 22, 179–189. [Google Scholar] [CrossRef]
- Budaszewski, D.; Srivastava, A.K.; Woliński, T.R.; Chigrinov, V.G. Photo-aligned photonic ferroelectric liquid crystal fibers. J. Soc. Inf. Disp. 2015, 23, 196–201. [Google Scholar] [CrossRef]
- Knust, S.; Wahle, M.; Kitzerow, H.S. Ferroelectric Liquid Crystals in Microcapillaries: Observation of Different Electro-optic Switching Mechanisms. J. Phys. Chem. B 2017, 121, 5110–5115. [Google Scholar] [CrossRef] [PubMed]
- Poudereux, D.; Orzechowski, K.; Chojnowska, O.; Tefelska, M.; Woliński, T.R.; Otón, J.M. Infiltration of a photonic crystal fiber with cholesteric liquid crystal and blue phase. In Proceedings of the Symposium on Photonics Applications in Astronomy, Communications, Industry and High-Energy Physics Experiments, Warsaw, Poland, 16 December 2014. [Google Scholar]
- Dąbrowski, R. From the discovery of the partially bilayer smectic A phase to blue phases in polar liquid crystals. Liq. Cryst. 2015, 42, 783–818. [Google Scholar] [CrossRef]
- Sala-Tefelska, M.M.; Orzechowski, K.; Sierakowski, M.; Siarkowska, A.; Woliński, T.R.; Strzeżysz, O.; Kula, P. Influence of cylindrical geometry and alignment layers on the growth process and selective reflection of blue phase domains. Opt. Mater. 2018, 75, 211–215. [Google Scholar] [CrossRef]
- De Gennes, P.G.; Prost, J. The Physics of Liquid Crystals; Oxford University Press: Oxford, UK; New York, NY, USA, 1995. [Google Scholar]
- Blinov, L.M.; Chigrinov, V.G. Electrooptic Effects in Liquid Crystal Materials; Partially Ordered Systems; Springer: New York, NY, USA, 1994; ISBN 978-0-387-94708-2. [Google Scholar]
- Budaszewski, D.; Srivastava, A.K.; Chigrinov, V.G.; Woliński, T.R. Electro-optical properties of photo-aligned photonic ferroelectric liquid crystal fibres. Liq. Cryst. 2019, 46, 272–280. [Google Scholar] [CrossRef]
- Budaszewski, D.; Srivastava, A.K.; Tam, A.M.W.; Woliński, T.R.; Chigrinov, V.G.; Kwok, H. Photo-aligned ferroelectric liquid crystals in microchannels. Opt. Lett. 2014, 39, 4679. [Google Scholar] [CrossRef]
- Chigrinov, V.G.; Kozenkov, V.M.; Kwok, H.-S. Photoalignment of Liquid Crystalline Materials; John Wiley & Sons: West Sussex, UK, 2008; ISBN 9780470751800. [Google Scholar]
- Schadt, M.; Schmitt, K.; Kozinkov, V.; Chigrinov, V. Surface-Induced Parallel Alignment of Liquid Crystals by Linearly Polymerized Photopolymers. Jpn. J. Appl. Phys. 1992, 31, 2155–2164. [Google Scholar] [CrossRef]
- Dąbrowski, R.; Garbat, K.; Urban, S.; Woliński, T.R.; Dziaduszek, J.; Ogrodnik, T.; Siarkowska, A. Low-birefringence liquid crystal mixtures for photonic liquid crystal fibres application. Liq. Cryst. 2017, 44, 1911–1928. [Google Scholar] [CrossRef]
- Budaszewski, D.; Siarkowska, A.; Chychłowski, M.; Jankiewicz, B.; Bartosewicz, B.; Dąbrowski, R.; Woliński, T.R. Nanoparticles-enhanced photonic liquid crystal fibers. J. Mol. Liq. 2018, 267, 271–278. [Google Scholar] [CrossRef]
- Budaszewski, D.; Chychłowski, M.; Budaszewska, A.; Bartosewicz, B.; Jankiewicz, B.; Woliński, T.R. Enhanced efficiency of electric field tunability in photonic liquid crystal fibers doped with gold nanoparticles. Opt. Express 2019, 27, 14260. [Google Scholar] [CrossRef]
- Klein, S.; Richardson, R.M.; Greasty, R.; Jenkins, R.; Stone, J.; Thomas, M.R.; Sarua, A. The influence of suspended nanoparticles on the Frederiks threshold of the nematic host. Philos. Trans. R. Soc. A Math. Phys. Eng. Sci. 2013, 371, 20120253. [Google Scholar] [CrossRef]
- Li, F.; West, J.; Glushchenko, A.; Cheon, C.I.; Reznikov, Y. Ferroelectric nanoparticle/liquid-crystal colloids for display applications. J. Soc. Inf. Disp. 2006, 14, 523. [Google Scholar] [CrossRef]
- Blach, J.-F.; Saitzek, S.; Legrand, C.; Dupont, L.; Henninot, J.-F.; Warenghem, M. BaTiO3 ferroelectric nanoparticles dispersed in 5CB nematic liquid crystal: Synthesis and electro-optical characterization. J. Appl. Phys. 2010, 107, 074102. [Google Scholar] [CrossRef]
- Glushchenko, A.; Cheon, C.I.; West, J.; Li, F.; Büyüktanir, E.; Reznikov, Y.; Buchnev, A. Ferroelectric Particles in Liquid Crystals: Recent Frontiers. Mol. Cryst. Liq. Cryst. 2006, 453, 227–237. [Google Scholar] [CrossRef]
- Chaudhary, A.; Malik, P.; Mehra, R.; Raina, K.K. Electro-optic and dielectric studies of silica nanoparticle doped ferroelectric liquid crystal in SmC phase. Phase Transit. 2012, 85, 244–254. [Google Scholar] [CrossRef]
- Mikułko, A.; Arora, P.; Glushchenko, A.; Lapanik, A.; Haase, W. Complementary studies of BaTiO3 nanoparticles suspended in a ferroelectric liquid-crystalline mixture. EPL Europhys. Lett. 2009, 87, 27009. [Google Scholar] [CrossRef]
- Kumar, P.; Sinha, A. Effect of barium titanate nanoparticles of different particle sizes on electro-optic and dielectric properties of ferroelectric liquid crystal. Phase Transit. 2015, 88, 605–620. [Google Scholar] [CrossRef]
- Al-Zangana, S.; Turner, M.; Dierking, I. A comparison between size dependent paraelectric and ferroelectric BaTiO3 nanoparticle doped nematic and ferroelectric liquid crystals. J. Appl. Phys. 2017, 121, 085105. [Google Scholar] [CrossRef]
- Kumar Gupta, S.; Pratap Singh, D.; Manohar, R. Electrical and Polarization Behaviour of Titania Nanoparticles Doped Ferroelectric Liquid Crystal. Adv. Mater. Lett. 2015, 6, 68–72. [Google Scholar] [CrossRef]
- Kumar, P.; Kishore, A.; Sinha, A. Effect of Different Concentrations of Dopant Titanium Dioxide Nanoparticles on Electro-optic and dielectric Properties of Ferroelectric Liquid Crystal Mixture. Adv. Mater. Lett. 2016, 7, 104–110. [Google Scholar] [CrossRef]
- Kumar, A.; Singh, G.; Joshi, T.; Rao, G.K.; Singh, A.K.; Biradar, A.M. Tailoring of electro-optical properties of ferroelectric liquid crystals by doping Pd nanoparticles. Appl. Phys. Lett. 2012, 100, 054102. [Google Scholar] [CrossRef]
- Kumar, A.; Singh, G.; Joshi, T.; Biradar, A.M. Electro-optical and dielectric characteristics of ferroelectric liquid crystal dispersed with palladium nanoparticles. J. Mol. Liq. 2020, 315, 113776. [Google Scholar] [CrossRef]
- Kaur, S.; Singh, S.P.; Biradar, A.M.; Choudhary, A.; Sreenivas, K. Enhanced electro-optical properties in gold nanoparticles doped ferroelectric liquid crystals. Appl. Phys. Lett. 2007, 91, 023120. [Google Scholar] [CrossRef]
- Kumar, A.; Prakash, J.; Mehta, D.S.; Biradar, A.M.; Haase, W. Enhanced photoluminescence in gold nanoparticles doped ferroelectric liquid crystals. Appl. Phys. Lett. 2009, 95, 023117. [Google Scholar] [CrossRef]
- Choudhary, A.; Singh, G.; Biradar, A.M. Advances in gold nanoparticle–liquid crystal composites. Nanoscale 2014, 6, 7743–7756. [Google Scholar] [CrossRef] [PubMed]
- Brust, M.; Walker, M.; Bethell, D.; Schiffrin, D.J.; Whyman, R. Synthesis of thiol-derivatised gold nanoparticles in a two-phase liquid-liquid system. J. Chem. Soc. Chem. Commun. 1994, 801–802. [Google Scholar] [CrossRef]
© 2020 by the authors. Licensee MDPI, Basel, Switzerland. This article is an open access article distributed under the terms and conditions of the Creative Commons Attribution (CC BY) license (http://creativecommons.org/licenses/by/4.0/).