Abstract
This article aimed to synthesis, spectroscopic, physicochemical characterizations, and catalytic studies on some ofloxacin (OFL) complexes with ruthenium(III) [Ru(III)] metal ions. The Ru(III)-OFL complex, [Ru(OFL)2(Cl)2]Cl and two mixed-ligand complexes, [Ru(OFL)(AA)(H2O)2]Cl2 derived from OFL as the primary ligand and amino acids [AA; either glycine (Gly) or alanine (Ala)] as the secondary ligands, were synthesized and characterized using microanalytical, spectroscopic, and physical techniques including element composition, molar conductivity, infrared, electronic spectra, thermal, X-ray powder diffraction (XRD), Energy dispersive X-ray spectroscopy (EDX), Scanning electron microscopy (SEM), and Transmittance electron microscopy (TEM) analyses. The element analysis data describe the formation of 1:2 [Ru(III):OFL] and 1:1:1 [Ru(III):OFL:AA] complexes. The octahedral geometry of the complexes was confirmed by their magnetic moment and diffused reflectance. Fourier Transform Infrared spectroscopic (FTIR) measurements suggested that the ligands chelated with Ru(III) ions through the nitrogen atoms of the piperazine ring. In vitro antibacterial efficiency of the OFL compounds was evaluated by paper disc diffusion method. Significant antimicrobial activities were observed for some compounds of the series.
1. Introduction
Fluoroquinolones are broad-spectrum antibiotics particularly effective against gram-negative organisms, notably Pseudomonas aeruginosa. Moreover, they are often used to treat infections like pneumonia [1,2,3]. Generally, these antibiotics are well tolerated and confer very few side effects [4]. Second-generation quinolones, e.g., ciprofloxacin, enoxacin, lomefloxacin, norfloxacin, and ofloxacin (OFL; Figure 1), have greater systemic activity, potency against gram-negative strains, and atypical pathogen coverage. Therefore, compared to the first-generation drugs, the second-generation quinolones have broader clinical applications, including the treatment of skin infections, selected types of pneumonia, sexually transmitted diseases, pyelonephritis, and complicated urinary tract infections [5].
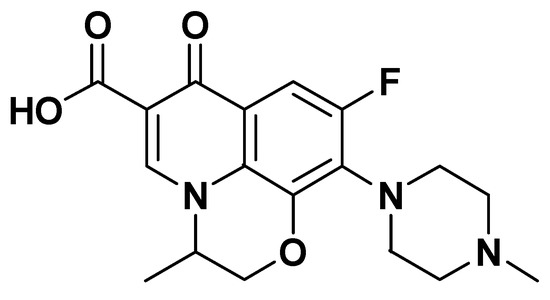
Figure 1.
Structure of ofloxacin (OFL) drug.
The complexation of quinolones with metal ions has attracted recent attention due to their enhanced fluorescence properties, improved solubility in water [6,7,8,9,10,11,12], and more potent biological activity [13,14,15,16]. Drug complexation is a vital topic in the field of inorganic chemistry and biology [17,18] and in several cases, the addition of a metal atom provides beneficial attributes that enhance the activity of the compound [19,20,21,22,23]. Four chelation modes have been reported for quinolones regarding metal ions, as described in Figure 2 [24,25,26,27,28]. Electrostatic interactions between quinolones and metal ions were only observed in acidic media because, under this condition, singly and/or doubly protonated quinolones can bind to the metal ions [24,25,26]. Neutral quinolones in zwitterionic form can form simple complexes through bidentate chelation [27,28,29]. Also, quinolones can act as unidentate ligands by forming metal complexes using the terminal piperazinyl nitrogen [30,31,32].
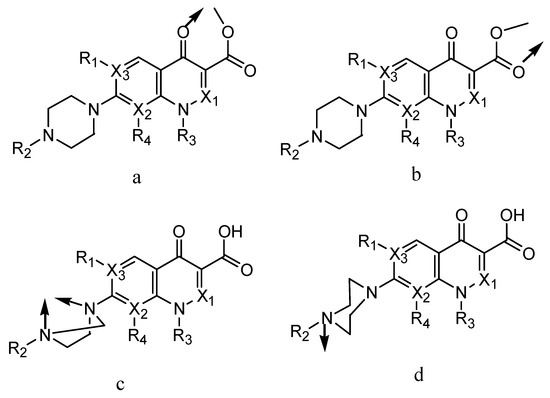
Figure 2.
(a–d) Four chelation modes of quinolones with metal ions.
In this work, we prepared three complexes of ruthenium(III) [Ru(III)] ions and OFL. Complex 1 was directly synthesized from the reaction of Ru(III) ions and OFL ligand. Complex 2 and Complex 3 were mixed-ligand complexes containing the amino acids glycine (Gly) and alanine (Ala), respectively. The three complexes, formulated as [Ru(OFL)2(Cl)2]Cl, [Ru(OFL)(Gly)(H2O)2]Cl2, and [Ru(OFL)(Ala)(H2O)2]Cl2, respectively, were fully characterized. These complexes were characterized structurally using FTIR, XRD, SEM, and EDX, and analyzed to determine their antibacterial efficiency against two of Gram (+) and Gram (−) species.
2. Experimental
2.1. Chemicals and Reagents
Ofloxacin (OFL) was obtained from Jamjoom Pharmaceutical Company (Jeddah, Saudi Arabia). The Ru(III) chloride hydrate and RuCl3.xH2O from the Sigma-Aldrich Chemical Company (Saint Louis, MO, USA). All solvents were obtained from the Fluka Chemical Company (London, UK), Glycine from BDH Chemicals (London, UK), DL-alanine from the FARCO Chemical Company (Moscow, Russian Federation), and ammonia solution (3%) from the Panreac ITW Company (Barcelona, Spain).
2.2. Instrumental Analyses
A Perkin Elmer CHN 2400 (PerkinElmer Inc., Shelton, USA) was used to conduct the analysis of %C, %H and %N element content. Ru and H2O content were determined gravimetrically. A Jenway 4010 conductivity meter (Jenway, Staffordshire, UK) was used for the molar conductivity measurements of the samples at 10−3 M in dimethylsulfoxide (DMSO). A UV2−Unicam UV/Vis spectrophotometer (METTLER TOLEDO, Columbus, OH, Country) was used to scan the UV−vis absorption spectra for samples dissolved in dimethylformamide (DMF) solvent within the 800–200 nm range. A Bruker FT−IR spectrophotometer (Bruker, Billerica, MA, USA) was used to collect the IR spectra for solid samples on KBr discs within the 4000–400 cm−1 range. A Shimadzu TG/DTG–50H thermogravimetric analyzer (Shimadzu Scientific Instruments, Kyoto, Japan) was employed for the thermal analyses of solid samples under atmospheric nitrogen conditions. A X’Pert Philips X-ray diffractometer (Philips, Manchester, UK) was used to collect the XRD patterns for the solid samples using CuKα1 radiation. SEM micrographs were obtained using a Jeol Jem−1200 EX II electron microscope (Jeol Ltd., Akishima, Japan) operated at an acceleration voltage of 25 kV. A Gouy magnetic balance (Sherwood Scientific Ltd., Cambridge, UK) was used to measure the mass susceptibility (Xg) of the complexes at room temperature. The melting point was determined using a STUART melting point device.
2.3. Complex Synthesis
2.3.1. [Ru(OFL)2(Cl)2]Cl Complex; Complex 1
A hot methanol-based solution (4 mmol, 40 mL) of OFL was added to an aqueous solution (2 mmol, 25 mL) of RuCl3.xH2O. This reaction mixture was neutralized to pH = 8−9 and then refluxed for 6–7 h at ~70–80 °C. The colored solution was filtered off and left to evaporate slowly. After being dried in an oven to remove any remaining solvent, the resulting dark-brown colored deposits were collected in a glass bottle for chemical analyses. The yield was obtained at about 75%.
2.3.2. [Ru(OFL)(Gly)(H2O)2]Cl2Complex; Complex 2
A hot methanol-based solution (2 mmol, 40 mL) of OFL was added to an aqueous solution (2 mmol, 25 mL) of RuCl3.xH2O and (2 mmol, 5 mL) glycine. This reaction mixture was neutralized to pH = 8–9 and then refluxed for 6–7 h at ~70–80 °C. The colored solution was filtered and left to evaporate slowly. After being dried in an oven for 6–15 h to remove any remaining solvent, the resulting dark-brown colored deposits were collected in a glass bottle for chemical analyses. The yield was obtained at about 71%.
2.3.3. [Ru(OFL)(Ala)(H2O)2]Cl2Complex; Complex 3
A hot methanol-based solution (2 mmol, 40 mL) of OFL was added to an aqueous solution (2 mmol, 25 mL) of RuCl3.xH2O and (2 mmol, 5 mL) alanine. This reaction mixture was neutralized to pH = 8−9 and then refluxed for 6–7 h at ~70–80 °C. The colored solution was filtered and left to evaporate slowly. After being dried in an oven for 6–15 h to remove any remaining solvent, the resulting dark-brown colored deposits were collected in a glass bottle for chemical analyses. The yield was obtained at about 73%.
3. Results and Discussion
3.1. Results Interpretation of Ru(III)-OFL Complexes
3.1.1. Microanalytical Values
The microanalytical element analysis of the OFL complexes indicated 1:2 [Ru(III):OFL] and 1:1:1 [Ru(III):OFL:AA] stoichiometry for the Ru(III)-OFL complexes, as listed in Table 1. According to these results, proposed chemical structures for Complex 1; [Ru(OFL)2(Cl)2]Cl, Complex 2; [Ru(OFL)(Gly)(H2O)2]Cl2, and Complex 3; [Ru(OFL)(Ala) (H2O)2]Cl2 are provided in Figure 3.

Table 1.
Microanalytical and physical values of free OFL and the Ru(III) complexes.
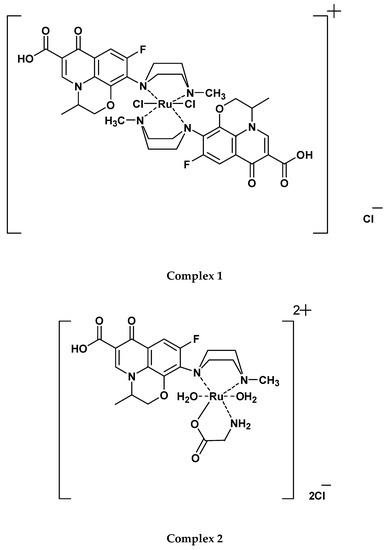
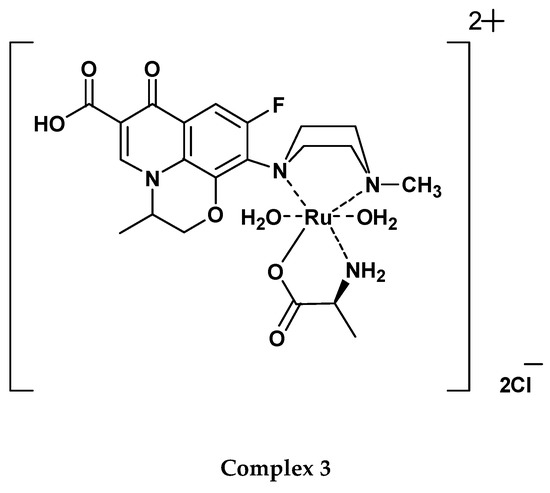
Figure 3.
Proposed chemical structures of the Ru(III)-OFL complexes.
3.1.2. Melting Point Data
The isolated dark brown solid Ru(III) OFL complexes showed high melting points, all above 250 °C. The melting points for Complex 1, Complex 2, and Complex 3 were 265–270 °C, 245–250 °C, and 257–260 °C, respectively.
3.1.3. Molar Conductivity
The three prepared Ru(III) complexes were only soluble in DMF and DMSO. Comparing the molar conductance values (1.40–2.59 μS) of these complexes to the free OFL drug (0.14 μS) revealed the difference in their electrolytic properties [33,34]. These values were suggestive of one or two chloride ions existing outside of the complexes’ coordination spheres.
3.1.4. UV–Vis Electronic Spectra
The UV–vis electronic spectrum of free OFL had three absorption bands at 338, 353, and 370 nm. The band at 338 nm was attributed to the π→π* electronic transition for the aromatic rings. The bands at 370 and 353 nm were due to the n→π* transition for the carboxylic and ketonic groups, respectively [35,36].
2T2g is the ground state of Ru(III) and 2A2g and 2T1g are its first excited doublet levels [37]. The Ru(III) complexes showed three electronic transitions at 29069–27027, 16556–16286, and 12578–12468 cm−1, which were assigned to 2T2g→2A2g (ν3), 2T2g→4T2g (ν2), and 2T2g→4T1g (ν1), respectively. The values of the spectroscopic parameters of the ligand field (10Dq) and interelectronic repulsion (B and C) were determined using the following equations [38,39], also listed in Table 2.
2T2g→4T1g (ν1) = 10Dq − 5B − 4C
2T2g→4T2g (ν2) = 10Dq+ 3B − 4C
2T2g→2A2g, 2T1g (ν3) =10Dq − 2B − C
Table 2.
Ligand field and interelectronic repulsion parameters of the synthesized complexes.
The value of B (Racahinterelectronic repulsion parameter) for the complexes was less than the Ru(III) ion alone (B′ = 630 cm−1) [39,40]. The nephelauxetic parameter (β = B/B′) was ≤1.0, and the 10Dq value was high. These results were indicative of a strong covalent bond between the OFL ligand and Ru(III) ions [39].
3.1.5. Magnetic Susceptibility
The effective magnetic moment of the Ru(III) complexes existed within the 1.92–1.82 B.M range. These values were lower than the predicted value for the Ru(III) complex (2.10 B.M), this may be due to extensive electron delocalization or ligand fields with less symmetry [41]. These values also aligned with a single unpaired electron in a low spin 4d5 octahedral configuration for the Ru(III) ion [42] and confirmed that the Ru(III) complex existed in a (+3) oxidation state.
3.1.6. FTIR Spectroscopy
The IR spectra of free OFL, Gly, Ala, the Ru(III)-OFL complex, and the mixed ligand complexes are shown in Figure 4a–f, and their characteristic bands are listed in Table 3. Free OFL, as a bidentate ligand, has two coordination sites: the carboxylate and carbonyl oxygen atoms or the piperazinenitrogens [43]. The free OFL ligand exhibited a strong band at 1709 cm−1 due to the carbonyl stretching vibrations of the carboxyl group. This band was observed at a higher frequency than the carbonyl group of the pyridine-4 with one moiety observed at 1617 cm−1 [44]. The bands located in the 1200–1400 cm−1 region in the IR spectrum of free OFL were due to coupling between the C–O and C–N stretching vibrations. Medium-to-strong bands observed in the 3040–2790 cm−1 region were due to the asymmetric and symmetric stretching vibrations of the CH (aromatic), CH2, and CH3CH groups. The deformation vibrations of both the CH2 and CH3 groups generated medium-to-strong bands at 1399 and 1358 cm−1 [45,46]. The bands that appeared at 1520 and 1452 cm−1 were assigned to the ν(C=C) vibrations of the aromatic rings.
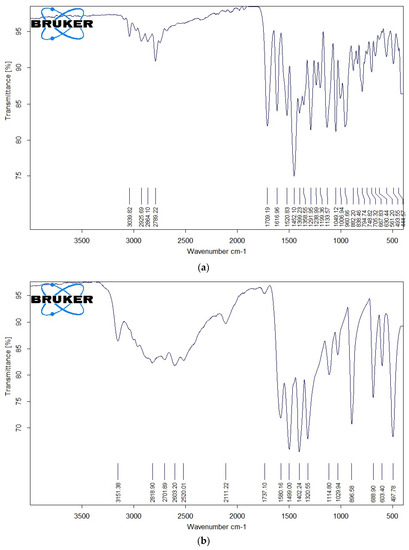
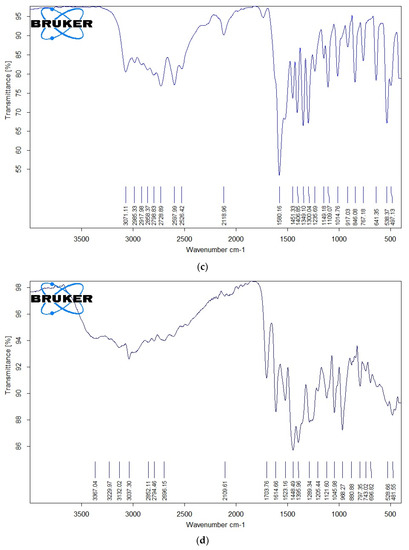
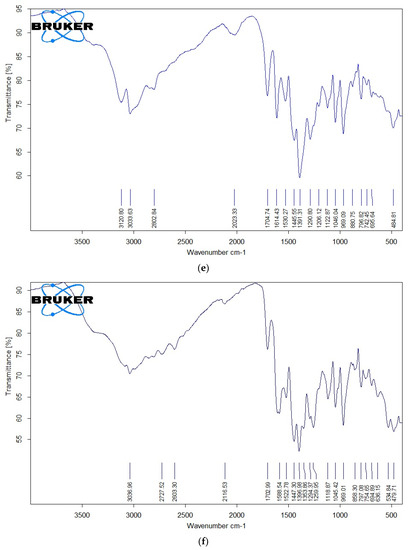
Figure 4.
(a) FTIR spectrum of free OFL drug; (b) IR spectrum of free Gly amino acid; (c) IR spectrum of free Ala amino acid; (d) IR spectrum of complex 1; (e) IR spectrum of complex 2; (f) IR spectrum of complex 3.
Table 3.
IR spectral bands (cm−1) of free OFL, Gly, Ala, and the synthesized complexes.
IR spectra of Complex 1, Complex 2, and Complex 3 are shown in Figure 4d–f. These IR spectra reflected the presence of stretching vibration motion from the ν(C=O)ketonic of the carboxyl group. This band was observed in the 1702–1705 cm−1 region and the other pyridine-4-one stretching vibration band ν(C=O) for the carbonyl group in the 1610−1615 cm−1 region [44]. As no changes were observed for the stretching vibrations ν(C=O) of the carbonyl groups for both carboxylic and pyridine-4-one moieties, these groups likely didn’t participate in the coordination step. New bands were observed at 480–485 cm−1 due to ν(Ru-N) stretching vibration motion [44]. The presence of these bands confirmed that the OFL ligand coordinated to the Ru(III) ions as a bidentate ligand via the nitrogen atoms of the piperazine ring.
Regarding the coordination of the Gly and Ala as secondary ligands, the IR spectra exhibited prominent bands related to the ν(COO−) and ν(NH2) frequencies. The ν(NH3) vibrations of free amino acids absorb in the ~3000–3100 cm−1 range. In metal complexes, the NH3 group is deprotonated and binds to metal ions via the neutral NH2 group. The transformation of NH3 to NH2 results in an upward shift in ν(NH2) vibrations compared to free amino acids [47,48]. Complex 2 and Complex 3 showed characteristic bands in the 3300–3000 cm−1 region due to the ν(NH2) vibrations, suggesting that the nitrogen of the amino group participated in the coordination with Ru(III) ions. The band shift Δν values (νCOOasym − νCOOsym) indicated that the carboxylate group in Gly and Ala were chelated in a monobasic bidentate (amino nitrogen and carboxylate oxygen) statement relative to the Ru(III) ions. The low-intensity bands observed in the IR spectra of the complexes within the 600–400 cm−1 range were due to ν(Ru–O) and ν(Ru–N) stretching vibrations [44,45]. IR measurements suggested that the OFL ligand acted as a neutral bidentate ligand with NN coordination sites that coordinated to the Ru(III) ions via the piperazine nitrogen atoms. Gly and Ala acted as uninegativebidentate ligands with NO donor sites that coordinated to the Ru(III) ions via their deprotonated carboxylic oxygen and amino group.
3.1.7. SEM, EDX, and XRD Data
The morphological and structural properties of Complex 1 and the mixed ligand Complex 2 and Complex 3 were characterized using SEM (Figure 5a–c). The structural morphology of Complex 2 and Complex 3 was homogenous and their particle sizes were within the nanometer range. In contrast, the particles of Complex 1 were irregularlyshaped and most were agglomerated. SEM analysis confirmed the nanostructure morphology of the synthesized complexes. The relative weights of the elements (ruthenium "Ru", oxygen "O", carbon "C", chlorine "Cl", and fluorine "F") present in the free OFL ligand and synthesized complexes were determined using EDX. Ru usually displays a strong peak within 2.558 keV. The EDX graph, shown in Figure 6a–c, contains a peak at 2.5 keV that confirms the presence of Ru in the three Ru(III)-OFL complexes. Peaks at 0.525, 0.277, 2.621, and 0.677 keV corresponding to O, C, Cl, and F were also observed and established these elements as essential components of the molecular formula of the synthesized complexes. Figure 7 contains the XRD patterns of Complex 1, Complex 2, and Complex 3. These data indicated that the complexes had different reflections with high phase purity, and the sharp peaks observed in these patterns were due to the nano-dimensional nature of the particles. The Debye–Scherrer equation [49] was used to calculate the particle sizes (D) of the complexes (Table 4). The particle sizes of Complex 1, Complex 2, and Complex 3 were 41, 43, and 45 nm, respectively. The synthesized complexes generated smaller particles—perhapsdue to the increase in OFL chelates around the Ru(III) ions [50]. The strain (ε) and dislocation density (δ) values for the synthesized complexes were determined [51] and these are also listed in Table 4. The synthesized complexes showed three XRD patterns at ~ 52°, 46°, and 32° due to the (101), (100), and (002) planes of Ru, respectively [52].
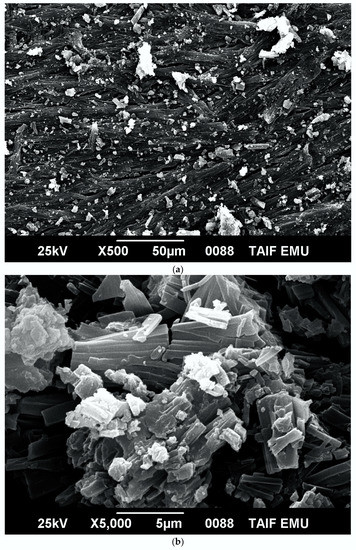
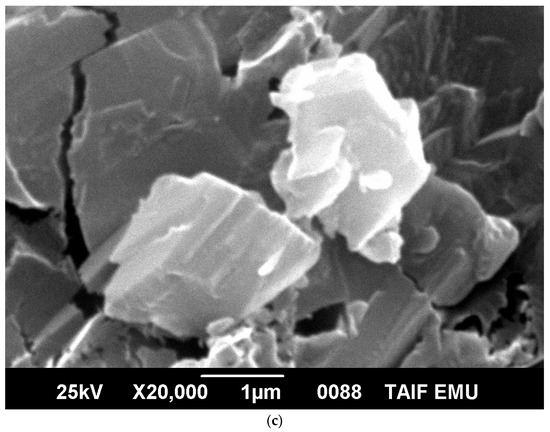
Figure 5.
(a) SEM micrograph of Complex 1; (b) SEM micrograph of Complex 2; (c) SEM micrograph of Complex 3.
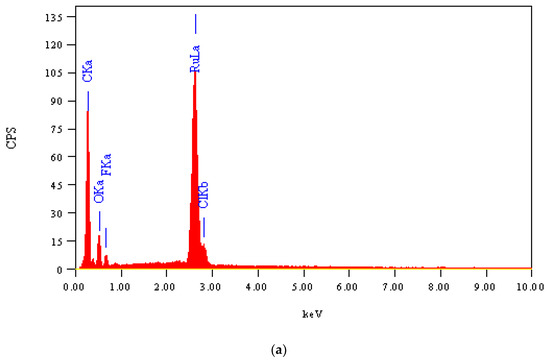
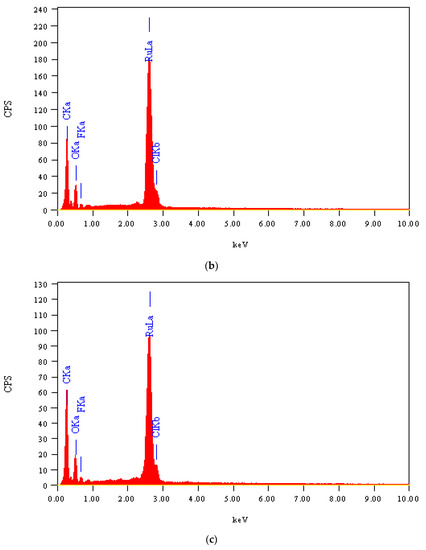
Figure 6.
(a) EDX spectrum of Complex 1; (b) EDX spectrum of Complex 2; (c) EDX spectrum of Complex 3.
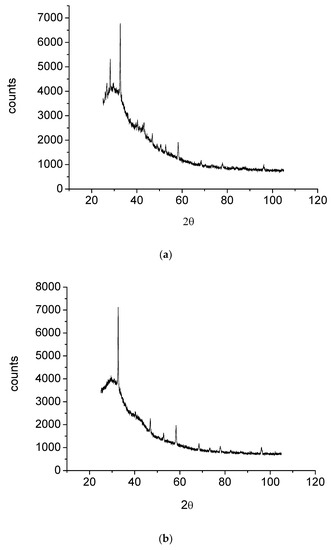
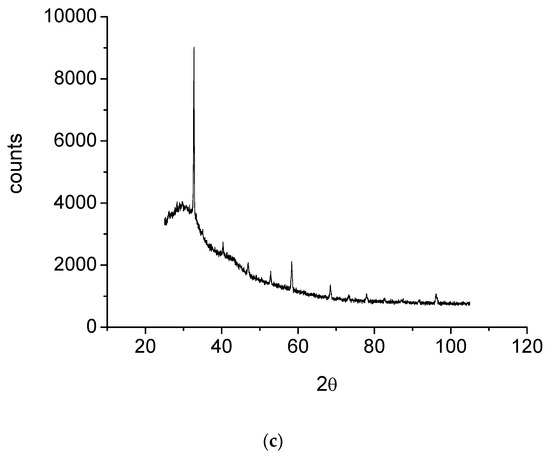
Figure 7.
(a) XRD diagram of Complex 1; (b) XRD diagram of Complex 2; (c) XRD diagram of Complex 3.
Table 4.
XRD spectral data for the synthesized complexes.
3.1.8. Thermal Analysis (TGA and DTG)
Figure 8a–c presents the TGA and DTG thermograms for free OFL and synthesized complexes and the thermal decomposition steps are listed in Table 5. The TG analyses of free OFL was performed from 25 to 1000 °C. The thermogram showed that, from 271 to 375 °C (DTGmax = 350°C), the weight loss was 31.50%, corresponding to the release of 1-methyl piperazine and a terminal methyl group. From 375 to 465 °C (DTGmax = 414°C), OFL lost its carboxylic group, with a total weight loss of 13.18% (calculated value: 12.45%). The third and final decomposition step occurred within the 465 to 1000 °C range (DTGmax = 603 °C); the total weight loss from this step was 55.32% (calculated value: 56.05%), which corresponded to the decomposition of OFL and release of the 8-fluoro-2,3-dihydro-1-oxa-3a-aza-phenalene-6-one organic moiety.
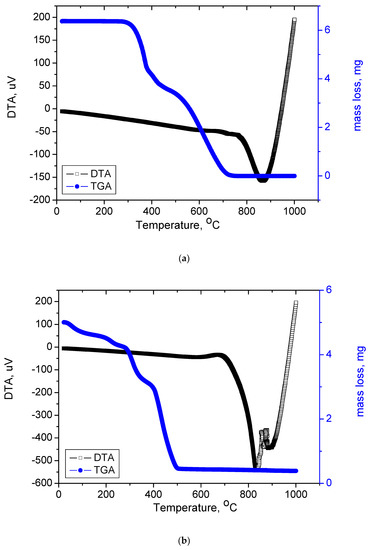
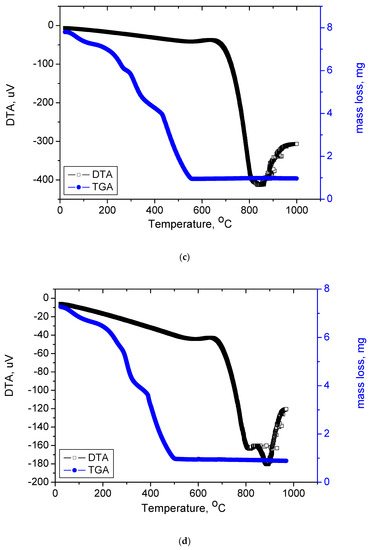
Figure 8.
(a) TGA and DTA curves of free OFL drug; (b) TGA and DTA curves of Complex1; (c)TGA and DTA curves of Complex 2; (d)TGA and DTA curves of Complex 3.
Table 5.
The maximum temperatures and corresponding weight losses for the decomposition steps of free OFL and the synthesized complexes.
Complex 1 was thermally decomposed in three main degradation steps. The first step occurred at a maximum temperature of 115 °C with a weight loss of 16.12% (theoretical 15.99%) due to the loss of two terminal methyl groups, two fluorine atoms, and two carboxyl groups (2CH3, 2F, 2COOH);as such, this result confirmed that the carboxyl group was far removed from the coordination of the Ru(III) metal ion. The DTGmaxof the second and third steps occurred at 328 and 420 °C, respectively. The weight loss corresponding to these steps was 74.52% due to the loss of two OFL molecules and three chlorine atoms, leaving Ru as the final product. Complex 2 was thermally degradedin four steps. The weight loss corresponding to the first step was 7.16% due to the removal of two coordinated water molecules and one terminal methyl group. The total weight loss from the second to fourth steps was 77.30% due to the removal of one OFL and Gly molecule and two chlorine atoms. Ru was the final residue (theoretical: 15.71%; found: 15.54%). The thermal decomposition of Complex 3 took place in four degradation steps. Coordinated water molecules and one terminal methyl group were lost in the first step with a total mass loss of 7.16%. The second to fourth steps represented a total weight loss of 78.05% with a DTGmax at 220 °C, corresponding to the loss of one OFL and Ala molecule and two chlorine atoms. Ru was the final residue (theoretical: 15.37%; found: 14.79%). From Figure 8a–c, the strong endothermic peaks in the 808–885 °C range with no associated weight loss were attributed to the formation of Ru nanostructures with changed physicochemical transformation states.
3.1.9. Kinetic Thermodynamics Data
The Horowitz and Metzger (HM) [53] and Coats and Redfern (CR) [54] methods were used to evaluate the kinetic parameters (E, ΔH*, ΔS*, and ΔG*) of the free OFL ligand and synthesized complexes. The HM and CR diagrams for the free OFL ligand and each complex are given in Figure 9a–d and the kinetic data are listed in Table 6. The high ∆G values of the synthesized complexes could be due to the structural rigidity of the remaining complex after the expulsion of one or more ligand [55]. The positive values for ∆H indicated that the decomposition process was endothermic, whereas the negative values for ∆S indicated that the reactions were slow and that the activated complex was more ordered than the reactants alone [56].
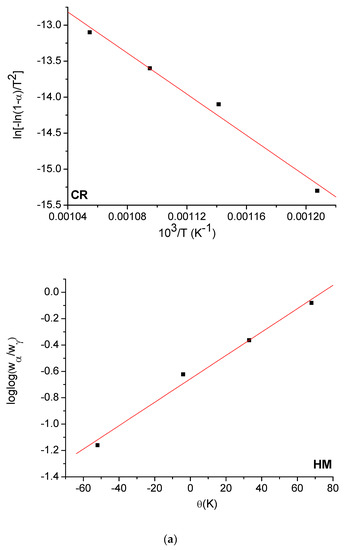
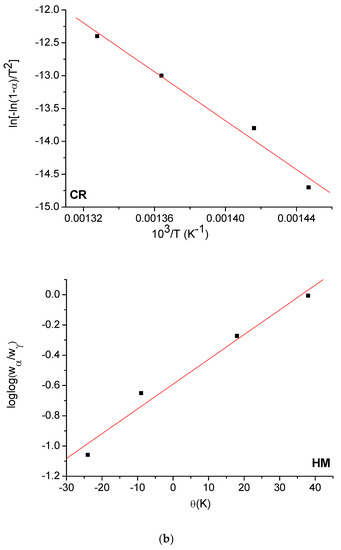
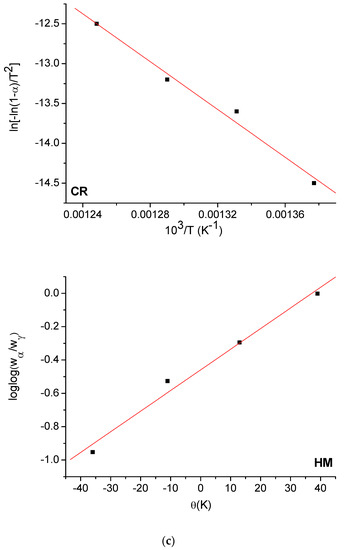
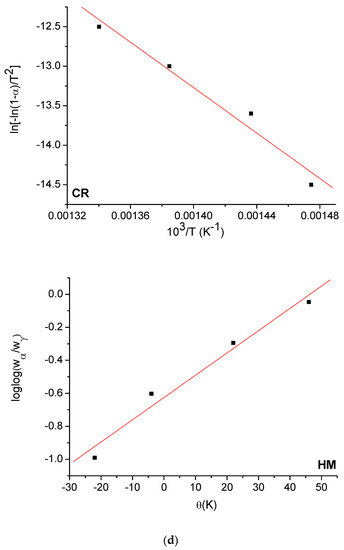
Figure 9.
(a) HM and CR curves of free OFL drug; (b) HM and CR curves of Complex 1; (c) HM and CR curves of Complex 2; (d) HM and CR curves of Complex 3.
Table 6.
Thermodynamic parameters of the thermal decomposition of free OFL and the synthesized complexes.
3.1.10. Molecular Modeling
Molecular modeling and quantum chemical studies of the free OFL ligand were helpful in confirming the proposed chemical structures of the synthesized metal complexes [57,58]. Conformational analyses and geometric optimizations were conducted at the semi-empirical PM3 level using the HyperChem 7.5 software [59] (Figure 10 and Table 7). The quantum chemical parameters of Mulliken electronegativity; χ, global softness; S, global hardness; η, global electrophilicity; ω, chemical potential; Pi, electronic charge; ΔNmax, absolute softness; σ, the lowest unoccupied molecular orbital energy; ELUMO, highest occupied molecular orbital energy; EHOMO, the difference between HOMO and LUMO energy levels; and ΔE were obtained using equations described in the literature [60,61,62,63,64] and are listed in Table 7. The high EHOMO value indicated that the OFL ligand behaved as a strong donator and its high ω value likely resulted from its high capacity to accept electrons. The negative values for both EHOMO and ELUMO were attributed to the stability of the synthesized complexes.
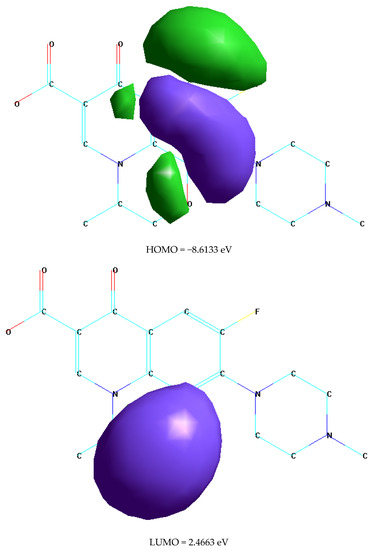
Figure 10.
HOMO and LUMO structure of free OFL ligand.
Table 7.
The quantum chemical parameters of free OFL ligand.
3.1.11. Antibacterial Activity
Herein, the antibacterial activity data are summarized in Table 8, a screening test for possible antibacterial activity was applied on the three synthesized compounds against four bacterial strains Klebsiella, Escherichia coli, Staphylococcus aureus, and Staphylococcus epidermidis. Using disc diffusion method [65] to test the antimicrobial effect. Inhibition zones diameters around the disc were determined. The increase of the zone of inhibition for metal complexes when compared with corresponding standard drugs (ceftriaxone and gentamycin) as shown in Table 8 is an indication that the metal complexes are able to decrease the population of bacterial species. It also an indication that the metal complexes are more effective than their corresponding ligand. The chelation increases the lipophilic nature of the central atom which subsequently favor its permeation through the lipid layer of the cell membrane [66]. The chelation theory account for the increased activities of the metal complexes. The chelation reduces considerably the polarity of the metal atom mainly because of the partial sharing of its positive charge with the donor group and possible p electron delocalisation within the whole chelating ring [67]. The result shows that the three complexes possess higher inhibitory activity against the bacterial species regarding Klebsiella and Escherichia coli.
Table 8.
Inhibition zone diameter of Ru(III) OFL complexes I–III against four bacterial strains.
Author Contributions
For research articles with several authors, a short paragraph specifying their individual contributions must be provided. The following statements should be used “Conceptualization, A.M.N., M.A.A.-O., A.A.A., A.J.O., M.A.B., N.S.A.-S., K.B., B.M.M., M.S.R. and A.M.A.A.; methodology, A.M.N., M.A.A.-O., K.B., B.M.M., M.S.R. and A.M.A.A.; software, A.M.N., M.A.A.-O., A.A.A., K.B., B.M.M., M.S.R. and A.M.A.A.; validation, A.M.N., M.A.A.-O., A.A.A., K.B., B.M.M., M.S.R. and A.M.A.A.; formal analysis, A.M.N., M.A.A.-O., K.B., B.M.M., M.S.R. and A.M.A.A.; investigation, A.M.N., M.A.A.-O., K.B., B.M.M., M.S.R. and A.M.A.A.; resources, A.M.N., M.A.A.-O., A.A.A., A.J.O., M.A.B., N.S.A.-S., K.B., B.M.M., M.S.R. and A.M.A.A.; data curation, A.M.N., M.A.A.-O., K.B., B.M.M., M.S.R. and A.M.A.A.; writing—original draft preparation, A.M.N., M.A.A.-O., A.A.A., K.B., B.M.M., M.S.R. and A.M.A.A.; writing—review and editing, A.M.N., M.A.A.-O., A.A.A., A.J.O., M.A.B., N.S.A.-S., K.B., B.M.M., M.S.R. and A.M.A.A.; visualization, A.M.N., K.B., B.M.M., M.S.R. and A.M.A.A.; supervision, A.M.N., M.A.A.-O., K.B., B.M.M., M.S.R. and A.M.A.A.; project administration, A.M.N., M.A.A.-O., A.A.A., N.S.A.-S., K.B., B.M.M., M.S.R. and A.M.A.A.; funding acquisition, A.M.N., M.A.A.-O., A.A.A., A.J.O., M.A.B., N.S.A.-S., K.B., B.M.M., M.S.R. and A.M.A.A. All authors have read and agreed to the published version of the manuscript.
Funding
The authors would like to extend their sincere appreciation to the Deanship of Scientific Research at King Saud University for its funding of this research through the Research Group No: RG-1436-015.
Conflicts of Interest
The authors declare no conflict of interest.
References
- Garey, K.W.; Amsden, G.W. Trovafloxacin: An Overview. Pharmacotherapy 1999, 19, 21–34. [Google Scholar] [CrossRef] [PubMed]
- Fitton, A. The Quinolones. Clin. Pharmacokinet. 1992, 22 (Suppl. 1), 1–11. [Google Scholar] [CrossRef] [PubMed]
- Stein, G.E. Pharmacokinetics and Pharmacodynamics of Newer Fluoroquinolones. Clin. Infect. Dis. 1996, 23 (Suppl. 1), S19–S24. [Google Scholar] [CrossRef] [PubMed]
- Norrby, S.R.; Lietman, P.S. Safety and tolerability of fluoroquinolones. Drugs 1993, 45 (Suppl. 3), 59–64. [Google Scholar] [CrossRef]
- King, D.E.; Malone, R.; Lilley, S.H. New classification and update on the quinolone antibiotics. Am. Fam. Physician 2000, 61, 2741–2748. [Google Scholar]
- Ruiz, M.; Ortiz, R.; Perello, L. Ni(II) and Zn(II) complexes with cinoxacin. Synthesis and characterization of M(Cx)2(DMSO)n(H2O)m (n=0, 2; m=2, 4). Crystal structures of [M(Cx)2(DMSO)2]·4H2O (M=Ni(II), Zn(II)). Inorg. Chim. Acta 1993, 211, 133–139. [Google Scholar] [CrossRef]
- Ruiz, M.; Ortiz, R.; Perello, L.; García-Granda, S.; Diaz, M.R. Synthesis and characterization of Cd(II) complexes of cinoxacin. Crystal structure of a dicadmium complex containing two monoatomic-bridging carboxylate oxygen atoms. Inorg. Chim. Acta 1994, 217, 149–154. [Google Scholar] [CrossRef]
- Ruiz, M.; Perello, L.; Ortiz, R.; Castineiras, A.; Maichle-Mossmer, C.; Canton, E. Synthesis, characterization, and crystal structure of [Cu(cinoxacinate)2] 2H2O complex: A square-planar CuO4chromophore. Antibacterial studies. J. Inorg. Biochem. 1995, 59, 801–810. [Google Scholar] [CrossRef]
- Ruiz, M.; Ortiz, R.; Perello, L.; Latorre, J.; Server-Carrio, J. Potentiometric and spectroscopic studies of transition-metal ions complexes with a quinolone derivative (cinoxacin). Crystal structures of new Cu(II) and Ni(II) cinoxacin complexes. J. Inorg. Biochem. 1997, 65, 87–96. [Google Scholar] [CrossRef]
- Ruiz, M.; Perello, L.; Server-Carrio, J.; Ortiz, R.; Garcia Granda, S.; Diaz, M.R.; Canton, E. Cinoxacin complexes with divalent metal ions. Spectroscopic characterization. Crystal structure of a new dinuclear Cd(II) complex having two chelate-bridging carboxylate groups. Antibacterial studies. J. Inorg. Biochem. 1998, 69, 231–239. [Google Scholar] [CrossRef]
- Macias, B.; Villa, M.V.; Rubio, I.; Castineiras, A.; Borras, J. Complexes of Ni(II) and Cu(II) with ofloxacin: Crystal structure of a new Cu(II) ofloxacin complex. J. Inorg. Biochem. 2001, 84, 163–170. [Google Scholar] [CrossRef]
- Li, Y.H.; Tang, Y.Z.; Huang, X.F.; Xiong, R.G. The Crystal Structure of a Gatifloxacin Complex and its Fluorescent Property. Z. Anorg. Allg. Chem. 2005, 631, 639–641. [Google Scholar] [CrossRef]
- Turel, I. The interactions of metal ions with quinolone antibacterial agents. Coord. Chem. Rev. 2002, 232, 27–47. [Google Scholar] [CrossRef]
- Efthimiadou, K.E.; Psomas, G.; Sanakis, Y.; Katsaros, N.; Karaliota, A. Metal complexes with the quinolone antibacterial agent N-propyl-norfloxacin: Synthesis, structure and bioactivity. J. Inorg. Biochem. 2007, 101, 525–535. [Google Scholar] [CrossRef]
- Efthimiadou, E.K.; Thomadaki, H.; Sanakis, Y.; Raptopoulou, C.P.; Katsaros, N.; Scorilas, A.; Karaliota, A.; Psomas, G. Structure and biological properties of the copper(II) complex with the quinolone antibacterial drug N-propyl-norfloxacin and 2,2′-bipyridine. J. Inorg. Biochem. 2007, 101, 64–73. [Google Scholar] [CrossRef]
- Psomas, G.; Tarushi, A.; Efthimiadou, E.K.; Sanakis, Y.; Raptopoulou, C.P.; Katsaros, N. Synthesis, structure and biological activity of copper(II) complexes with oxolinic acid. J. Inorg. Biochem. 2006, 100, 1764–1773. [Google Scholar] [CrossRef]
- Sunberg, R.J.; Martin, R.B. Interactions of histidine and other imidazole derivatives with transition metal ions in chemical and biological systems. Chem. Rev. 1974, 74, 471–517. [Google Scholar] [CrossRef]
- Ali, M.A.; Mirza, A.H.; Nazimuddin, M.; Dhar, P.K.; Butcher, R.J. Preparation, characterization and antifungal properties of nickel(II) complexes of tridentate ONS ligands derived from N-methyl-S-methyldithiocarbazate and the X-ray crystal structure of the [Ni(ONMeS)CN]·H2O complex. Trans. Met. Chem. 2002, 27, 27–33. [Google Scholar] [CrossRef]
- Agh-Atabay, N.M.; Dulger, B.; Gucin, F. Synthesis and investigation of antimicrobial activity of some bisbenzimidazole-derived chelating agents. Eur. J. Med. Chem. 2003, 38, 875–881. [Google Scholar] [CrossRef]
- Inoue, Y.; Hoshino, M.; Takahashi, H.; Noguchi, T.; Murata, T.; Kanzaki, Y.; Hamashima, H.; Sasatru, M. Bactericidal activity of Ag–zeolite mediated by reactive oxygen species under aerated conditions. J. Inorg. Biochem. 2002, 92, 37–42. [Google Scholar] [CrossRef]
- Castillo-Blum, S.E.; Barba-Behrens, N. Coordination chemistry of some biologically active ligands. Coord. Chem. Rev. 2000, 196, 3–30. [Google Scholar] [CrossRef]
- Patel, R.N.; Kumar, S.; Pandeya, K.B. Esr, visible and SOD studies of imidazolate bridged Cu2II,II, CuIIZnII and CuIINiII complexes with pentamethyldiethylenetriamine as capping ligand: A plausible model for superoxide dismutase. J. Inorg. Biochem. 2002, 9, 61–68. [Google Scholar] [CrossRef]
- Tavman, A.; Ülküseven, B.; Agh-Atabay, N.M. 1,2-Bis-(2-benzimidazolyl)-1,2-ethanediol and 1,4-bis-(2-benzimidazolyl)-1,2,3,4-butanetetraol PdCl2 complexes. Transit. Met. Chem. 2000, 25, 324–328. [Google Scholar] [CrossRef]
- Patel, M.N.; Joshi, H.N.; Patel, C.R. Cytotoxic, DNA binding, DNA cleavage and antibacterial studies of ruthenium–fluoroquinolone complexes. J. Chem. Sci. 2014, 126, 739–749. [Google Scholar] [CrossRef]
- Efthimiadou, E.K.; Katsaros, N.; Karaliota, A.; Psomas, G. Mononuclear copper(II) complexes with quinolones and nitrogen-donor heterocyclic ligands: Synthesis, characterization, biological activity and interaction with DNA. Inorg. Chim. Acta 2007, 360, 4093–4102. [Google Scholar] [CrossRef]
- Skrzypek, D.; Szymanska, B.; Kovala-Demertzi, D.; Wiecek, J.; Talik, E.; Demertzis, M.A. Synthesis and spectroscopic studies of iron (III) complex with a quinolone family member (pipemidic acid). J. Phys. Chem. Solids 2006, 67, 2550–2558. [Google Scholar] [CrossRef]
- Shaikh, A.R.; Giridhar, R.; Megraud, F.; Yadav, M.R. Metaloantibiotici: Sinteza, karakterizacija i antimikrobno djelovanje kompleksa fluorokinolona s bizmutom na Helicobacter pylori. Acta Pharm. 2009, 59, 259–271. [Google Scholar] [CrossRef]
- Al-Khodir, F.A.I.; Refat, M.S. Spectroscopic Elaboration and Structural Characterizations of New Fe(III), Pd(II), and Au(III) Ampicillin Complexes: Metal-Antibiotic Ligational Behaviors. J. Pharm. Innov. 2015, 10, 335–347. [Google Scholar] [CrossRef]
- Al-Khodir, F.A.I.; Refat, M.S. Synthesis, structural characterization and biological studies of some nalidixic acid–metal complexes: Metalloantibiotic complexes of some divalent and trivalent metal ions. J. Mol. Struct. 2015, 1094, 22–35. [Google Scholar] [CrossRef]
- Turel, I.; Bukovec, N.; Farkas, E. Complex formation between some metals and a quinolone family member (ciprofloxacin). Polyhedron 1996, 15, 269–275. [Google Scholar] [CrossRef]
- Domagala, J.M.; Hanna, L.D.; Heifetz, C.L.; Hutt, M.P.; Mich, T.F.; Sanchez, J.P.; Solomon, M. New structure-activity relationships of the quinolone antibacterials using the target enzyme. The development and application of a DNA gyrase assay. J. Med. Chem. 1986, 29, 394–404. [Google Scholar] [CrossRef]
- Shen, L.L.; Mitscher, L.A.; Sharma, P.N.; O’Donnell, T.J.; Chu, D.W.T.; Cooper, C.S.; Rosen, T.; Pernet, A.G. Mechanism of inhibition of DNA gyrase by quinolone antibacterials: A cooperative drug-DNA binding model. Biochemistry 1989, 28, 3886–3894. [Google Scholar] [CrossRef] [PubMed]
- Refat, M.S.; Mohamed, S.F. Spectroscopic, thermal and antitumor investigations of sulfasalazine drug in situ complexation with alkaline earth metal ions. Spectrochim. Acta A 2011, 82, 108–117. [Google Scholar] [CrossRef] [PubMed]
- Refat, M.S. Spectroscopic and thermal degradation behavior of Cr(III), Mn(II), Fe(III), Co(II), Ni(II), Cu(II) and Zn(II) complexes with thiopental sodium anesthesia drug. J. Mol. Struct. 2013, 1037, 170–185. [Google Scholar] [CrossRef]
- Siji, V.L.; Kumar, M.R.S.; Suma, S.; Prathapachandra Kurup, M.R. Synthesis, characterization and physiochemical information, along with antimicrobial studies of some metal complexes derived from an ON donor semicarbazone ligand. Spectrochim. Acta A 2010, 76, 22–28. [Google Scholar] [CrossRef]
- Beteringhe, A.; Racuciu, C.; Balan, C.; Stoican, E.; Patron, L. Molecular Docking Studies Involving Transitional Metal Complexes (Zn(II), Co(II), Cu(II), Fe(II), Ni(II) with Cholic Acid (AC) as Ligand against Aurora A Kinase. Adv. Mater. Res. 2013, 787, 236–240. [Google Scholar] [CrossRef]
- Venkatachalam, G.; Maheswaran, S.; Ramesh, R. Synthesis, spectra, redox property and catalytic activity of ruthenium(III) Schiff base complexes. Indian J. Chem. 2005, 44, 705–709. [Google Scholar]
- Tanabe, Y.; Sugano, S. On the Absorption Spectra of Complex Ions II. J. Phys. Soc. 1954, 9, 766–779. [Google Scholar] [CrossRef]
- Usha; Chandra, S. Pd(II), Pt(II), Rh(III), Ir(III) and Ru(III) Complexes of n-Pentyl and n-Hexyl Ketone Thiosemicarbazones. Synth. React. Inorg. Met.-Org. Chem. 1992, 22, 1565–1579. [Google Scholar] [CrossRef]
- Lever, A.B. Inorganic Electronic Spectroscopy; Elsevier: Amsterdam, The Netherlands, 1968. [Google Scholar]
- El-Saied, F.A.; El-Bahnasawy, R.M.; Abdel-Azeem, M.; El-Sawaf, A.K. Synthesis, characterization and electrochemical properties of β-diketone complexes of ruthenium(III). Polyhedron 1994, 13, 1781–1786. [Google Scholar] [CrossRef]
- Figgis, B.N. Introduction to Ligand Field Theory, 1st ed.; Interscience Publishers: New York, NY, USA, 1966. [Google Scholar]
- Vieira, L.M.M.; de Almeida, M.V.; Lourenço, M.C.S.; Bezerra, F.A.F.M.; Fontes, A.P.S. Synthesis and antitubercular activity of palladium and platinum complexes with fluoroquinolones. Eur. J. Med. Chem. 2009, 44, 4107–4111. [Google Scholar] [CrossRef] [PubMed]
- Nakamoto, K. Infrared Spectra of Inorganic and Coordination Compounds, 2nd ed.; Wiley Interscience, John Wiley & Sons: New York, NY, USA, 1970. [Google Scholar]
- Bellamy, L.J. The Infrared Spectra of Complex Molecules; Chapman and Hall: London, UK, 1975. [Google Scholar]
- Gouvea, L.R.; Garcia, L.S.; Lachter, D.R.; Nunes, P.R.; de Castro Pereira, F.; Silveira-Lacerda, E.P.; Louro, S.R.W.; Barbeira, P.J.S.; Teixeira, L.R. Atypical fluoroquinolone gold(III) chelates as potential anticancer agents: Relevance of DNA and protein interactions for their mechanism of action. Eur. J. Med. Chem. 2012, 55, 67–73. [Google Scholar] [CrossRef] [PubMed]
- Kasselouri, S.; Hadjiliadis, N. Interaction of cis-Pd(guo)2Cl2 with amino acids. Inorg. Chim. Acta 1990, 168, 15–26. [Google Scholar] [CrossRef]
- Deacon, G.B.; Phillips, R. Relationships between the carbon-oxygen stretching frequencies of carboxylato complexes and the type of carboxylate coordination. Coord. Chem. Rev. 1980, 33, 227–250. [Google Scholar] [CrossRef]
- Cullity, B.D. Elements of X-ray Diffraction; Addison-Wesley: Reading, MA, USA, 1972. [Google Scholar]
- Salavati-Niasari, M.; Mohandes, F.; Davar, F.; Mazaheri, M.; Monemzadeh, M.; Yavarinia, N. Preparation of NiO nanoparticles from metal-organic frameworks via a solid-state decomposition route. Inorg. Chim. Acta 2009, 362, 3691–3697. [Google Scholar] [CrossRef]
- Velumani, S.; Mathew, X.; Sebastian, P.J. Structural and optical characterization of hot wall deposited CdSexTe1−x films. Sol. Energy Mater. Sol. Cells 2003, 76, 359–368. [Google Scholar] [CrossRef]
- Singh, J.P.; Karabacak, T.; Morrow, P.; Pimanpang, S.; Lu, T.-M.; Wang, G.-C. Preferred Orientation in Ru Nanocolumns Induced by Residual Oxygen. J. Nanosci. Nanotechnol. 2007, 7, 2192–2196. [Google Scholar] [CrossRef]
- Horowitz, H.H.; Metzger, G. A New Analysis of Thermogravimetric Traces. Anal. Chem. 1963, 35, 1464–1468. [Google Scholar] [CrossRef]
- Coats, A.W.; Redfern, J.P. Kinetic Parameters from Thermogravimetric Data. Nature 1964, 201, 68–69. [Google Scholar] [CrossRef]
- Yusuff, K.K.M.; Sreekala, R. Thermal and spectral studies of 1-benzyl-2-phenylbenzimidazole complexes of cobalt(II). Thermochim. Acta 1990, 159, 357–368. [Google Scholar] [CrossRef]
- Frost, A.A.; Peasron, R.G. Kinetics and Mechanism; Wiley: New York, NY, USA, 1961. [Google Scholar]
- Yousef, T.A.; Abu El-Reash, G.M.; ElMorshedy, R.M. Structural, spectral analysis and DNA studies of heterocyclic thiosemicarbazone ligand and its Cr(III), Fe(III), Co(II) Hg(II), and U(VI) complexes. J. Mol. Struct. 2013, 1045, 145–159. [Google Scholar] [CrossRef]
- Helal, M.H.; El-Awdan, S.A.; Salem, M.A.; Abd-elaziz, T.A.; Moahamed, Y.A.; El-Sherif, A.A.; Mohamed, G.A.M. Synthesis, biological evaluation and molecular modeling of novel series of pyridine derivatives as anticancer, anti-inflammatory and analgesic agents. Spectrochim. Acta Part A 2015, 135, 764–773. [Google Scholar] [CrossRef] [PubMed]
- HyperChem, Version 7.51; Hypercube, Inc.: Gainesville, FL, USA, 2002.
- Pearson, R.G. Absolute electronegativity and hardness: Applications to organic chemistry. J. Org. Chem. 1989, 54, 1423–1430. [Google Scholar] [CrossRef]
- Geerlings, P.; De Proft, F.; Langenaeker, W. Conceptual Density Functional Theory. Chem. Rev. 2003, 103, 1793–1874. [Google Scholar] [CrossRef]
- Parr, R.G. Electrophilicity Index. J. Am. Chem. Soc. 1999, 121, 1922–1924. [Google Scholar] [CrossRef]
- Chattaraj, P.K.; Giri, S. Stability, Reactivity, and Aromaticity of Compounds of a Multivalent Superatom. J. Phys. Chem. A 2007, 111, 11116–11121. [Google Scholar] [CrossRef]
- Speie, G.; Csihony, J.; Whalen, A.M.; Pie-Pont, C.G. Studies on Aerobic Reactions of Ammonia/3,5-Di-tert-butylcatechol Schiff-Base Condensation Products with Copper, Copper(I), and Copper(II). Strong Copper(II)−Radical Ferromagnetic Exchange and Observations on a Unique N−N Coupling Reaction. Inorg. Chem. 1996, 35, 3519–3524. [Google Scholar] [CrossRef]
- Bauer, A.W. Antibiotic susceptibility testing by a standardized single disc method. Am. J. Clin. Pathol. 1966, 45, 149–158. [Google Scholar] [CrossRef]
- Chaudhary, A.S.; Swaroop, R.; Singh, R. Tetraazamacrocyclic Complexes of Tin(II): Synthesis Spectroscopy and Biological screening. Bol. Soc. Chil. Quim. 2002, 47, 203–211. [Google Scholar] [CrossRef]
- Fahmi, N.; Jadon, S.C.S.; Singh, R.V. Biochemical studies on biologically active thio-ligands benzothiazolines and their manganese(II) complexes. Phosphorus Sulfur Silicon Relat. Elem. 1993, 81, 133–140. [Google Scholar] [CrossRef]
© 2020 by the authors. Licensee MDPI, Basel, Switzerland. This article is an open access article distributed under the terms and conditions of the Creative Commons Attribution (CC BY) license (http://creativecommons.org/licenses/by/4.0/).