Article

Raman Spectra of Diphenylalanine Microtubes: Polarisation and Temperature Effects

1
Kirensky Institute of Physics, Federal Research Center KSC SB RAS, 660036 Krasnoyarsk, Russia
2
Department of Physics & CICECO Materials Institute of Aveiro, University of Aveiro, 3810-193 Aveiro, Portugal
3
Moscow Institute of Physics and Technology, 141700 Dolgoprudny, Russia
4
Department of Physics Engineering, Istanbul Technical University, Maslak, Istanbul 34469, Turkey
5
Institute of Natural Sciences and Mathematics, Ural Federal University, 620026 Ekaterinburg, Russia
6
Siberian Federal University, 660041 Krasnoyarsk, Russia
*
Author to whom correspondence should be addressed.
Crystals 2020, 10(3), 224; https://doi.org/10.3390/cryst10030224
Submission received: 14 February 2020 / Revised: 6 March 2020 / Accepted: 17 March 2020 / Published: 20 March 2020
(This article belongs to the Special Issue Raman Spectroscopy of Crystals)

Abstract

:
Diphenylalanine microtubes have remarkable physical properties that allow one to use them in electronics. In this work, we measured polarised temperature-dependent Raman spectra in self-assembled diphenylalanine microtubes grown from the solution. We observed the anomalous temperature behaviour of the Raman lines. Their temperature changes were minimal, which required a significant improvement in the resolution and stability of Raman measurements. The anomalies in the behaviour of the spectra at about 178 K, 235 K, 255 K, 278 K, 296 K, 398 K and 412 K were observed. The structural phase transition at 398 K is irreversible. This transition is associated with the release of water molecules from nanochannels. The irreversible phase transition has a temperature range of about 10 K.

1. Introduction

Peptides attract the attention of researchers due to their biocompatibility, as well as unique biological and physical properties. The smallest aromatic peptide sequence is diphenylalanine ( C 18 H 20 N 2 O 3 ). Diphenylalanine organizes itself, forming derivatives dipeptide nanostructures, including tubes, spheres, plates and hydrogels [1]. Such structures have excellent chemical stability and significant rigidity at the nanoscale [2]. Peptide microtubes have remarkable properties that allow to use them as the main element of nanoelectronics. For example, the piezo- and pyroelectric effects [1,2,3,4] were observed in diphenylalanine. Researchers are also attracted to materials with exciting new properties that are created by compressing peptide microtubes [5,6]. This material is already in use for creating piezoresonators, micro sensors, and batteries [7,8,9]. The temperature stability of the piezoelectric coefficient d 15 was previously studied. It is shown that in the temperature range from 20 to 20 C, the changes in the piezoelectric coefficient are reversible. An irreversible decrease in the piezoelectric coefficient occurs when the temperature rises above 120 C [10]. The investigation of the temperature dependence of the pyroelectric current in diphenylalanine at the temperature of about 45–50 C and following cooling showed almost reversible behaviour of the pyroelectric current. On the contrary, at higher maximum temperature achieved within the temperature cycle, the irreversible behaviour of the pyroelectric current amplitude is noted [4]. The investigation of temperature-driven phase transformation in self-assembled diphenylalanine peptide microtubes irreversible phase transition into another phase at about 140–150 C has been carried out by the optical second harmonic generation and local piezoresponse [11]. The previously studied changes in the physical properties of diphenylalanine with temperature change are obviously associated with structural changes. The diphenylalanine microtube is a complex compound. Therefore, the polarisation studies using Raman spectroscopy can bring the most significant contribution to the study [12,13]. Particular attention should be paid to the low-frequency region. Research on low frequencies in organic compounds can lead to exciting results [14,15,16]. The aim of this work is a systematical investigation of the polarisation and temperature effects in a diphenylalanine single microtube by Raman spectroscopy.

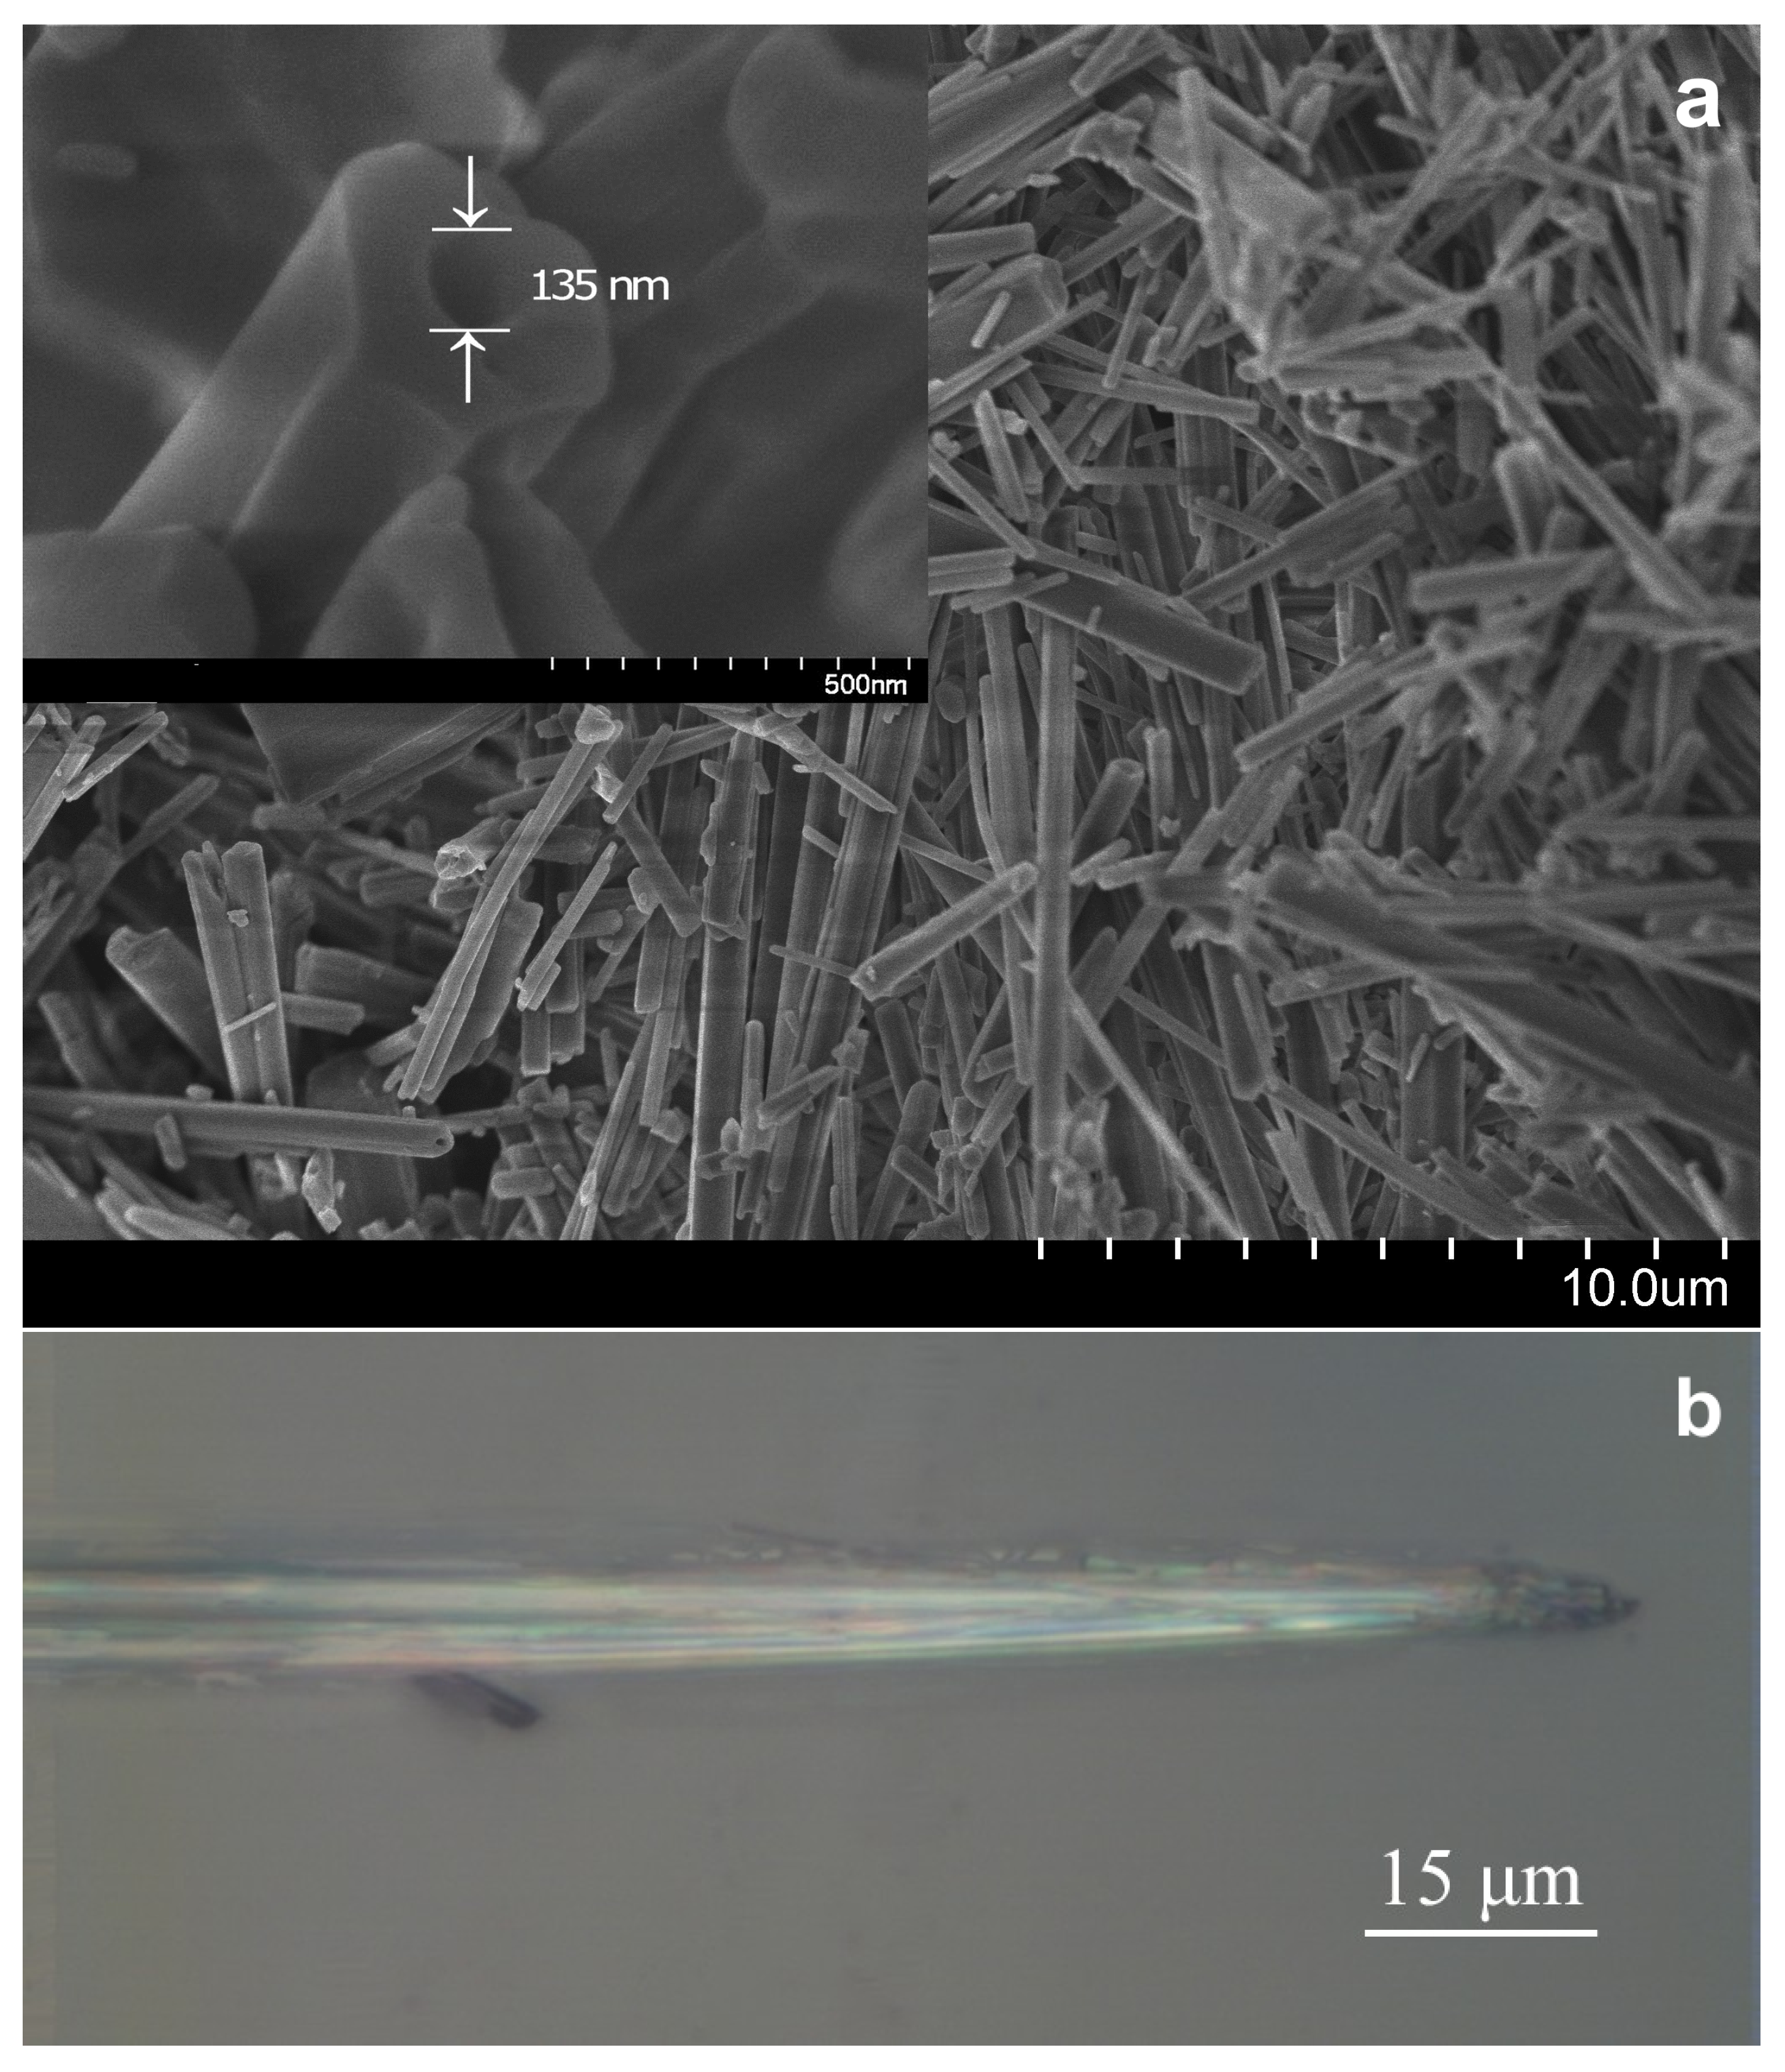
2. Materials and Methods

The solvent 1,1,1,3,3,3-hexafluoro-2-propanol (HFP) was purchased from Sigma-Aldrich and the lyophilized form of the D-diphenylalanine dipeptide (H-D–Phe–D–Phe-OH, FF) was purchased from Bachem. Fresh peptide solution was prepared by dissolving the peptide powder in HFP at a concentration of 100 mg/mL. Fresh stock solutions were prepared before each test to avoid any preliminary aggregation. Polytetrafluoroethylene substrates were washed with ethanol and then with water in an ultrasonic bath for 10 min. Two microliters of the initial FF solution was applied to the substrate, and then 98 μ L of water was added. The total volume was 100 μ L. The drops were dried at room temperature for one day.
Typical dimensions of the microtubes ranged from 1 to 5 μ m in diameter and from 100 to 1000 μ m in length [17]. The size of a single FF microtube at room temperature experiment was about 50 μ m length and diameter 1.5 μ m. For temperature investigation of polarised Raman spectra, we used bigger size microtube, our choice was related to the need for stronger Raman signal due to smaller numerical aperture of the microobjective and consequently bigger scattering volume. Microtubes of various sizes and typically hexagonal shape were revealed by scanning electron microscopy (SEM) micrographs (see Figure A1).
Raman spectra in the backscattering geometry were recorded with a Horiba Jobin Yvon T64000 triple spectrometer equipped with a liquid nitrogen-cooled charge-coupled device detection system in subtractive and additive dispersion modes. The single microtube was attached to a steel pin and could be oriented relative to the excitation laser beam. The z axis coincides with the microtube long axis. Ar + ion laser Spectra-Physics Stabilite 2017 with λ = 514.5 nm and power 0.3 mW on a sample was used as an excitation light source. The microscope system based on Olympus BX-41 microscope with an Olympus MPlan 100 x objective lens f = 0.8 mm with numerical aperture N.A. = 0.9 and LMPlanFl 50 x objective lens f = 10.2 mm with numerical aperture N.A. = 0.5 for room temperature and low temperatures, respectively, were used to measure polarised Raman spectra at single microtube. The laser beam was focused in a spot of 3 μ m diameter. Temperature-dependent polarised Raman spectra were carried out with a Lincam TMS-94-controlled THMS-600 microcryostat in the temperature range 80–330 K. The excitation laser power was adjusted to avoid the sample’s heating.
Low temperature measurements of unpolarized Raman spectra were carried out with a closed cycle ARS CS204-X1.SS helium cryostat in the temperature range 10–420 K. A number of microtubes with arbitrary orientation of long axes was put into a plate about 100 μ m thick and warped by indium foil as a thermally conductive material for measurements unpolarized Raman spectra. Ar + ion laser Spectra-Physics Stabilite 2017 with λ = 514.5 nm and power 5 mW on a sample was used as an excitation light source. The laser beam was focused in a spot with a diameter of 150 μ m. Throughout measurements, a focused laser spot scanned the sample along a line 300 μ m. The spectra were acquired at the temperature step 0.6 K [18]. The temperature was monitored by the LakeShore DT-6SD1.4L calibrated silicon diode. During experiments, the cryostat was evacuated to 10 6 mbar. Spectroscopic measurements were performed in the subtractive dispersion mode, which attained a low-wavenumber limit of 10 cm 1 in the present setup. Our experiments required measurements of the Raman lines positions with high accuracy. The deformation of the low-wavenumber spectral edge by an optical slit, which sometimes smears the true features of low-wavenumber spectra, was carefully eliminated by rigorous optical alignment. All spectra have been corrected in the wavenumber using an external neon lamp source as a reference spectrum. This could help to eliminate errors associated with the spectrometers deformation due to small changes (less than 0.1 K) in temperature of the room for high-precision wavenumber measurements. CCD pixel coverage in additive dispersion mode was as fine as 0.1 cm 1 , but it was limited by the spectrometer spectral resolution of 0.6 cm 1 . The error was determined by measuring Raman spectra one after another during several hours at a constant temperature. The result of the fitted parameters of line 1002 cm 1 and calculated measurement error at 15 K is shown in Figure A2.

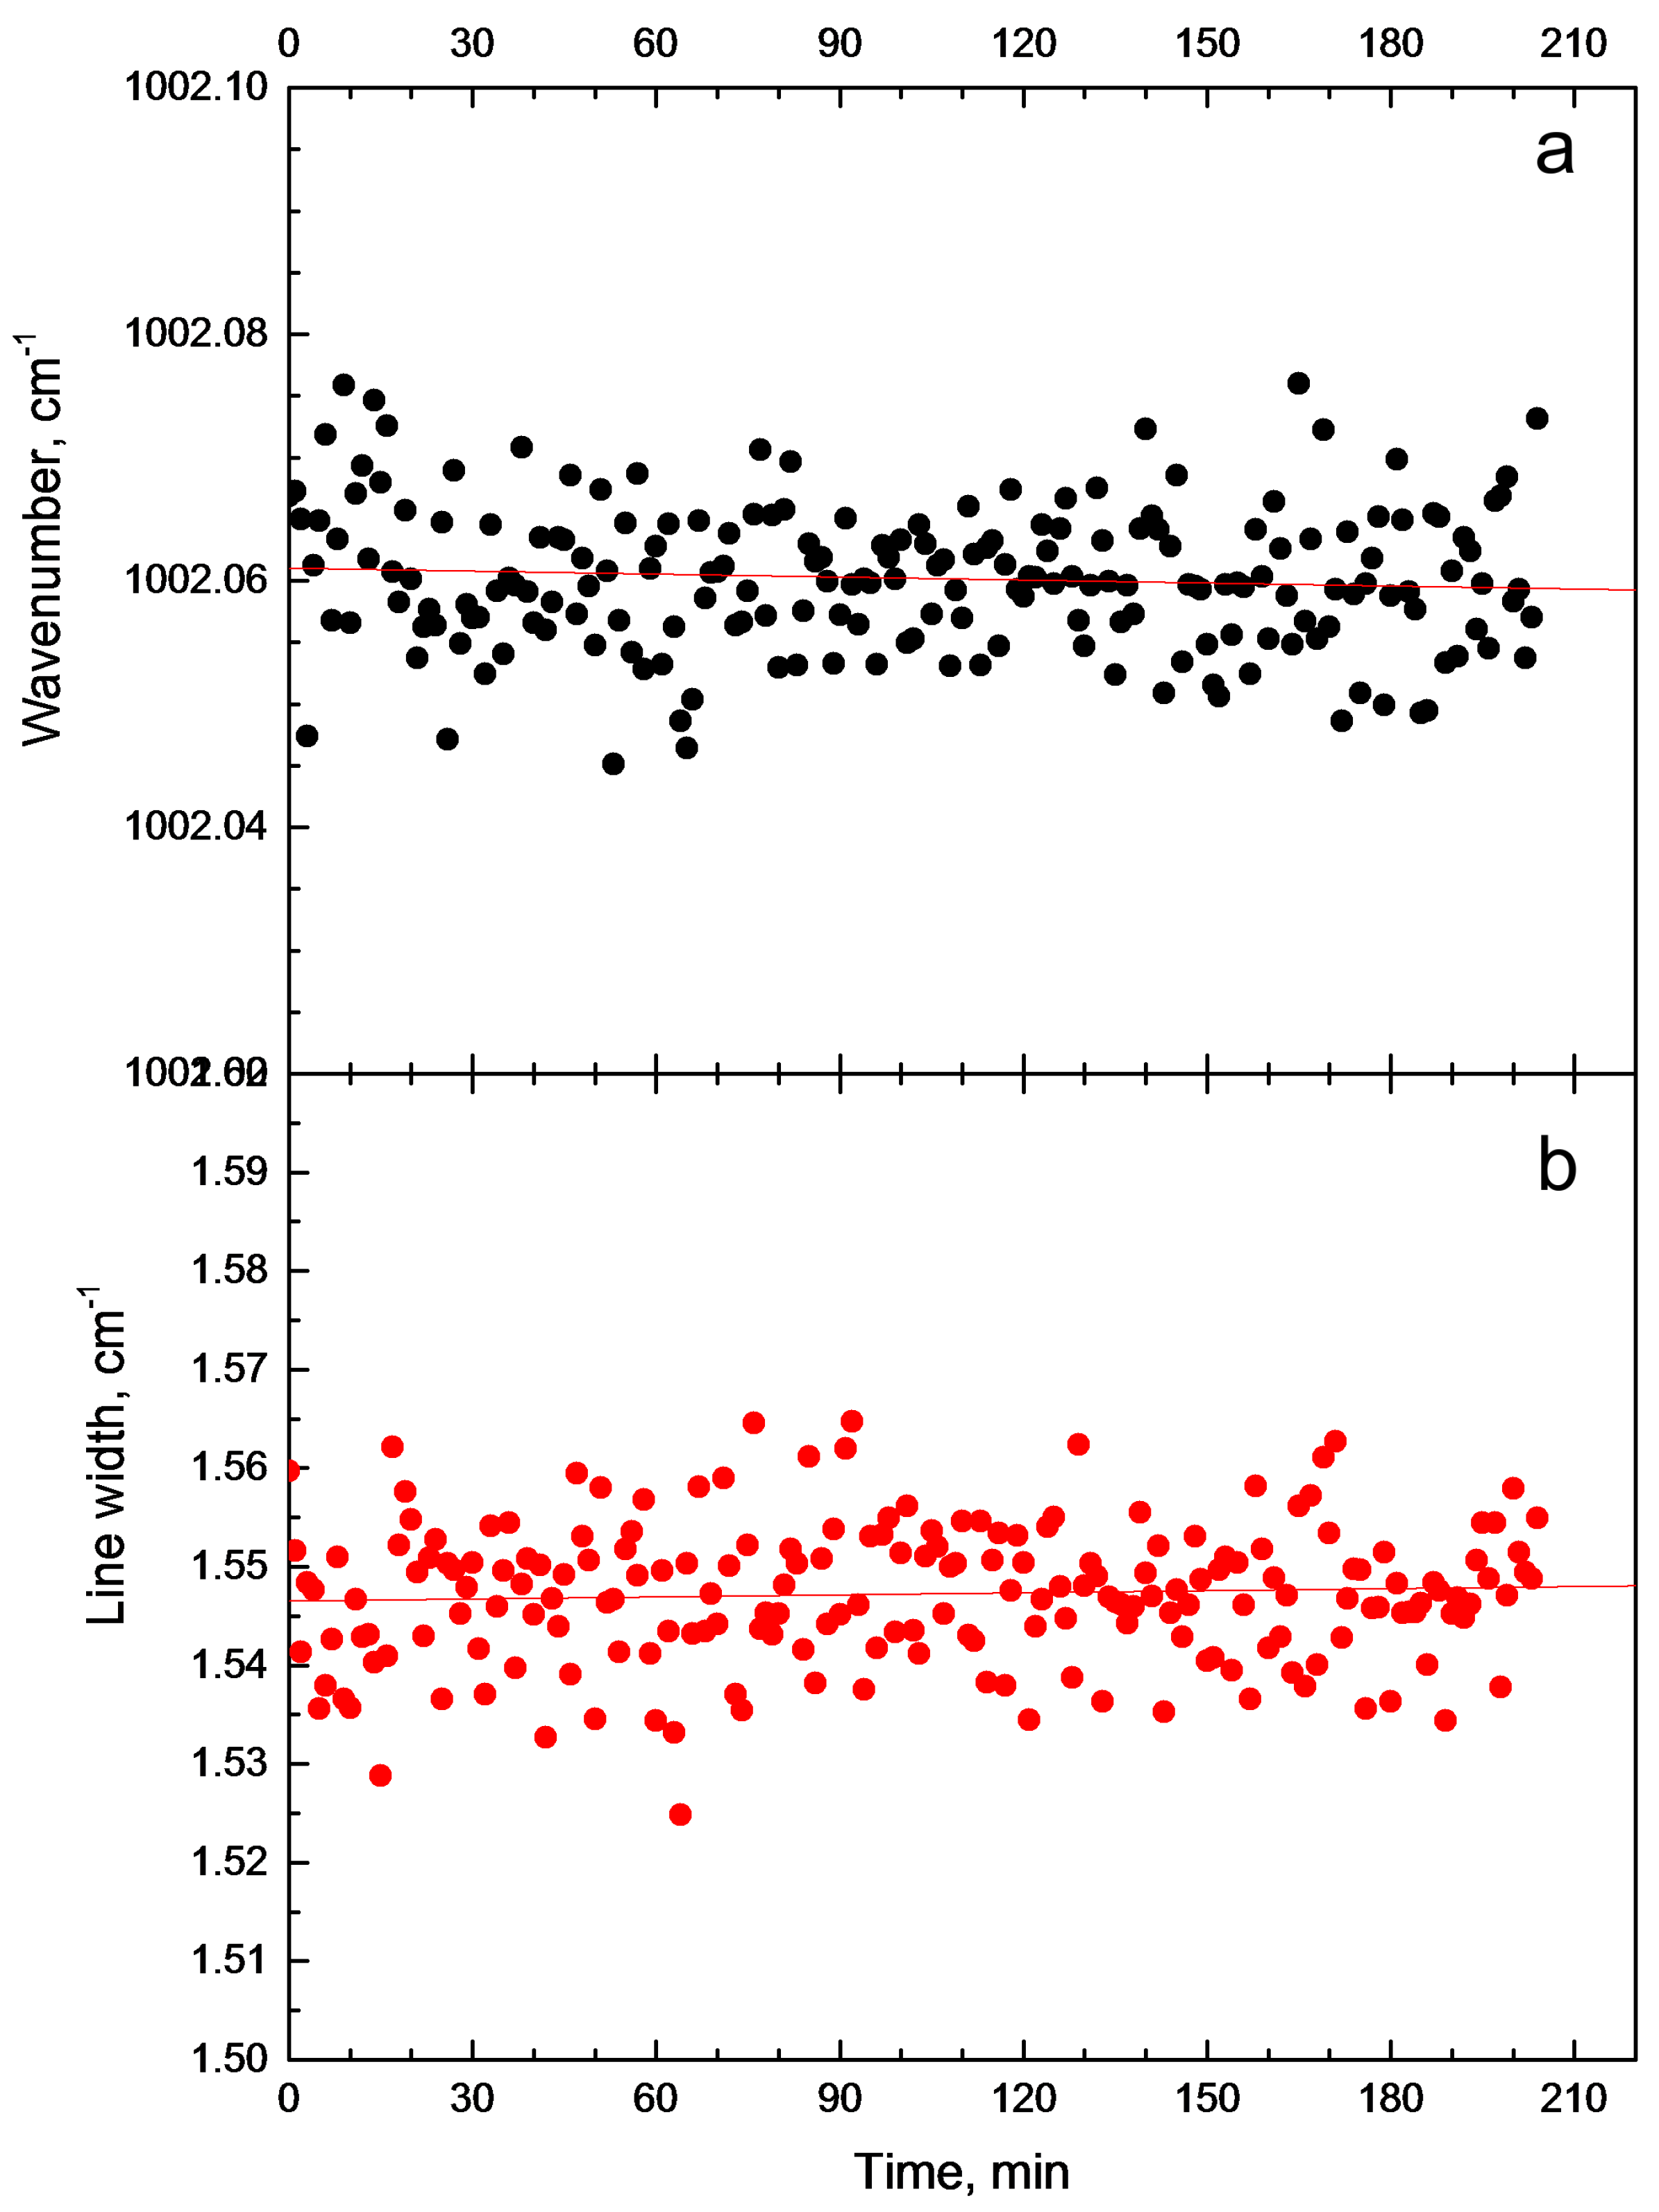
3. Results and Discussion

Self-assembled diphenylalanine-based peptide nanotubes belong to the space group P 6 1 . The unit cell includes six FF molecules with 43 atoms in each molecule [19]. The atoms are located in the 6a Wyckoff positions. The hexagonal unit cell of FF microtube are shown in Figure 1.
Therefore, the Raman, infrared (IR) and acoustic mode representations at Brillouin zone center are as follows:
Γ R a m a n = 128 A + 129 1 E 2 + 129 2 E 2 + 128 1 E 1 + 128 2 E 1 ,
Γ I R = 128 A + 128 1 E 1 + 128 2 E 1 ,
Γ a c = A + 1 E 1 + 2 E 1 .
1 E 1 , 2 E 1 and 1 E 2 , 2 E 2 are the complex conjugate representations for longitudinal and transversal modes. This implies that two peaks are expected to be observed in the spectrum due to the splitting. In other cases, only one peak has to be seen. In total, 385 lines are expected in the Raman spectrum.
Z-axis is along the tube, whereas x and y axes are oriented perpendicular to the tube (Figure 2).
We use Porto‘s notation [20]. It is a traditional way to indicate the configuration of the Raman scattering experiment. This notation expresses the orientation of the crystal with respect to the polarisation of the laser in both the excitation and analysing directions. The notation of Porto, for Raman scattering processes, consists of four letters: A(BC)D. A is the direction of the propagation of the incident light. B is the direction of the polarisation of the incident light. C is the direction of the polarisation of the scattered light. D is the direction of the propagation of the scattered light.
The expected Raman tensors are presented in Table A1. Depending on the polarisation of the incident and scattered light, fewer Raman lines should be observed for each configuration. Selection rules for backscattering geometries are presented in Table A2. The geometries used in this article are highlighted in bold. Selection rules for right-angle geometries are presented in Table A3.
Figure 3 represents the full Raman spectra at 14 and 345 K. The spectrum can be subdivided into three distinct regions, corresponding to the vibrations of constituting structural elements: (i) 10–280 cm 1 that is due to lattice vibrations, (ii) 280–1800 cm 1 vibrations of molecules’ functional groups: lines at 1002 and 1032 cm 1 due to phenyl rings vibration, (iii) 2800–3350 cm 1 is a region of C−H, and N−H vibrational modes (Figure 3).
Table 1 presents the positions of the lines found by us at 293 K. In this table, a comparison is made with previously observed positions [21,22,23,24,25,26,27,28], and the interpretation of vibrations is also included.

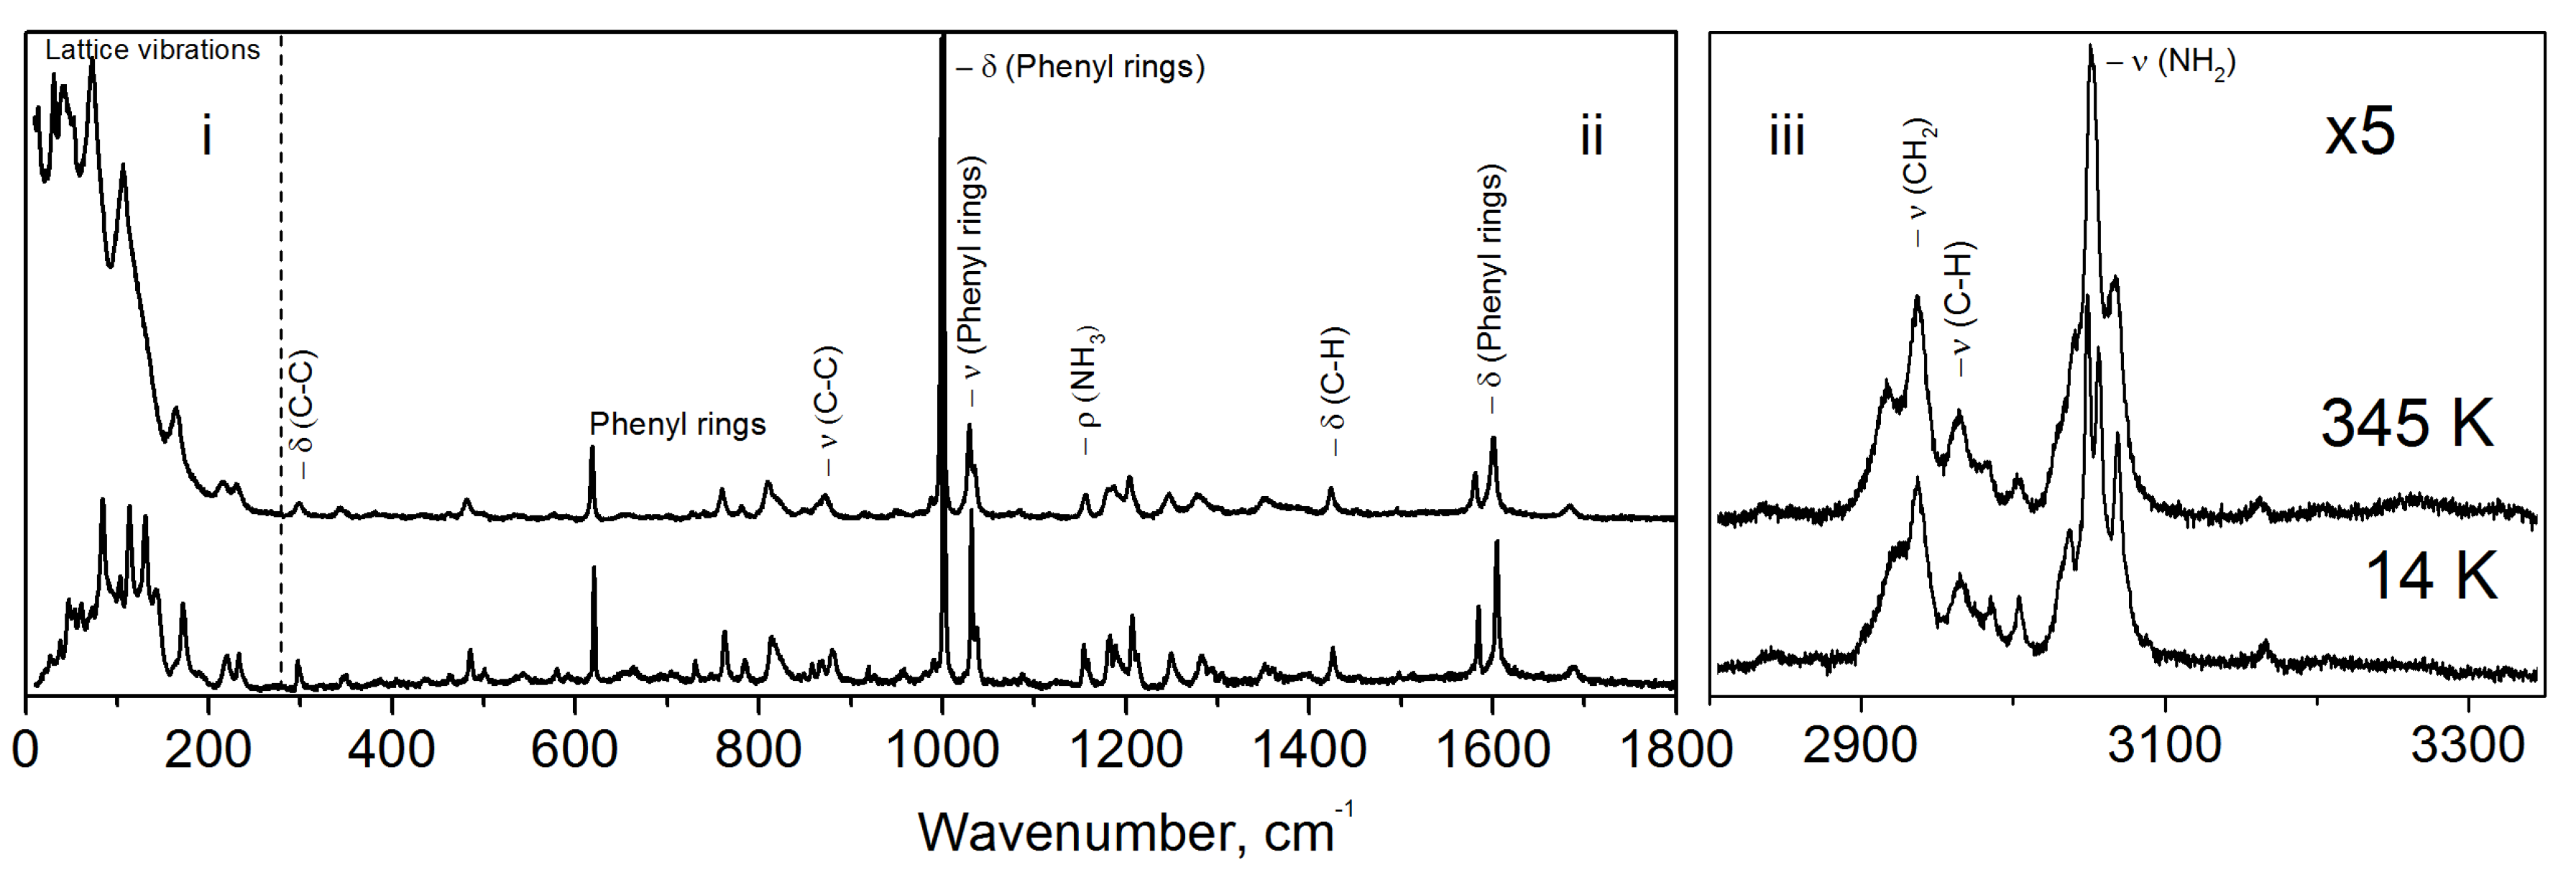
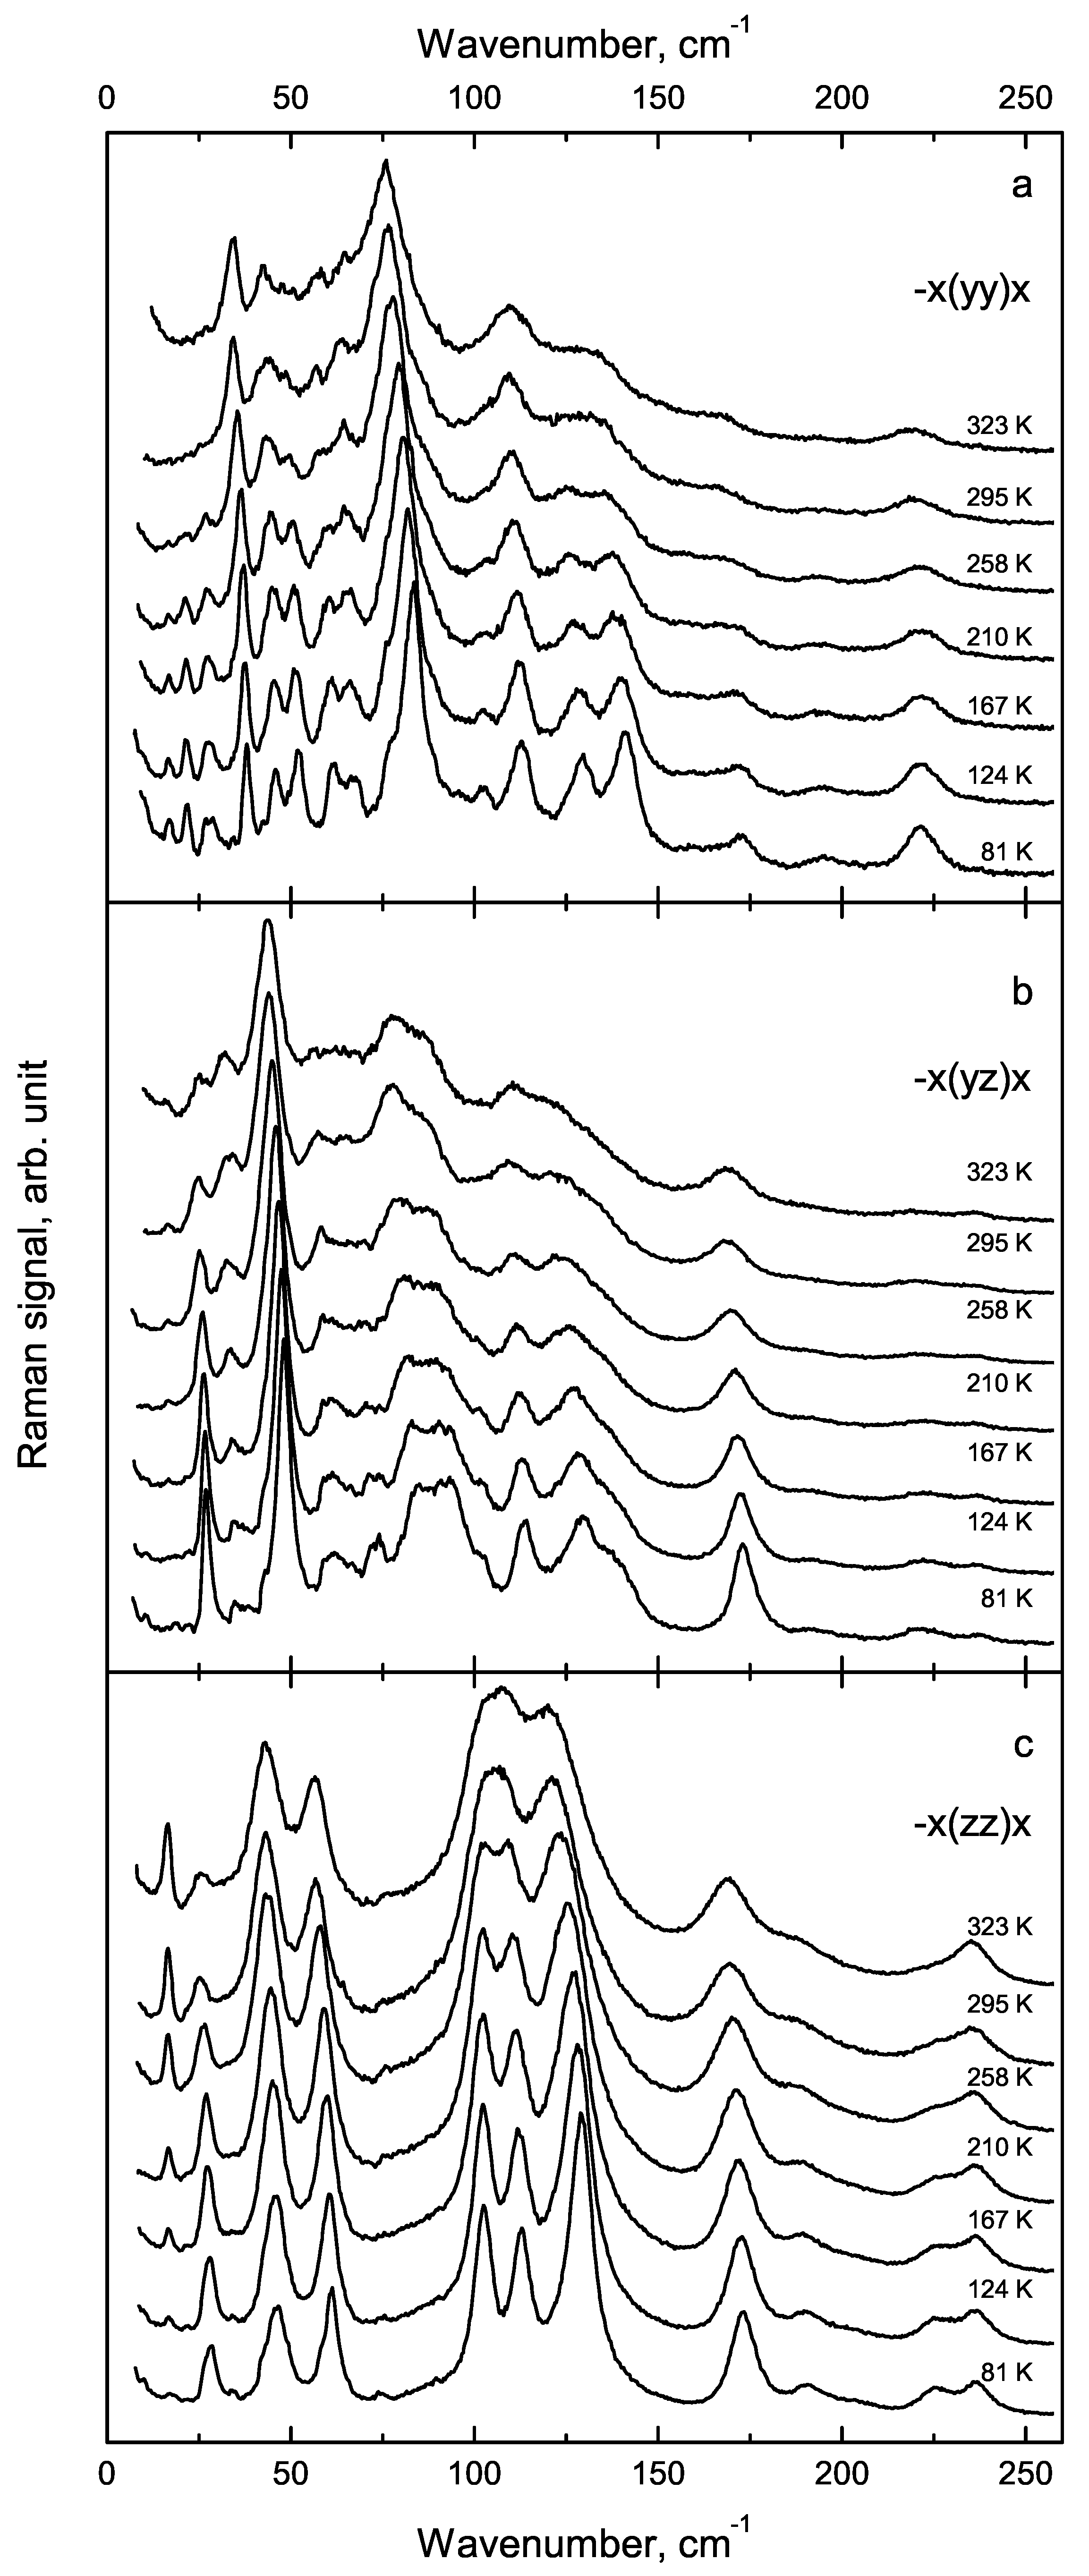
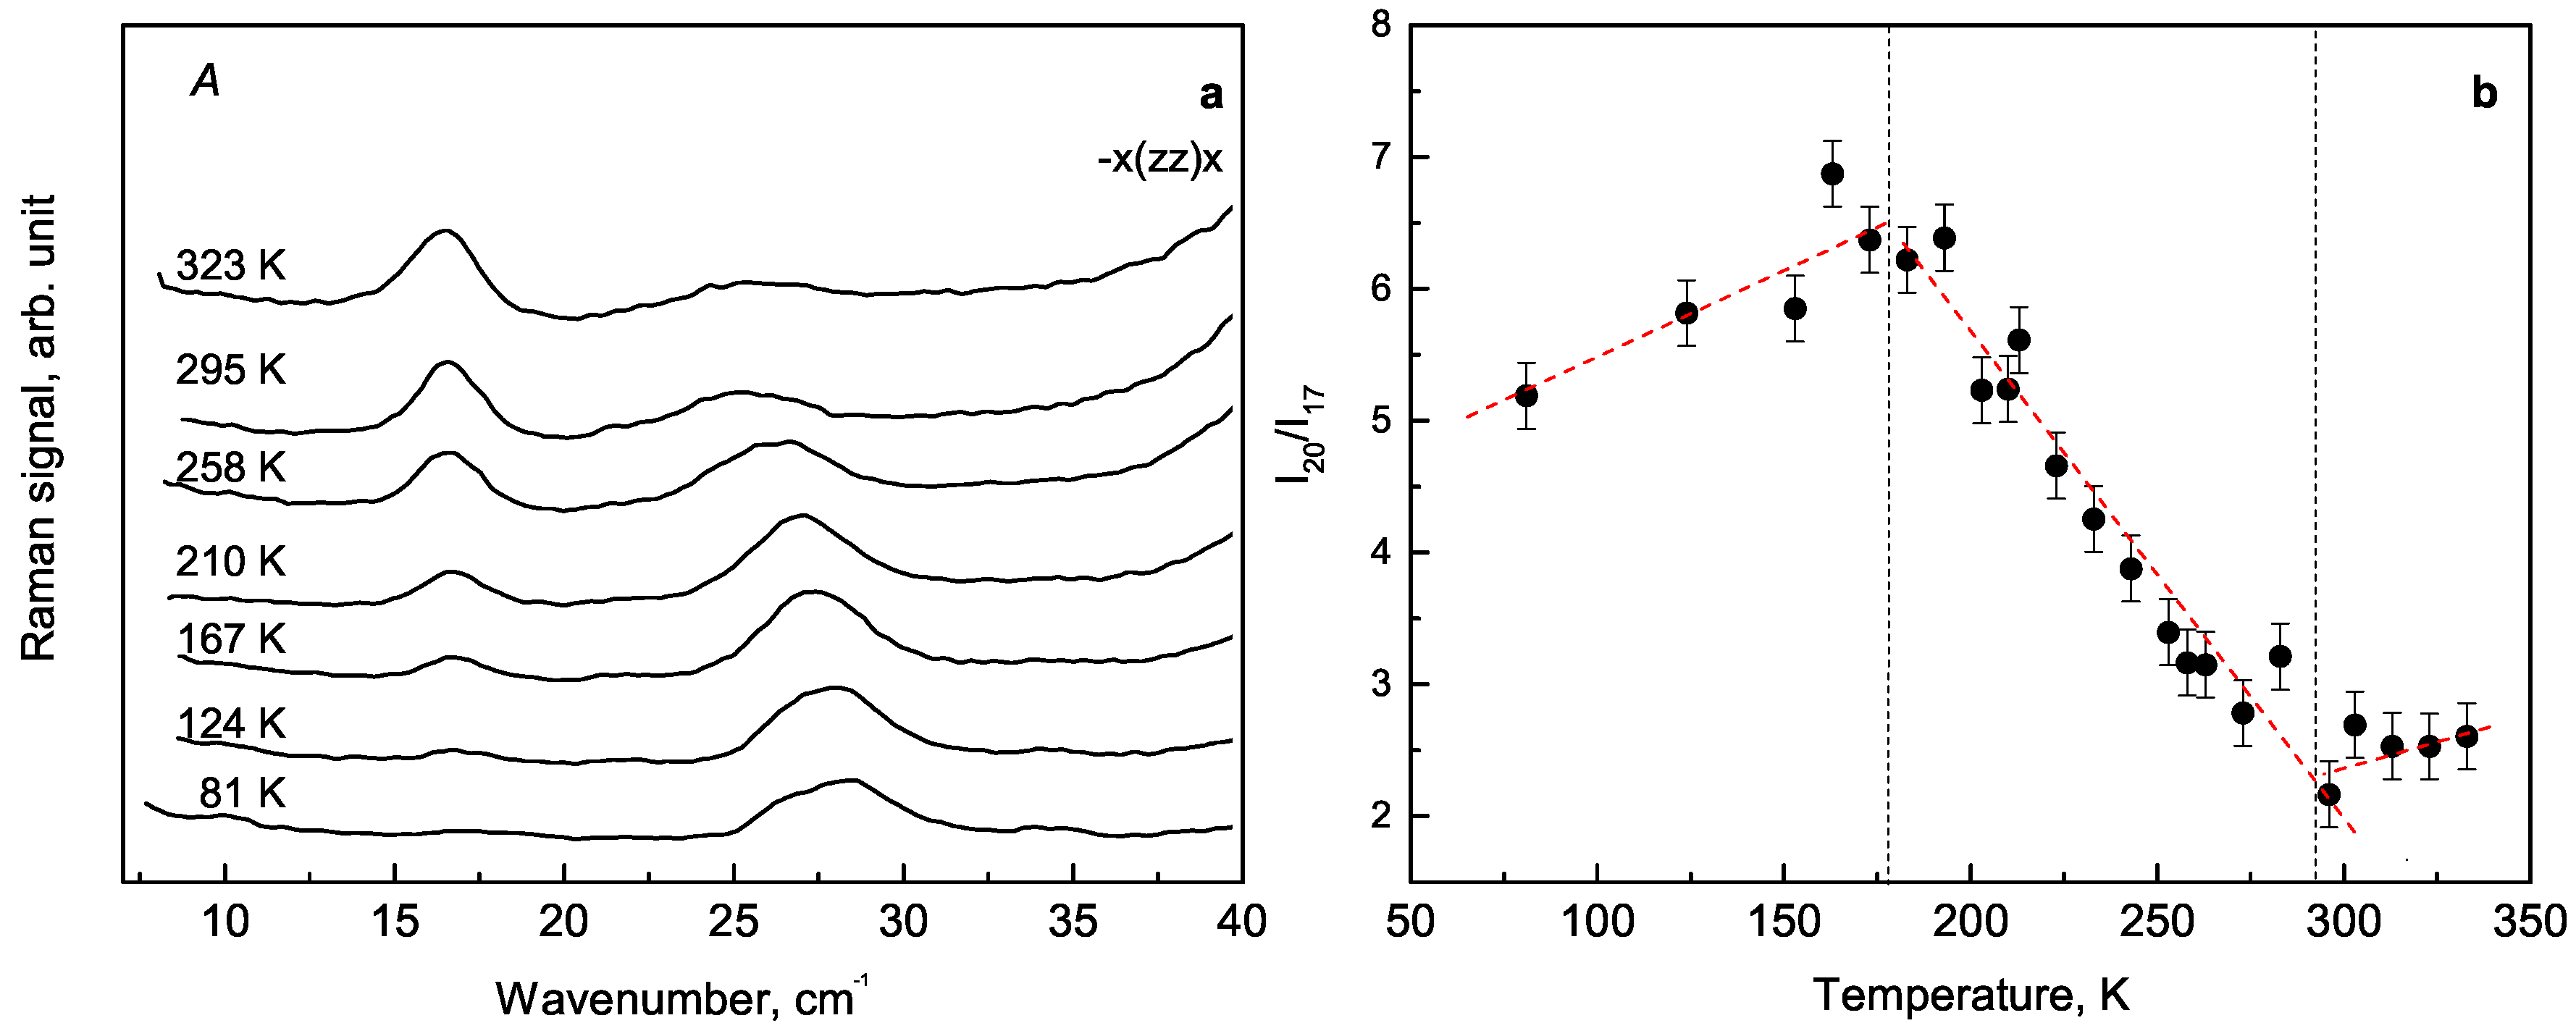
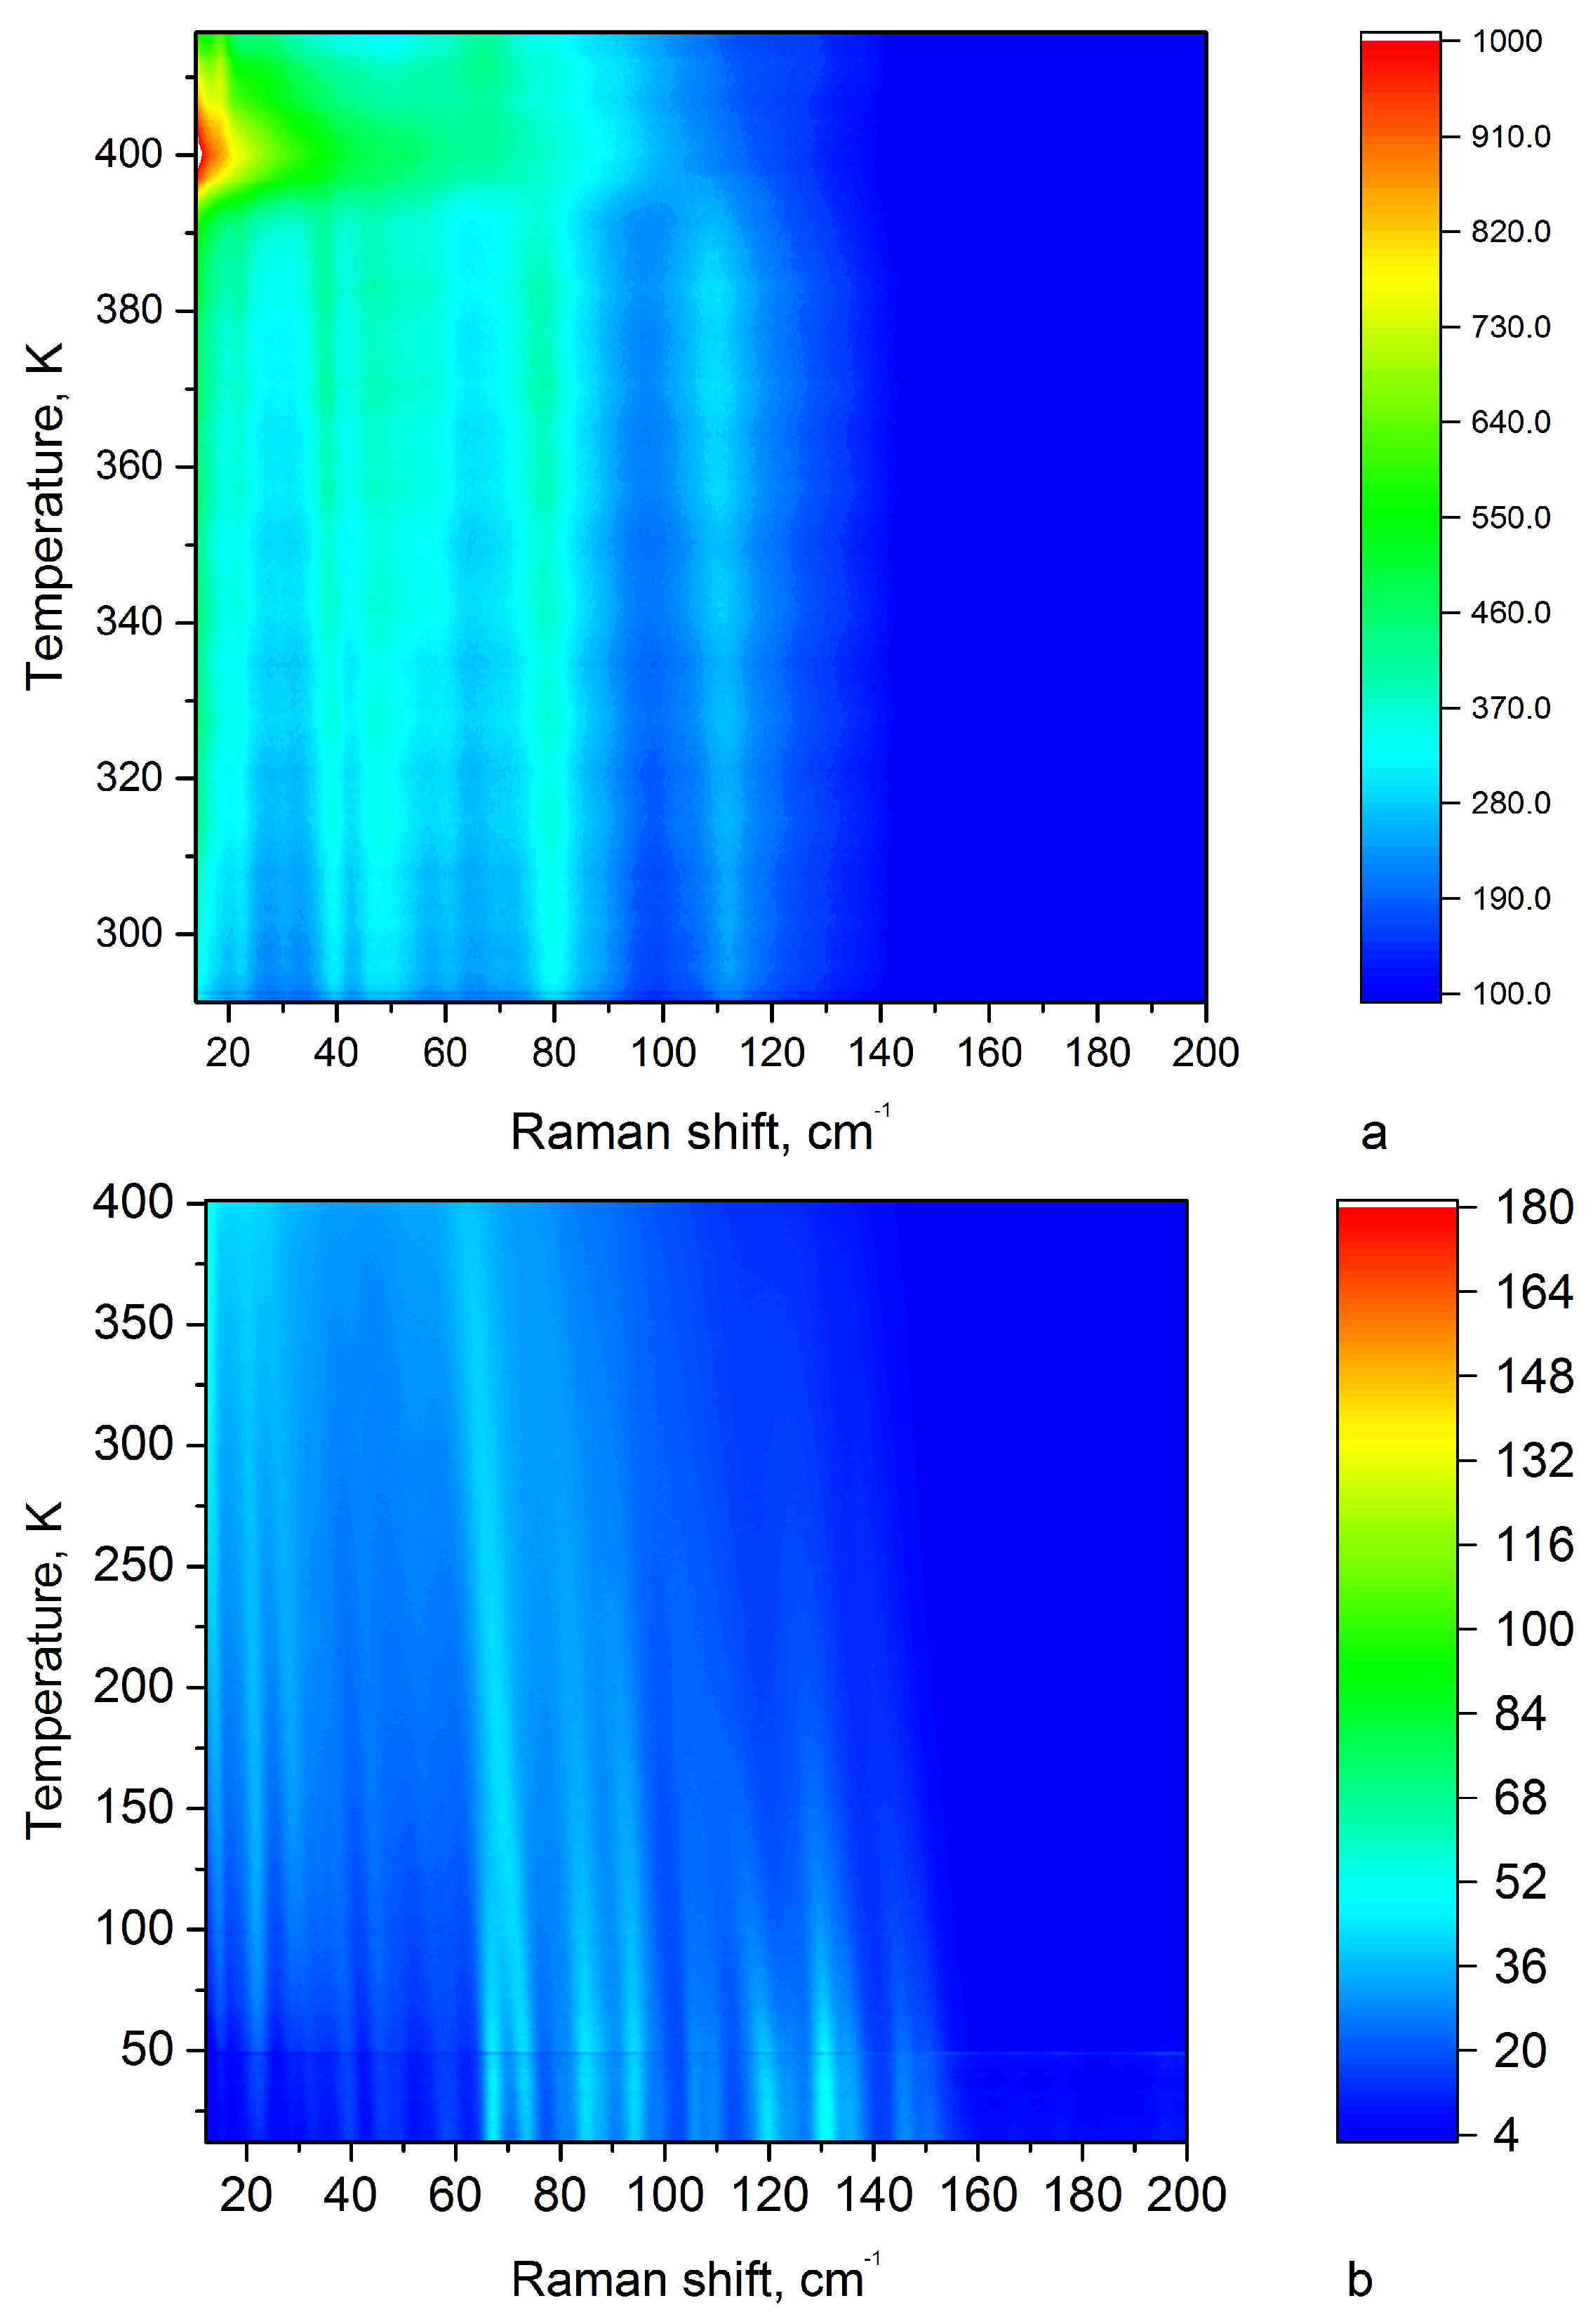
3.1. Lattice Vibrations

Low-wavenumber region is essential to study critical phenomena since the peaks in this range are originated from the vibrational modes of large molecular groups constituting peptide microtubes. The lattice vibrations are typically very sensitive to the variations of the environmental parameters such as temperature, pressure, solvation, pH. It was demonstrated, that the low wavenumber region can be used for calculation of effective frequency of lattice vibrations suitable for the determination of effective elastic constants and Young moduli of the microtubes [29]. Moreover, this effective frequency is also sensitive to structural phase transitions occurring in FF tubes at elevated temperatures [30].
Temperature effects on low wavenumber part of Raman spectra were investigated at temperatures from 80 up to 330 K (Figure 4). In all polarised geometries Raman lines are quite narrow and separate at low temperatures, whereas heating leads to its broadening and overlapping. Thus, at room temperature, only a few broad and poor resolved bands can be observed in this region (Figure 4). The comparison of spectra measured in various polarisation geometries with the derived selection rules for backscattering (Table A2) and right-angle scattering geometry (Table A3) allowed us to attribute the most intense of them to the vibration symmetry (Table 2).
Lines of A symmetry correspond to full symmetric vibrations along the tube axis, whereas lines of E 1 and E 2 symmetry correspond to doubly degenerate vibrations in the x-y plane. We have paid particular attention to the two lowest Raman lines located at 17 and 26 cm 1 earlier not reported in the literature. Their intensities demonstrate opposite temperature behaviour (Figure 5). During the sample cooling the intensity of line at 17 cm 1 decreases, whereas the intensity of line at 26 cm 1 increases. The ratio of their integrated intensities I 26 / I 17 is presented in Figure 5 and gradually decreases with temperature increasing.
Raman lines at 17 cm 1 and 26 cm 1 can be attributed to A symmetry type of the lattice vibration. The temperatures of spectral anomalies are about 178 K and 296 K. There is some number of overlapping peaks in the range 100–150 cm 1 that change their Raman signals and split into other peaks with decreasing the temperature. The spectral anomalies can be associated with structural changes. However, additional studies by X-ray diffraction in a whole temperature range are required.
The line 105 cm 1 was attributed to Phe-Phe twisting in the article [24]. This assignment is based on first-principle calculations. The observed hysteresis of the 105 cm 1 line position, depending on whether we heat the sample or cool it (Figure 6). The temperatures of the spectral anomalies are 235, 255 and 278 K (Figure 6). The Figure A3 shows the dependence of the three low-frequency line positions on temperature.

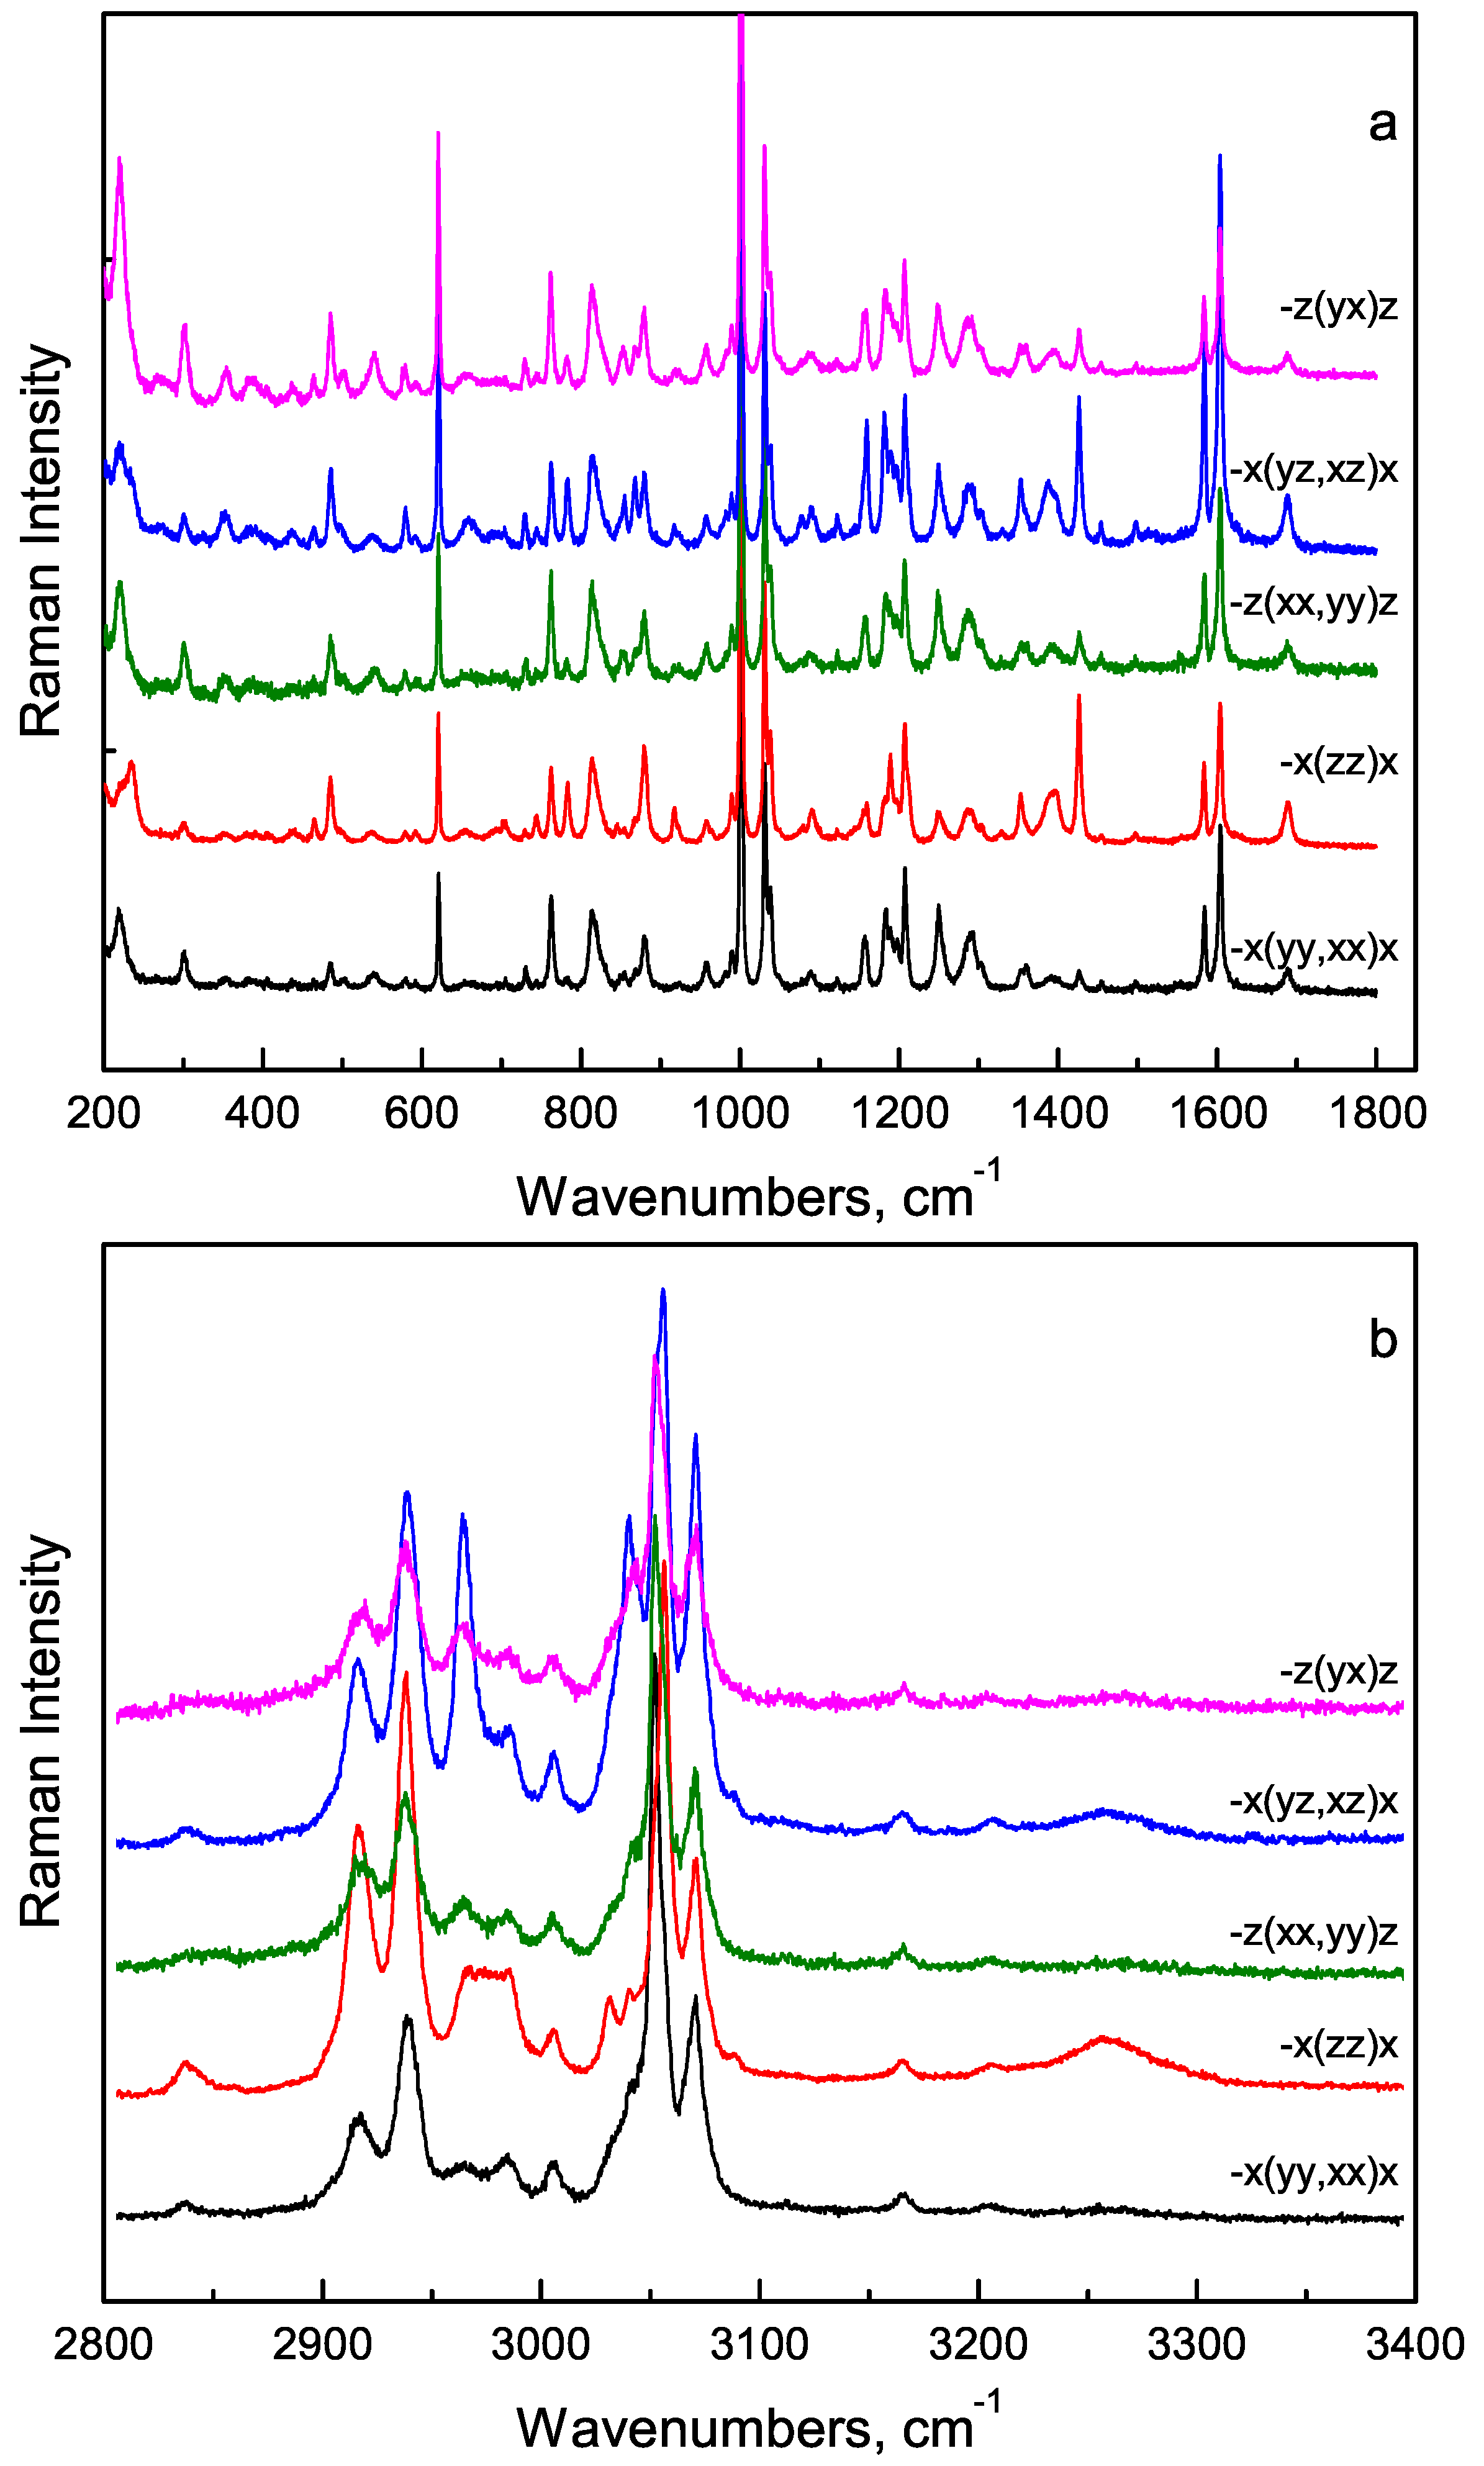
3.2. Vibrations of Functional Groups

The spectral region from 280 cm 1 to 3350 cm 1 contains lines of functional groups vibrations and can be divided by two subregions. Polarised spectra of FF microtube for mid- and high-wavenumber regions (Figure 7a,b) can be used for determination of the orientation of FF molecules in the microtube.
It was shown, for example, that NH 3 group is oriented parallel to the microtube axis, the COO group is perpendicular to the axis, and the carbonyl group is oriented at 54 relative to the axis [31]. In the following, we will qualitatively discuss the temperature behaviour of several Raman lines.

3.2.1. The Mid-Wavenumber Region

The mid-wavenumber region consists of lines corresponding to vibrations of such functional groups of FF molecules as phenyl rings and amide groups, whereas the high-wavenumber region is due to stretching vibrations of CH 2 , CH and NH groups. The mode at 496 cm 1 was assigned to the ring deformation. The modes at 297 cm 1 and 348 cm 1 were assigned to the split torsional motion of the CH group [23]. The line 620 cm 1 is associated with O−C=O deformation. In the mid-frequency region of the spectrum, the phase transition is manifested by the appearance of new lines in the regions 298 cm 1 (C−H torsional motion), and 496 cm 1 (N−H torsional motion) [21] at 398 K. (Figure 8)
There are two amide lines in the Raman spectrum of FF microtubes (Figure 7a). The amide I line located at 1687 cm 1 is mainly associated with C=O stretching vibrations with additional contributions from C−N stretching vibrations, C−C−N deformations and N−H bending vibrations [31]. The amide III line at 1249 cm 1 mainly represents stretching vibrations of C−N bonds [32]. The significant changes of these lines were not observed in Raman spectra in the studied temperature range.

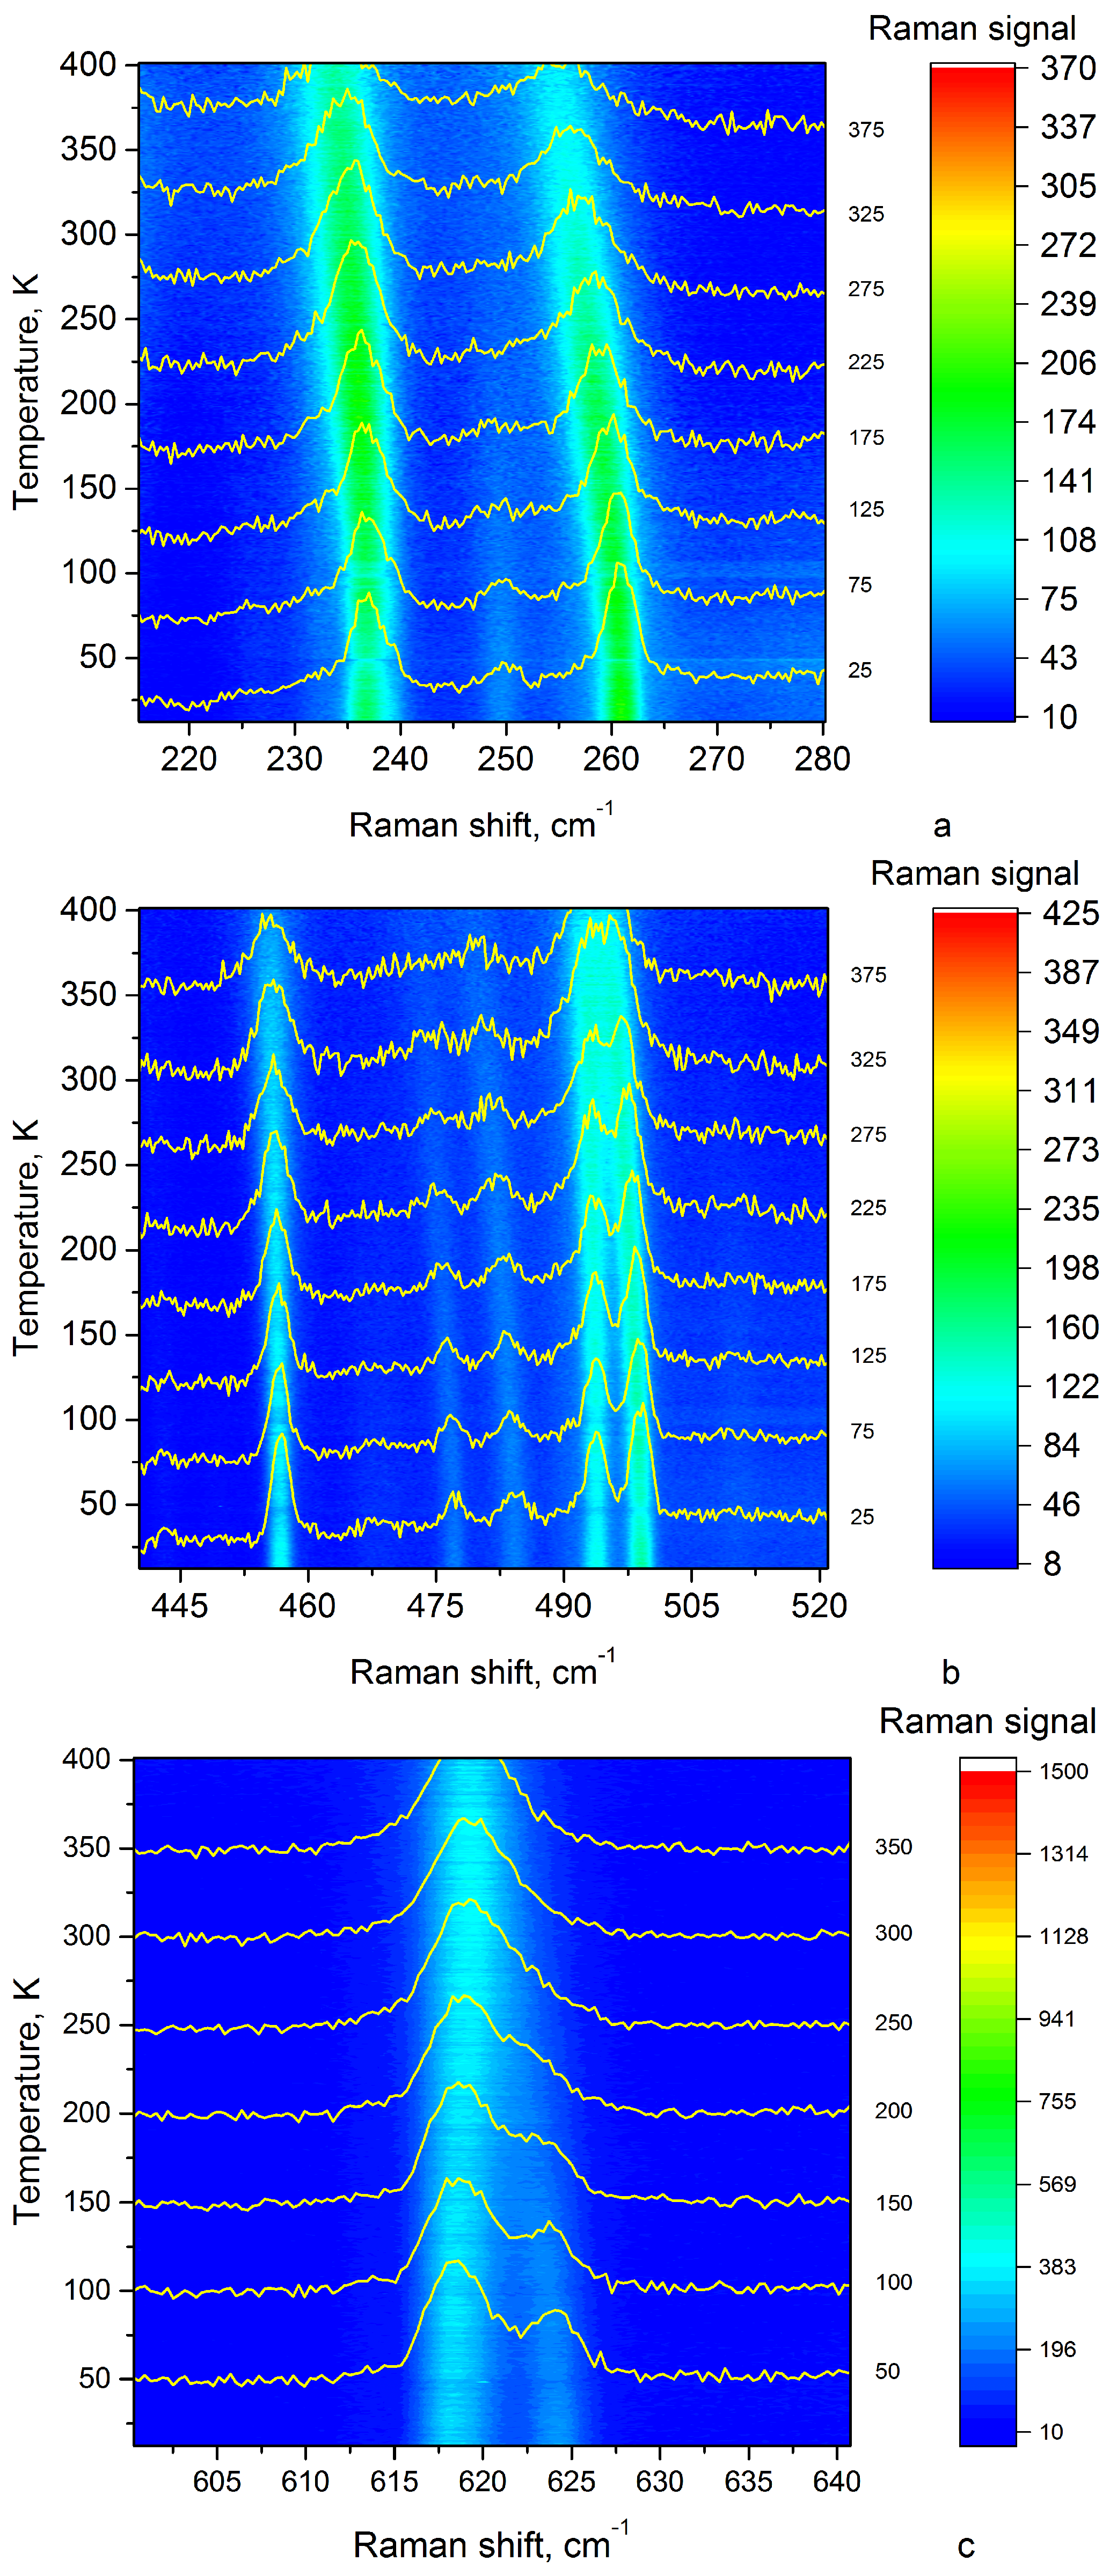
3.2.2. Phenyl Rings Vibrations

Phenyl rings provide several lines in the spectrum; however, the more strong and interesting for investigation are those located at 1002 cm 1 and a doublet at 1034 cm 1 (Figure 3). The first line is attributed to in-plane rings’ breathing vibrations, and it is the strongest line in the spectrum. The doublet at about 1034 cm 1 is attributed to in-plane stretching-shrinking oscillations of the phenyl rings and is sensitive to the presence of water in the nanochannel of the tube [33]. During the self-assembly, phenyl rings form a rigid frame of FF microtubes. Temperature variations provide small changes of the parameters of corresponding Raman lines, and therefore precise measurements are required to detect these changes. The accuracy of the measured line shift of our instrument was estimated to be better than 0.05 cm 1 (see description to Figure A2). Temperature dependences of the position and damping of these lines were measured in the range from 14 K up to 405 K.
Variation of the position of 1002 cm 1 line is presented in Figure 9. This line demonstrates non-monotonous behaviour and abrupt jump to higher wavenumbers at 398 K. Similar behaviour is observed for 1032 and 1038 cm 1 lines. The jump at 398 K is characteristic for the structural phase transition, but the value of the jump is much smaller than similar effects in inorganic crystals [18]. The critical temperature is quite far from 420 K, at which an irreversible cyclization of FF molecules starts [34], and therefore the jump can be related to the reconstruction of the crystal lattice after water evaporation from the nanochannels [30].
Both components of the doublet located at about 1032 cm 1 and 1038 cm 1 (Figure 9) correspond to in-plane stretching-shrinking vibrations of phenyl rings [33]. The splitting occurs because each FF molecule contains two not completely identical rings differently interacting with water molecules in the nanochannel. The distance between these two components strongly depends on the number of water molecules in tube nanochannel [33]. Additional water molecules which are weakly coupled to FF molecules [19] cannot be detected by this method. Nanotubes’ depletion leads to symmetry change from hexagonal to orthorhombic [30,35,36] and is accompanied with the disappearance of piezoelectric and nonlinear optical properties.

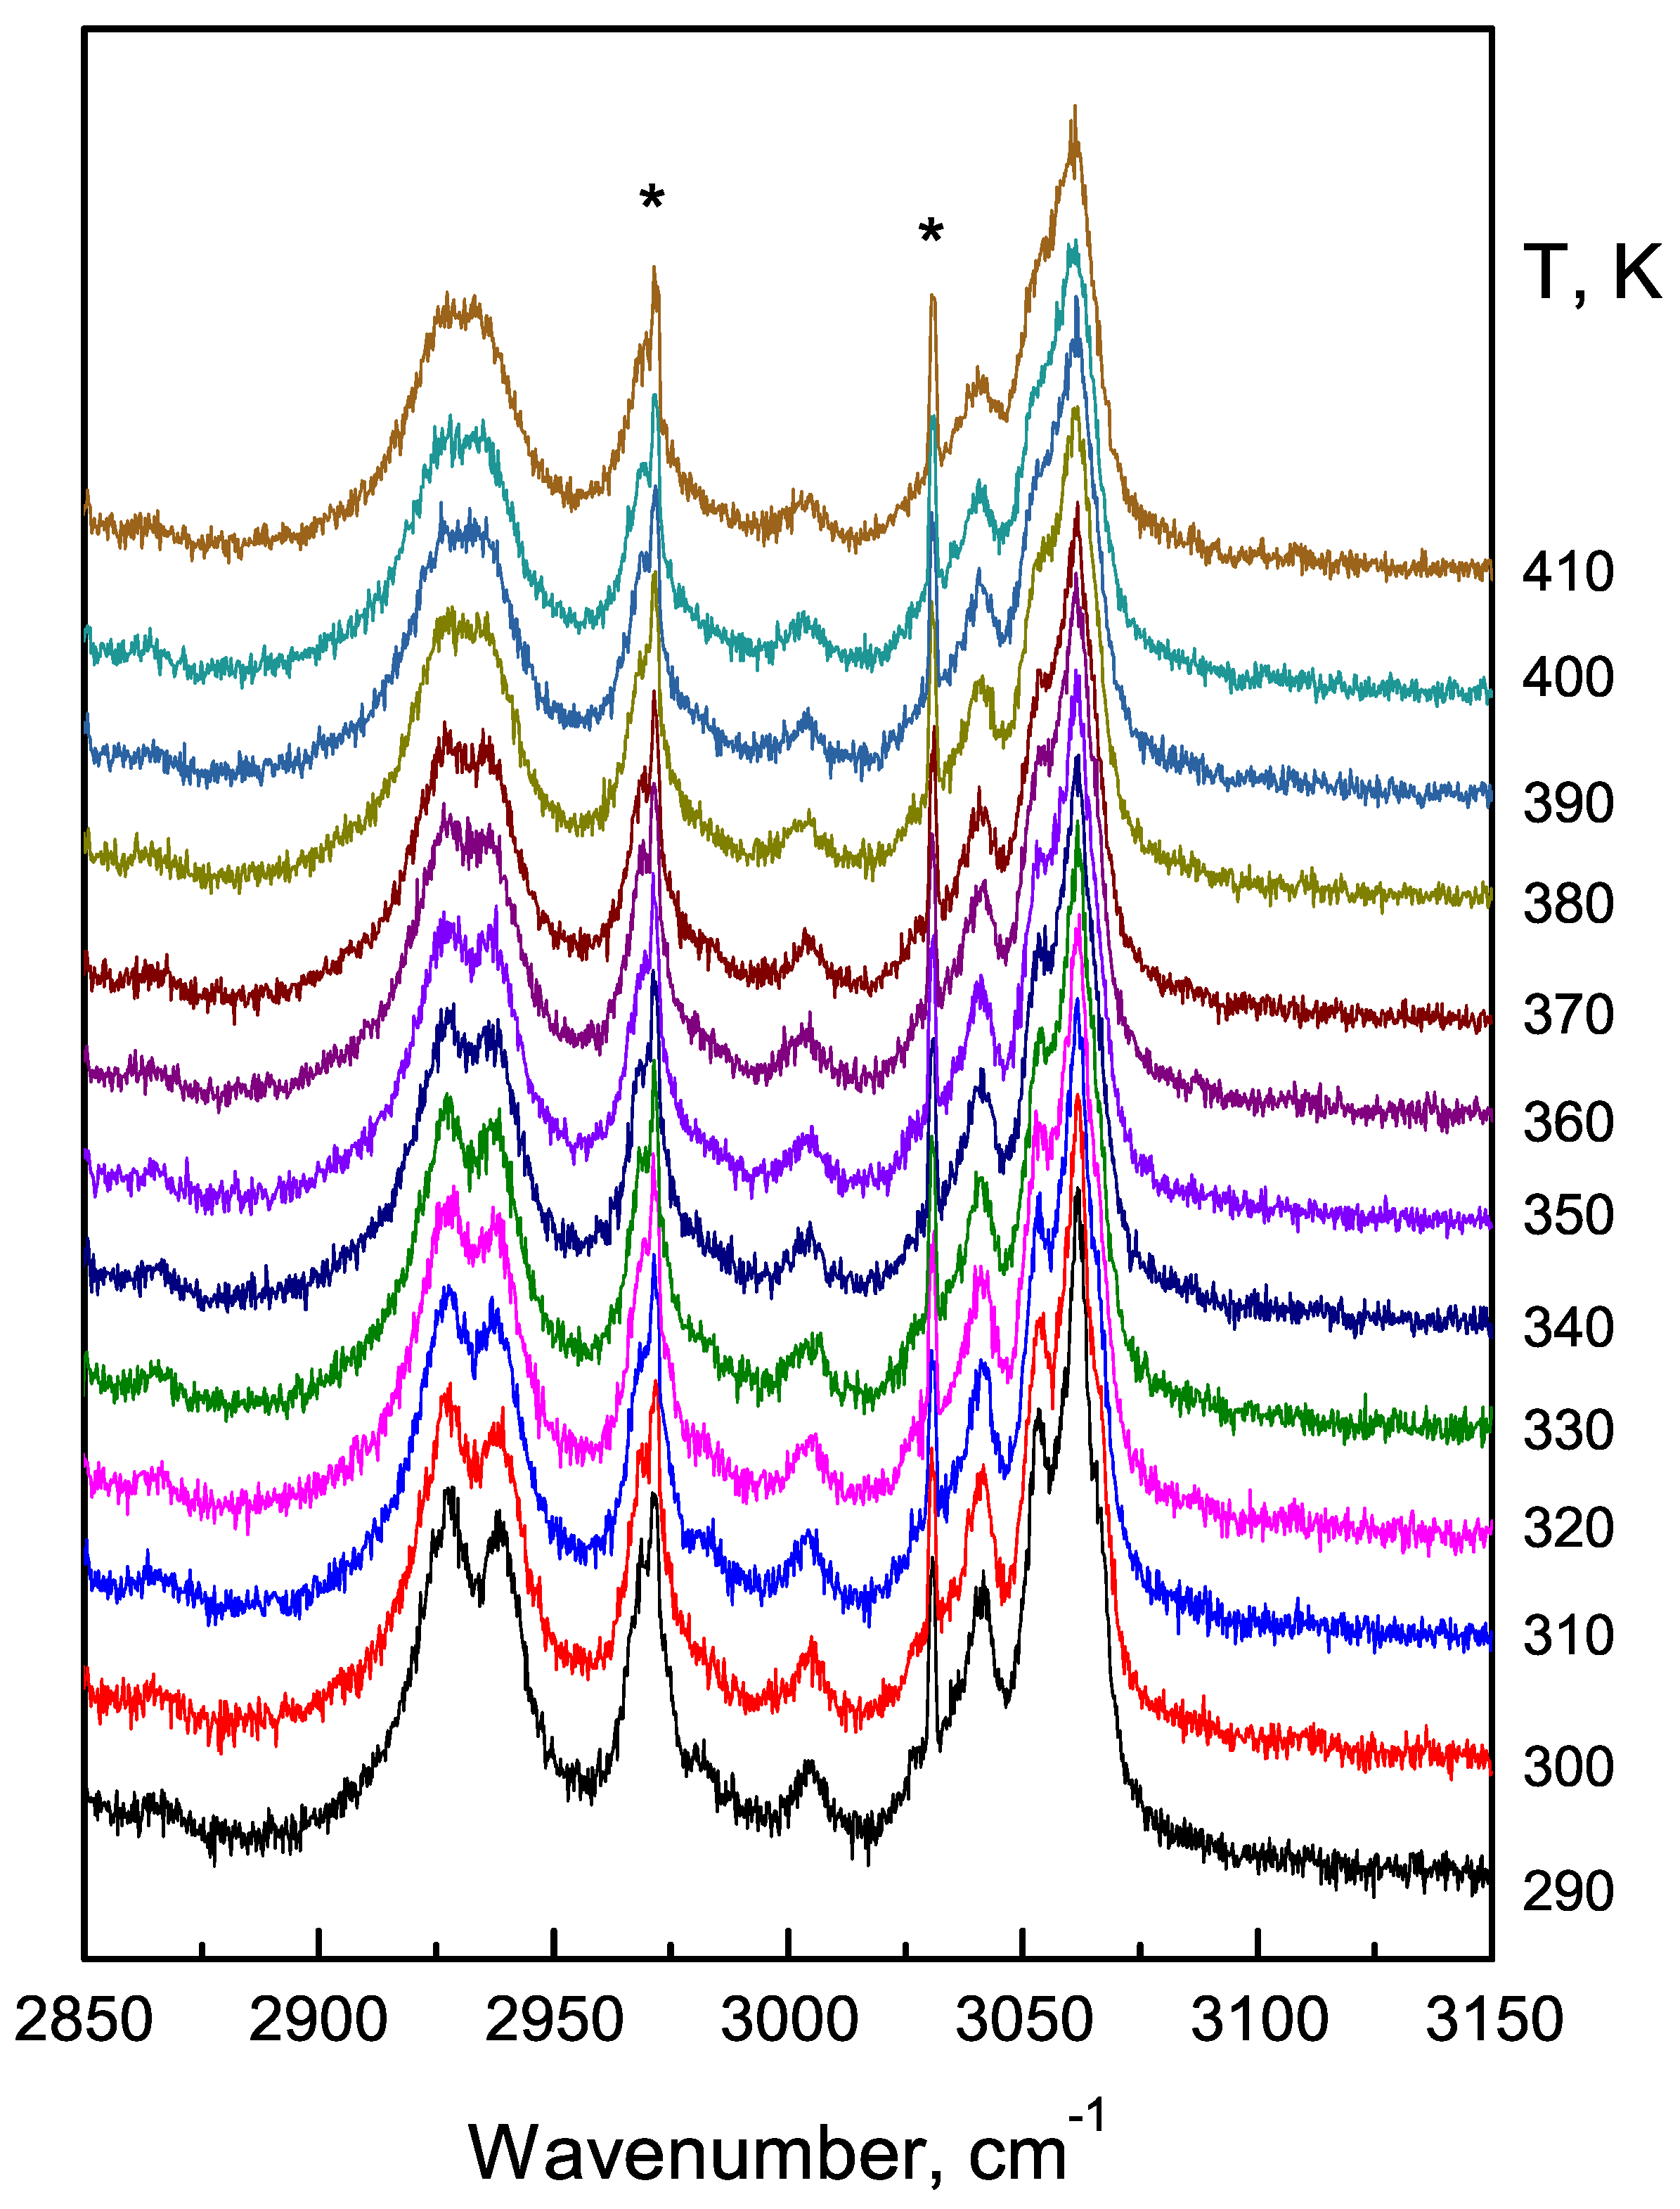
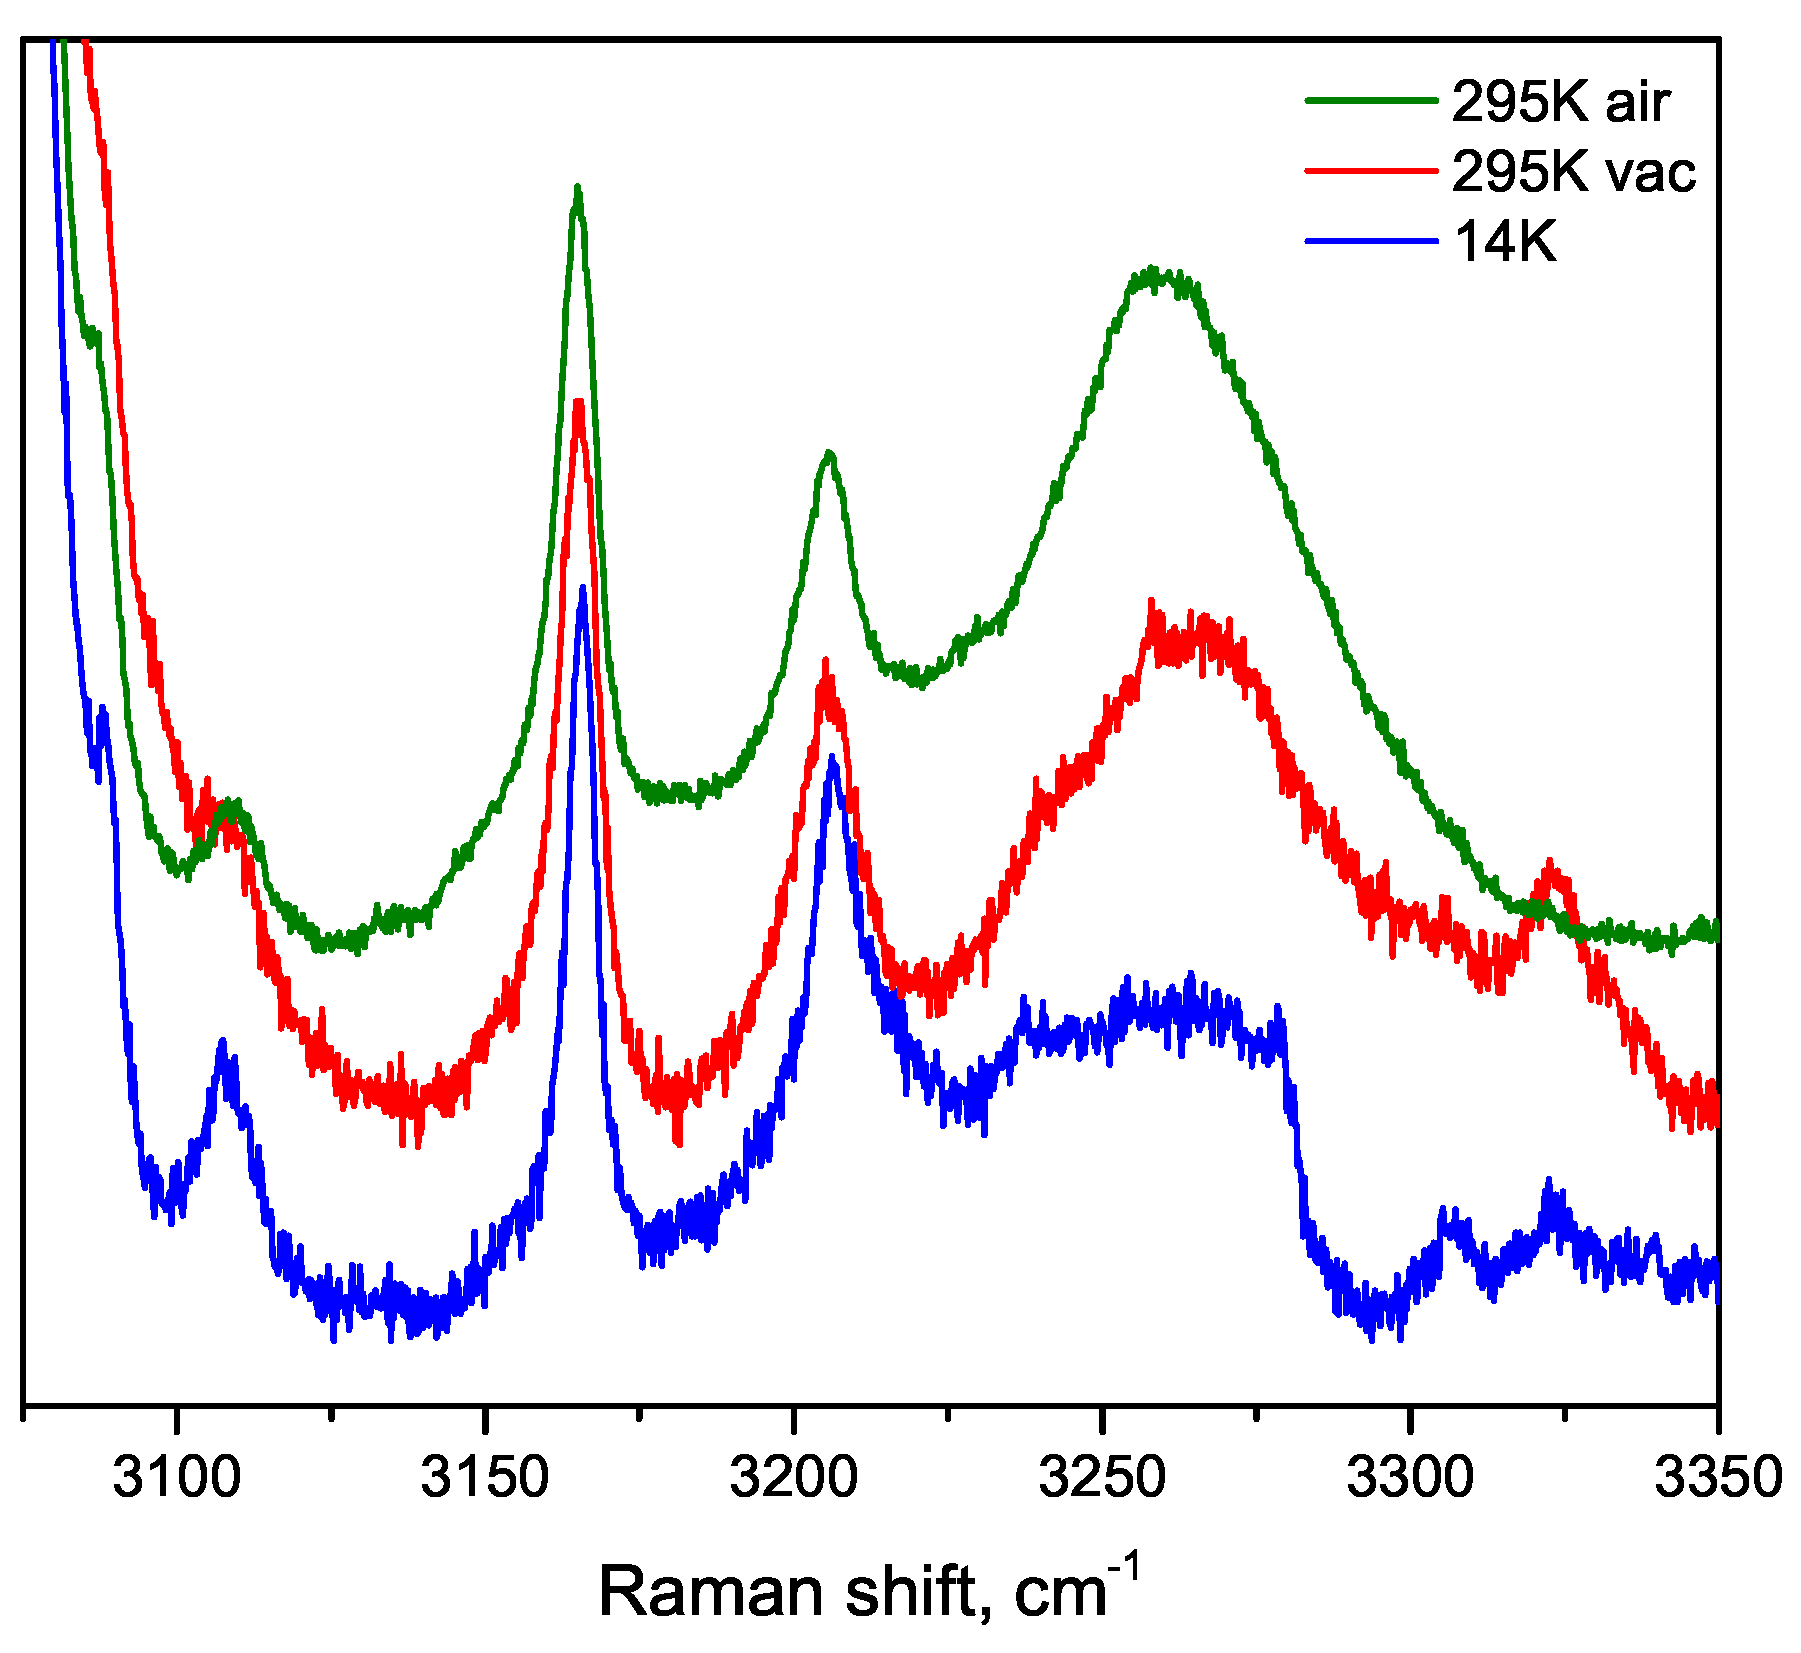
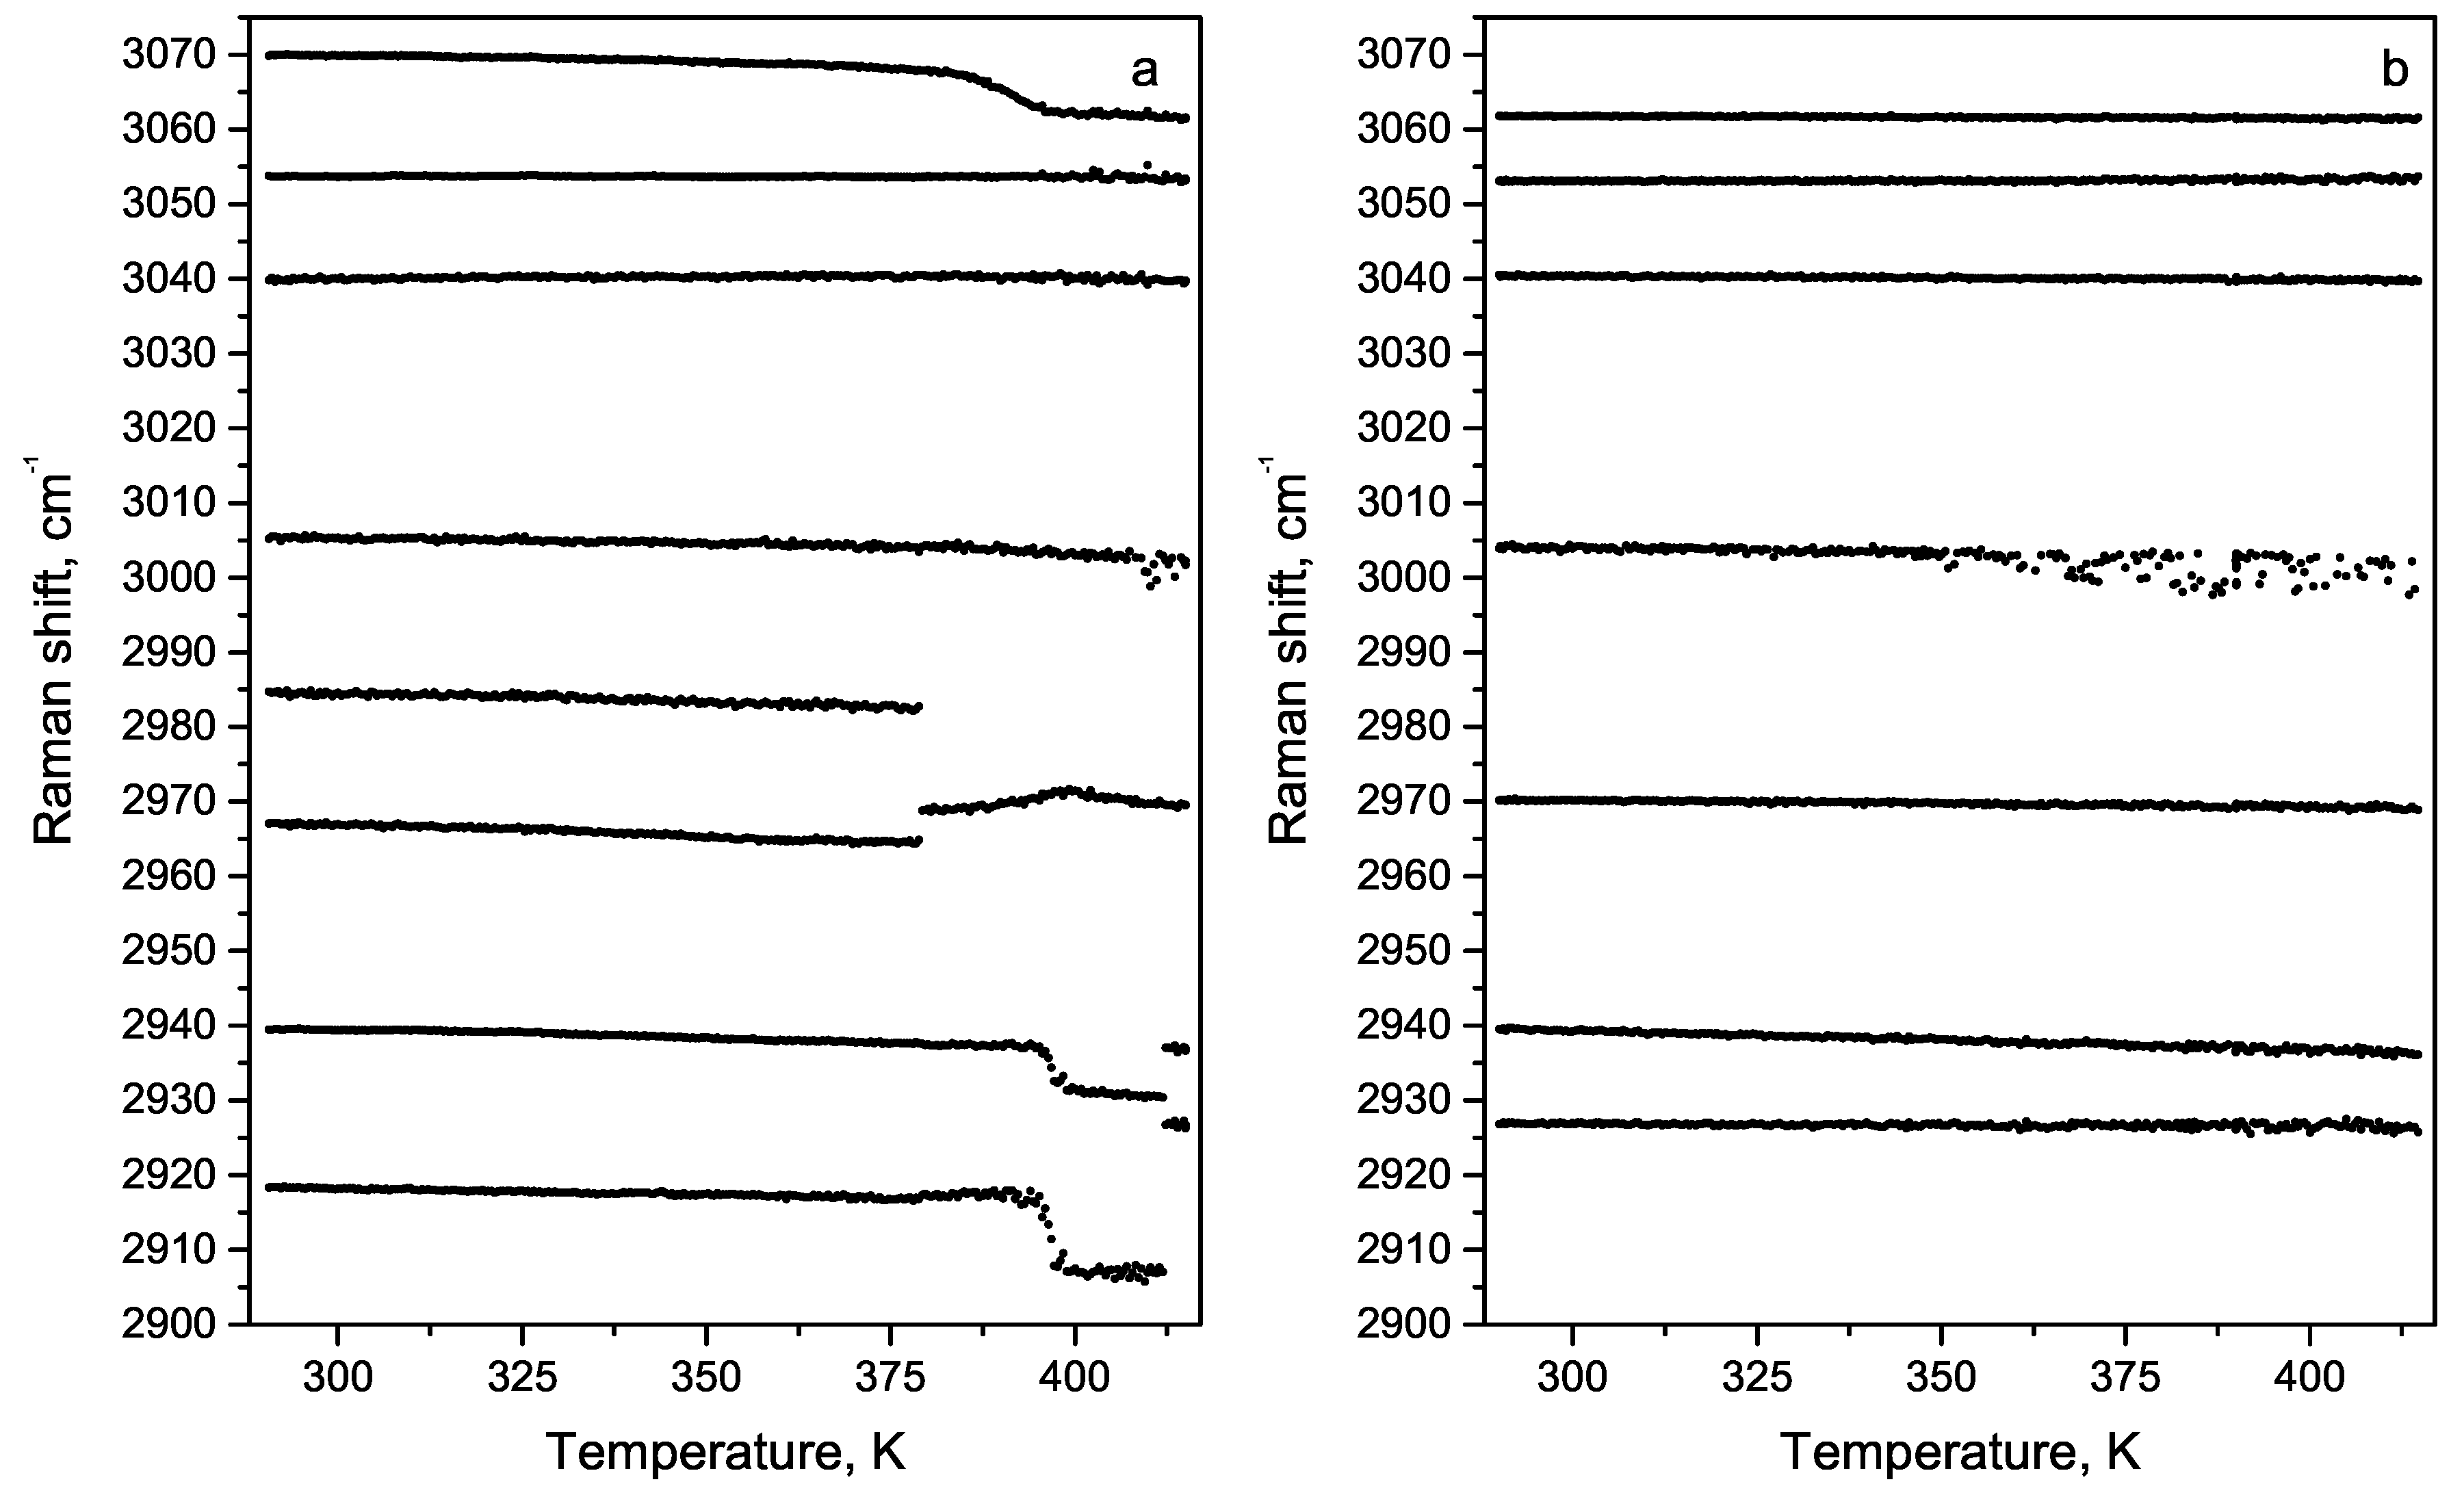
3.2.3. The High-Wavenumber Region

The high-wavenumber region of the Raman spectrum of FF microtubes with temperature changes has not investigated in details earlier. Raman spectra were recorded at room temperature for L-phenylalanine, L-phenylalaninium dihydrogenphosphate, and DL-phenylalaninium dihydrogenphosphate [27]. The Raman spectra of CH stretching region of diphenylalanine micro- and microtube contains 9 lines located at 2920 cm 1 , 2938 cm 1 , 2966 cm 1 , 2985 cm 1 , 3004 cm 1 , 3037 cm 1 , 3049 cm 1 , 3057 cm 1 , and 3069 cm 1 . We attribute 2920 cm 1 , 2938 cm 1 , 2966 cm 1 and 2985 cm 1 lines to symmetric and asymmetric stretching vibrations of CH groups, the lines at 3004 cm 1 , 3037 cm 1 , 3049 cm 1 and 3057 cm 1 to CH stretching, and the 3069 cm 1 line to NH asymmetry stretching. The variations of the high-wavenumber region of the Raman spectrum was studied in the temperature range from 290 K up to 410 K (Figure 10). The intensities of the high-frequency lines are very low.
The lines corresponding to symmetric and asymmetric stretching vibrations of CH 2 groups represent the doublets located at 2900–2938 cm 1 and 2966–2985 cm 1 . It is clearly seen that at temperatures below 398 K these doublets are quite intense in spectra.
Spectral lines corresponding to stretching vibrations of CH and NH groups (located at 3050–3070 cm 1 ) and separated at room temperature merge together at 398 K (Figure 10). All these processes are accompanied by lines broadening due to temperature increases.
In general, there is more than one approach to adjust the position of the lines [37,38]. The first method is a direct calculation of the vibrational spectrum at different temperatures using a model containing short-range forces on the fourth neighbours and long-range nonlocal dipole interactions or molecular dynamics modelling. This approach requires very complex and laborious quantum–mechanical calculations at each temperature [39].
The temperature dependence of the frequency of the optical phonon mode is mainly determined by the effects of thermal expansion, stresses, and anharmonic contributions (third, fourth, and higher orders) into the potential vibrational energy. The anharmonicity leads to the decay of an optical phonon into two (three-phonon model), three or more low-energy phonons [40]. Some contributions may be very small and may be excluded from the resulting expression to approximate the frequency. Therefore, various variants are applied.
For example, only the thermal expansion of the lattice is used. This approach requires knowledge of the lattice constants and Grüneisen parameters. We have no data on the Grüneisen parameter in FF microtube.
Another approach involves accounting for anharmonic contributions. For example, Clemens used a model that takes into account only processes that include the decay of an optical phonon into two phonons [41]. Balkanski et al. extended this idea to the calculation of the wavenumber shift and included four-phonon processes [42]. Menendez and Cardona considered the decay of two phonons belonging to different branches [43].
For analysis of temperature behaviour we used a three-phonon model [42]:
Ω ( T ) = ω 0 + A 1 + 1 exp ω 1 k B T 1 + 1 exp ω 2 k B T 1
here ω 0 is the position at T = 0 K. Frequencies ω 1 and ω 2 are the frequencies of two phonons and ω 0 = ω 1 + ω 2 . A, , k B are approximation constant, the reduced Planck constant and the Boltzmann constant respectively.
The approximation of 2938 cm 1 , 2966 cm 1 , 3004 cm 1 , 3037 cm 1 lines was performed using a three-phonon model. These modes correspond to C−H stretching (Figure 11a–d). The difference between the line position and its approximation depending on the temperature is shown in the Figure 11e,f,j,k. The spectral lines 2938 cm 1 , 2966 cm 1 change the tilt angle at the temperature of 255 K, line 3004 cm 1 at the temperature of 235 K and line 3037 cm 1 at 258 K.
Spectral lines occurring in range 3100–3350 cm 1 can be attributed to O–H stretching vibrations of water molecules located in the microtubes internal channel. These lines are very weak, and more than 6 h of accumulation time per one spectrum was needed to obtain the representative results presented in Figure 12. Measurements were carried out under high vacuum (10 6 mbar) and at 14 and 295 K. The wide spectral line at 3262 cm 1 can be attributed to OH stretching vibrations of trapped water molecules. This line evolves into a complex multiline band shapes at low temperatures. Temperature studies were carried out under high vacuum. Therefore, in order to understand the effect of vacuum (possibly accompanied by water drying), we measured spectra at room temperature before and after evacuation (Figure 8). Upon evacuation, the width of line at about 3262 cm 1 decreases, and the new line appears at 3324 cm 1 . The wide spectral band at 3262 cm 1 evolve into complex multiline band shapes at low temperatures. Knowing the position of water band at 3262 cm 1 it could be possible to determine R(O..O) distance in water molecules. According to the relation between O−H stretching frequency and R(O..O) distance, we infer that the distance between two oxygen atoms in a nanochannel is about 2.8 Å. This distance does not change much with the temperature change.

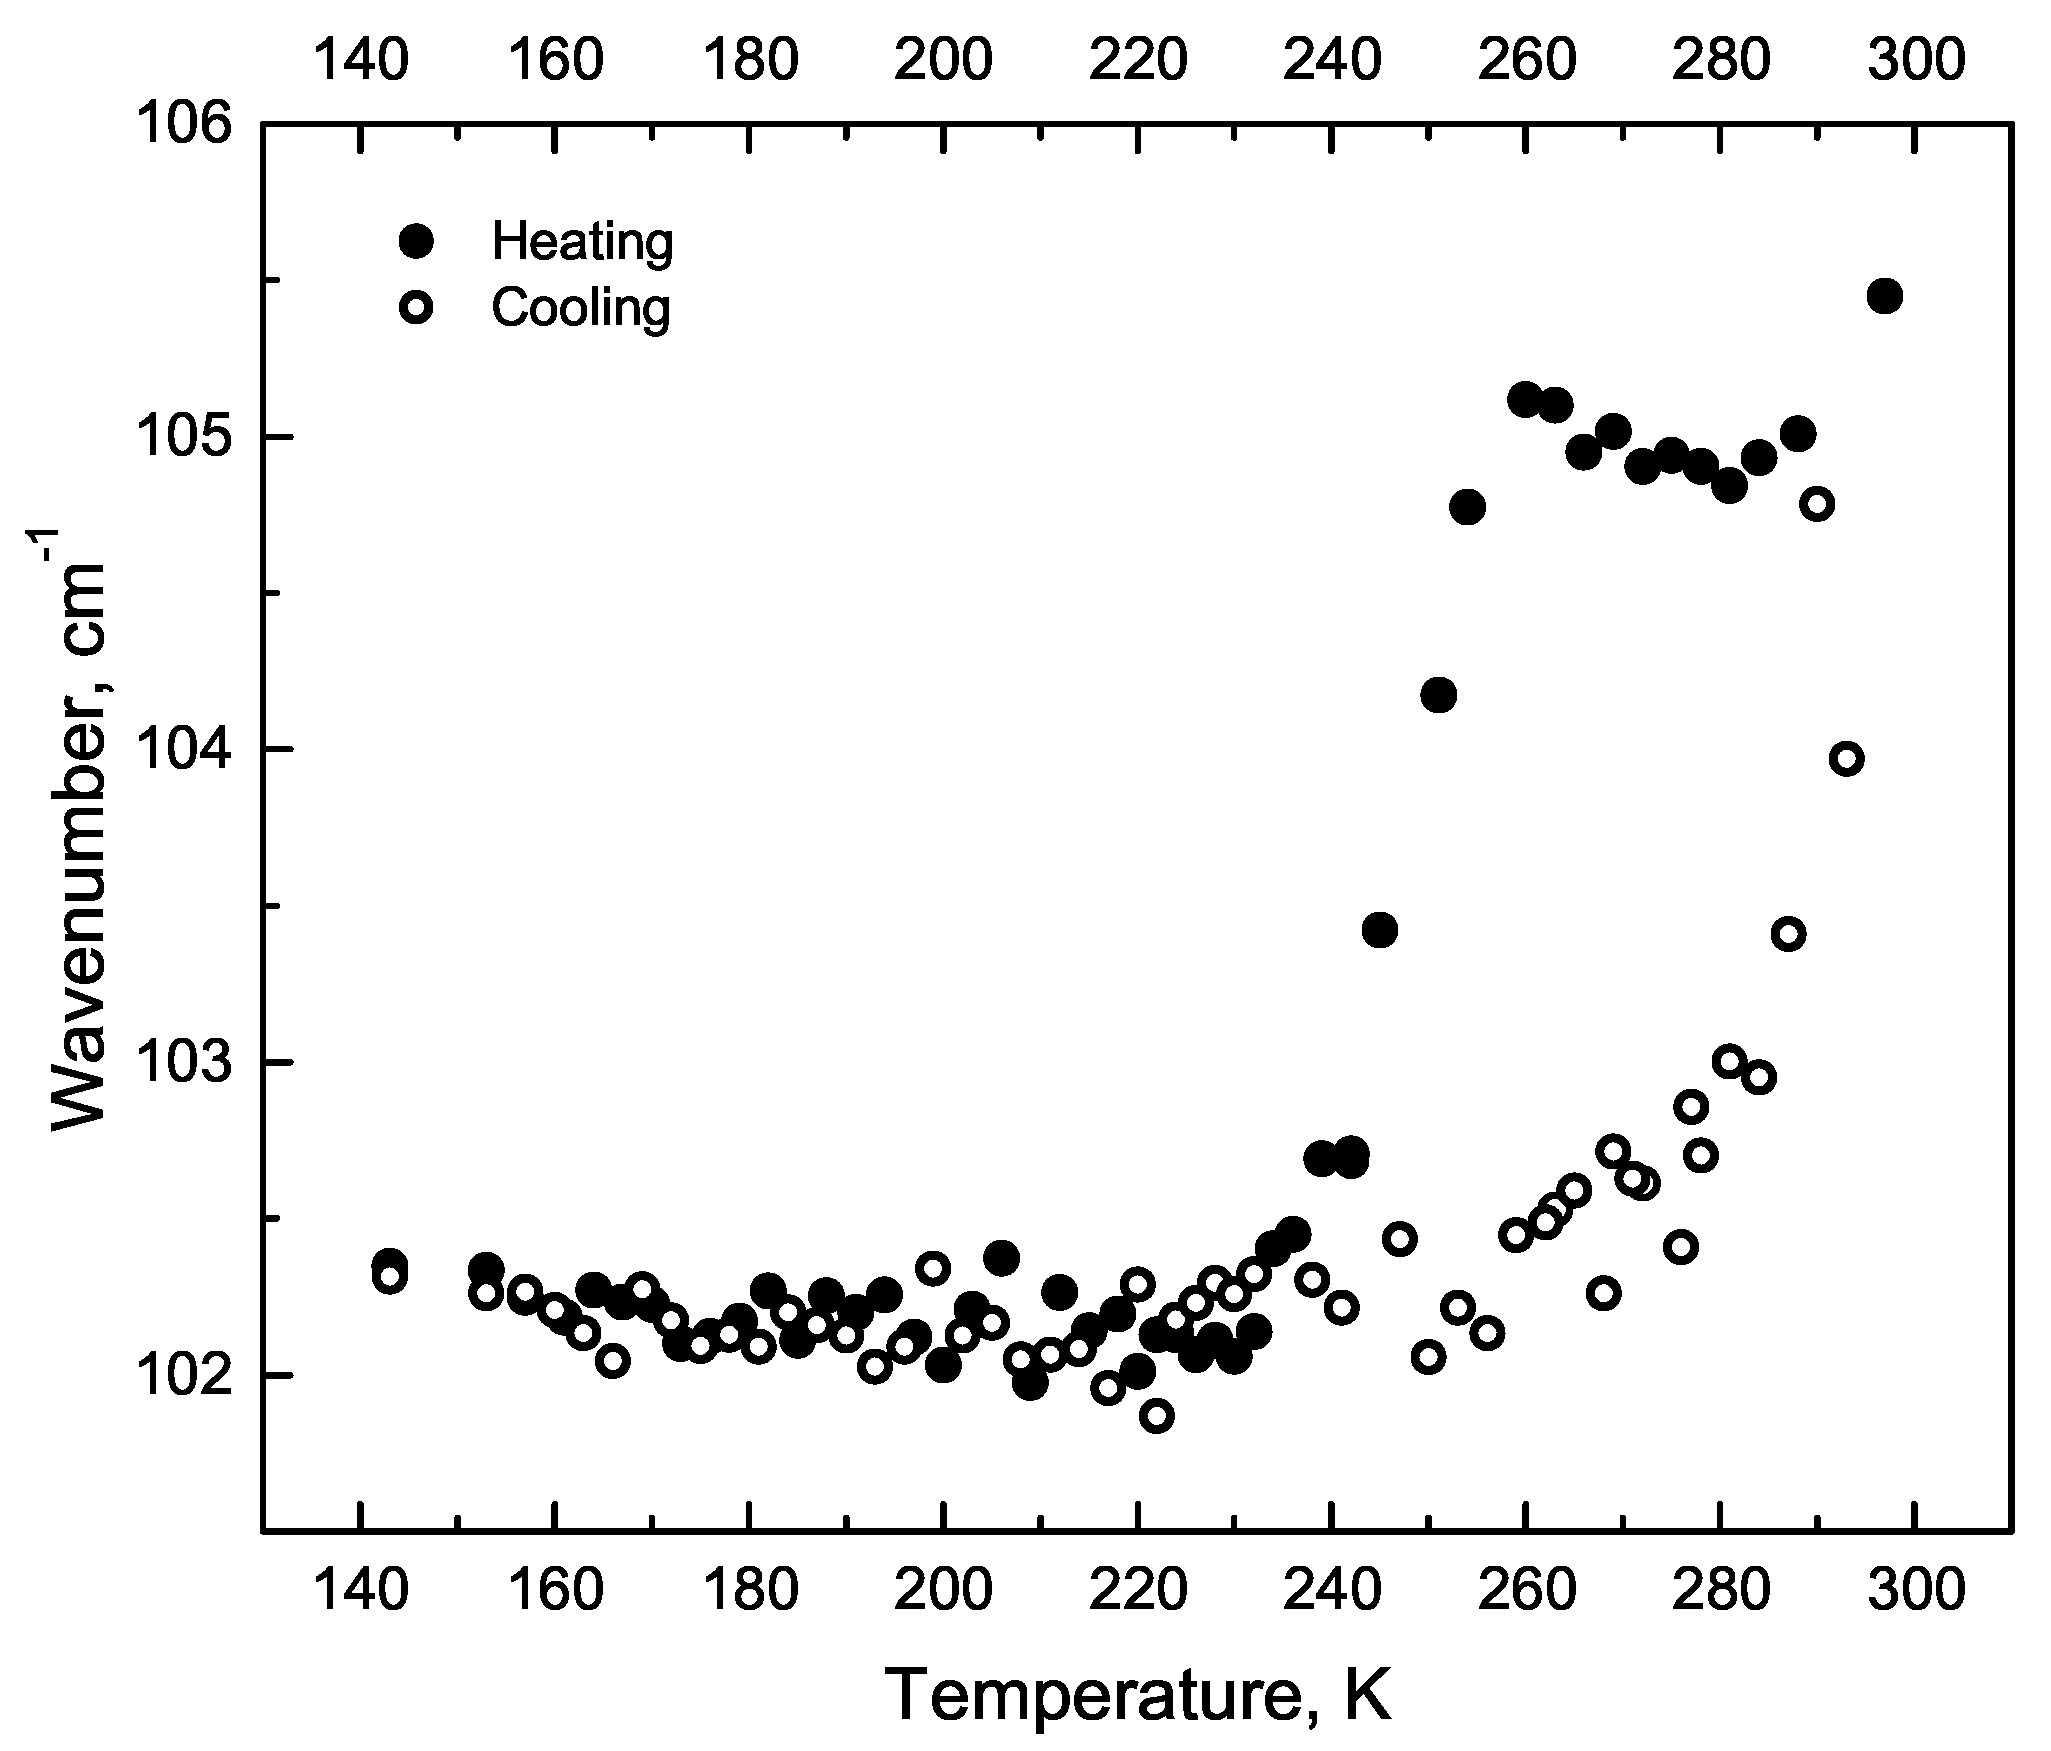
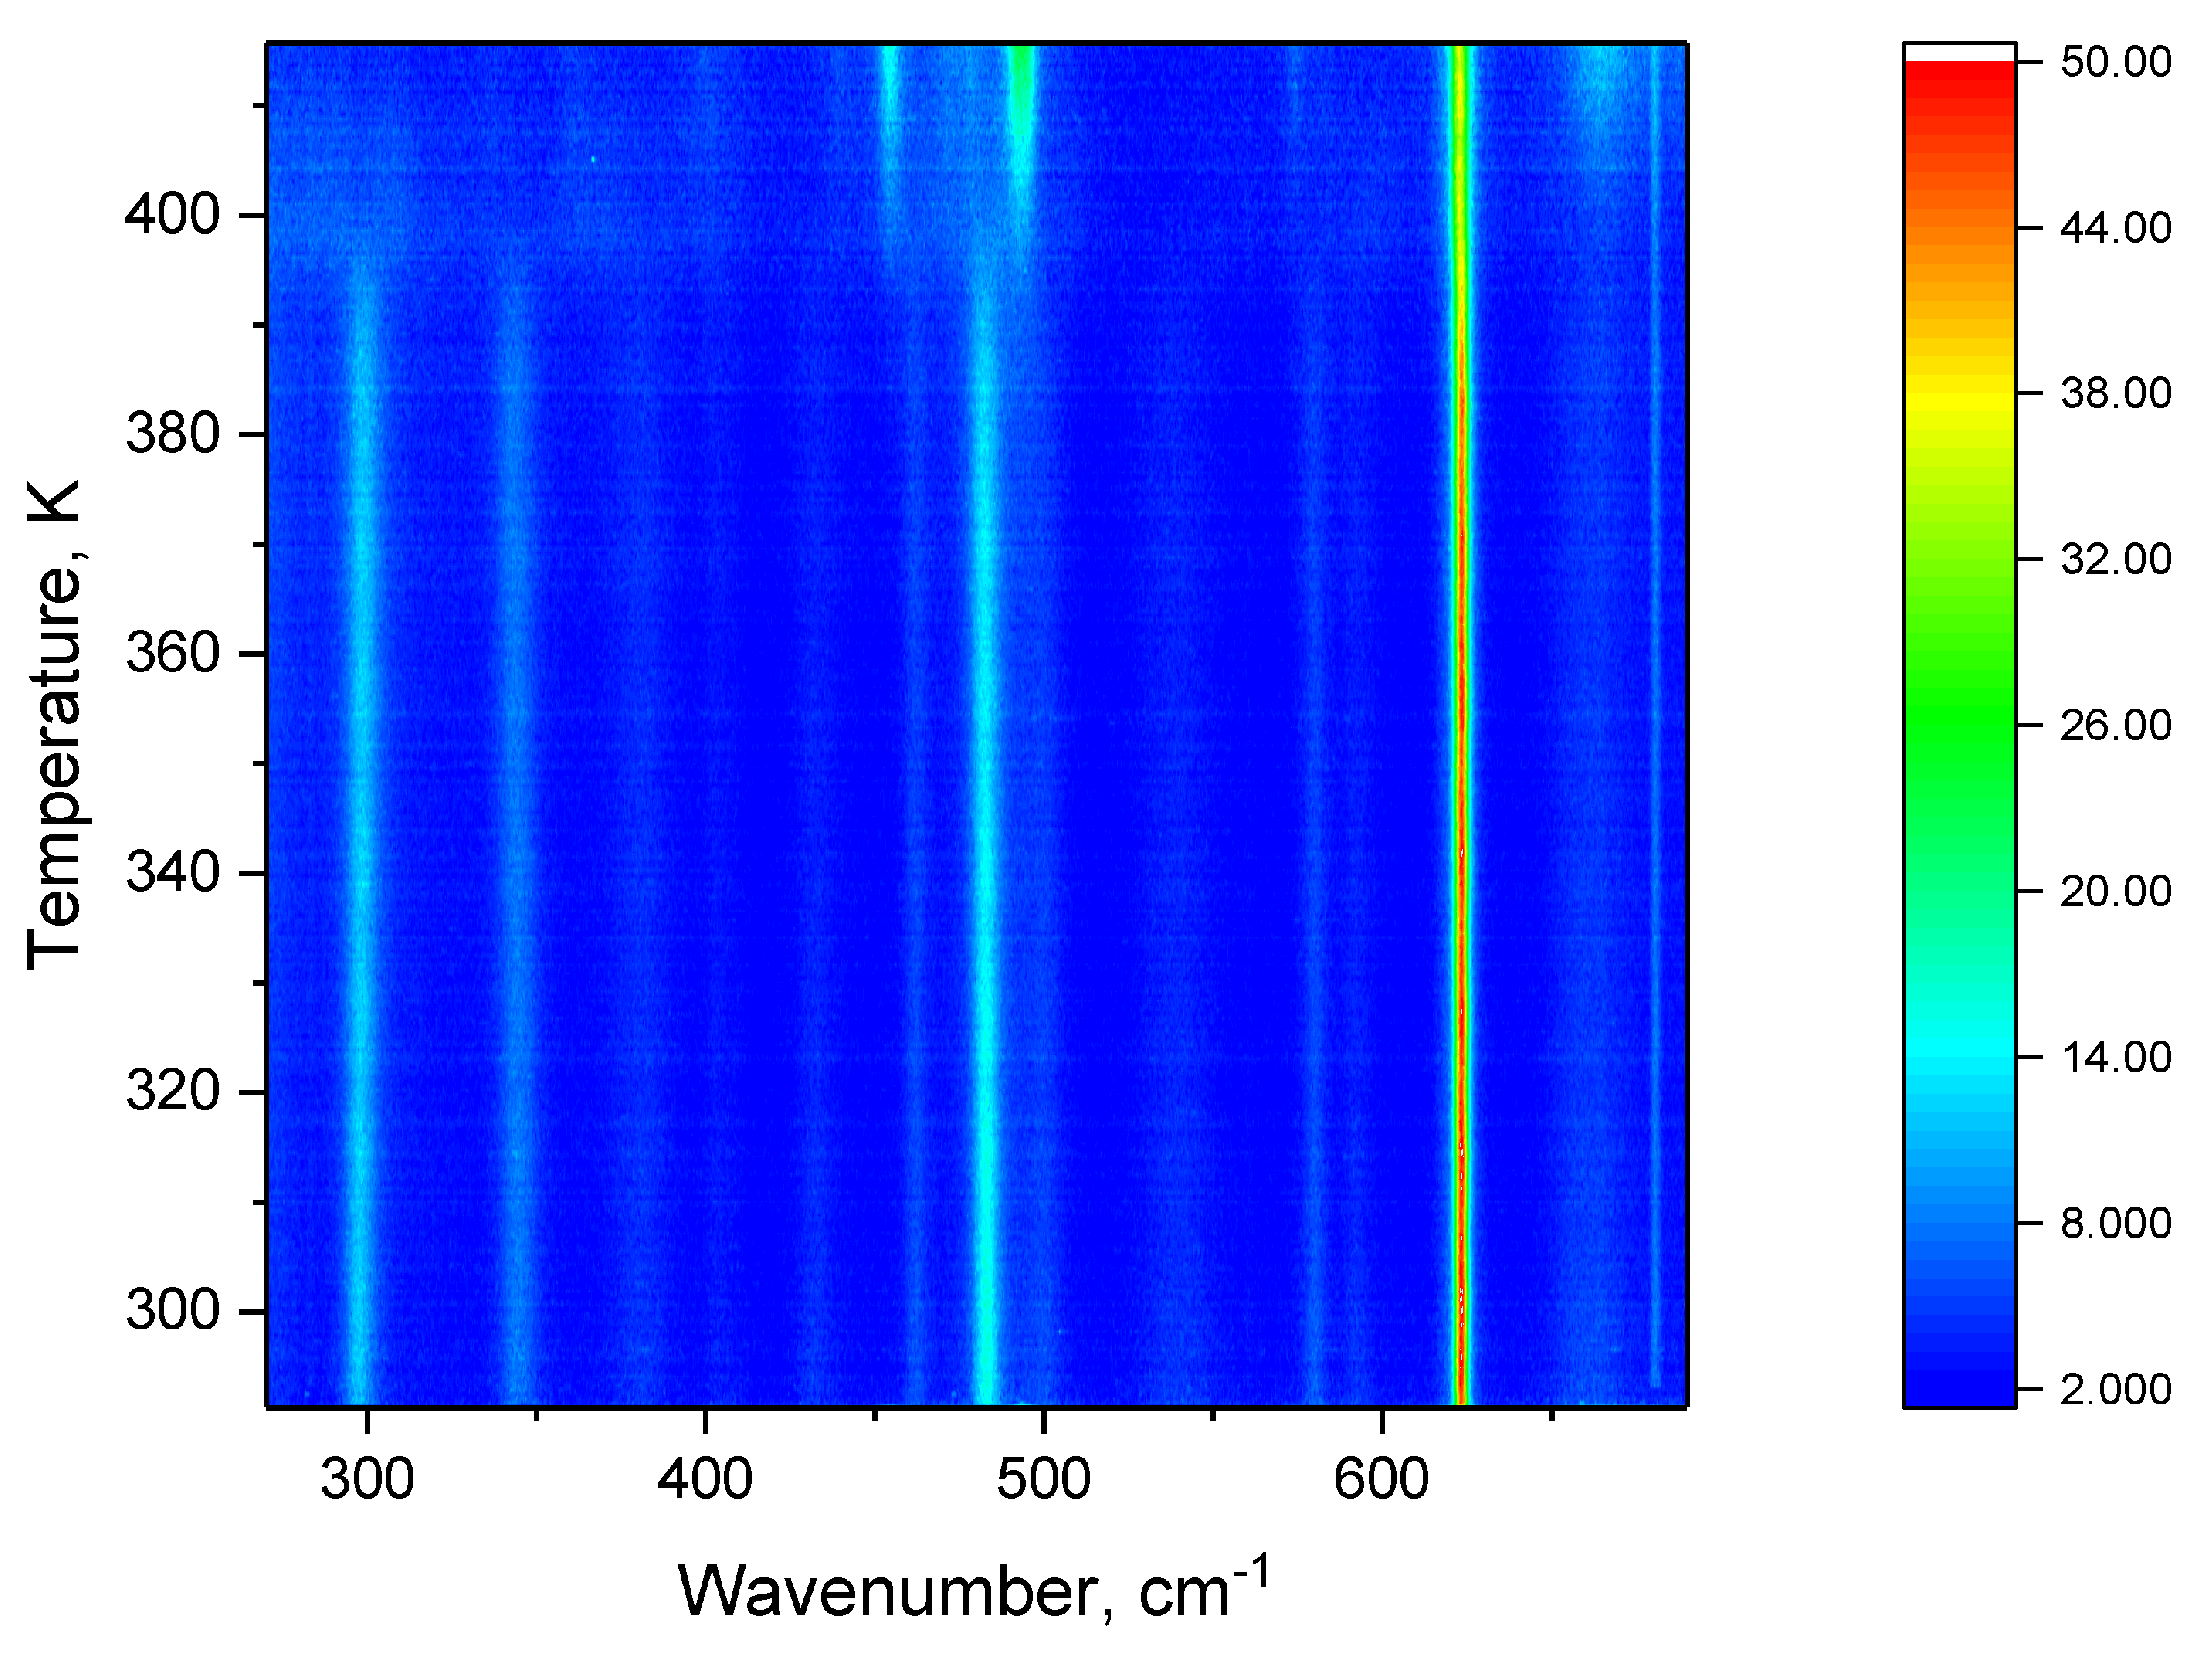
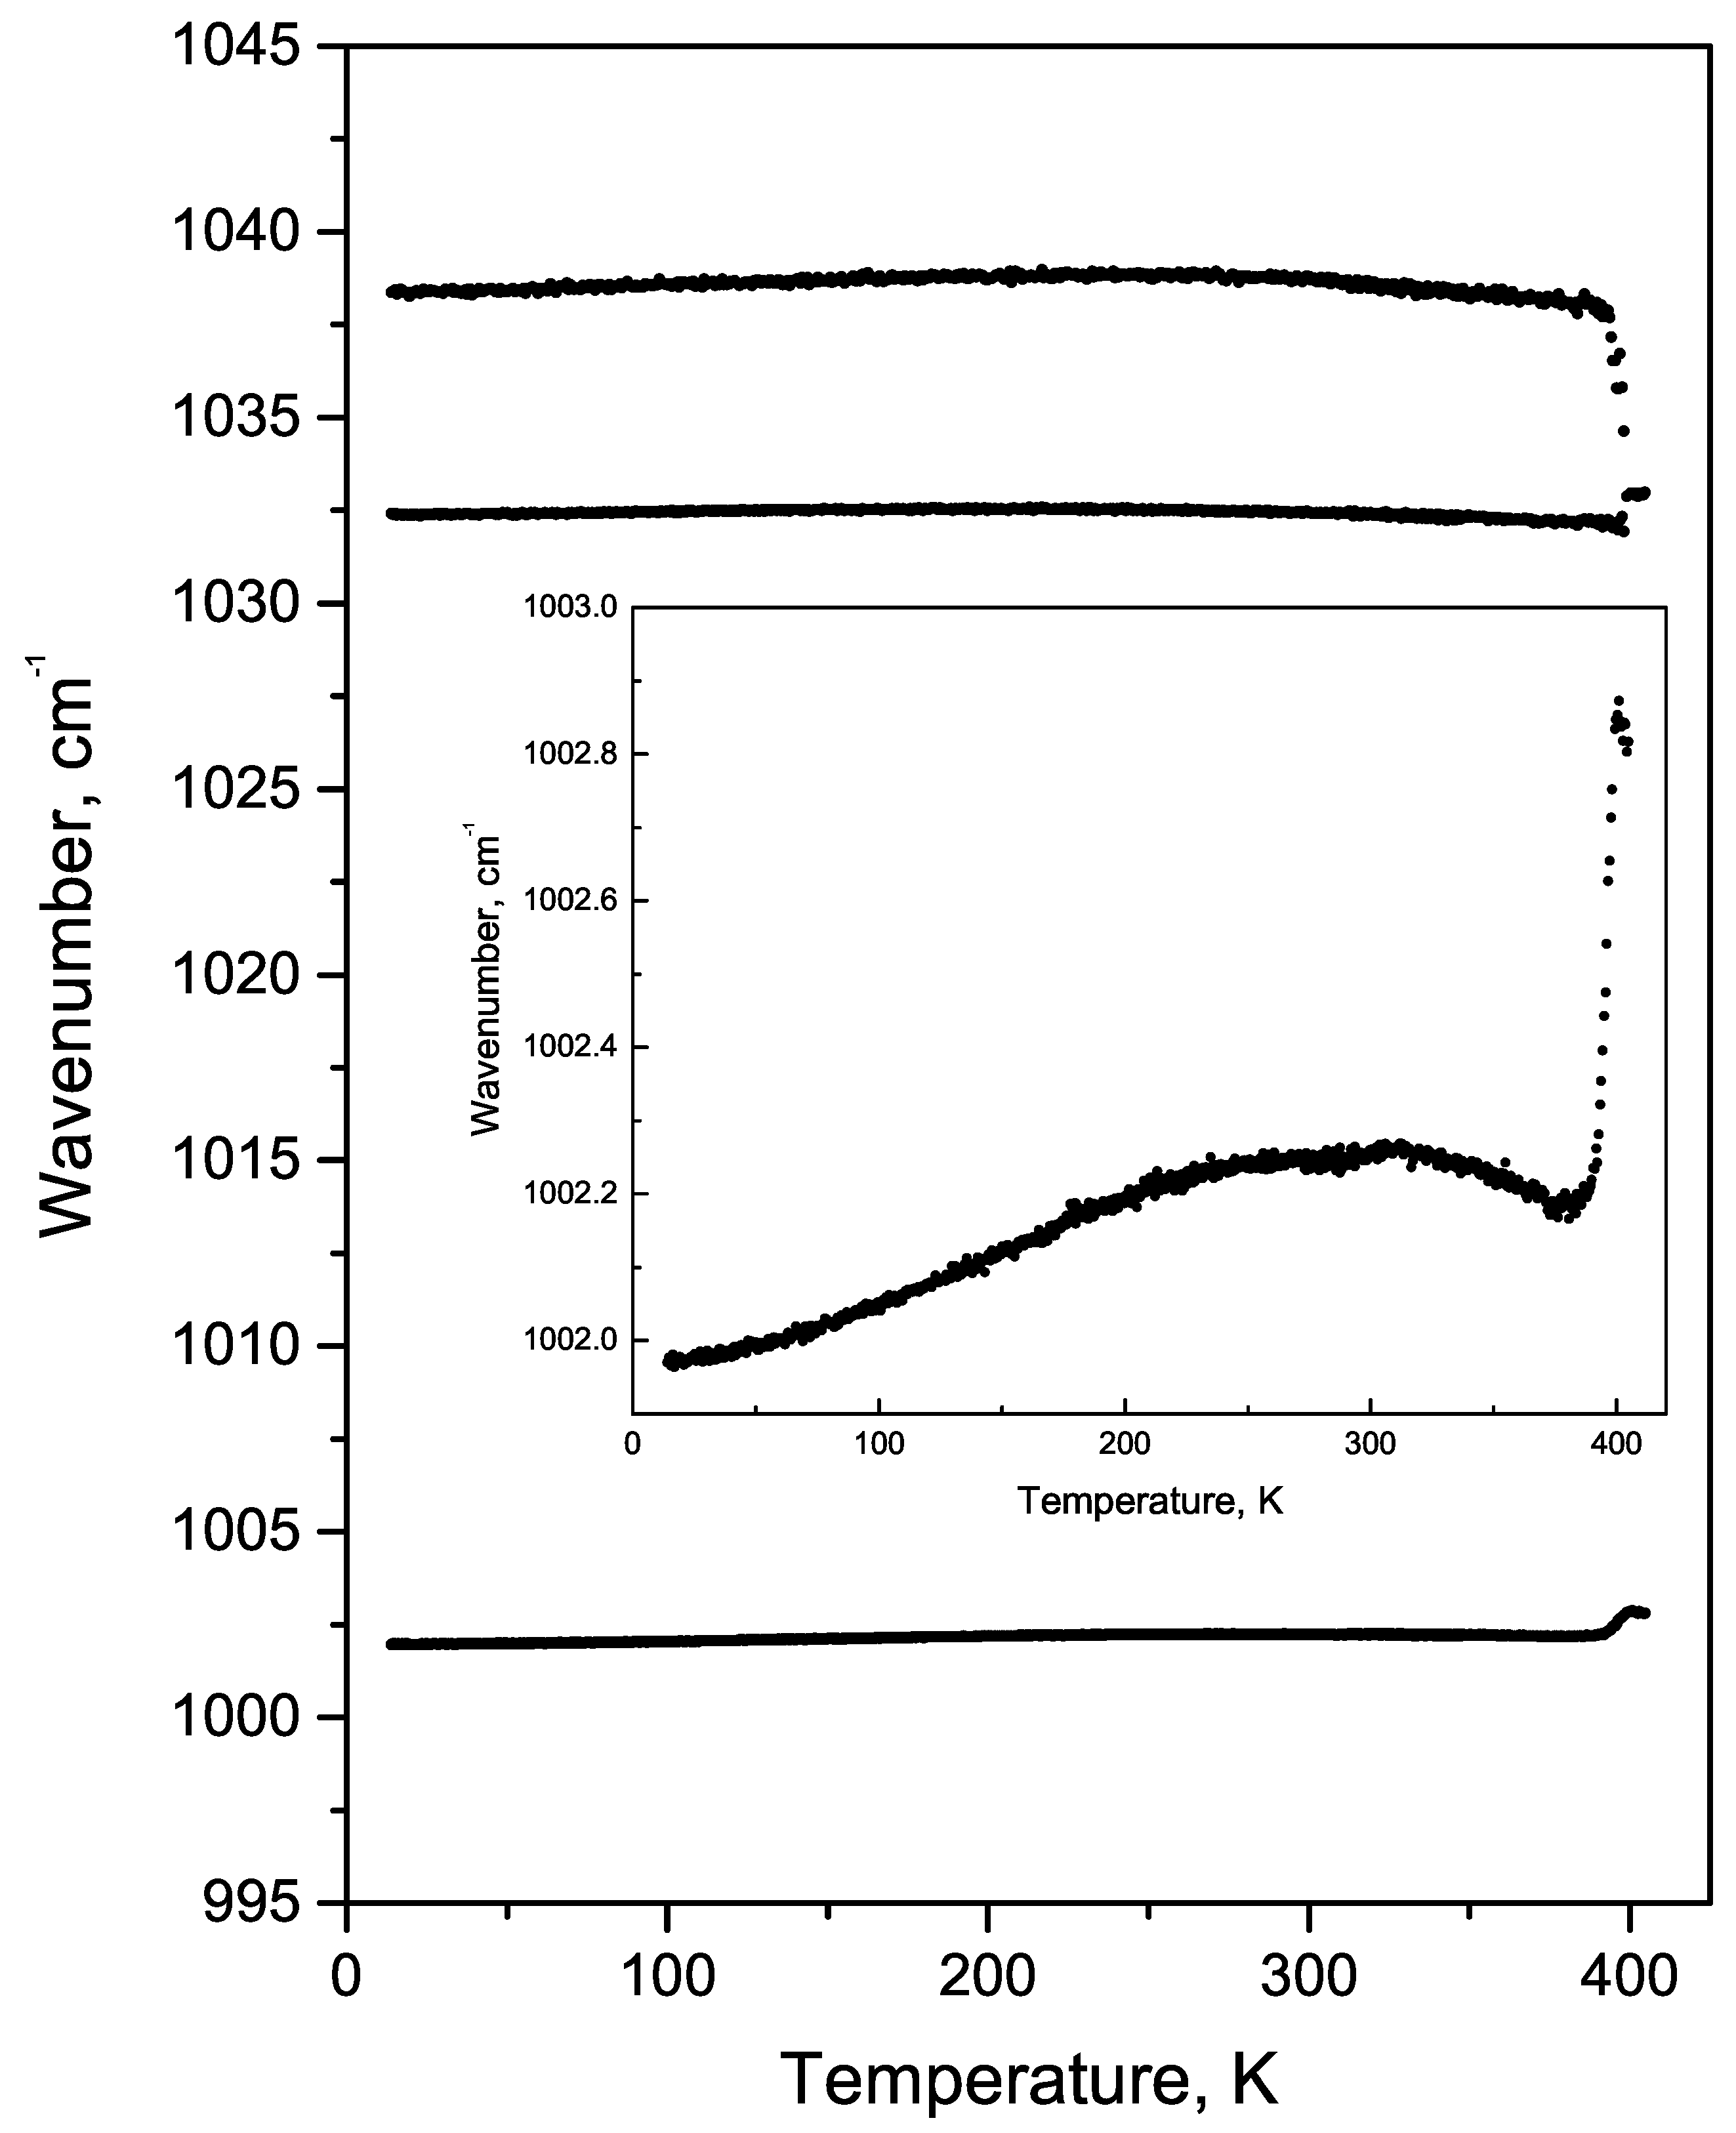
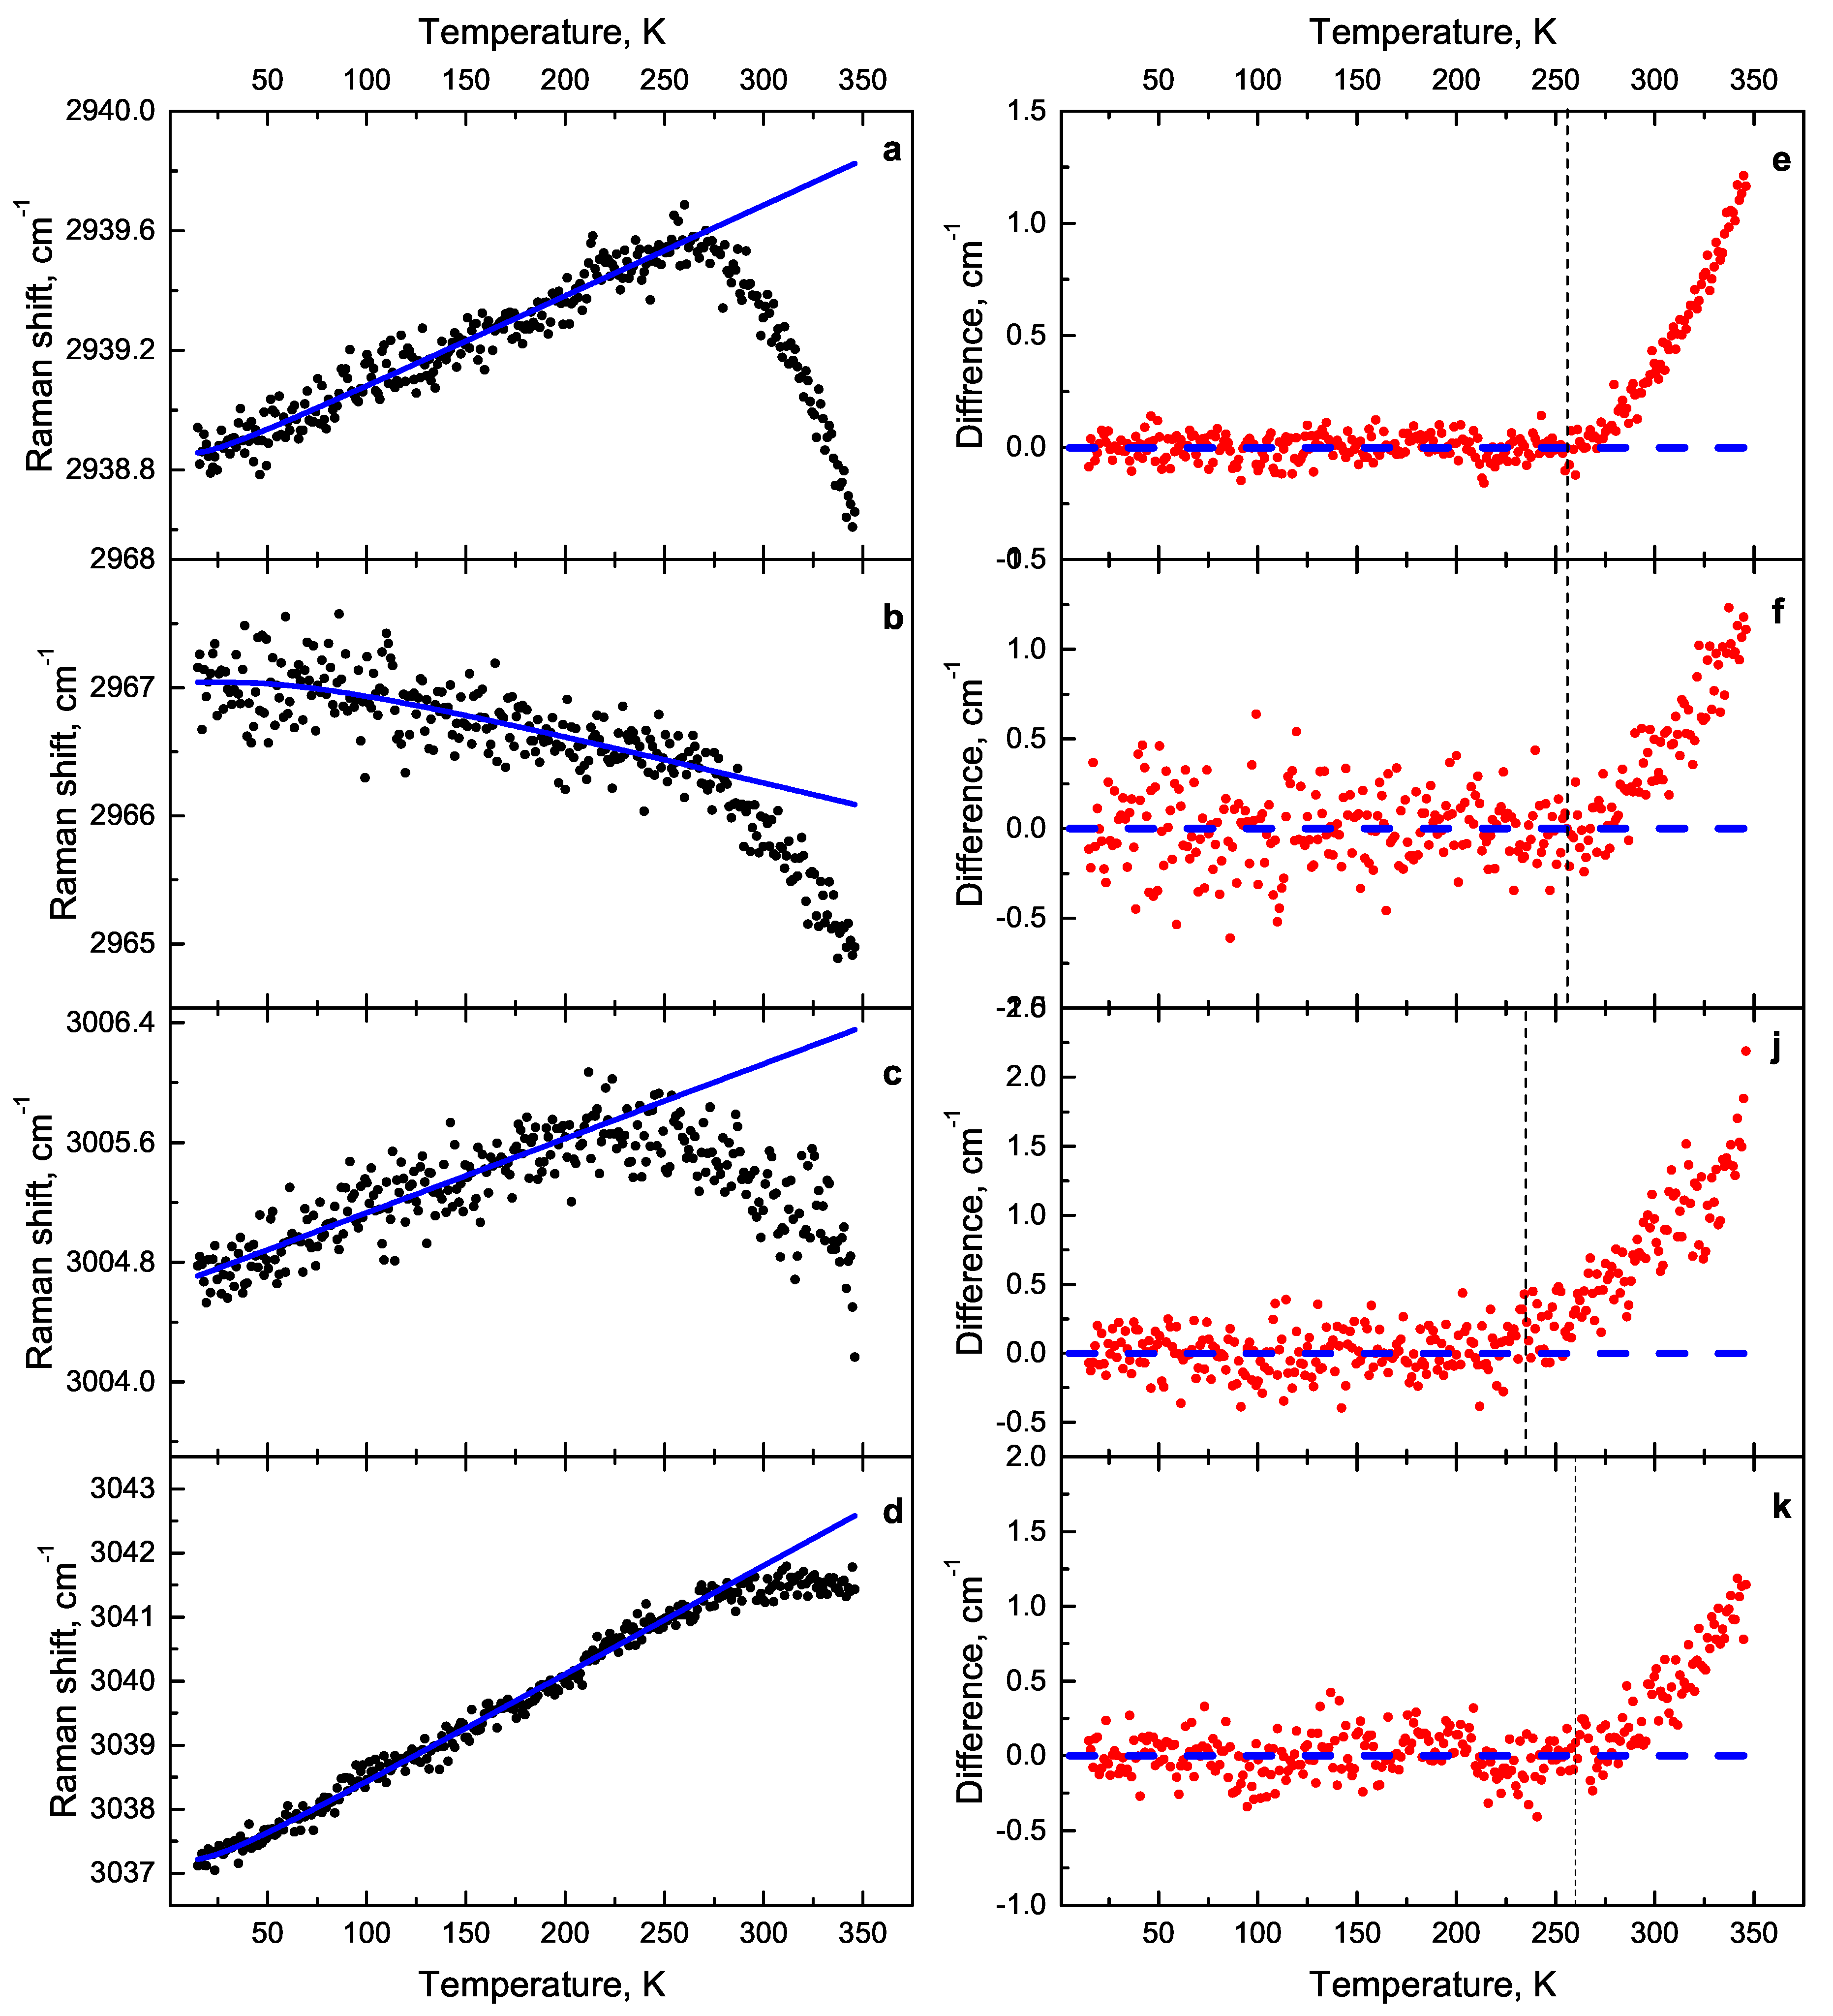
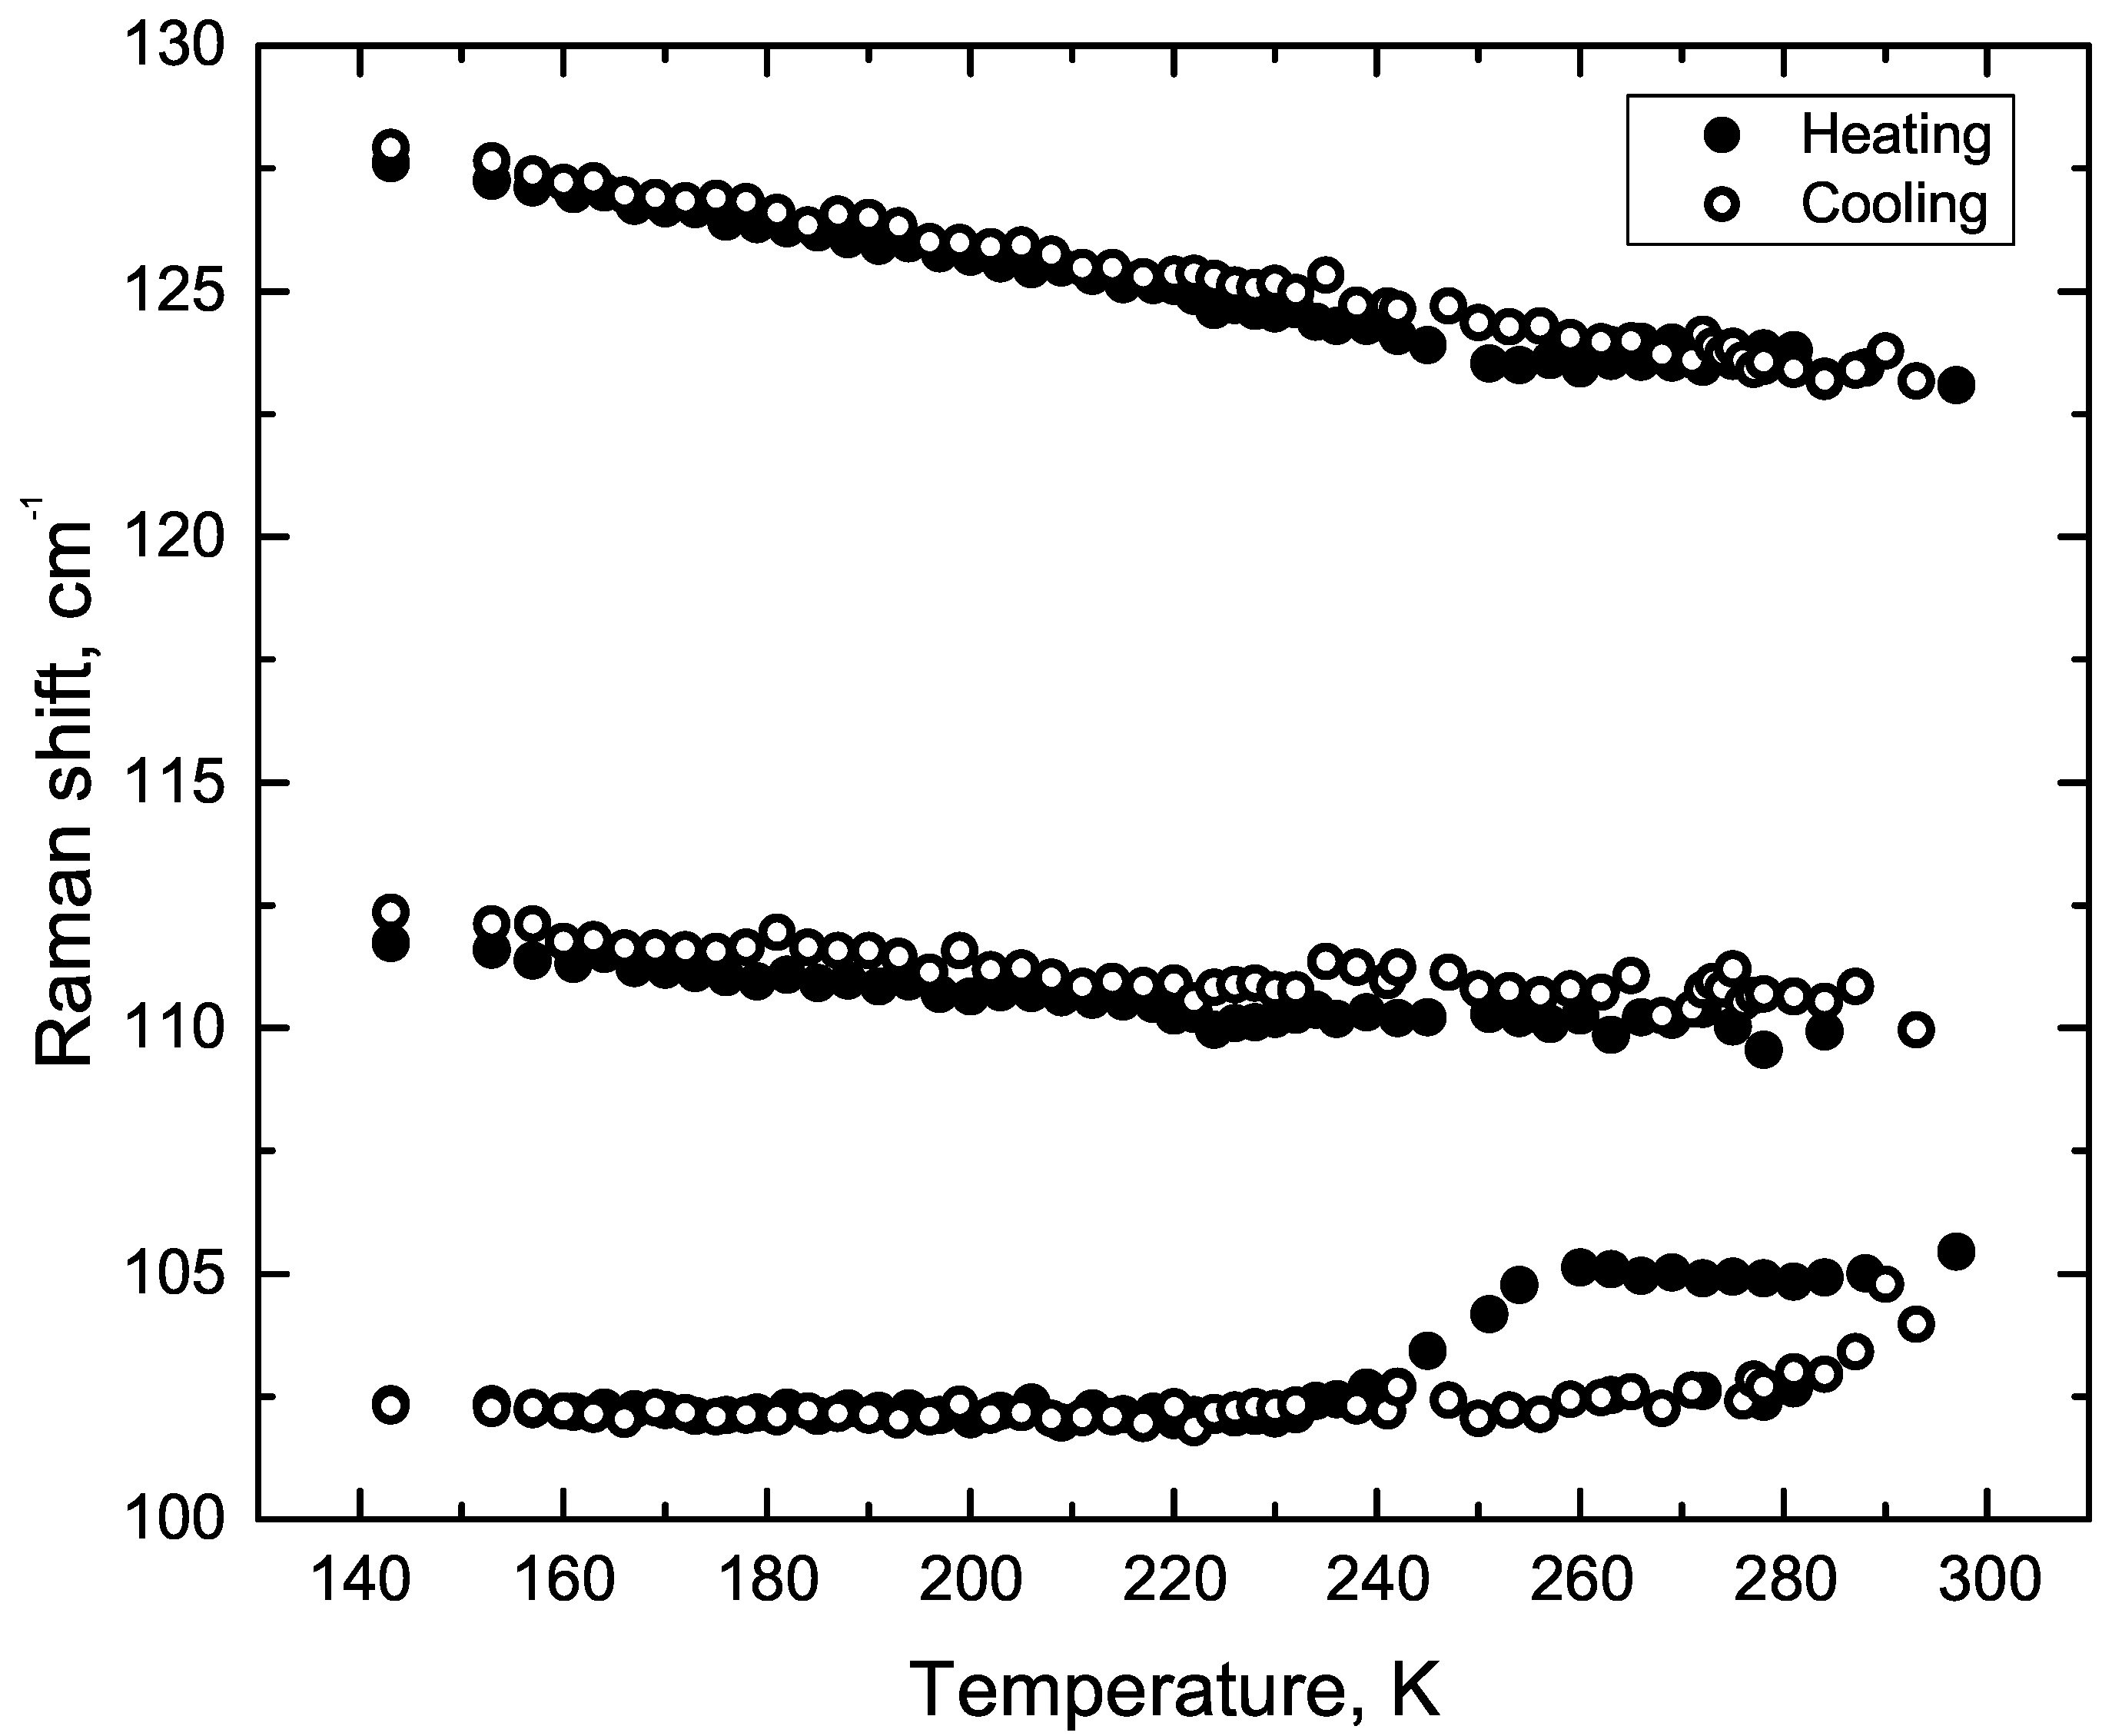
3.3. The Irreversible Phase Transition

The experiments were carried out during heating and cooling in the temperature range from 290 K to 420 K to study the effects passing in the region of an irreversible phase transition. In the region of lattice vibrations, all modes change the temperature behaviour upon transition near 398 K. With temperature increasing, some lines expand and merge into a single contour in the vicinity of the phase transition (Figure 13a). After the phase transition, the sample was cooled. The intensity map of the lattice vibration is shown in Figure 13b. The picture does not repeat when heated and cooled. The number of lines during cooling after the transition increased. This fact indicates that the phase changed during the transition of 398 K.
The mid-wavenumber region (Figure 7a) due to vibrations of such functional groups of FF molecules as phenyl rings and amide groups. The sharp changes associated with structural phase transition at 398 K were observed in the mid-frequency spectral region (Figure 8). However, after passing 398 K and further cooling, the single 500, 620 cm 1 lines are split (Figure 14b,c).
The temperature behaviour of the position and width of the phenyl rings breathing mode of the phenyl ring when heating and cooling is different (Figure 15). The behaviour of the width of this line also changes. One can see the irreversible phase transition is well observable on the range of 14 K, beginning at 384 K. The transition becomes irreversible after 398 K and it remains reversible if the critical temperature was not reached. After passing the temperature of 403 K during cooling, the line width of 1002 cm 1 behaves differently than when heated to the passage of the point of no return (398 K).
The behaviour of high-frequency vibration modes near 398 K is shown in Figure 16. It is reasonable to suggest that water molecules affected 2920, 2938, 2966 cm 1 C-H stretching vibrations. Therefore, water evaporation observed at 398 K leads to the frequency shift of these vibrations. We observe the gradual shift of the 3069 cm 1 line corresponding to stretching of NH groups at higher temperatures. Two lines 2926 cm 1 and 2939 cm 1 appear at a temperature of 412 K. We associate these structural changes at 420 K with the previously observed cyclization of FF molecules [30]. Cooling the FF microtube after reversible phase transition leads to the change of some line positions and the temperature dependence (Figure 16b). The line at 2910 cm 1 appeared at 398 K, disappeared at 412 K and did not appear after cooling.

4. Conclusions

In summary, after the rigorous analysis of the temperature behaviour of the Raman spectra of diphenylalanine microtubes, we found several temperature-dependent spectral anomalies.
The spectral anomalies are observed at temperatures of 398 K and 412 K. The spectra after passing through the temperature above 398 K change significantly and are not restored upon cooling. The transition is thus irreversible. The mechanism and processes occuring at the phase transition, are related to rather small changes in diphenylalanine structure causing the modifications of the phenyl–phenyl interaction region in Raman spectra at 398 K. Evaporation of water at 398 K leads to significant and irreversible changes in the crystal lattice. The appearance of new lines in the C−H stretching region at a temperature of 412 K has been associated with the previously observed cyclization of FF molecules.
The temperature behaviour of the spectral lines in the region of lattice vibrations indicates the changes in diphenylalanine microtubes at temperatures of 178 K, 235 K, 255 K, 278 K, 296 K and 398 K. The spectral anomalies are observed at temperatures of 235 K, 255–258 K in the C−H stretching modes region. The observed temperature anomalies do not extend to the entire spectral region. They are concentrated in the area of vibration of certain molecular groups. Some anomalies may be associated with changes in the state of water inside a microtube. However, to confirm this assumption, further temperature studies in diphenylalanine microtubes by other methods are necessary.

Author Contributions

Data curation, A.K. (Aleksandr Krylov) and A.V.; Formal analysis, S.K. (Svetlana Krylova); Investigation, A.K. (Alexander Krylov), S.K. (Svetlana Krylova), S.K. (Svitlana Kopyl), F.S. and P.Z.; Methodology, A.V.; Resources, S.K. (Svitlana Kopyl) and A.K. (Andrei Kholkin); Software, A.K. (Aleksandr Krylov); Supervision, A.K. (Alexander Krylov) and A.K. (Andrei Kholkin); Visualization, A.K. (Alexander Krylov) and S.K. (Svetlana Krylova); Writing—original draft, A.K. (Alexander Krylov), S.K. (Svetlana Krylova) and A.K. (Andrei Kholkin); Writing—review & editing, A.K. (Alexander Krylov), S.K. (Svitlana Kopyl), F.S., P.Z., A.V. and A.K. (Andrei Kholkin). All authors have read and agreed to the published version of the manuscript.

Funding

This research was funded by the Russian Foundation for Basic Research grant number 18-02-00754, F.S. thanks Scientific and Technological Research Council of Turkey for support under Grant Number 115F227. S.Kopyl and A.Kholkin thank the joint project Portugal-Turkey TUBITAK/0006/2014. This work was developed within the scope of the project CICECO-Aveiro Institute of Materials, refs. UIDB/50011/2020 & UIDP/50011/2020, financed by national funds through the FCT/MEC. S.Kopyl, P.Z. and A.Kholkin were partly supported by FCT (Portugal) through the project “BioPiezo”- PTDC/CTM–CTM/31679/2017 (CENTRO-01-0145-FEDER-031679). Part of this work was funded by national funds (OE), through FCT—Fundação para a Ciência e a Tecnologia, I.P., in the scope of the framework contract foreseen in the numbers 4, 5, and 6 of the article 23, of the Decree-Law 57/2016, of 29 August, changed by Law 57/2017, of 19 July.

Acknowledgments

The Raman experiments were performed in the Krasnoyarsk Regional Center of Research Equipment of Federal Research Center “Krasnoyarsk Science Center SB RAS”. Authors are grateful to I. Nemtsev for the SEM investigation.

Conflicts of Interest

The authors declare no conflict of interest.

Abbreviations

The following abbreviations are used in this manuscript:
FWHMfull width at half maximum
FFdiphenylalanine

Appendix A

Figure A1. (a) SEM images of agglomerated FF microtubes. The inset shows magnified image of FF microtube with hexagonal shape and internal hole. (b) Optical image of single microtube for polarised temperature investigation.
Crystals 10 00224 g0a1
We used the Lorentz function to deconvolute spectra and the amplitude, position of the line center and width were calculated for each line. The aromantic ring breathing is one the strongest line in the spectra. Therefore, the spectral parameters of this line can be obtained very accurately. All points of the spectral shape were used to obtain a line position by peak fitting. The number of points was more than 120 per spectral shape on average. The approximation can give us more than ten times better results in the position of lines center then coverage of a single CCD pixel [18]. In the above experiments, the uncertainty in the line position achieved better than 0.05 cm 1 (to prove this, we carried out measurements for a sequential series of spectra with temperature stabilization, see Figure A2).
Figure A2. Time stability of the Raman line of (a) aromatic ring breathing mode (1002 cm 1 ) and (b) its full width at 15 K.
Crystals 10 00224 g0a2
Table A1. Raman tensor for a self-assembled diphenylalanine nanotube.
A ( z ) 1 E 1 ( x ) 2 E 1 ( y ) 1 E 2 1 E 2
a 0 0 0 a 0 0 0 b 0 0 c 0 0 d c d 0 0 0 d 0 0 c d c 0 e f 0 f e 0 0 0 0 f e 0 e f 0 0 0 0
Table A2. Selection rules for backscattering geometry. Geometries used in this work are highlighted in bold.
Geom. 1 E 1 (LO) 1 E 1 (TO) 1 E 2 2 E 1 (LO) 2 E 1 (TO) 2 E 2 A(LO)A(TO)
−X(YY)X x x x
−X(YZ)Xx x
−X(ZZ)X x
−Y(XX)Y x x x
−Y(XZ)Y x x
−Y(ZZ)Y x
−Z(XX)Z x xx
−Z(XY)Z x x
−Z(YY)Z x xx
Table A3. Selection rules for right angle scattering geometry.
Geom. 1 E 1 (LO + TO) 1 E 1 (TO) 1 E 2 2 E 1 (LO + TO) 2 E 1 (TO) 2 E 2 A(LO + TO)A(TO)
X(YY)Z x xx
X(YZ)Yx x
X(ZZ)Y x
Y(XX)Z x xx
Y(XY)X x x
Y(XY)Z x x x
Y(XZ)Xx x
Z(XY)X x x
Z(XZ)Xx x
Z(XZ)Y x x
Z(YZ)Xx x
Z(YZ)Y x x
Figure A3. The temperature behaviour of line positions from 100 to 130 cm 1 region: heating and cooling from 140 up to 300 K.
Crystals 10 00224 g0a3

References

  1. Adler-Abramovicha, L.; Ehud Gazit, E. The physical properties of supramolecular peptide assemblies: From building block association to technological applications. Chem. Soc. Rev. 2014, 43, 6881–6893. [Google Scholar] [CrossRef] [Green Version]
  2. Adler-Abramovich, L.; Aronov, D.; Beker, P.; Yevnin, M.; Stempler, S.; Buzhansky, L.; Rosenman, G.; Gazit, E. Self-assembled arrays of peptide nanotubes by vapour deposition. Nat. Nanotechnol. 2009, 4, 849–854. [Google Scholar] [CrossRef] [PubMed]
  3. Kholkin, A.; Amdursky, N.; Bdikin, I.; Gazit, E.; Rosenman, G. Strong Piezoelectricity in Bioinspired Peptide Nanotubes. ACS Nano 2010, 4, 610–614. [Google Scholar] [CrossRef] [PubMed]
  4. Esin, A.; Baturin, I.; Nikitin, A.; Vasilev, T.; Salehli, F.; Shur, V.; Kholkin, A. Pyroelectric effect and polarization instability in self-assembled diphenylalanine microtubes. Appl. Phys. Lett. 2016, 109, 142902. [Google Scholar] [CrossRef]
  5. Da Silva Filho, J.G.; Mendes Filho, J.; Melo, F.E.A.; Lima, J.A.; Freire, P.T.C. Raman spectroscopy of l,l-diphenylalanine crystal under high pressure. Vib. Spectrosc. 2017, 92, 173–181. [Google Scholar] [CrossRef]
  6. Krylov, A.; Krylova, S.; Kopyl, S.; Kholkin, A. Non-hydrostatic pressure-induced phase transitions in self-assembled diphenylalanine microtubes. Tech. Phys. 2018, 63, 1311–1315. [Google Scholar] [CrossRef]
  7. Bosne, E.D.; Heredia, A.; Kopyl, S.; Karpinsky, D.V.; Pinto, A.G.; Kholkin, A.L. Piezoelectric resonators based on self-assembled diphenylalanine microtubes. Appl. Phys. Lett. 2013, 102, 073504. [Google Scholar] [CrossRef]
  8. Nuraeva, A.; Vasilev, S.; Vasileva, D.; Zelenovskiy, P.; Chezganov, D.; Esin, A.; Kopyl, S.; Romanyuk, K.; Shur, V.; Kholkin, A. Evaporation-Driven Crystallization of Diphenylalanine Microtubes for Microelectronic Applications. Cryst. Growth Des. 2016, 16, 1472–1479. [Google Scholar] [CrossRef]
  9. Ryan, K.; Beirne, J.; Redmond, G.; Kilpatrick, J.I.; Guyonnet, J.; Buchete, N.-V.; Kholkin, A.L.; Rodriguez, B.J. Nanoscale Piezoelectric Properties of Self-Assembled Fmoc–FF Peptide Fibrous Networks. ACS Appl. Mater. Interfaces 2015, 7, 12702–12707. [Google Scholar] [CrossRef]
  10. Vasilev, S.; Zelenovskiy, P.; Vasileva, D.; Nuraeva, A.; Shur, V.Y.; Kholkin, A.L. Piezoelectric properties of diphenylalanine microtubes prepared from the solution. J. Phys. Chem. Solids 2016, 93, 68–72. [Google Scholar] [CrossRef]
  11. Heredia, A.; Bdikin, I.; Kopyl, S.; Mishina, E.; Semin, S.; Sigov, A.; German, K.; Bystrov, V.; Gracio, J.; Kholkin, A.L. Temperature-driven phase transformation in self-assembled diphenylalanine peptide nanotubes. J. Phys. D Appl. Phys. 2010, 43, 462001. [Google Scholar] [CrossRef] [Green Version]
  12. Nuansing, W.; Rebollo, A.; Mercero, J.M.; Zuñigac, J.; Bittner, A.M. Vibrational spectroscopy of self-assembling aromatic peptide derivates. J. Raman Spectr. 2012, 43, 1397–1406. [Google Scholar] [CrossRef]
  13. Moshkina, E.; Krylova, S.; Gudim, I.; Molokeev, M.; Temerov, V.; Pavlovskiy, M.S.; Vtyurin, A.; Krylov, A. Gallium Composition-Dependent Structural Phase Transitions in HoFe3-xGax(BO3)4 Solid Solutions: Crystal Growth, Structure, and Raman Spectroscopy Study. Cryst. Growth Des. 2020, 20, 1058–1069. [Google Scholar] [CrossRef]
  14. Lerbret, A.; Affouard, F.; Bordat, P.; Hédoux, A.; Guinet, Y.; Descamps, M. Low-frequency vibrational properties of lysozyme in sugar aqueous solutions: A Raman scattering and molecular dynamics simulation study. J. Chem. Phys. 2009, 131, 245103. [Google Scholar] [CrossRef] [PubMed]
  15. Krylov, A.; Vtyurin, A.; Petkov, P.; Senkovska, I.; Maliuta, M.; Bon, V.; Heine, T.; Kaskel, S.; Slyusareva, E. Raman spectroscopy studies of the terahertz vibrational modes of a DUT-8 (Ni) metal–organic framework. Phys. Chem. Chem. Phys. 2017, 19, 32099–32104. [Google Scholar] [CrossRef] [Green Version]
  16. Ehrling, S.; Senkovska, I.; Bon, V.; Evans, J.D.; Petkov, P.; Krupskaya, Y.; Kataev, V.; Wulf, T.; Krylov, A.; Vtyurin, A.; et al. Crystal size versus paddle wheel deformability: Selective gated adsorption transitions of the switchable metal-organic frameworks DUT-8(Co) and DUT-8(Ni). J. Mater. Chem. A 2019, 7, 21459–21475. [Google Scholar] [CrossRef] [Green Version]
  17. Zelenovskiy, P.S.; Nuraeva, A.S.; Kopyl, S.; Arkhipov, S.G.; Vasilev, S.G.; Bystrov, V.S.; Gruzdev, D.A.; Waliczek, M.; Svitlyk, V.; Shur, V.Y.; et al. Chirality-Dependent Growth of Self-Assembled Diphenylalanine Microtubes. Cryst. Growth Des. 2019, 19, 6414–6421. [Google Scholar] [CrossRef]
  18. Krylov, A.S.; Kolesnikova, E.M.; Isaenko, L.I.; Krylova, S.N.; Vtyurin, A.N. Measurement of Raman-Scattering Spectra of Rb2KMoO3F3 Crystal: Evidence for Controllable Disorder in the Lattice Structure. Cryst. Growth Des. 2014, 14, 923–927. [Google Scholar] [CrossRef]
  19. Gorbitz, C.H. Nanotube Formation by Hydrophobic Dipeptides. Chem. Eur. J. 2001, 7, 5153–5159. [Google Scholar] [CrossRef]
  20. Rousseau, D.L.; Bauman, R.P.; Porto, S.P.S. Normal mode determination in crystals. J. Raman Spectr. 1981, 10, 253–290. [Google Scholar] [CrossRef]
  21. Heino, S. Vibrational analysis of l-alanine and deuterated analogs. J. Mol. Struct. B 1980, 63, 1–11. [Google Scholar]
  22. Wu, X.; Xiong, S.; Wang, M.; Shen, J.; Chu, P.K. Low-frequency Raman scattering of bioinspired self-assembled diphenylalanine nanotubes/microtubes. Opt. Express 2012, 20, 5119–5126. [Google Scholar] [CrossRef] [PubMed] [Green Version]
  23. Kolesov, B.A.; Boldyreva, E.V. Micro-conformational transitions in L-alanine single crystals revisited by low wavenumber Raman spectroscopy. J. Raman Spectr. 2011, 42, 696–705. [Google Scholar] [CrossRef]
  24. Ferreira, P.M.G.L.; Ishikawa, M.S.; Kogikoski, S., Jr.; Alves, W.A.; Martinho, H. Relaxation dynamics of deeply supercooled confined water in L,L-diphenylalanine micro/nanotubes. Phys. Chem. Chem. Phys. 2016, 18, 29681–29685. [Google Scholar] [CrossRef] [Green Version]
  25. Hernández, B.; Pflüger, F.; Kruglik, S.G.; Ghomi, M. Characteristic Raman lines of phenylalanine analyzed by a multiconformational approach. J. Raman Spectr. 2013, 44, 827–833. [Google Scholar] [CrossRef]
  26. Lekprasert, B.; Korolkov, V.; Falamas, A.; Chis, V.; Roberts, C.J.; Tendler, S.J.B.; Notinghe, I. Investigations of the Supramolecular Structure of Individual Diphenylalanine Nano- and Microtubes by Polarized Raman Microspectroscopy. Biomacromolecules 2012, 13, 2181–2186. [Google Scholar] [CrossRef]
  27. Ravikumar, B.; Rajaram, R.K.; Ramakrishnan, V. Raman and IR spectral studies of L-phenylalanine L-phenylalaninium dihydrogenphosphate and DL-phenylalaninium dihydrogenphosphate. J. Raman Spectr. 2006, 37, 597–605. [Google Scholar] [CrossRef]
  28. Ramaswamy, S.; Rajaram, R.K.; Ramakrishnan, V. Raman and IR spectral studies of D-phenylglycinium perchlorate. J. Raman Spectr. 2002, 33, 589–698. [Google Scholar] [CrossRef]
  29. Zelenovskiy, P.; Kornev, I.; Vasilev, S.; Kholkin, A. On the origin of the great rigidity of self-assembled diphenylalanine nanotubes. Phys. Chem. Chem. Phys. 2015, 17, 32126–32131. [Google Scholar] [CrossRef] [Green Version]
  30. Zelenovskiy, P.S.; Davydov, A.O.; Krylov, A.S.; Kholkin, A.L. Raman study of structural transformations in self-assembled diphenylalanine nanotubes at elevated temperatures. J. Raman Spectrosc. 2017, 48, 1401–1405. [Google Scholar] [CrossRef]
  31. Sereda, V.; Ralbovsky, N.M.; Vasudev, M.C.; Naik, R.R.; Lednev, I.K. Polarized Raman spectroscopy for determining the orientation of di-d-phenylalanine molecules in a nanotube. J. Raman Spectrosc. 2016, 47, 1056–1062. [Google Scholar] [CrossRef] [PubMed]
  32. Lekprasert, B.; Sedman, V.; Roberts, C.J.; Tedler, S.J.B.; Notingher, I. Nondestructive Raman and atomic force microscopy measurement of molecular structure for individual diphenylalanine nanotubes. Opt. Lett. 2010, 35, 4193–4195. [Google Scholar] [CrossRef] [PubMed]
  33. Wu, X.; Xiong, S.; Wang, M.; Shen, J.; Chu, P.K. Water-Sensitive High-Frequency Molecular Vibrations in Self-Assembled Diphenylalanine Nanotubes. J. Phys. Chem. C 2012, 116, 9793–9799. [Google Scholar] [CrossRef]
  34. Amdursky, N.; Beker, P.; Koren, I.; Bank-Srour, B.; Mishina, E.; Semin, S.; Rasing, T.; Rosenberg, Y.; Barkay, Z.; Gazit, E.; et al. Structural Transition in Peptide Nanotubes. Biomacromolecules 2011, 12, 1349–1354. [Google Scholar] [CrossRef] [PubMed]
  35. Ziganshin, M.A.; Gerasimov, A.V.; Ziganshina, S.A.; Gubina, N.S.; Abdullina, G.R.; Klimovitskii, A.E.; Gorbatchuk, V.V.; Bukharaev, A.A. Thermally induced diphenylalanine cyclization in solid phase. J. Therm. Anal. Calorim. 2016, 125, 905–912. [Google Scholar] [CrossRef]
  36. Andrade-Filho, T.; Martins, T.C.; Ferreira, F.F.; Alves, W.A.; Rocha, A.R. Water-driven stabilization of diphenylalanine nanotube structures. Theor. Chem. Acc. 2016, 135, 185. [Google Scholar] [CrossRef] [Green Version]
  37. Kolesov, B.A. How the vibrational frequency varies with temperature. J. Raman Spectrosc. 2017, 48, 323–326. [Google Scholar] [CrossRef]
  38. Kolesov, B.A. Experimental determination of vibrational anharmonic contributions. J. Raman Spectrosc. 2013, 44, 1786–1788. [Google Scholar] [CrossRef]
  39. Debernardi, A. Anharmonic effects in the phonons of III–V semiconductors: First principles calculations. Sol. State Com. 2000, 113, 1–10. [Google Scholar] [CrossRef]
  40. Lucazeau, G. Effect of pressure and temperature on Raman spectra of solids: Anharmonicity. J. Raman Spectrosc. 2003, 34, 478–496. [Google Scholar] [CrossRef]
  41. Klemens, P.G. Anharmonic decay of optical phonons. Phys. Rev. 1966, 148, 845–848. [Google Scholar] [CrossRef]
  42. Balkanski, M.; Wallis, R.F.; Haro, E. Anharmonic effects in light scattering due to optical phonons in silicon. Phys. Rev. B 1978, 28, 1928–1934. [Google Scholar] [CrossRef]
  43. Menendez, J.; Cardona, M. Temperature dependence of the first-order Raman scattering by phonons in Si, Ge, and a-Sn: Anharmonic effects. Phys. Rev. B 1984, 29, 2051–2059. [Google Scholar] [CrossRef]
Figure 1. Structure of D-diphenylalanine dipeptide (H-D–Phe–D–Phe-OH, FF) microtube: in grey—carbon, in white—hydrogen, in red—oxygen, in violet—nitrogen. The cyan lines are hydrogen bonds between the atoms in the molecules belonging one cell. The red lines denote hydrogen bonds with atoms from neighbouring cells. C axis is perpendicular to the plane of the figure.
Crystals 10 00224 g001
Figure 2. Directions of crystallographic axes in FF microtube.
Crystals 10 00224 g002
Figure 3. Full unpolarised Raman spectra at 14 and 345 K.
Crystals 10 00224 g003
Figure 4. Transformation of polarised Raman spectra of FF single microtube with temperature in the low-wavenumber region: a, b, c - different components of the Raman tensor.
Crystals 10 00224 g004
Figure 5. The behaviour of 17 cm 1 and 26 cm 1 lines: (a) transformation, (b) ratio of integral intensities.
Crystals 10 00224 g005
Figure 6. The line position hysteresis dependence on temperature.
Crystals 10 00224 g006
Figure 7. Raman spectra of FF microtube in different geometries: (a) 200 cm 1 –1800 cm 1 region, (b) 2800 cm 1 –3400 cm 1 region.
Crystals 10 00224 g007
Figure 8. Intensity map during heating in the mid-frequency range.
Crystals 10 00224 g008
Figure 9. The temperature behaviour of the phenyl rings vibrations. The inset shows the temperature behaviour of the 1002 cm 1 line on an enlarged scale.
Crystals 10 00224 g009
Figure 10. Temperature transformation of Raman spectra of FF microtube in the high-frequency region. Stars indicate reference neon lamp lines.
Crystals 10 00224 g010
Figure 11. Dependence of the C−H stretching modes on temperature: (a) 2938 cm 1 mode, (b) 2966 cm 1 mode, (c) 3004 cm 1 mode, (d) 3037 cm 1 mode. The difference between the line position and its approximation depending on the temperature: (e) 2938 cm 1 mode, (f) 2966 cm 1 mode, (j) 3004 cm 1 mode, (k) 3037 cm 1 mode.
Crystals 10 00224 g011
Figure 12. O–H vibration spectral region of the sample in air, in vacuum and at 14 K. Vac denotes measurements carried out in vacuum cryostat with internal pressure 10 6 mbar. Air measurements have done at ambient conditions.
Crystals 10 00224 g012
Figure 13. Intensity map of the low-frequency spectral region: (a) during heating from 290 to 420 K in the range from 10 to 200 cm 1 , (b) during cooling from 400 K to 20 K (temperature return) in the range from 10 to 200 cm 1 .
Crystals 10 00224 g013
Figure 14. The intensity map of the mid-frequency spectral regions during temperature increasing from 400 K to 20 K: (a) in the range from 210 to 280 cm 1 , (b) in the range from 440 to 520 cm 1 , (c) in the range from 600 to 640 cm 1 .
Crystals 10 00224 g014
Figure 15. The temperature dependence: (a) of the position of the line 1002 cm 1 , (b) its width. Black points—heating, blue points—cooling.
Crystals 10 00224 g015
Figure 16. The temperature dependence of line positions in the high-frequency region: (a) heating from 275 up to 420 K, (b) cooling after the transition.
Crystals 10 00224 g016
Table 1. Positions of the observed Raman spectra lines and their assignment at 293 K.
RegionLine Position, cm 1 Assignment to Functional Groups
This Worki [21,22,23,24], ii [25,26], iii [27,28]
17 lattice mode
26 lattice mode
3333lattice mode
35 lattice mode
3941skeletal torsion+asymmetric twisting H 2 O
45 lattice mode
5754C out of plane + CHCH 2 stretching
60 lattice mode
6465C out of plane + CHCH 2 stretching
72 lattice mode
7882lattice mode
i86 lattice mode
89 lattice mode
105104Phe-Phe twisting
110107lattice mode
115
121 lattice mode
127130lattice mode
136 lattice mode
164 lattice mode
170171H−C, amine, H wagging
195 lattice mode
224 lattice mode
230 lattice mode
298295C−H torsional motion
348348C−H torsional motion
496496N−H torsional motion
621622O−C=O deformation, phenyl group
10021001phenyl ring breathing mode (C-C)
10321032vibrations of the phenyl group
10381038vibrations of the phenyl group (C-H)
11891190vibrations of the phenyl group
12061208vibrations of the phenyl group (mainly C-C)
ii12491249amide III (mainly C−N) stretching)
12821327CH 2 rock, (C−C−H)
13531360 δ (N−C−H), δ (C−C−H), CH 2 rock, CH 2 twist
13941413CH 2 bend
14251446CH bond deformation
15841586vibrations of the phenyl group (C-C)
16041606vibrations of the phenyl group (C-C), C=O vibrations
16871686amide I
29202912CH 2 symmetric stretching
29382933C-H symmetric stretching
29662967CH 2 asymmetric stretching
29852979C-H stretching
iii3004 C-H stretching
3037 C-H stretching
3044 NH 3 symmetric stretching
3055 C-H stretching
30693068NH 3 asymmetric stretching
3262 O−H stretching, crystalline water region
Table 2. Positions [cm 1 ] of observed polarised Raman spectra lines at T = 296 K and they symmetry attribution in the low wavenumber region.
Symm. TypeZZYZYY
A16.9
E 1 24
A25.4
E 1 33
E 2 34
A42.7
E 2 43
E 1 44
A56.5
E 2 57
E 1 58
E 2 63
E 1 76
E 2 76.8
E 1 85
A103
E 1 108
E 2 109
E 1 120
A121
E 2 131
E 2 165
E 1 168
A188
E 2 219
A227
A235

