Abstract
The study investigated the impact of three prevalent polyphenols—quercetin, ferulic acid, and caffeic acid—on catalase activity. It was determined that all three polyphenols are capable of binding to catalase, resulting in the formation of a stable complex. This finding was corroborated through fluorescence quenching studies and kinetic modeling. At low concentrations, each polyphenol exhibited an activation effect on catalase; however, at concentrations exceeding 100 μM, they began to function as inhibitors. Notably, caffeic acid and ferulic acid were observed to protect the enzyme from operational inactivation, whereas quercetin did not demonstrate this protective effect. The association constants derived from kinetic modeling were compared with those obtained from docking simulations. The results suggest that polyphenols may exert both beneficial and potentially detrimental effects on cellular antioxidant systems, contingent upon their concentration and specific molecular interactions. This highlights the necessity for careful consideration of dosage in any prospective therapeutic applications.
1. Introduction
Reactive oxygen species (ROS) are molecules generated during normal metabolic processes and as a result of exposure to environmental pollutants such as cigarette smoke, having the potential to alter cellular structures by interacting with carbohydrates, nucleic acids, lipids, and proteins, thereby affecting their functions [1]. It is crucial for the body to maintain a balance between oxidants and antioxidants, as an excess of oxidants results in oxidative stress which can contribute to the development of conditions such as neurological disorders, cancer, atherosclerosis, diabetes, and asthma [2]. To mitigate the harmful effects of ROS, aerobic organisms have evolved defense systems that include antioxidant enzymes like catalases, superoxide dismutases, peroxiredoxins, and glutathione peroxidases. Catalase, in particular, plays a crucial role as it breaks down hydrogen peroxide (H2O2) into oxygen (O2) and water (H2O) [3].
Since catalase effectively eliminates hydrogen peroxide produced in pathological situations (over 0.1 μM in the intracellular space), it inhibits the production of other ROS, such as peroxonitrites, particularly in low pH conditions [4]. Catalase preserves DNA (deoxyribonucleic acid), absorbs UVB rays (ultraviolet B radiation), and detoxifies the body in its natural state. When the redox potential of cells is reduced, catalase-mediated ROS build-up can cause DNA damage and skin cancer. High H2O2 levels have been linked to decreased catalase activity in certain malignant tissues, whereas overexpression of catalase has been noted in other studies. The presence of catalase coupled with the outer membrane of cancer cells provides an explanation for this phenomenon. Consequently, using antibodies or inhibitors specific to catalase linked to certain cell types could be one way to combat cancer. Thus, inhibition of catalase in different species formed during oxidative stress may be harmful or beneficial, depending on the circumstances [5].
The quaternary structure of a catalase is essential to its overall activity; all catalases are structurally made up of four nearly identical subunits, each of which has four basic domains with unique functions. A heme group is buried deep within the core structure of the active site of each catalase unit, at least 20 Å from the surface [6]. The prosthetic group is linked to the exterior through three channels, the main, the lateral, and the central one [7]. The main channel, which is designed to maximize its binding through the hydrophobic environment and electrical potential in the channel, serves as the major entry point of the hydrogen peroxide substrate [8]. Other channels seem to contribute to the rapid release of water and oxygen [9].
The mechanism of hydrogen peroxide decomposition depends primarily on the substrate concentration. At low hydrogen peroxide concentrations, the traditional mechanism consists of two stages.
First, hydrogen peroxide oxidizes heme to Cpd I, an oxoiron(IV) porphyryl radical, and in the second step, Cpd I is reduced by another molecule of hydrogen peroxide to regenerate the native enzyme (Cat) and form water and oxygen. Cpd I can alternatively oxidize alcohols to aldehydes and water via peroxidatic reaction of the catalase [10]. At high concentrations of H2O2 catalase show a slow irreversible inactivation [11] in two phases, α and β. The enzyme is first identified in the α activity phase; however, in time, the activity declines to a brand-new stationary phase, known as the β phase, during which the reaction rate steadily dropped as a result of the enzyme’s increasing destruction by hydrogen peroxide and two more inactive intermediates known as Cpd II and Cpd III can be produced [12]. The inactivation of catalase caused by substrate excess is significantly influenced by compound II and/or III. and a simple kinetic model was proposed for catalase inactivation at high H2O2 concentrations [13], by adding a single step for transforming Cpd I in an inactive form named Cpd II [12,14].
The apparent inactivation constant was estimated at 4 × 10⁻³ s−1, a value corresponding to a slow inactivation as compared to the main reaction [15].
To support the maintenance the balance between oxidants and antioxidants and fight against the oxidative stress, it is important to consume foods rich in antioxidants, including vitamin C, vitamin E, polyphenols, carotenoids, and oxycarotenoids [16].
Polyphenols compounds found in fruits, vegetables, seeds, wine, tea, and coffee, are known to be very efficient antioxidants that scavenge free radical species and can chelate divalent cations, providing many health advantages such as anti-inflammatory, anti-allergic, antiviral, and anticancer action [17,18]. In addition to their role as antioxidants, polyphenols significantly influence critical cellular processes, by interacting with cellular components and proteins, thereby modulating gene expression [19]. Furthermore, polyphenols alter the activity of enzymes such as cyclooxygenases, lipoxygenases, and inducible nitric oxide synthase, contributing to the reduction in inflammation and the prevention of cancer [20]. However, they can also have a prooxidant activity [21] which can be in some cases beneficial due to regulation of antioxidants enzymes [22]. Quercetin is one of the most studied and potent flavonoids, having a lot of health benefits like antioxidant and anti-inflammatory properties, which help reduce the risk of heart disease and diabetes [23]. Ferulic acid and caffeic acid are hydroxycinnamic acids; their consumption is associated with lower incidents of cardiovascular disease, obesity, diabetes, and brain dysfunctions [24]. Ferulic acid is commonly found in cereals, while caffeic acid is the main hydroxycinnamic acid compound found in most fruits [25].
Catalase is a possible target for many diseases, since it controls how much oxidative stress is present in the human body. As a result, studies on how drugs or natural products affect catalase activity are of great interest, since any modulator that can influence catalase function could result in the buildup of H2O2, a ROS generator that causes oxidative damage to macromolecules and eventual pathologies [26].
Regarding the influence of certain polyphenols on catalase reported are somehow contradictory; some authors found an increase in catalase activity or expression in cells [27,28,29], while in vitro inhibition effects were highlighted [14,30,31]. Certain flavonoids, including quercetin, partially or totally inhibits catalase activity, due to the formation of an unreactive catalase compound [14,32,33]. Ferulic and caffeic acids inhibited ROS production by upregulating antioxidant enzymes, including catalase, by activating the Nrf2 redox pathway [34,35]. No data were found for in vitro studies on polyphenols—catalase interactions.
The present study focuses on the influence of three of the most common polyphenols, quercetin (QU), ferulic acid (FA), and caffeic acid (CA), on catalase activity and kinetics at relatively high hydrogen peroxide concentrations, when catalase is inactivated by its substrate.
2. Results and Discussion
2.1. Oxidation of Quercetin with Hydrogen Peroxide
At low concentrations of quercetin, the kinetic curve [QU] = f(t) can be approximated as exponential, indicating that the reaction is of first order, whereas for higher concentrations of quercetin, the curves become sigmoidal, indicating that an autocatalytic step is involved (Figure S1). The form of the kinetic curves is characteristic of autocatalytic reactions; no information has been found in the literature regarding the reaction of quercetin with hydrogen peroxide, but during the time interval (200–300 s) in which the determinations were performed in the presence of catalase, the reaction can be considered as pseudo-first order with an apparent rate constant of approximately 5 × 10⁻³ s−1. Considering the initial concentrations of QU and hydrogen peroxide used in the enzymatic reaction, the initial rate of quercetin autooxidation was approximately 10−9 M s–1.
2.2. Interaction of QU, CA, and FA with Catalase
2.2.1. Effect of QU/CA/FA on the Absorption Spectra of Cat
The absorbance spectra of Cat 1.5 μM in the presence of increasing concentrations of QU, CA, and FA up to a molar ratio of 1:1 are shown in Figure S2.
Catalase has three primary absorption bands. Tryptophan, tyrosine, and phenylalanine are aromatic amino acids that absorb in the band around 280 nm, whereas the Soret band at 405 nm arises from an electric dipole-assisted π–π * transition of the delocalized electron cloud of the heme group. This transition may provide information about conformational changes in polypeptides close to the heme region. The strong absorption band at approximately 205 nm was ascribed to π–π * electronic transitions of the peptide backbone [36].
The decrease in absorbance at 280 nm was more visible in the case of QU addition than in the case of CA or FA, where the change was almost insignificant, which provides evidence of the rearrangement of the globular structure of the enzyme with the addition of QU and CA, leading to an increase in the hydrophobicity of the microenvironment around the aromatic amino acid residues [37]. With regard to the Soret band, the slight decrease in absorbance at 405 nm for FA can be attributed to its interaction with aminoacids close to the heme region in catalase. Due to the fact that heme groups are deeply buried in enzyme, it is difficult for polyphenols to have a direct denaturation effect on enzyme structure [6], but they can affect the activity of catalase by interacting with the amino acids residues surrounding the heme group [38]. The influence of QU can be mainly attributed to the interaction with tryptophan, tyrosine, and phenylalanine residues, whereas the influence of FA can be attributed to the interaction with the amino acids surrounding the heme group.
2.2.2. Fluorescence Quenching Studies
The interaction between QU/CA/FA and Cat was evaluated by monitoring the intrinsic fluorescence intensity changes in the enzyme upon the addition of polyphenols. Cat fluorescence arises from the fluorescence of aromatic amino acid residues (tyrosine, tryptophan, and phenylalanine); therefore, fluorescence quenching upon the addition of antioxidants can be measured at an excitation wavelength of 280 nm [39]. The fluorescence quenching spectra of Cat in the presence of increasing concentrations of polyphenols, up to a molar ratio of 1:1, are presented in Figure 1. Since all polyphenols have absorption at 280 nm, in order to eliminate the internal filter effect, the fluorescence was corrected as [40]:
where Fobs and F represent the fluorescence intensities before and after the correction, respectively. ACat represents the absorbance of the enzyme at the excitation wavelength and Af is the absorbance of the antioxidant at the emission wavelength.
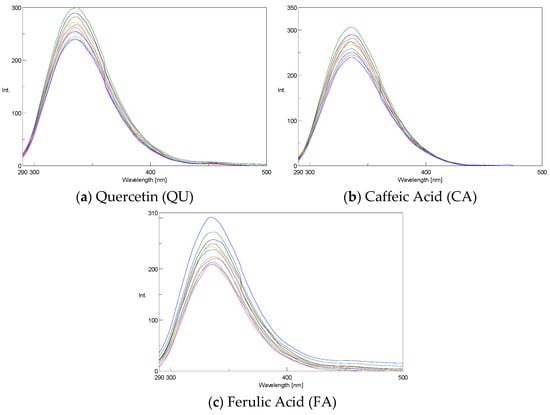
Figure 1.
Fluorescence quenching spectra of Cat at different concentrations of antioxidants at 298 K: [Cat]0 = 10 μM; [Flav] = 0–2 μM, λex = 280 nm.
As shown in Figure 1, with the addition of polyphenols, the fluorescence intensity of Cat decreased at 334 nm without a significant peak shift.
The addition of polyphenols led to concentration-dependent quenching of the Cat fluorescence intensity. Energy transfer, collision, or the formation of ground-state complexes can result in fluorescence quenching, which can be either dynamic or static. The behavior of quencher molecules when interacting with catalase fluorescence can be characterized by an unmodified Stern-Volmer plot [41]:
where F0 and F are the steady-state fluorescence intensities in the absence and presence of the quencher Aox, that is, QU/CA/FA, and and [Aox] are the Stern-Volmer quenching constant and the concentration of quencher, respectively.
ANOVA-Tukey test was used for analyzing the experimental data; the results showed that there are no significant differences between datasets, the test statistic F ranging between 0.114 and 1.329, which is in the 95% region of acceptance, even for interaction of Cat with ferulic acid, where the data are the most spreader.
The values (Table 1) were estimated from the slopes of linear dependence of (Figure 2); The values are of 105 M−1 order, indicating that strong quenching occurs between Cat and QU/CA/FA. Given the average lifetime of the fluorophore () [42], the bimolecular quenching rate constants () were estimated as ; the estimated values exceeded the maximum dynamic quenching constant value (2 × 10¹⁰ M−1 s−1) [43], proving that fluorescence quenching of Cat in the presence of QU/CA/FA arises from a ground state complex formation. The findings are consistent with existing literature regarding the binding of quercetin to catalase [44,45]; although data for ferulic acid and caffeic acid catalase interactions are missing, these polyphenols have been demonstrated to quench the fluorescence of various endogenous proteins through a static mechanism [46,47].

Table 1.
Parameters of Stern-Volmer equation for Cat fluorescence quenching upon interaction with polyphenols.
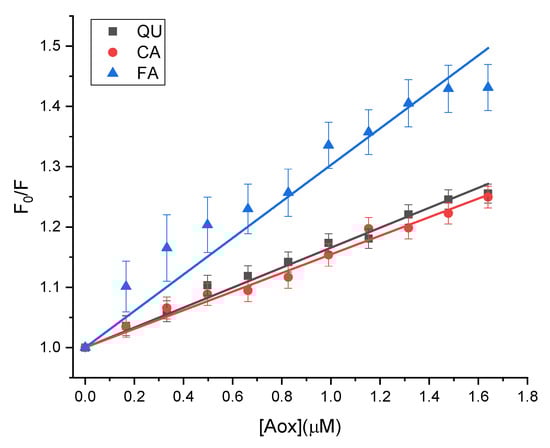
Figure 2.
The Stern-Volmer plots for the quenching of Cat by QU, CA, and FA at T = 298.15 K.
Since the quenching of fluorescence is a static process, the following equation can be used to describe the relationship between the fluorescence intensity and quencher concentration [48]:
where n is the number of binding sites and is the binding constant.
The plots of versus are depicted in Figure 3. The values of and were estimated from the intercept and the slope of the linear dependencies and are listed in Table 2.
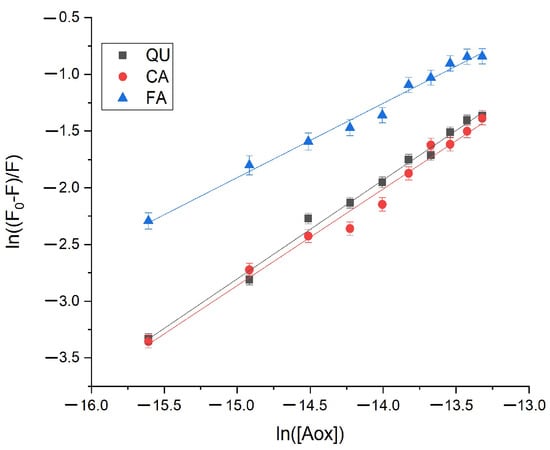
Figure 3.
The plots of versus for the quenching of Cat by QU, CA, and FA at T = 298.15 K.
Table 2.
Binding constants and number of binding sites according to Equation (6).
The mean number of polyphenol molecules bound to one molecule of catalase in the given class of binding sites (n) is almost 1; therefore, the antioxidants flavonoids bind to one site in the protein molecule. The Ka value indicates that the binding affinity of polyphenols to catalase is relatively strong, suggesting that polyphenols reduce catalase activity. Conversely, catalase appears to diminish the antioxidative properties of polyphenols [45]. The affinity of Cat for quercetin was slightly higher than that for caffeic or ferulic acid. This observation can be attributed to structural differences, as quercetin contains a greater number of hydroxyl groups compared to caffeic or ferulic acid. The presence of these hydroxyl groups in quercetin facilitates enhanced hydrogen bonding and electrostatic interactions relative to caffeic or ferulic acid. The same behavior was observed by Zhu et al. [45] in the case the binding quercetin and myricetin to catalase. The values of association constants for quercetin binding are of the same order of magnitude to those reported in the literature [44,45]; for ferulic acid and caffeic acid the association constants reported for the binding of these polyphenols to human serum albumin are of 104 M−1 order [46]; for ferulic acid a value of 2.246 × 10³ M−1 was also reported for FA-human serum albumin association [47].
2.3. Influence of Polyphenols on Catalase Activity
The kinetic data obtained at different initial QU/CA/FA concentrations, ranging from 3 × 10⁻⁶ to 1 × 10⁻⁴ M, and 0.1 μM Cat and 0.027M H2O2 are presented in Figure 4.
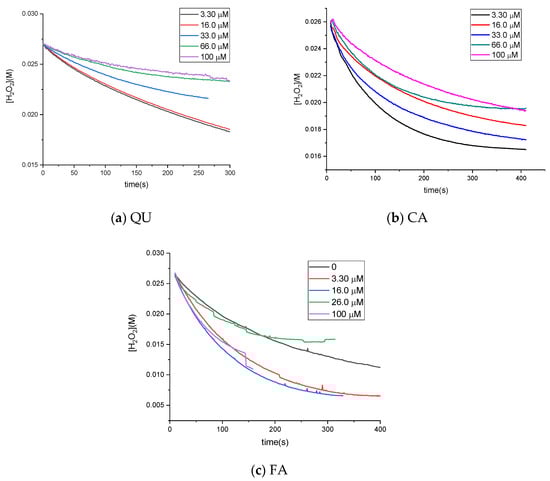
Figure 4.
Kinetic curves [S] = f(time) for different concentrations of polyphenols.
For ferulic acid the kinetic curves present large errors, due to the large absorbance of this polyphenol at the measured wavelength; the ANOVA-Tukey test showed that there are no significant differences between datasets.
The initial reaction rates were estimated as described in the Experimental section. The variation in initial rates with the concentration of quercetin (Figure 5) showed that there was a slight increase in catalase activity up to a concentration of approximately 20 μM quercetin, followed by a decrease. Even at a high concentration (molar ratio of 1:1000), catalase activity decreased by only 20%. Compared with autooxidation, the rates of enzymatic reactions are much faster; therefore, the autooxidation of quercetin is negligible. The effect of caffeic acid on catalase activity was much lower than that of quercetin; catalase activity was relatively constant (between 90% and 120% compared with its absence). Ferulic acid led to an increase in Cat activity of up to 220%, but at high concentrations, it led to Cat inactivation of almost 66%.
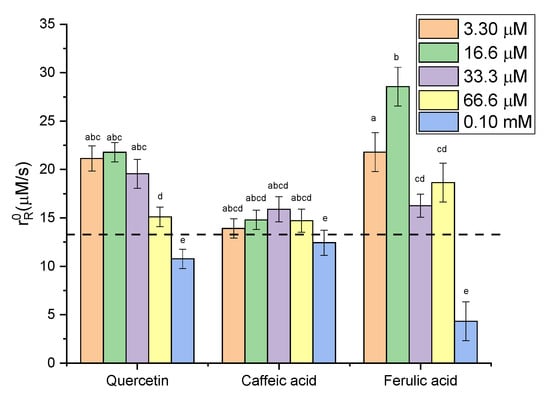
Figure 5.
Variation in initial rate with polyphenol concentration (dash line represents the value obtained without polyphenol).
These results showed that at low concentrations of polyphenols there is an activation of catalase, while at concentrations above 100 µM, the polyphenols start to act as inhibitors. For quercetin, Rashtbari et al. [44] also indicated that QU (27.5 μM) has an inhibitory effect on catalase activity and the mechanism of inhibition is uncompetitive [30,44]. For CA and FA, no literature data were found regarding their influence on Cat.
The dual behavior of polyphenols on catalase activity can be explained in several ways. Firstly, it can be considered that the modulation of Cat activity is part of the general process of hormesis. This is a proactive method that uses small changes as signals that cause reactions that not only fix but also improve the body’s balance. Overcompensation Hormesis (OCSH) represents an adaptive response to low levels of stress or damage, resulting in a modest overcompensation within certain physiological systems. At the molecular level, overcompensation indicates that, in response to subliminal stress, cells activate repair mechanisms that not only rectify specific damage but also temporarily enhance the overall reparative capacity [49]. Polyphenols are among the substances capable of eliciting hormetic responses. They function as low-dose xenobiotics, which can activate endogenous cellular defense mechanisms. This dual characteristic, being potentially toxic at high doses yet beneficial at low concentrations, positions polyphenols as central agents in the modulation of oxidative stress and inflammation [20].
Another possible explanation for the apparent activation of Cat is the suppression of its inactivation by a high amount of hydrogen peroxide. The apparent inactivation constants in the presence of polyphenols at the concentration where maximum activity was observed were estimated from the kinetic curves obtained at a constant initial concentration of substrate (0.0265 M) and variable initial concentration of Cat. The plot [H2O2] as a function of the product between time and [Cat]0, known as Selwyn test [50] is shown in Figure S3. It can be observed that the plots are different only in the case of QU, indicating that inactivation of Cat is present during the reaction. For CA and FA, the plots are almost superposable, indicating that the presence of these antioxidants protects the enzyme against operational inactivation, probably due to a hormesis effect. For QU, the overall inactivation rate constant (kin) of the enzyme was estimated using an isoconversional method, described elsewhere [15]. We obtained a value of (4.6 ± 0.5) 10−3 s−1, which is comparable to the value determined for catalase inactivation in the absence of any modulator (4.2 × 10⁻³ s−1), indicating that quercetin does not directly inactivate catalase.
2.4. Kinetic Modeling: Optimization and Simulation
The simplest kinetic model of Cat action on hydrogen peroxide involves the formation of an inactive enzyme-substrate complex, according to the following scheme [51]:
The individual rate constants in aqueous media, in the absence of any effectors were estimated previously as: ; ; and [52].
Fluorescence quenching data showed that Cat is able to bind one molecule of polyphenol; therefore, we tested a kinetic model that contains a step for the formation of a stable intermediate between the enzyme and antioxidant. Hemoglobin, which also contains a heme group, can react with quercetin [53] and caffeic acid [54], while another heme-containing enzyme, peroxidase, binds ferulic acid [55]. Catalase also has a heme prosthetic group, so we proposed a kinetic model that contains a step for non-enzymatic oxidation of QU and a step for binding of QU/CA/FA to Cat in a bilateral reaction:
where Aox is either QU, CA or FA, and represents the oxidation products of quercetin. Steps 5 and 6 were only used for QU oxidation by hydrogen peroxide or dissolved oxygen. The numerical integration of the system of differential equations representing the transformation rates of each component over time was used to estimate the rate constants for steps 4–6, until the optimal overlap between the simulated and experimental data (obtained by the numerical integration of the system) was achieved. For this procedure, the Kintecus (V2025) program was used with the option of fitting multiple sets of data to the same model [56]. The corresponding kinetic constants for steps 4, 5, and 6 are presented in Table 3 and the kinetic curves are compared in Figure 6.
Table 3.
Values of individual reaction rates corresponding to model (11).
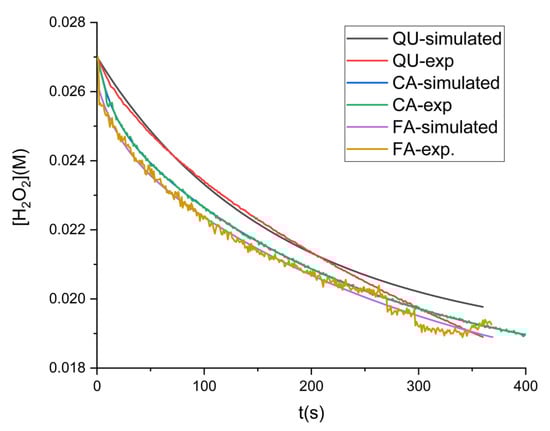
Figure 6.
Kinetic date experimental vs. simulated for influence of polyphenols on hydrogen peroxide decomposition in the presence of Cat ([QU] = 16.6 µM; [CA] = 33.3 µM; [FA] = 16.6 µM; [Cat] = 0.1 µM).
The values corresponding to represents the association constants between the enzyme and polyphenols. Compared with the results obtained from fluorescence quenching, the formation of the Cat-Aox complex had similar association constants, confirming that all studied polyphenols bind to the enzyme and form a stable complex.
The values of individual rate constants indicate that the interaction between Cat and flavonoids is slow as compared to the enzymatic reaction; however, the values of binding constant , being closer to those obtained by the fluorescence quenching method, suggest that the proposed kinetic model is correct.
The kinetic model is a very simple one, and it cannot account for each possible step involved in the modulated decomposition of hydrogen peroxide in the presence of catalase, but it represents a complementary proof of the formation of a stable compound between catalase and polyphenols.
2.5. Molecular Docking
The lower the estimated free energy of binding (EFEB, in kcal/mol) or the estimated constant , the more likely the ligand will effectively bind to that target. We have used Autodock 4.2.6 software to predict the EFEB and the KS for QU, FA, and CA in their interactions with Cat and human liver mitochondrial catalase (Table 4).
Table 4.
Biological target, the lowest EFEB, and KS for QU, FA, and CA when interacting with Cat or human liver mitochondrial catalase, predicted using Autodock software (4.2.6).
Our predictions indicate that the lowest EFEB was observed for the interaction between QU and Cat, as predicted by AutoDock (Table 4). The differences observed between experimental and theoretical binding energies arise from basic methodological variations. While theoretical docking scores represent interactions in the gas phase, experimental ΔG values account for solvation and conformational changes [57,58].
Figure 7 illustrates the predicted binding mode of QU to Cat, compared to the interaction between protoporphyrin IX and Cat derived from the co-crystallized structure.
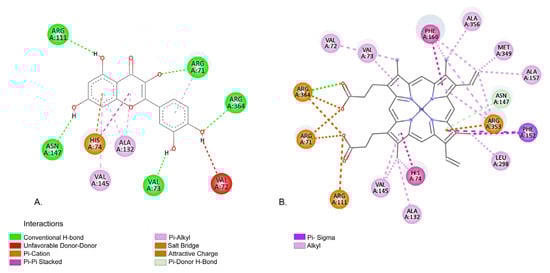
Figure 7.
(A) Predicted interaction between QU and Cat; (B) native interaction between protoporphyrin IX and Cat derived from the co-crystallized structure.
According to our molecular docking simulations, QU forms several interactions with Cat protein similar with those of protoporphyrin IX, as observed in the co-crystallized structure (Protein Data Bank: PDB: 3RE8) [59]. Both QU and protoporphyrin IX interact with multiple common amino acid (aa) residues within the binding site. For example, QU forms a hydrogen bond with ARG71, whereas protoporphyrin IX forms a salt bridge with the same residue. VAL72 exhibits an unfavorable donor–donor interaction with QU, while protoporphyrin IX engages in an alkyl interaction. QU forms a hydrogen bond with aa residue VAL73, in contrast to the Pi-alkyl interaction formed by protoporphyrin IX. With HIS74, QU engages in both Pi-cation and Pi–Pi stacked interactions, similar to protoporphyrin IX, which forms Pi–Pi stacked and alkyl interactions with this residue. ARG111 interacts with QU via a H-bond, and with protoporphyrin IX through an attractive charge interaction. ALA132 aa residue forms two Pi-alkyl interactions with QU and an alkyl interaction with protoporphyrin IX. Both QU and protoporphyrin IX establish Pi-alkyl interactions with VAL145. With aa residue ASN146, QU forms a conventional H-bond, while protoporphyrin IX establishes a Pi-donor hydrogen bond. Finally, ARG364 forms a conventional H-bond with QU and, in the case of protoporphyrin IX, participates in a H-bond, an attractive charge and a salt bridge. These results suggest that QU may have a similar binding to that of protoporphyrin IX.
Regarding the interaction of CA and FA, our molecular docking predictions indicate that those compounds have similar EFEB; −6.65 kcal/mol for CA, and −6.59 kcal/mol for FA (Table 4). Figure 8 illustrates the predicted binding modes of CA and FA within the active site of the Cat protein.
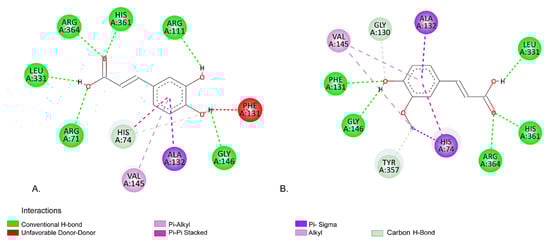
Figure 8.
Predicted interaction using molecular docking between (A) CA and Cat, (B) interactions between FA and Cat.
According to our predictions, CA and FA have identical interactions with several aa residues within Cat protein defined binding site, specifically ALA132, VAL145, GLY146, LEU331, ARG364, and HIS361. However, some differences in their interaction profile were observed as fallows: with HIS74 CA forms a Carbon H-Bond whereas FA engages in a Pi-Sigma interaction; CA forms an unfavorable donor-donor interaction with aa residue PHE131, while FA forms an H-bond interaction.
When comparing the interactions of CA and FA with those of protoporphyrin IX, our molecular docking analysis indicates that CA exhibits a binding profile more similar with protoporphyrin IX. CA shares six common interacting aa residues with protoporphyrin IX ARG71, HIS74, ARG111, ALA132, VAL145, and ARG364, suggesting a possible closer binding orientation (Figure 8B, Figure 9A). On the other side, FA shares only four common residues HIS74, ALA132, VAL145, and ARG364, indicating a slightly different binding orientation (Figure 8B, Figure 9B). Similarly, Huo et al. [60] investigates the binding mechanism of maltitol with Cat, and their results indicate H-bonds with the aa residues ARG111, ARG71, and SER113.
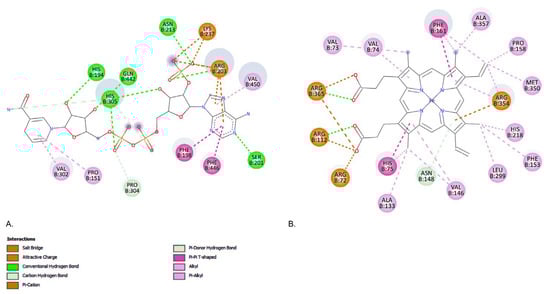
Figure 9.
Native interaction derived from the co-crystallized structure of human liver mitochondrial catalase. (A) NADPH, and (B) protoporphyrin IX containing Fe.
From the PDB structure of human liver mitochondrial catalase (PDB code: 8SGV) we have identified 2 binding situses as shown in Figure 9.
When human liver mitochondrial catalase interacts with nicotinamide adenine dinucleotide phosphate (NADPH), hydrogen bonds are formed with the amino acid residues HIS194, SER201, ARG203, ASN213, HIS305, and GLN442. In contrast, protoporphyrin IX containing Fe forms only two hydrogen bonds, specifically with ARG112 and ARG365 (Figure 9).
FA and CA exhibit similar predicted binding energies of −6.92 kcal/mol and −6.94 kcal/mol, respectively, according to our molecular docking predictions. FA forms several hydrogen bonds with the amino acid residues PHE132, ASN148, ILE332, HIS362, and ARG365. Additionally, it shows favorable interactions with HIS75, GLY131, ALA133, VAL146, ALA333, and TYR356, and one unfavorable interaction with GLY147.
These interactions suggest that the binding site of FA may be similar to that of protoporphyrin IX containing Fe, sharing several common aa residues, including HIS75, ALA133, VAL146, and ASN148 (Figure 10a).
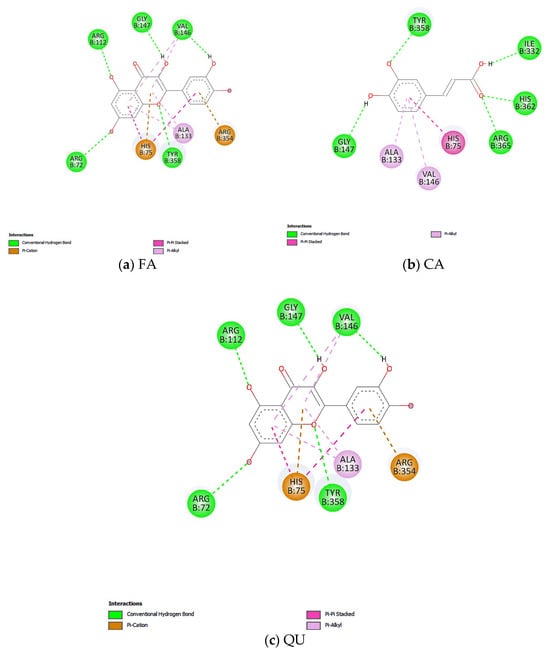
Figure 10.
Predicted interaction using molecular docking between (a) FA, (b) CA, and (c) QU and human liver mitochondrial catalase.
CA forms several hydrogen bond interactions with the amino acid residues GLY147 and TYR358, as well as interactions similar to those of FA with ILE332, HIS362, and ARG365 (Figure 10b). CA may also exhibit a binding profile similar to that of protoporphyrin IX, due to the sharing of several common aa residues, including HIS75, ALA133, VAL146, and ARG365 (Figure 10b).
QU exhibits the lowest predicted binding energy of –8.37 kcal/mol. According to our molecular docking predictions, QU also shares the highest number of aa residues with protoporphyrin IX containing Fe, including ARG72, HIS75, ARG112, ALA133, VAL146, and ARG354 (Figure 10c). This suggests a possible binding site similar to that of protoporphyrin IX containing Fe compared to CA and FA.
3. Materials and Methods
3.1. Materials
Catalase from bovine liver (EC 1.11.1.6, 2000–5000 U/mg protein) was purchased from Sigma Aldrich (Darmstadt, Germany), and all other chemicals were of analytical grade and purchased from Merck (Darmstadt, Germany). The structures of the antioxidants are listed in Table 5. The catalase was prepared in tap water; the stock enzyme concentration was 10−5 M (in protein).
Table 5.
Structure of polyphenols used.
3.2. Oxidation of Polyphenols with Hydrogen Peroxide
Because polyphenols can react with various reactive oxygen species, first it was studied the oxidation reactions of quercetin, ferulic acid, and caffeic acid with molecular oxygen and hydrogen peroxide. The reaction of antioxidants with molecular oxygen is very slow, and the concentration of polyphenols (QU, FA, or CA) remains unchanged after 2 h from the beginning of the reaction (oxygen bubbling into the reaction vessel). The oxidation of quercetin with hydrogen peroxide proceeds faster, and the reaction can be kinetically monitored within a reasonable time interval. For caffeic and ferulic acid, no significant changes were observed in the spectra over a period of 2 h, leading to the conclusion that oxidation with hydrogen peroxide proceeds very slowly; these results correlate with literature data [61,62].
For quercetin oxidation, several kinetic sets were performed at 370 nm; the initial concentration of hydrogen peroxide was kept constant ([H2O2]0 = 0.027 M), and the concentration of quercetin varied between 5 × 10⁻⁵ M and 2 × 10⁻⁴ M.
3.3. Binding of Polyphenols to Catalase
3.3.1. Absorbance Study
The absorbance spectra of Cat were recorded in the range of 200–600 nm using a Jasco V-530 spectrophotometer (Jasco, Tokyo, Japan) equipped with a Peltier cell in a quartz cell at 25 °C. To investigate the effect of QU/FA/CA on Cat, the absorbance spectra of the enzyme in the presence of increasing concentrations of QU/FA/CA up to a stoichiometric molar ratio of 1:1 were recorded. Cat concentration was estimated to be 1.5 μM (calculated using a molar extinction coefficient of 3.24 × 10⁵ M−1 cm−1 at 405 nm for catalase [63]). As a reference, a solution of a ligand with the same concentration as that in the probe was used.
3.3.2. Fluorescence Quenching Study
All fluorescence spectra were obtained using a JASCO FP 8000 spectrofluorometer (Jasco, Tokyo, Japan) fitted with a xenon lamp and a 1.0 cm quartz cell. The widths of the excitation and emission slits were set at 5 nm.
Fluorescence spectra in the wavelength range of 300–450 nm were monitored after excitation at 280 nm to determine the fluorescence quenching of catalase (10 μM) solution in the presence of different concentrations of QU/FA/CA up to a stoichiometric molar ratio of 1:1. All experiments were performed in triplicate assay.
3.4. Catalase Assay
The decomposition of hydrogen peroxide was measured by the method of Beers and Sizer [63], using a Jasco V-530 spectrophotometer (Jasco, Tokyo, Japan) equipped with a Peltier cell, at 240 nm and 25 °C. The initial concentration of H2O2 was 0.027 M. and the reaction was followed up to 10 min. The pH did not change during the reaction; therefore, a buffer-free system was chosen to avoid the interference of the buffer components [64]. When polyphenols were used, Cat was incubated for 5 min with different amounts of QU/CA/FA, and a solution of equivalent concentration of antioxidant was used in the reference cuvette. All experiments were performed in triplicate assay. The concentration of hydrogen peroxide was calculated according with Bouguer-Lambert-Beer equation: , where is the molar extinction coefficient of hydrogen peroxide at 240 nm [63], and is the optical pathlength.
The experiments of inactivation assay for Cat were carried out by monitoring the decrease in H2O2 at 0.027 M absorbance at 240 nm for catalase concentrations ranging from 0.06 to 0.4 μM. The overall inactivation constant in the presence of polyphenols was estimated using an isoconversional method [15]. From the kinetic curve curves [S] = f(time) obtained for the same initial substrate concentrations and various enzyme concentrations [E]0, the method involves calculating the time values (ti) corresponding to the concentration of the settling substrate. Then, using numerical derivation, the first derivatives with respect to time are computed at each time ti. Based on the linear regression in Equation (9), it is possible to obtain the overall inactivation rate constant kin for first-order inactivation:
3.5. Data Analysis
3.5.1. Estimation of Initial Reaction Rates
The three-parameter functions (y0, A1, and t1) that provided the best fit and random residuals were used to fit all extended kinetic curves [S] = f(t), using ORIGIN 8.0.
The initial reaction rates () were calculated as the derivatives of Equation (10) with respect to time:
3.5.2. Statistical Analysis
The experimental assays were conducted in triplicate. The results are presented with the calculation of relevant statistical parameters, including the mean, standard deviation, and coefficient of variation (<20%). The data were analyzed using analysis of variance (ANOVA) and Tukey’s similarity test, using the SPC for Excel Software (8.0). Distinct letters denote values that are significantly different (p < 0.05), while double or triple letters indicate values that are partially different between the designated sets.
3.5.3. Kinetic Modeling
The temporal evolution of the reaction system based on a given kinetic model can be described by a system of differential equations that reflect the transformation rates of each component over time. The rate constants were computed using numerical integration of the system. Starting with the estimated initial values of the rate constants and the initial concentrations of each species, the system was solved numerically. The constant values were then gradually improved until the optimal overlap between the simulated and experimental data was achieved (obtained by numerical integration of the system). The Kintecus program was employed for this process [56].
3.5.4. Molecular Docking Method
To predict the interactions between Cat, human liver mitochondrial catalase and QU/FA/CA, we used AutoDock 4.2.6 software [65]. For the docking simulations, when interacting orris with Cat the grid box was defined to include only the HEM-binding site identified in the crystal structure (PDB code: 3RE8). The grid spacing was set to 0.375 Å, and the number of grid points along the X, Y, and Z axes was 70, 80, and 70, respectively. The cartesian coordinates of the grid center were set to (10.392, 41.710, 83.178). When interacting with human liver mitochondrial catalase, the grid box was defined to encompass most of the protein, as the PDB structure (PDB code: 8SGV) reveals two binding sites: one for protoporphyrin IX containing Fe, and another for NADPH. Docking was performed using our standard molecular docking protocol [66,67]. We generated 100 conformations for each protein–ligand interaction using the Genetic Algorithm (GA) search method. The output was saved in Lamarckian format, resulting in a hybrid GA–Lamarckian prediction model.
The docking runs were clustered using a tolerance of 2.0 Å RMSD (root mean square deviations), grouping conformations with similar binding geometries. For each ligand–protein pair, the conformation with the lowest binding energy from the cluster with the rank 1 was selected as representative. Table 6 presents the results, including the lowest binding energy, mean cluster energy, number of conformations per cluster, and the RMSD of the lowest-energy docking run.
Table 6.
Docking results for each ligand, showing the lowest binding energy conformation from the rank 1 cluster, corresponding docking run, mean cluster binding energy, cluster size (number of conformations), and RMSD of the representative structure.
4. Conclusions
Research indicates that three antioxidants—quercetin, ferulic acid, and caffeic acid—can bind to the enzyme catalase, forming a stable complex. At low concentrations, these antioxidants enhance the catalytic efficiency of catalase. However, when their concentrations exceed 100 μM, they begin to inhibit its activity. Caffeic acid and ferulic acid have the capacity to protect catalase from oxidative damage induced by elevated hydrogen peroxide levels, whereas quercetin does not exhibit this protective effect. Studies demonstrate that these antioxidants bind to catalase in a manner akin to protoporphyrin, with quercetin exhibiting the strongest affinity. The impact of these antioxidants on catalase is concentration-dependent, which can be both beneficial and detrimental to cellular antioxidant systems. This study underscores the necessity of considering the interactions between these antioxidants and enzymes when assessing their overall physiological effects. The findings suggest that these antioxidants can be both advantageous and deleterious to cellular antioxidant systems, contingent upon their concentration and interactions. These findings enhance our comprehension of the health benefits conferred by these antioxidants. Further research is warranted to fully elucidate the effects of these antioxidants on catalase activity and their role in managing oxidative stress and cellular homeostasis.
Supplementary Materials
The following supporting information can be downloaded at: https://www.mdpi.com/article/10.3390/catal15100940/s1, Figure S1: Oxidation of quercetin with hydrogen peroxide [H2O2]0 = 0.027 M; Figure S2: Absorption spectra of Cat with different concentrations of QU/CA/FA; Figure S3: Selwyn test for the inactivation of catalase in the presence of QU.
Author Contributions
Conceptualization, P.O., A.R. and S.A.; methodology, P.O.; software, A.L., A.M.U. and S.A.; validation, P.O., A.R. and S.A.; formal analysis, C.C. and A.L.; investigation, C.C. and A.L.; writing—original draft preparation, C.C., A.M.U. and A.L.; writing—review and editing, P.O., A.R. and S.A.; supervision, A.R.; project administration, P.O. All authors have read and agreed to the published version of the manuscript.
Funding
This work was funded by the Romanian National Nucleu Programme LAPLAS VII—contract no. 30N/2023, and by PNRR/2022/C9/MCID/I8, Project “RBC-engager for NK and T cell activation in cancer immunotherapy (REAKT)”, code CF 227/29.11.2022, Financing contract 760103/23.05.2023.
Data Availability Statement
The original contributions presented in this study are included in the article/supplementary material. Further inquiries can be directed to the corresponding author(s).
Conflicts of Interest
The authors declare no conflicts of interest.
References
- Gouda, N.A.; Zhakupova, A.; Abdelaal, A.M.; Ahmad, F.; Elkamhawy, A. The Interplay Involving Oxidative Stress and Autophagy: Mechanisms, Implications, and Therapeutic Opportunities. Exp. Mol. Pathol. 2025, 143, 104989. [Google Scholar] [CrossRef] [PubMed]
- Birben, E.; Sahiner, U.M.; Sackesen, C.; Erzurum, S.; Kalayci, O. Oxidative Stress and Antioxidant Defense. World Allergy Organ. J. 2012, 5, 9–19. [Google Scholar] [CrossRef]
- Galasso, M.; Gambino, S.; Romanelli, M.G.; Donadelli, M.; Scupoli, M.T. Browsing the Oldest Antioxidant Enzyme: Catalase and Its Multiple Regulation in Cancer. Free. Radic. Biol. Med. 2021, 172, 264–272. [Google Scholar] [CrossRef]
- Nicholls, P. Classical Catalase: Ancient and Modern. Arch. Biochem. Biophys. 2012, 525, 95–101. [Google Scholar] [CrossRef]
- Sepasi Tehrani, H.; Moosavi-Movahedi, A.A. Catalase and Its Mysteries. Prog. Biophys. Mol. Biol. 2018, 140, 5–12. [Google Scholar] [CrossRef]
- Alfonso-Prieto, M.; Biarnés, X.; Vidossich, P.; Rovira, C. The Molecular Mechanism of the Catalase Reaction. J. Am. Chem. Soc. 2009, 131, 11751–11761. [Google Scholar] [CrossRef]
- Hara, I.; Ichise, N.; Kojima, K.; Kondo, H.; Ohgiya, S.; Matsuyama, H.; Yumoto, I. Relationship between the Size of the Bottleneck 15 Å from Iron in the Main Channel and the Reactivity of Catalase Corresponding to the Molecular Size of Substrates. Biochemistry 2007, 46, 11–22. [Google Scholar] [CrossRef]
- Díaz, A.; Loewen, P.C.; Fita, I.; Carpena, X. Thirty Years of Heme Catalases Structural Biology. Arch. Biochem. Biophys. 2012, 525, 102–110. [Google Scholar] [CrossRef] [PubMed]
- Goc, G.; Balci, S.; Yorke, B.A.; Pearson, A.R.; Yuzugullu Karakus, Y. Probing the Role of Val228 on the Catalytic Activity of Scytalidium Catalase. BBA - Proteins Proteom. 2021, 1869, 140662. [Google Scholar] [CrossRef]
- Chelikani, P.; Fita, I.; Loewen, P.C. Diversity of Structures and Properties among Catalases. Cell. Mol. Life Sci. 2004, 61, 192–208. [Google Scholar] [CrossRef] [PubMed]
- Gray, M.R. Substrate Inactivation of Enzymes in Vitro and in Vivo. Biotechnol. Adv. 1989, 7, 527–575. [Google Scholar] [CrossRef]
- Lardinois, O.M.; Mestdagh, M.M.; Rouxhet, P.G. Reversible Inhibition and Irreversible Inactivation of Catalase in Presence of Hydrogen Peroxide. BBA - Protein Struct. Mol. Enzymol. 1996, 1295, 222–238. [Google Scholar] [CrossRef]
- Rǎducan, A.; Oancea, D.; Segal, E. Models for Irreversible Inactivation in the Enzymatic Decomposition of Hydrogen Peroxide and Their Kinetic Treatment by Means of Graphs. Rev. Roum. Chim. 2007, 52, 713–717. [Google Scholar]
- Krych, J.; Gebicka, L. Catalase Is Inhibited by Flavonoids. Int. J. Biol. Macromol. 2013, 58, 148–153. [Google Scholar] [CrossRef] [PubMed]
- Oancea, D.; Stuparu, A.; Nita, M.; Puiu, M.; Raducan, A. Estimation of the Overall Kinetic Parameters of Enzyme Inactivation Using an Isoconversional Method. Biophys. Chem. 2008, 138, 50–54. [Google Scholar] [CrossRef] [PubMed]
- Chibuye, B.; Singh, I.S.; Ramasamy, S.; Maseka, K.K. Natural Antioxidants: A Comprehensive Elucidation of Their Sources, Mechanisms, and Applications in Health. Next Res. 2024, 1, 100086. [Google Scholar] [CrossRef]
- Li, Z.; Ren, Z.; Zhao, L.; Chen, L.; Yu, Y.; Wang, D.; Mao, X.; Cao, G.; Zhao, Z.; Yang, H. Unique Roles in Health Promotion of Dietary Flavonoids through Gut Microbiota Regulation: Current Understanding and Future Perspectives. Food Chem. 2023, 399, 133959. [Google Scholar] [CrossRef]
- Xie, K.; Jin, B.; Zhu, H.; Zhou, P.; Du, L.; Jin, X. Ferulic Acid (FA) Protects Human Retinal Pigment Epithelial Cells from H2O2-induced Oxidative Injuries. J. Cell. Mol. Med. 2020, 24, 13454–13462. [Google Scholar] [CrossRef]
- Zhou, Y.; Jiang, Z.; Lu, H.; Xu, Z.; Tong, R.; Shi, J.; Jia, G. Recent Advances of Natural Polyphenols Activators for Keap1-Nrf2 Signaling Pathway. Chem Biodivers. 2019, 16, e1900400. [Google Scholar] [CrossRef]
- Perrone, P.; D’Angelo, S. Hormesis and Health: Molecular Mechanisms and the Key Role of Polyphenols. Food Chem. Advances 2025, 7, 101030. [Google Scholar] [CrossRef]
- Spiegel, M.; Cel, K.; Sroka, Z. The Mechanistic Insights into the Role of PH and Solvent on Antiradical and Prooxidant Properties of Polyphenols — Nine Compounds Case Study. Food Chem. 2023, 407, 134677. [Google Scholar] [CrossRef]
- Mota, J.C.; Almeida, P.P.; Freitas, M.Q.; Stockler-Pinto, M.B.; Guimarães, J.T. Far from Being a Simple Question: The Complexity between in Vitro and in Vivo Responses from Nutrients and Bioactive Compounds with Antioxidant Potential. Food Chem. 2023, 402, 134351. [Google Scholar] [CrossRef] [PubMed]
- Ciupei, D.; Colişar, A.; Leopold, L.; Stănilă, A.; Diaconeasa, Z.M. Polyphenols: From Classification to Therapeutic Potential and Bioavailability. Foods 2024, 13, 4131. [Google Scholar] [CrossRef]
- Coman, V.; Vodnar, D.C. Hydroxycinnamic Acids and Human Health: Recent Advances. J. Sci. Food Agric. 2020, 100, 483–499. [Google Scholar] [CrossRef]
- Herrmann, K.; Nagel, C.W. Occurrence and Content of Hydroxycinnamic and Hydroxybenzoic Acid Compounds in Foods. Critical Rev. Food Sci. Nutr. 1989, 28, 315–347. [Google Scholar] [CrossRef]
- Khataee, S.; Dehghan, G.; Rashtbari, S.; Yekta, R.; Sheibani, N. Synergistic Inhibition of Catalase Activity by Food Colorants Sunset Yellow and Curcumin: An Experimental and MLSD Simulation Approach. Chem.-Biol. Interact. 2019, 311, 108746. [Google Scholar] [CrossRef]
- Liu, L.; Yuan, Y.; Zuo, J.; Tao, J. Composition and Antioxidant Activity of Paeonia Lactiflora Petal Flavonoid Extract and Underlying Mechanisms of the Protective Effect on H2O2-Induced Oxidative Damage in BRL3A Cells. Hortic. Plant J. 2023, 9, 335–344. [Google Scholar] [CrossRef]
- Tao, H.; Zhao, Y.; Li, L.; He, Y.; Zhang, X.; Zhu, Y.; Hong, G. Comparative Metabolomics of Flavonoids in Twenty Vegetables Reveal Their Nutritional Diversity and Potential Health Benefits. Food Res. Int. 2023, 164, 112384. [Google Scholar] [CrossRef] [PubMed]
- Oyedemi, S.O.; Nwaogu, G.; Chukwuma, C.I.; Adeyemi, O.T.; Matsabisa, M.G.; Swain, S.S.; Aiyegoro, O.A. Quercetin Modulates Hyperglycemia by Improving the Pancreatic Antioxidant Status and Enzymes Activities Linked with Glucose Metabolism in Type 2 Diabetes Model of Rats: In Silico Studies of Molecular Interaction of Quercetin with Hexokinase and Catalase. J. Food Biochem. 2020, 44, e13127. [Google Scholar] [CrossRef] [PubMed]
- Majumder, D.; Das, A.; Saha, C. Catalase Inhibition an Anti Cancer Property of Flavonoids: A Kinetic and Structural Evaluation. Int. J. Biol. Macromol. 2017, 104, 929–935. [Google Scholar] [CrossRef]
- Talib, W.H.; Abuawad, A.; Thiab, S.; Alshweiat, A.; Mahmod, A.I. Flavonoid-Based Nanomedicines to Target Tumor Microenvironment. OpenNano 2022, 8, 100081. [Google Scholar] [CrossRef]
- Krych, J.; Gebicki, J.L.; Gebicka, L. Flavonoid-Induced Conversion of Catalase to Its Inactive Form—Compound II. Free. Radic. Res. 2014, 48, 1334–1341. [Google Scholar] [CrossRef]
- Krych-Madej, J.; Gebicka, L. Do PH and Flavonoids Influence Hypochlorous Acid-Induced Catalase Inhibition and Heme Modification? Int. J. Biol. Macromol. 2015, 80, 162–169. [Google Scholar] [CrossRef]
- Jo, E.-R.; Youn, C.K.; Jun, Y.; Cho, S.I. The Protective Role of Ferulic Acid against Cisplatin-Induced Ototoxicity. Int. J. Pediatr. Otorhinolaryngol. 2019, 120, 30–35. [Google Scholar] [CrossRef]
- Pavlíková, N. Caffeic Acid and Diseases—Mechanisms of Action. Int. J. Mol. Sci. 2023, 24, 588. [Google Scholar] [CrossRef] [PubMed]
- Ali, F.; Manzoor, U.; Khan, F.I.; Lai, D.; Khan, M.K.A.; Chandrashekharaiah, K.S.; Singh, L.R.; Dar, T.A. Effect of Polyol Osmolytes on the Structure-Function Integrity and Aggregation Propensity of Catalase: A Comprehensive Study Based on Spectroscopic and Molecular Dynamic Simulation Measurements. Int. J. Biol. Macromol. 2022, 209, 198–210. [Google Scholar] [CrossRef]
- Zhu, X.; Lu, Y.; Wang, J.; Xu, Q. Investigation of the Interactions between Indole-3-Acetic Acid and Catalase: A Spectroscopic Study in Combination with Second-Order Calibration and Molecular Docking Methods. Anal. Methods 2013, 5, 6037. [Google Scholar] [CrossRef]
- Sun, N.; Li, M.; Liu, G.; Jing, M.; He, F.; Cao, Z.; Zong, W.; Tang, J.; Gao, C.; Liu, R. Toxic Mechanism of Pyrene to Catalase and Protective Effects of Vitamin C: Studies at the Molecular and Cell Levels. Int. J. Biol. Macromol. 2021, 171, 225–233. [Google Scholar] [CrossRef]
- Jing, M.; Han, G.; Wan, J.; Zhang, S.; Yang, J.; Zong, W.; Niu, Q.; Liu, R. Catalase and Superoxide Dismutase Response and the Underlying Molecular Mechanism for Naphthalene. Sci. Total Environ. 2020, 736, 139567. [Google Scholar] [CrossRef] [PubMed]
- Zong, W.; Liu, R.; Sun, F.; Teng, Y.; Fang, X.; Chai, J. A New Strategy to Identify and Eliminate the Inner Filter Effects by Outer Filter Technique. J. Fluoresc. 2011, 21, 1249–1254. [Google Scholar] [CrossRef] [PubMed]
- Gehlen, M.H. The Centenary of the Stern-Volmer Equation of Fluorescence Quenching: From the Single Line Plot to the SV Quenching Map. J. Photochem. Photobiol. C: Photochem. Rev. 2020, 42, 100338. [Google Scholar] [CrossRef]
- Zhang, R.; Wu, Q.; Liu, R. Characterizing the Binding Interaction between Ultrafine Carbon Black (UFCB) and Catalase: Electron Microscopy and Spectroscopic Analysis. RSC Adv. 2017, 7, 42549–42558. [Google Scholar] [CrossRef]
- Lakowicz, J.R. Principles of Fluorescence Spectroscopy; Springer: Berlin/Heidelberg, Germany, 2006; ISBN 978-0-387-46312-4. [Google Scholar]
- Rashtbari, S.; Dehghan, G.; Yekta, R.; Jouyban, A. Investigation of the Binding Mechanism and Inhibition of Bovine Liver Catalase by Quercetin: Multi-Spectroscopic and Computational Study. BioImpacts 2017, 7, 147–153. [Google Scholar] [CrossRef]
- Zhu, J.; Zhang, X.; Li, D.; Jin, J. Probing the Binding of Flavonoids to Catalase by Molecular Spectroscopy. J. Mol. Struct. 2007, 843, 38–44. [Google Scholar] [CrossRef]
- Zheng, P.; Wang, X.; Cui, Y.; Tang, R.; Yu, H.; Wang, L.; Li, Y. Fast Determination of Protein Binding Constants and Sites to Active Flavonoids and Phenolic Acids by Affinity Capillary Electrophoresis and Fluorescence Spectroscopy. Chem. Biol. Drug Des. 2025, 106, e70148. [Google Scholar] [CrossRef]
- Yang, Y.; Wang, S.; Liu, X.; Zhang, W.; Tong, W.; Luo, H.; Zhao, L. Interactions of Ferulic Acid and Ferulic Acid Methyl Ester with Endogenous Proteins: Determination Using the Multi-Methods. Heliyon 2024, 10, e24605. [Google Scholar] [CrossRef]
- Kang, J.; Liu, Y.; Xie, M.; Li, S.; Jiang, M.; Wang, Y. Interactions of Human Serum Albumin with Chlorogenic Acid and Ferulic Acid. BBA - Gen. Subj. 2004, 1674, 205–214. [Google Scholar] [CrossRef]
- Calabrese, E.J. Evidence That Hormesis Represents an “Overcompensation” Response to a Disruption in Homeostasis. Ecotoxicol. Environ. Saf. 1999, 42, 135–137. [Google Scholar] [CrossRef]
- Selwyn, M.J. A Simple Test for Inactivation of an Enzyme during Assay. BBA - Enzymol. Biol. Oxid. 1965, 105, 193–195. [Google Scholar] [CrossRef]
- Cantemir, A.R.; Raducan, A.; Puiu, M.; Oancea, D. Kinetics of Thermal Inactivation of Catalase in the Presence of Additives. Process Biochem. 2013, 48, 471–477. [Google Scholar] [CrossRef]
- Raducan, A.; Cantemir, A.R.; Puiu, M.; Oancea, D. Kinetics of Hydrogen Peroxide Decomposition by Catalase: Hydroxylic Solvent Effects. Bioprocess Biosyst. Eng. 2012, 35, 1523–1530. [Google Scholar] [CrossRef]
- Gebicka, L.; Banasiak, E. Flavonoids as Reductants of Ferryl Hemoglobin. Acta Biochim. Pol. 2009, 56, 509–513. [Google Scholar] [CrossRef] [PubMed]
- Sharma, M.; Hashmi, M.A.; Mahmood, R. Investigating the Binding of Caffeic Acid to Human Hemoglobin Using Multispectroscopic and Molecular Docking Approaches. J. Mol. Struct. 2024, 1302, 137519. [Google Scholar] [CrossRef]
- Henriksen, A.; Smith, A.T.; Gajhede, M. The Structures of the Horseradish Peroxidase C-Ferulic Acid Complex and the Ternary Complex with Cyanide Suggest How Peroxidases Oxidize Small Phenolic Substrates. J. Biol. Chem. 1999, 274, 35005–35011. [Google Scholar] [CrossRef]
- Ianni, J.C. Kintecus. Available online: www.kintecus.com (accessed on 13 August 2025).
- Gohlke, H.; Klebe, G. Approaches to the Description and Prediction of the Binding Affinity of Small-Molecule Ligands to Macromolecular Receptors. Angew. Chem. Int. Ed. 2002, 41, 2644–2676. [Google Scholar] [CrossRef]
- Honarparvar, B.; Govender, T.; Maguire, G.E.M.; Soliman, M.E.S.; Kruger, H.G. Integrated Approach to Structure-Based Enzymatic Drug Design: Molecular Modeling, Spectroscopy, and Experimental Bioactivity. Chem. Rev. 2014, 114, 493–537. [Google Scholar] [CrossRef]
- Purwar, N.; McGarry, J.M.; Kostera, J.; Pacheco, A.A.; Schmidt, M. Interaction of Nitric Oxide with Catalase: Structural and Kinetic Analysis. Biochemistry 2011, 50, 4491–4503. [Google Scholar] [CrossRef]
- Huo, M.; Zhao, L.; Wang, T.; Zong, W.; Liu, R. Binding Mechanism of Maltol with Catalase Investigated by Spectroscopy, Molecular Docking, and Enzyme Activity Assay. J. Mol. Recognit. 2020, 33, e2822. [Google Scholar] [CrossRef]
- Andreozzi, R.; Canterino, M.; Caprio, V.; Di Somma, I.; Marotta, R. Use of an Amorphous Iron Oxide Hydrated as Catalyst for Hydrogen Peroxide Oxidation of Ferulic Acid in Water. J. Hazard. Mater. 2008, 152, 870–875. [Google Scholar] [CrossRef]
- Spagnol, C.M.; Assis, R.P.; Brunetti, I.L.; Isaac, V.L.B.; Salgado, H.R.N.; Corrêa, M.A. In Vitro Methods to Determine the Antioxidant Activity of Caffeic Acid. Spectrochim. Acta Part A: Mol. Biomol. Spectrosc. 2019, 219, 358–366. [Google Scholar] [CrossRef]
- Beers, R.F.; Sizer, I.W. A Spectrophotometric Method for Measuring the Breakdown of Hydrogen Peroxide by Catalase. J. Biol. Chem. 1952, 195, 133–140. [Google Scholar] [CrossRef]
- McDonald, A.G.; Tipton, K.F. Parameter Reliability and Understanding Enzyme Function. Molecules 2022, 27, 263. [Google Scholar] [CrossRef]
- Morris, G.M.; Huey, R.; Lindstrom, W.; Sanner, M.F.; Belew, R.K.; Goodsell, D.S.; Olson, A.J. AutoDock4 and AutoDockTools4: Automated Docking with Selective Receptor Flexibility. J. Comput. Chem. 2009, 30, 2785–2791. [Google Scholar] [CrossRef] [PubMed]
- Udrea, A.M.; Staicu, A.; Smarandache, A.; Andrei, I.R.; Badea, M.A.; Avram, S.; Pascu, M.L.; Pirvulescu, R.A.; Balas, M. Enhancement of Chlorpromazine Efficacy in Breast Cancer Treatment by 266 Nm Laser Irradiation. Sci. Rep. 2024, 14, 30329. [Google Scholar] [CrossRef] [PubMed]
- Udrea, A.-M.; Dinache, A.; Staicu, A.; Avram, S. Target Prediction of 5,10,15,20-Tetrakis(4′-Sulfonatophenyl)-Porphyrin Using Molecular Docking. Pharmaceutics 2022, 14, 2390. [Google Scholar] [CrossRef] [PubMed]


Disclaimer/Publisher’s Note: The statements, opinions and data contained in all publications are solely those of the individual author(s) and contributor(s) and not of MDPI and/or the editor(s). MDPI and/or the editor(s) disclaim responsibility for any injury to people or property resulting from any ideas, methods, instructions or products referred to in the content. |
© 2025 by the authors. Licensee MDPI, Basel, Switzerland. This article is an open access article distributed under the terms and conditions of the Creative Commons Attribution (CC BY) license (https://creativecommons.org/licenses/by/4.0/).