
Influence of Synthesis Conditions on Physicochemical and Photocatalytic Properties of Ag Containing Nanomaterials


Abstract
1. Introduction
2. Results and Discussion
2.1. XRD Analysis
2.2. SEM Analysis
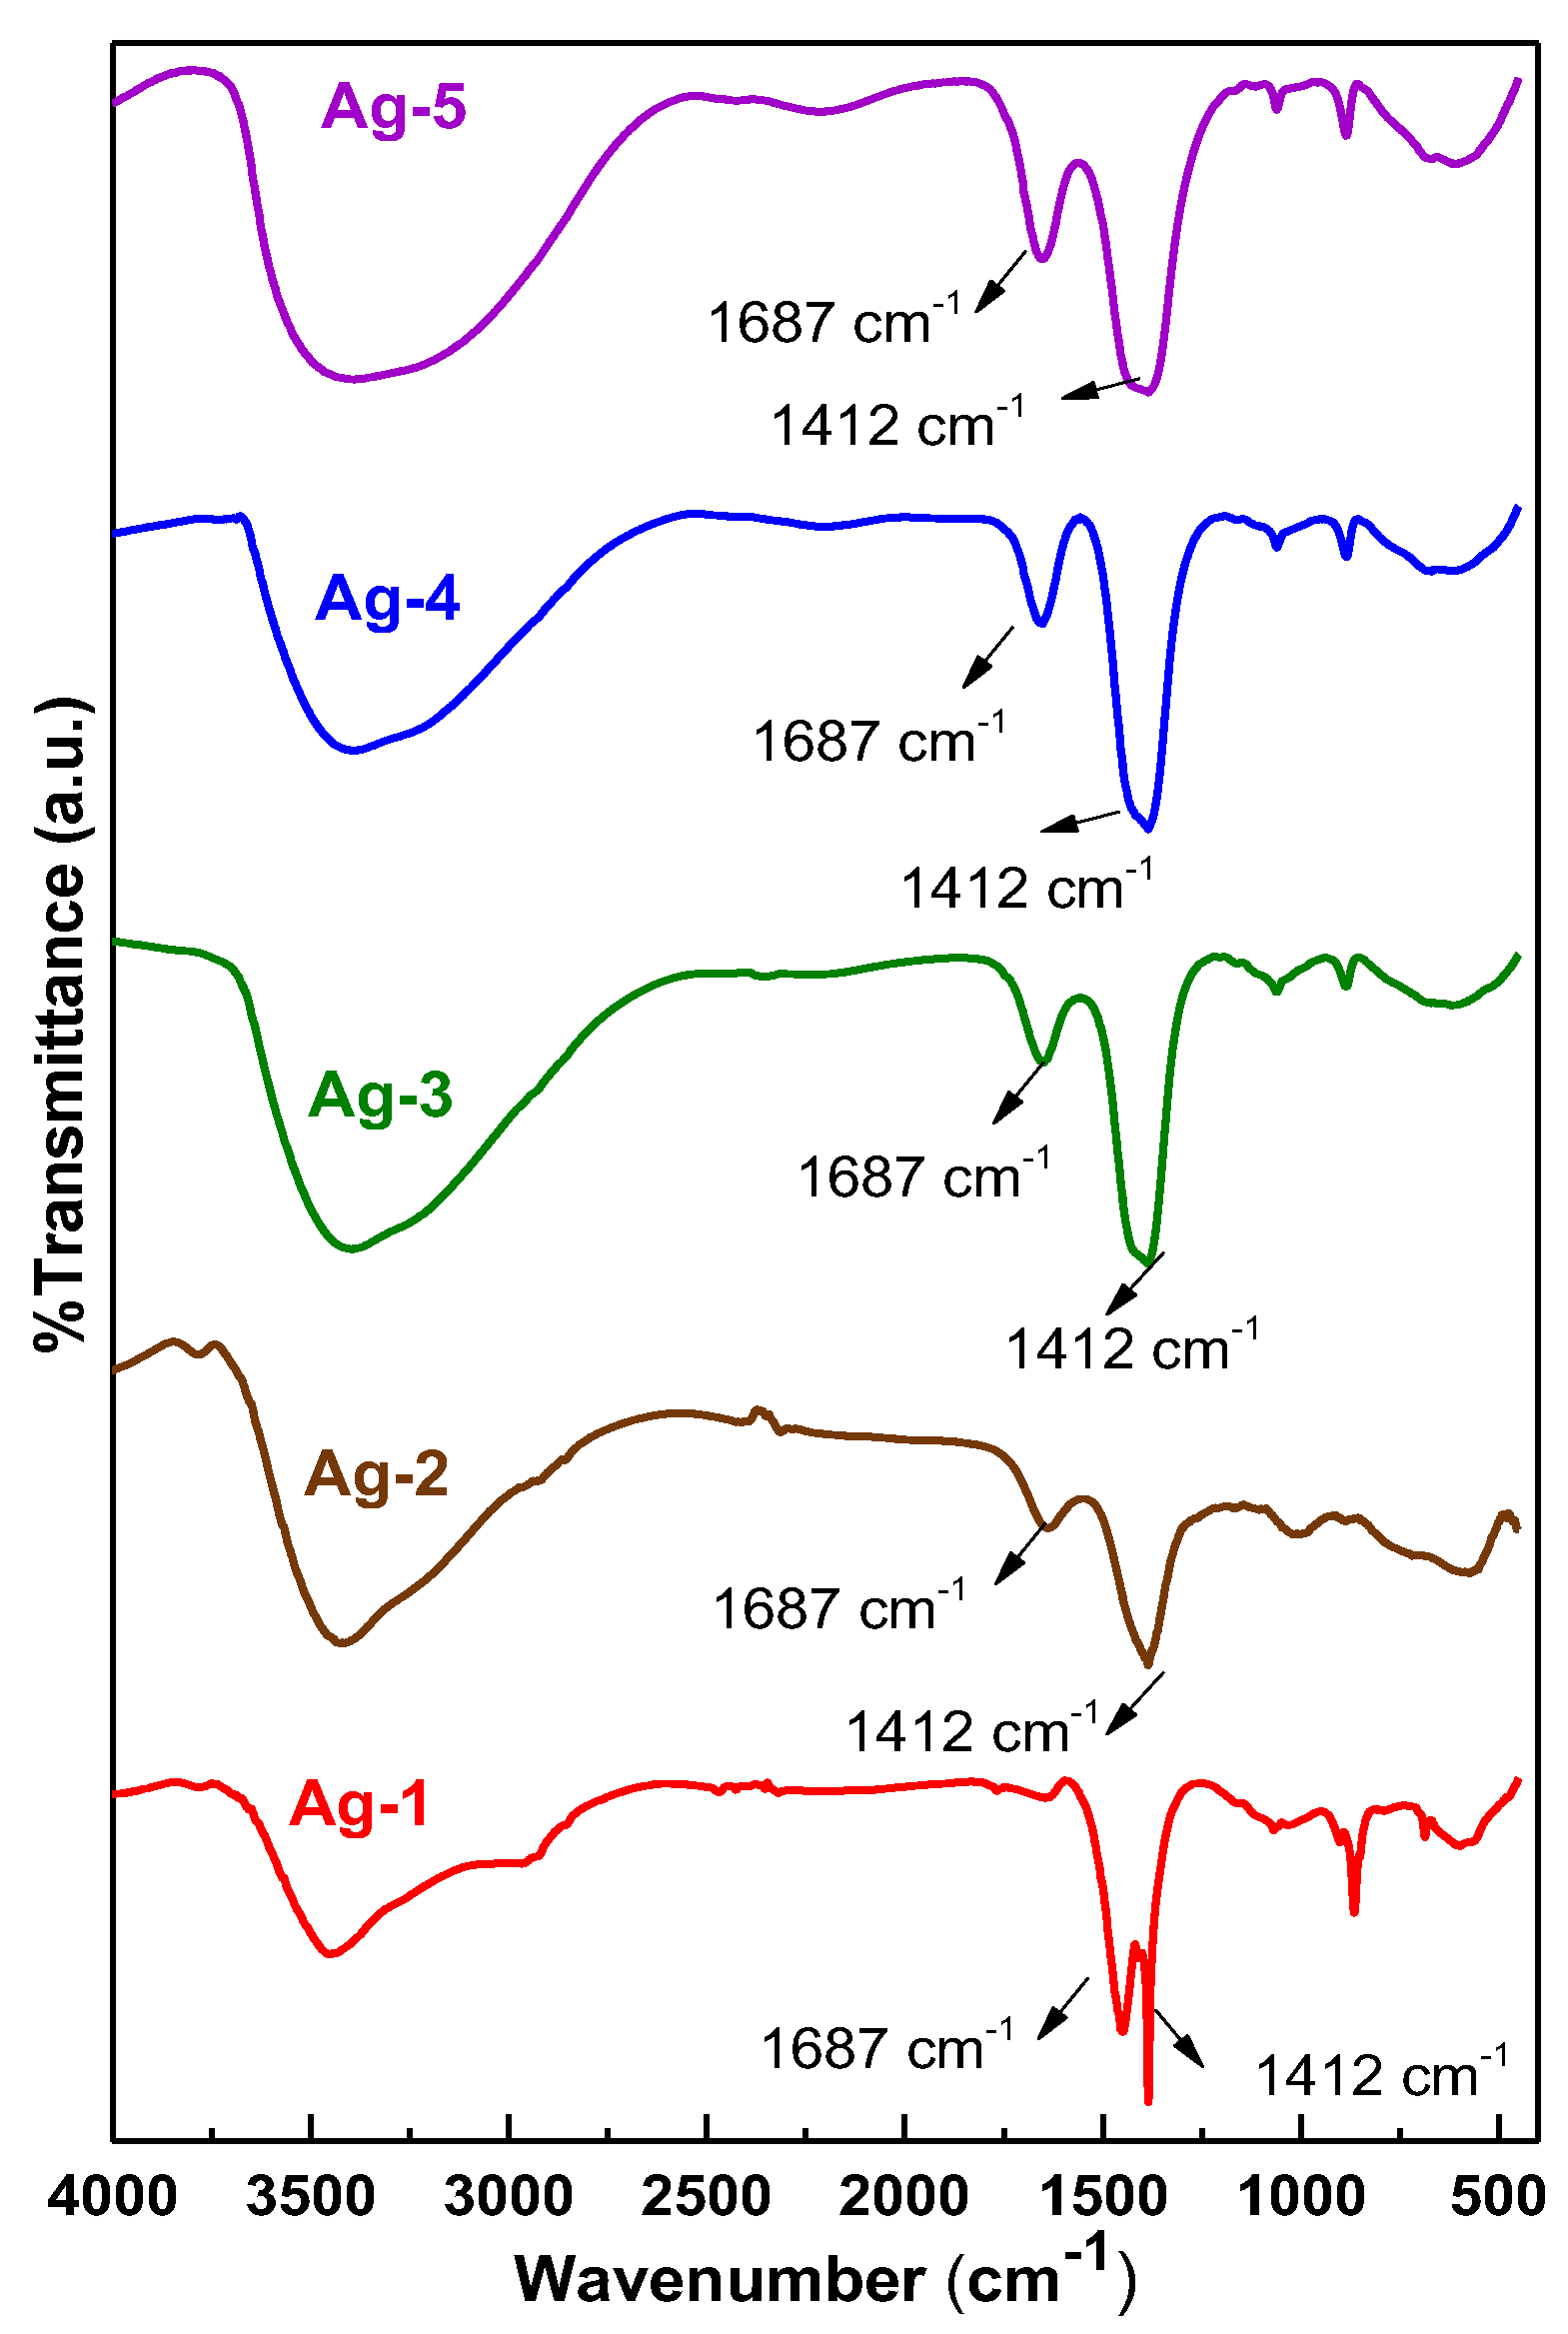
2.3. FT–IR Analysis
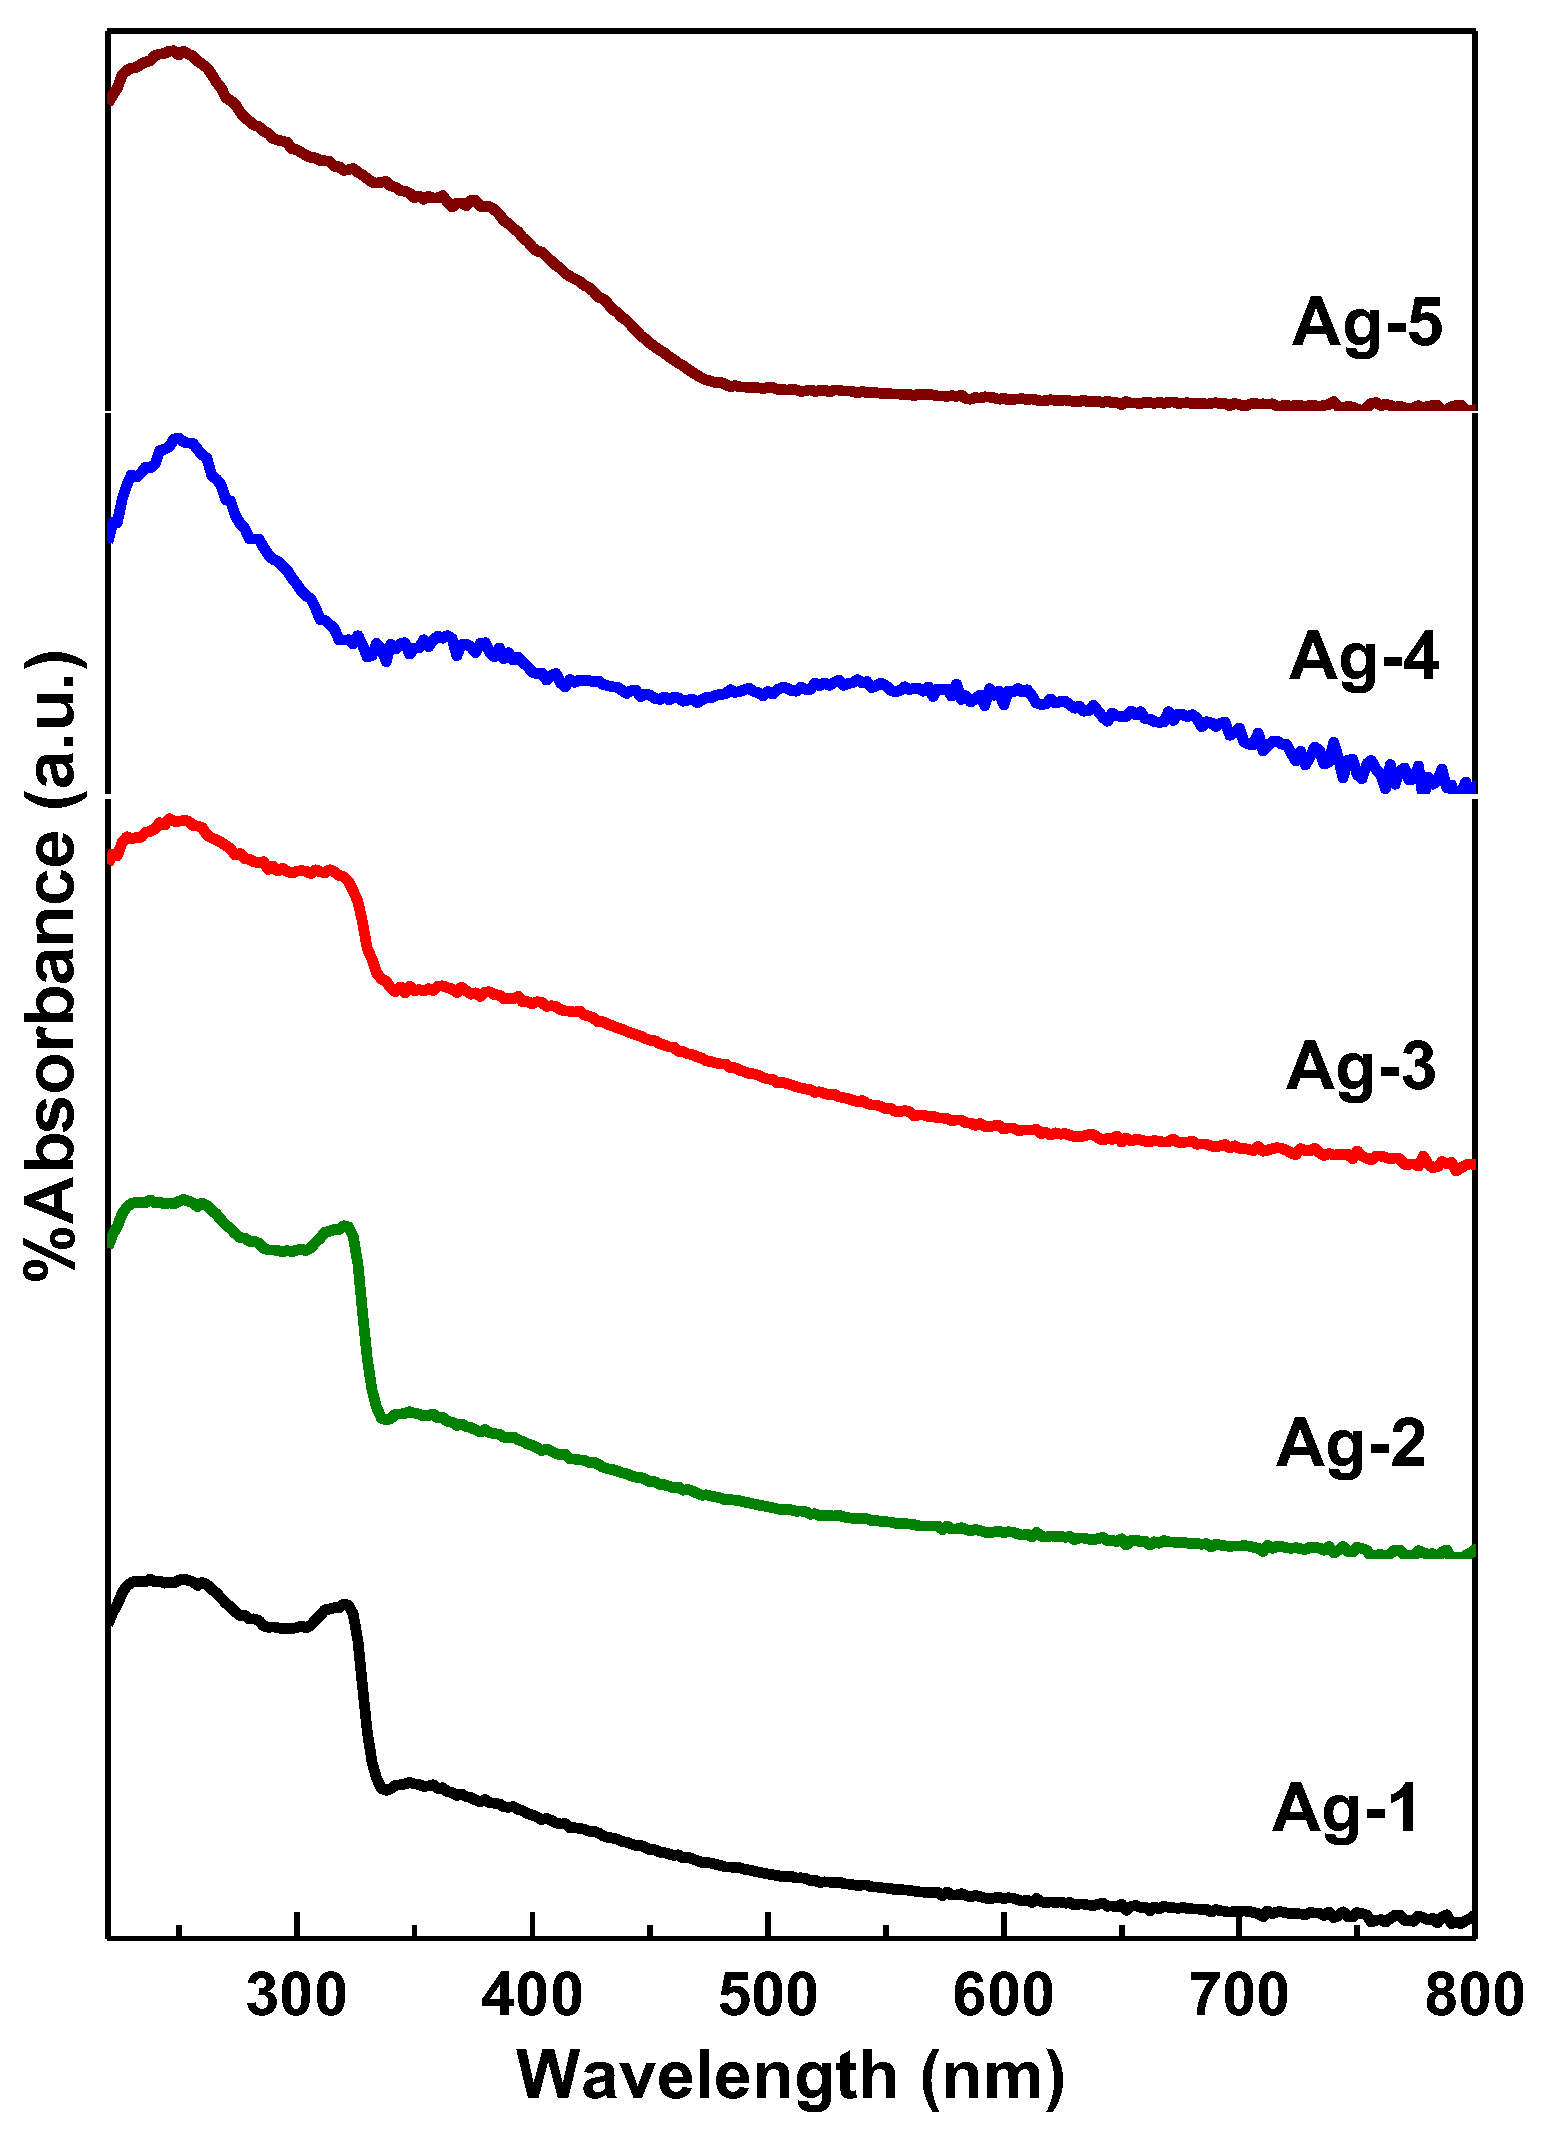
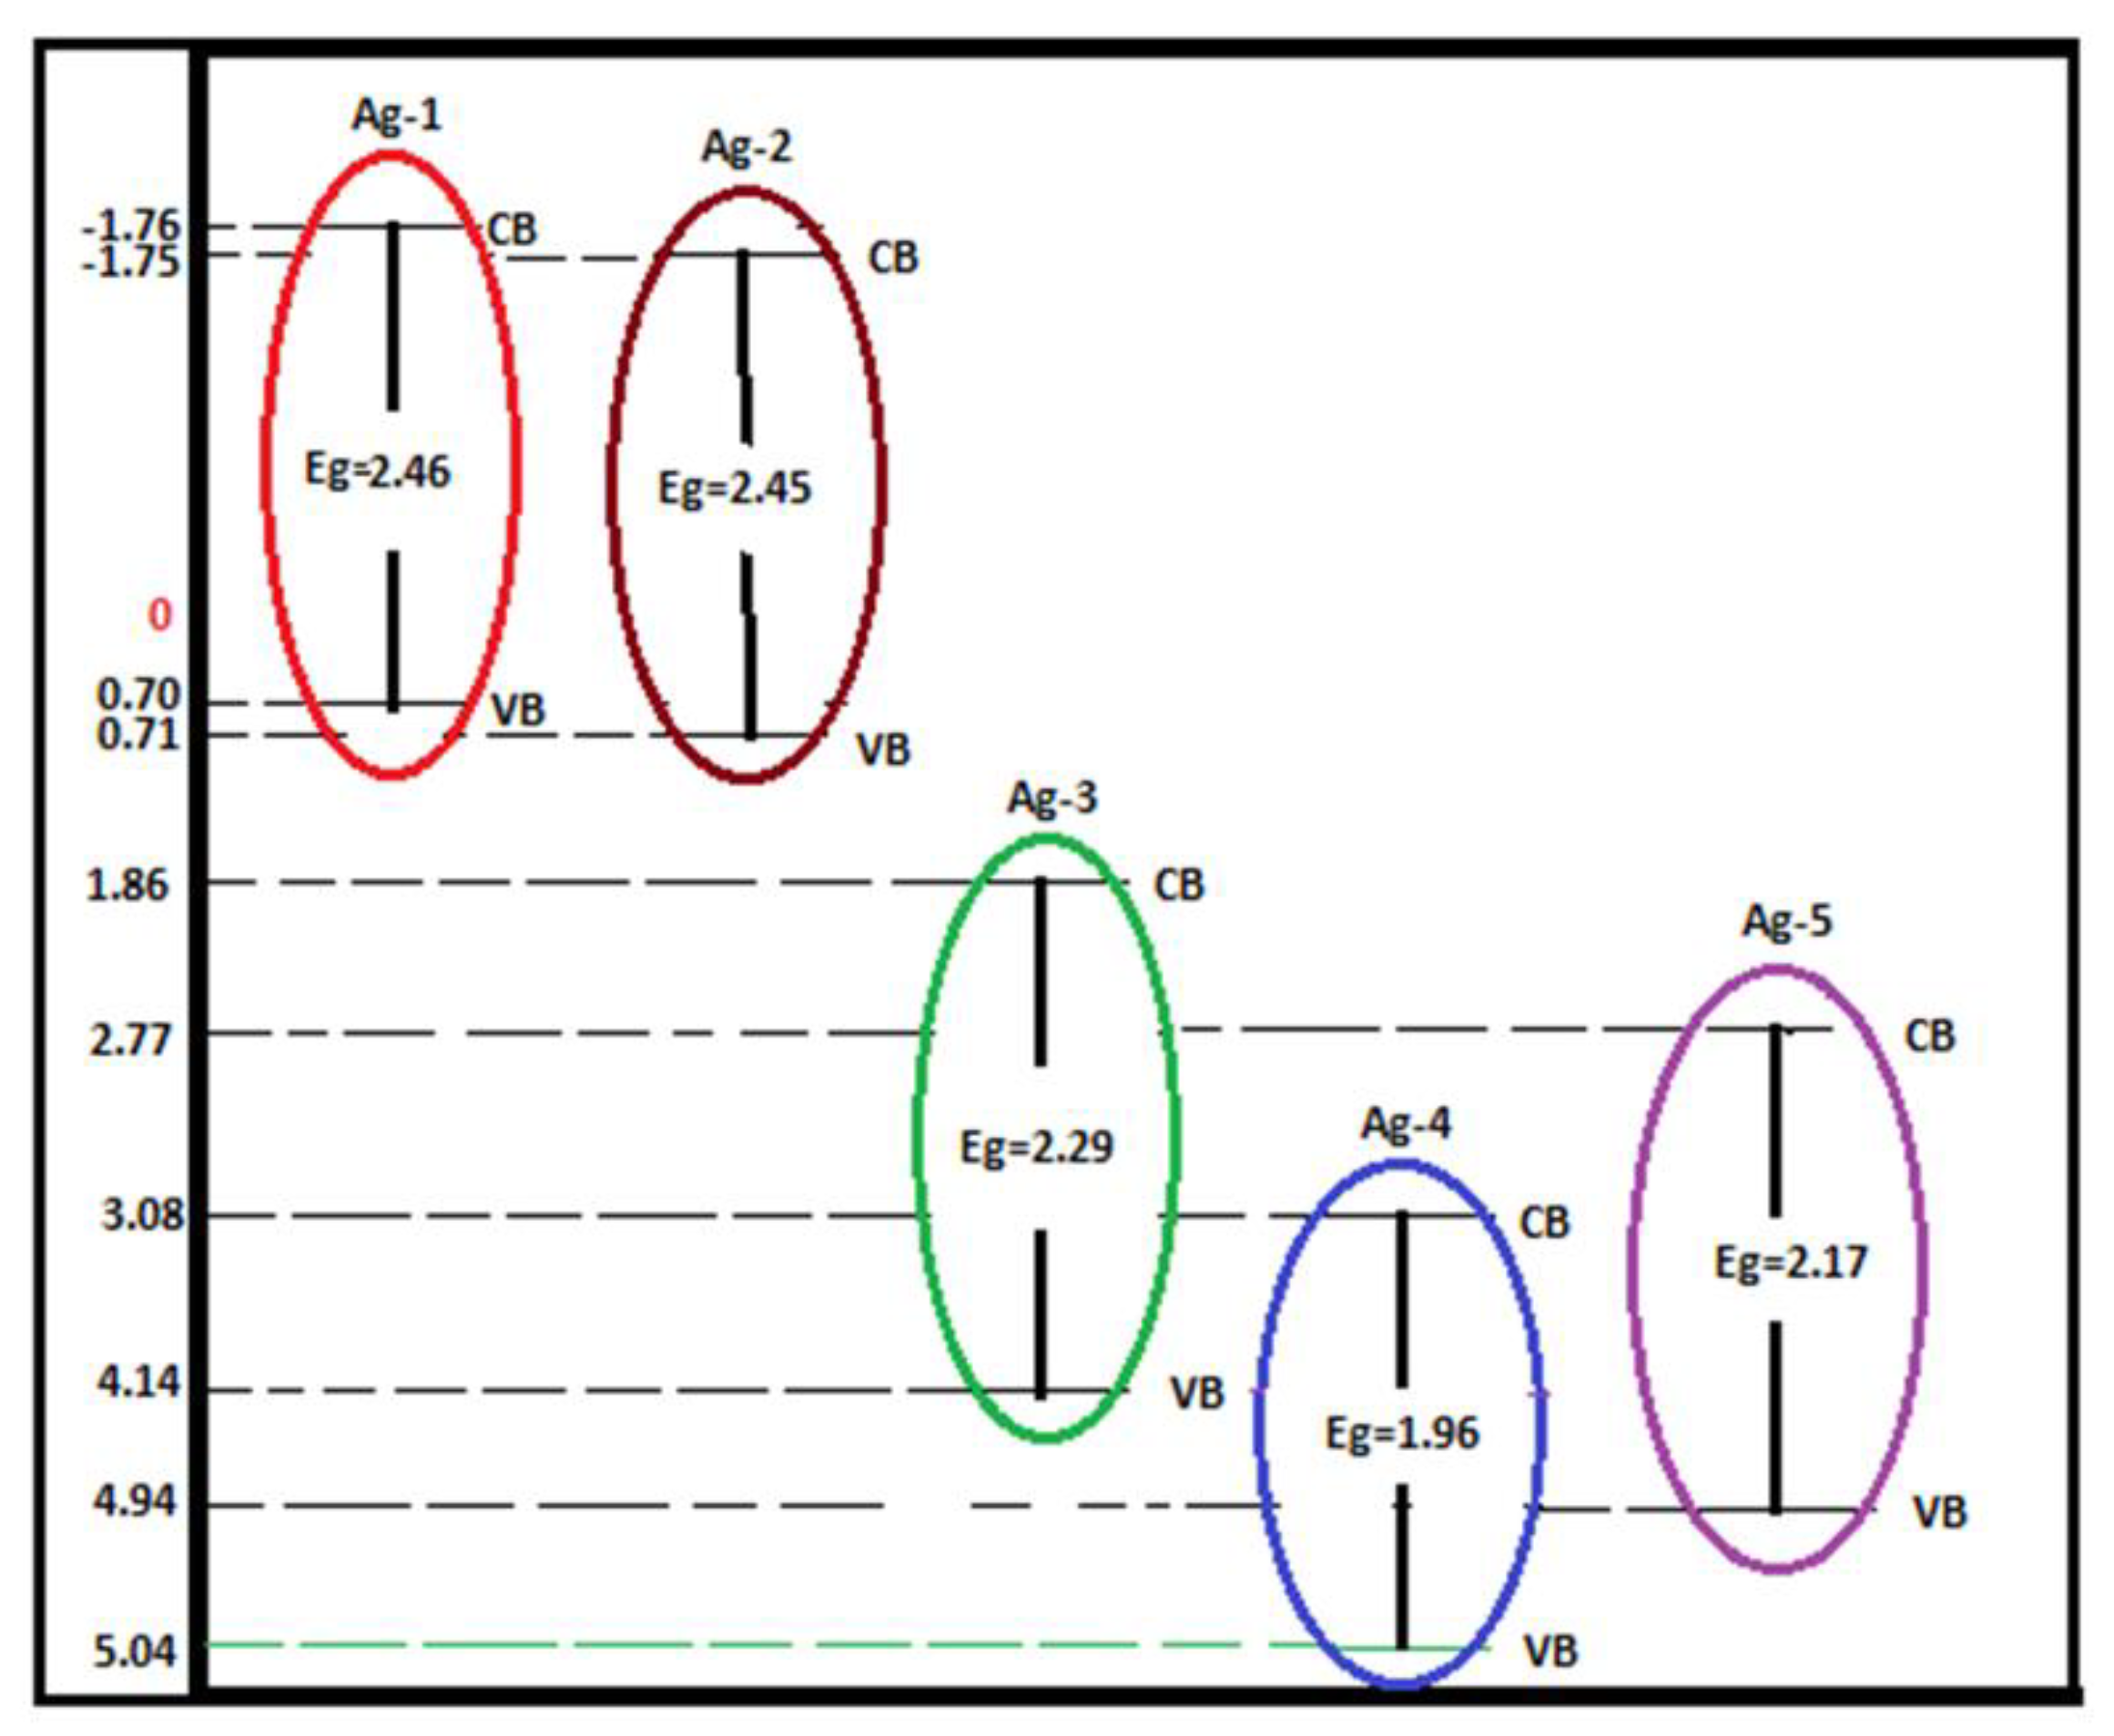
2.4. DR UV–vis Spectroscopy
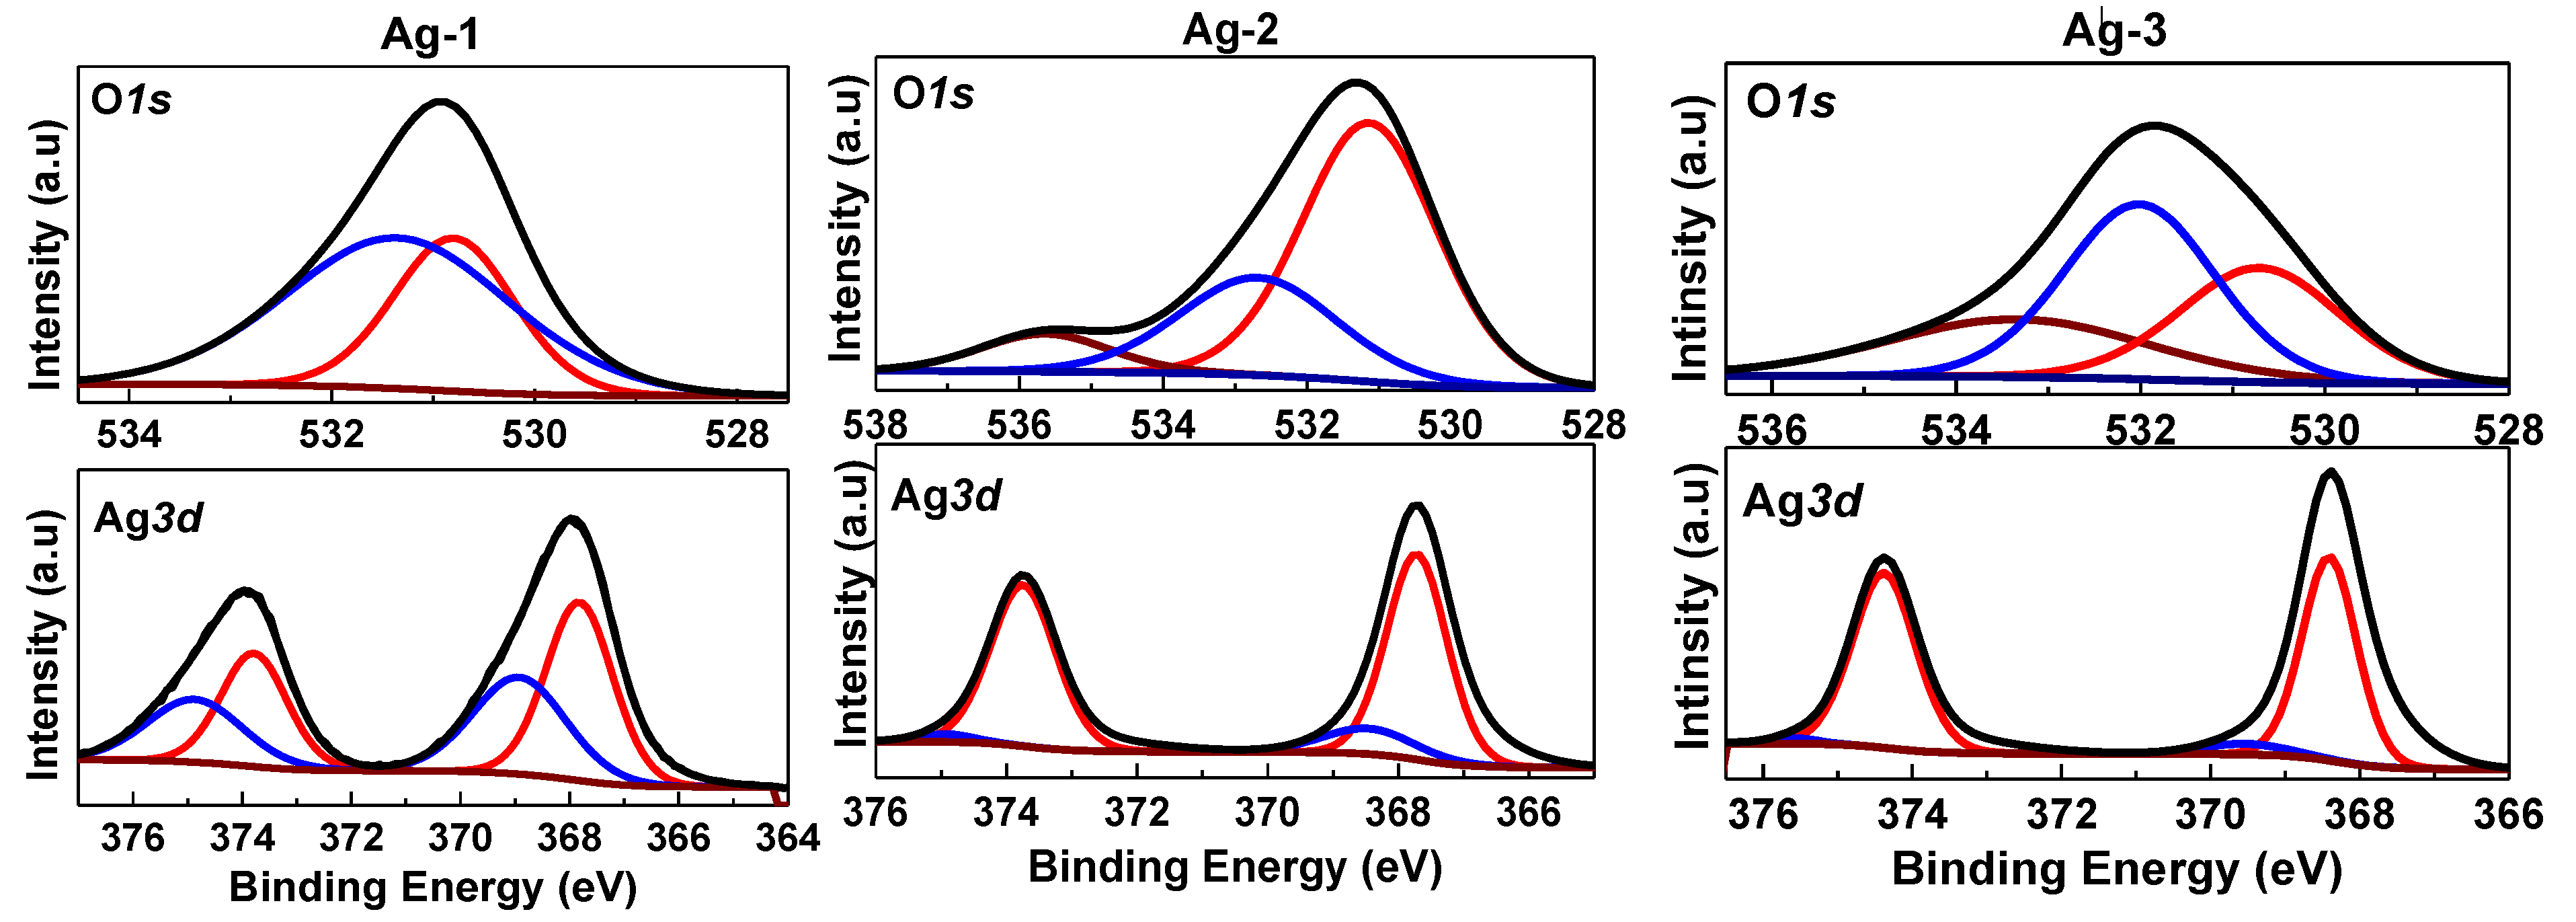
2.5. XPS Analysis
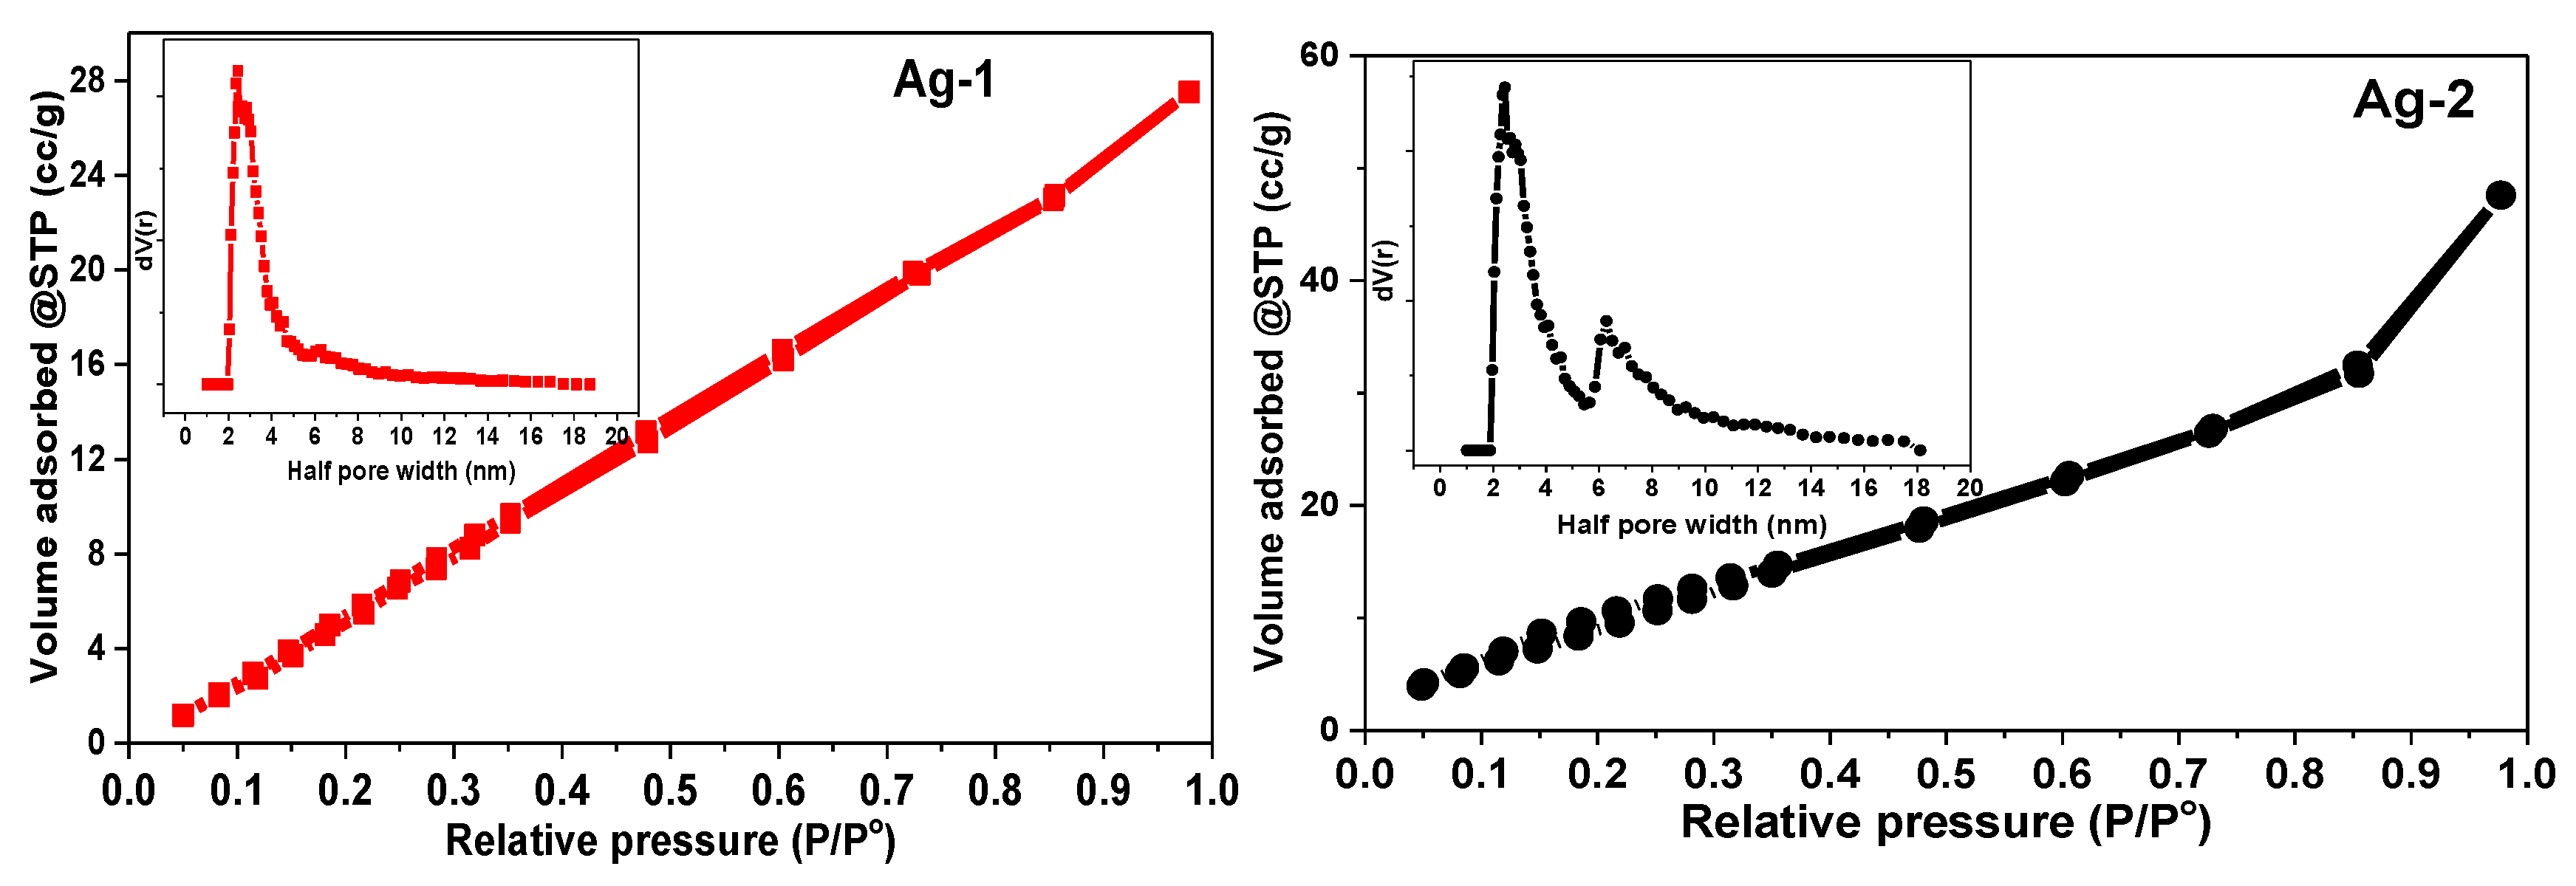
2.6. N2-Physisorption Measurements
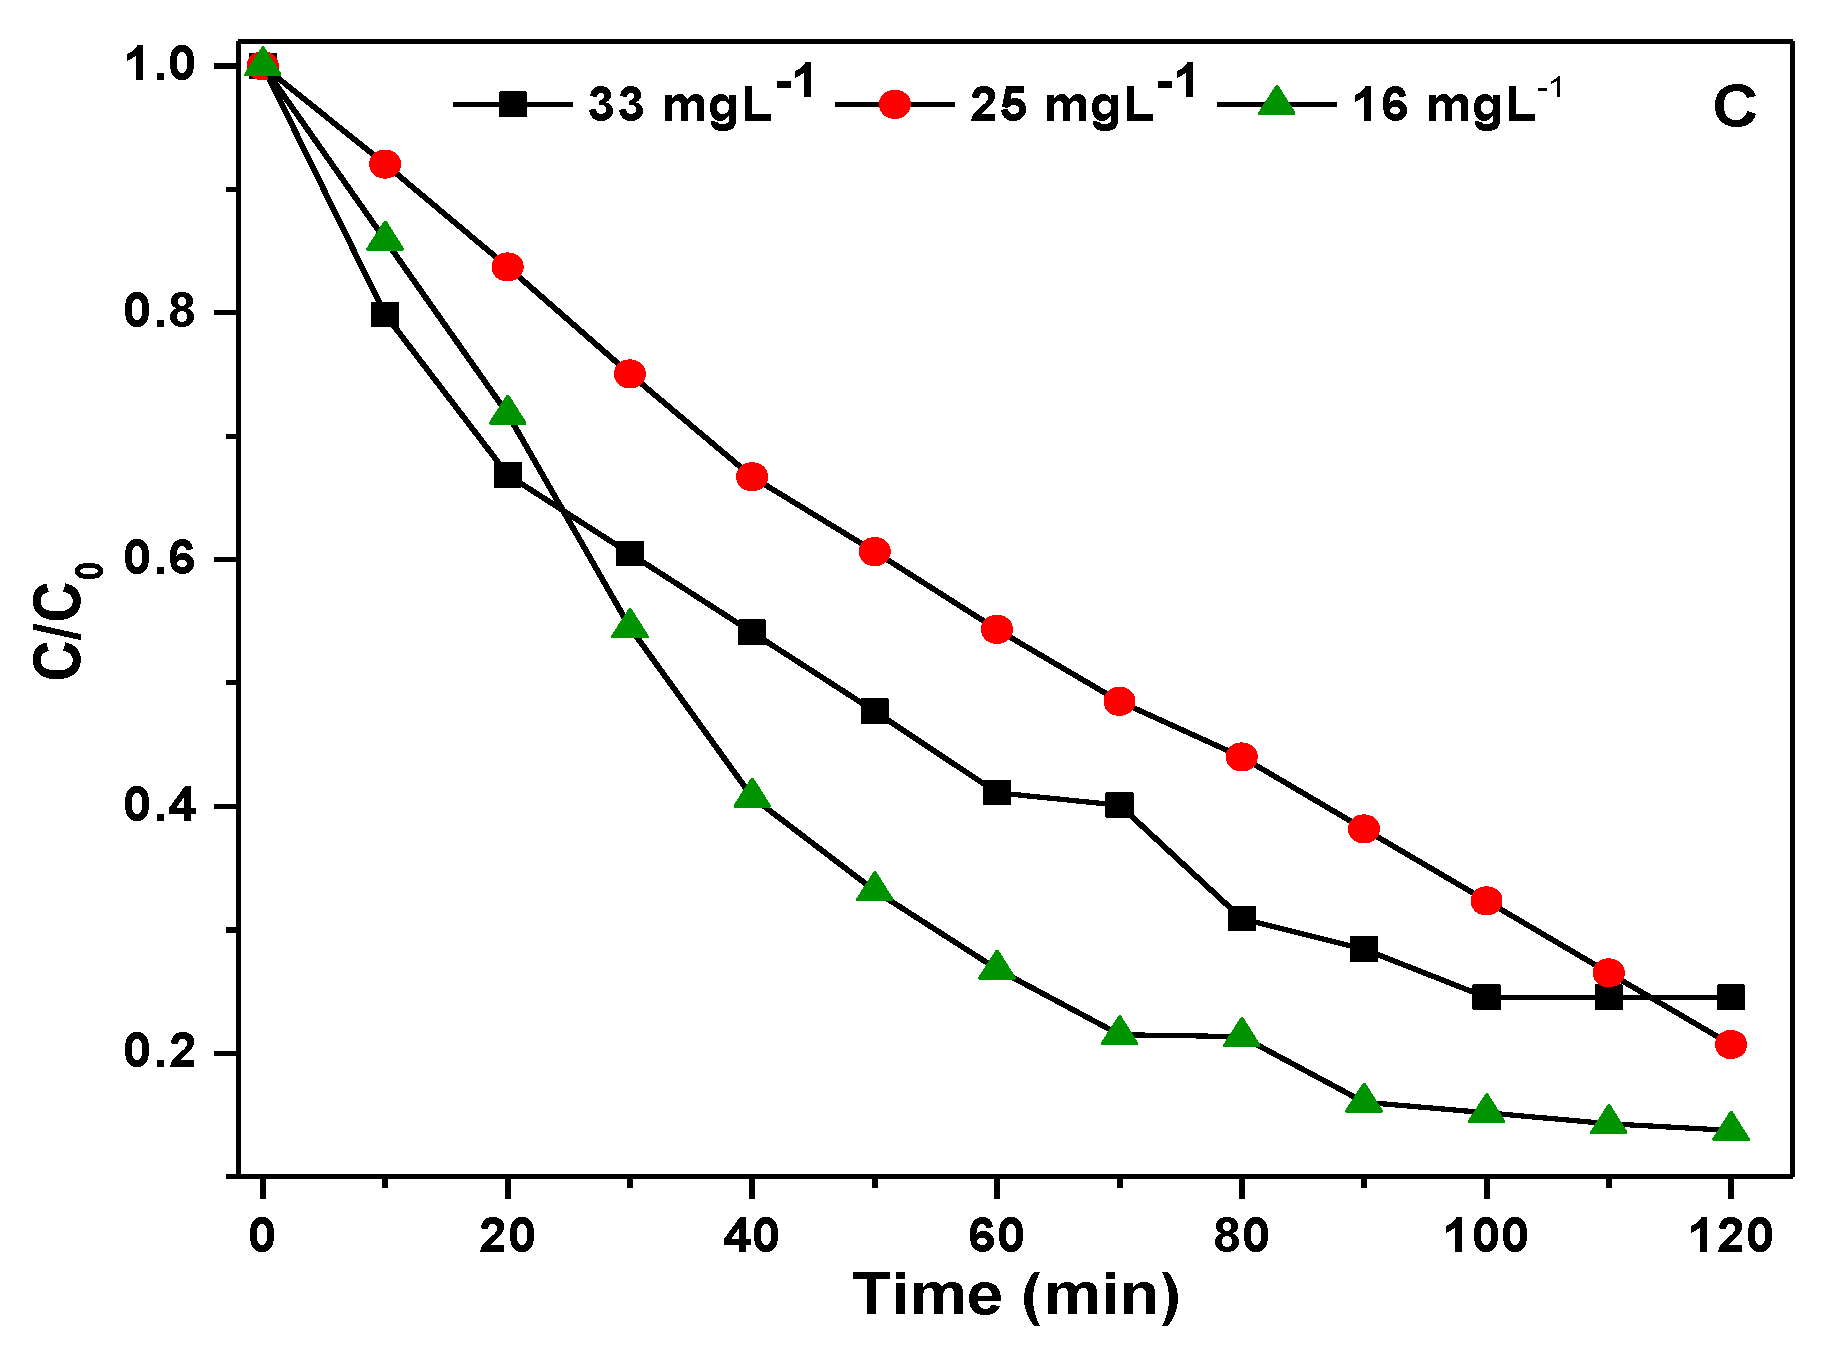
2.7. Photocatalytic Degradation of p-Nitrophenol (p-NP) over Ag Containing Nanomaterials
3. Methodology
3.1. Materials
3.2. Synthesis of Ag Containing Nanomaterials
3.3. Photocatalytic Evaluation
3.4. Characterization
4. Conclusions
Supplementary Materials
Author Contributions
Funding
Data Availability Statement
Acknowledgments
Conflicts of Interest
References
- Tiwari, D.K.; Behari, J.; Sen, P. Application of nanoparticles in waste water treatment. World Appl. Sci. J. 2008, 3, 417–433. [Google Scholar]
- Pandit, M.; Paudel, K.P. Water pollution and income relationships: A seemingly unrelated partially linear analysis. Water Resour. Res. 2016, 52, 7668–7689. [Google Scholar] [CrossRef]
- Metcalf, L.; Eddy, H.P.; Tchobanoglous, G. Wastewater Engineering: Treatment, Disposal, and Reuse; McGraw-Hill: New York, NY, USA, 1991; Volume 4. [Google Scholar]
- Sonune, A.; Ghate, R. Developments in wastewater treatment methods. Desalination 2004, 167, 55–63. [Google Scholar] [CrossRef]
- Wasewar, K.L.; Singh, S.; Kansal, S.K. Process intensification of treatment of inorganic water pollutants. Inorg. Pollut. Water 2020, 13, 245–271. [Google Scholar] [CrossRef]
- Awaleh, M.O.; Soubaneh, Y.D. Waste Water Treatment in Chemical Industries: The Concept and Current Technologies. Hydrol. Curr. Res. 2014, 5, 1–13. [Google Scholar] [CrossRef]
- Eichenbaum, G.; Johnson, M.; Kirkland, D.; O’Neill, P.; Stellar, S.; Bielawne, J.; DeWire, R.; Areia, D.; Bryant, S.; Weiner, S.; et al. Assessment of the genotoxic and carcinogenic risks of p-nitrophenol when it is present as an impu-rity in a drug product. Regul. Toxicol. Pharmacol. 2009, 55, 33–42. [Google Scholar] [CrossRef]
- Silva, E.F.; Varela, A.S.; Cardoso, T.F.; Stefanello, F.M.; Kalb, A.C.; Martínez, P.E.; Corcini, C.D. Reproductive toxicology of 2,4 dinitrophenol in boar sperm. Toxicol. Vitr. 2016, 35, 31–35. [Google Scholar] [CrossRef]
- Ren, Y.; Li, J.; Yuan, D.; Lai, B. Removal of p-nitrophenol in aqueous solution by mixed Fe0/(passivated Fe0) fixed bed filters. Ind. Eng. Chem. Res. 2017, 56, 9293–9302. [Google Scholar] [CrossRef]
- Sun, S.-P.; Lemley, A.T. p-Nitrophenol degradation by a heterogeneous Fenton-like reaction on nano-magnetite: Process optimization, kinetics, and degradation pathways. J. Mol. Catal. A Chem. 2011, 349, 71–79. [Google Scholar] [CrossRef]
- Zhang, A.; Wang, N.; Zhou, J.; Jiang, P.; Liu, G. Heterogeneous Fenton-like catalytic removal of p-nitrophenol in water using acid-activated fly ash. J. Hazard. Mater. 2012, 201–202, 68–73. [Google Scholar] [CrossRef]
- Arora, P.K.; Srivastava, A.; Singh, V.P. Bacterial degradation of nitrophenols and their derivatives. J. Hazard. Mater. 2014, 266, 42–59. [Google Scholar] [CrossRef] [PubMed]
- El Mhammedi, M.; Achak, M.; Bakasse, M.; Chtaini, A. Electrochemical determination of para-nitrophenol at apatite-modified carbon paste electrode: Application in river water samples. J. Hazard. Mater. 2009, 163, 323–328. [Google Scholar] [CrossRef] [PubMed]
- Mei, Q.; Cao, H.; Han, D.; Li, M.; Yao, S.; Xie, J.; Zhan, J.; Zhang, Q.; Wang, W.; He, M.; et al. Theoretical insight into the degradation of p-nitrophenol by OH radicals synergized with other active oxidants in aqueous solution. J. Hazard. Mater. 2020, 389, 121901. [Google Scholar] [CrossRef]
- Kuo, W. Decolorizing dye wastewater with Fenton’s reagent. Water Res. 1992, 26, 881–886. [Google Scholar] [CrossRef]
- Padmanabhan, P.; Sreekumar, K.; Thiyagarajan, T.; Satpute, R.; Bhanumurthy, K.; Sengupta, P.; Dey, G.; Warrier, K. Nano-crystalline titanium dioxide formed by reactive plasma synthesis. Vacuum 2006, 80, 1252–1255. [Google Scholar] [CrossRef]
- Gaya, U.I.; Abdullah, A.H. Heterogeneous photocatalytic degradation of organic contaminants over titanium dioxide: A review of fundamentals, progress and problems. J. Photochem. Photobiol. C Photochem. Rev. 2008, 9, 1–12. [Google Scholar] [CrossRef]
- Yang, H.; Cheng, H. Controlling nitrite level in drinking water by chlorination and chloramination. Sep. Purif. Technol. 2007, 56, 392–396. [Google Scholar] [CrossRef]
- Lu, J.; Zhang, T.; Ma, J.; Chen, Z. Evaluation of disinfection by-products formation during chlorination and chloramination of dissolved natural organic matter fractions isolated from a filtered river water. J. Hazard. Mater. 2009, 162, 140–145. [Google Scholar] [CrossRef]
- An, C.; Wang, S.; Sun, Y.; Zhang, Q.; Zhang, J.; Wang, C.; Fang, J. Plasmonic silver incorporated silver halides for efficient photocatalysis. J. Mater. Chem. A 2015, 4, 4336–4352. [Google Scholar] [CrossRef]
- Li, L.; Gao, H.; Liu, G.; Wang, S.; Yi, Z.; Wu, X.; Yang, H. Synthesis of carnation flower-like Bi2O2CO3 photocatalyst and its promising application for photoreduction of Cr(VI). Adv. Powder Technol. 2022, 33, 103481. [Google Scholar] [CrossRef]
- Li, L.; Gao, H.; Yi, Z.; Wang, S.; Wu, X.; Li, R.; Yang, H. Comparative investigation on synthesis, morphological tailoring and photocatalytic activities Bi2O2CO3 nanostructures. Colloids Surf. A Physicochem. Eng. Asp. 2022, 644, 128758. [Google Scholar] [CrossRef]
- Yu, H.; Chen, W.; Wang, X.; Xu, Y.; Yu, J. Enhanced photocatalytic activity and photoinduced stability of Ag-based photocatalysts: The synergistic action of amorphous-Ti(IV) and Fe(III) cocatalysts. Appl. Catal. B Environ. 2016, 187, 163–170. [Google Scholar] [CrossRef]
- Shi, J.; Ye, J.; Li, Q.; Zhou, Z.; Tong, H.; Xi, G.; Guo, L. Single-Crystal Nanosheet-Based Hierarchical AgSbO3 with Exposed {001} Facets: Topotactic Synthesis and En-hanced Photocatalytic Activity. Chem. A Eur. J. 2012, 18, 3157–3162. [Google Scholar] [CrossRef]
- Dai, G.; Yu, J.; Liu, G. A new approach for photocorrosion inhibition of Ag2CO3 photocatalyst with highly visi-ble-light-responsive reactivity. J. Phys. Chem. C 2012, 116, 15519–15524. [Google Scholar] [CrossRef]
- Ao, Y.; Wang, P.; Wang, C.; Hou, J.; Qian, J. Preparation of graphene oxide-Ag3PO4 composite photocatalyst with high visible light photocatalytic activity. Appl. Surf. Sci. 2013, 271, 265–270. [Google Scholar] [CrossRef]
- Wang, X.; Li, S.; Ma, Y.; Yu, H.; Yu, J. H2WO4·H2O/Ag/AgCl composite nanoplates: A plasmonic Z-scheme visible-light photocatalyst. J. Phys. Chem. C 2011, 115, 14648–14655. [Google Scholar] [CrossRef]
- Xu, H.; Li, H.; Xu, L.; Wu, C.; Sun, G.; Xu, Y.; Chu, J. Enhanced Photocatalytic Activity of Ag3VO4 Loaded with Rare-Earth Elements under Visible-Light Irradiation. Ind. Eng. Chem. Res. 2009, 48, 10771–10778. [Google Scholar] [CrossRef]
- Wang, X.; Li, S.; Yu, H.; Yu, J.; Liu, S. Ag2O as a new visible-light photocatalyst: Self-stability and high photocatalytic activity. Chem. A Eur. J. 2011, 17, 7777–7780. [Google Scholar] [CrossRef]
- Schrand, A.M.; Rahman, M.F.; Hussain, S.M.; Schlager, J.J.; Smith, D.A.; Syed, A.F. Metal-based nanoparticles and their toxicity assessment. Wiley Interdiscip. Rev. Nanomed. Nanobiotechnology 2010, 2, 544–568. [Google Scholar] [CrossRef] [PubMed]
- Yin, L.-S.; Yang, S.-Y.; He, X.; Fan, H.-L. New Preparation Method and Characterization of Spheric Silver Nanoparticles. Nanotechnol. Precis. Eng. 2010, 8, 295–299. [Google Scholar]
- Zhang, Z.; Zhao, B.; Hu, L. PVP Protective Mechanism of Ultrafine Silver Powder Synthesized by Chemical Reduction Processes. J. Solid State Chem. 1996, 121, 105–110. [Google Scholar] [CrossRef]
- Lu, H. Fabrication and characterization of porous silver powder prepared by spray drying and calcining technology. Powder Technol. 2010, 203, 176–179. [Google Scholar] [CrossRef]
- Yu, C.; Li, G.; Kumar, S.; Yang, K.; Jin, R. ChemInform Abstract: Phase Transformation Synthesis of Novel Ag2O/Ag2CO3 Heterostructures with High Visible Light Efficiency in Photocatalytic Degradation of Pollutants. Adv. Mater. 2014, 26, 892–898. [Google Scholar] [CrossRef] [PubMed]
- García, J.; López, T.; Álvarez, M.; Aguilar, D.H.; Quintana, P. Spectroscopic, structural and textural properties of CaO and CaO-SiO2 materials synthesized by sol–gel with different acid catalysts. J. Non-Cryst. Solids 2008, 354, 729–732. [Google Scholar] [CrossRef]
- Xu, H.; Song, Y.; Song, Y.; Zhu, J.; Zhu, T.; Liu, C.; Zhao, D.; Zhang, Q.; Li, H. Synthesis and characterization of g-C3N4/Ag2CO3 with enhanced visible-light photocatalytic activity for the degradation of organic pollutants. RSC Adv. 2014, 4, 34539–34547. [Google Scholar] [CrossRef]
- Sohrabnezhad, S.; Pourahmad, A.; Moghaddam, M.J.M.; Sadeghi, A. Study of antibacterial activity of Ag and Ag2CO3 nanoparticles stabilized over montmorillonite. Spectrochim. Acta Part A Mol. Biomol. Spectrosc. 2015, 136, 1728–1733. [Google Scholar] [CrossRef]
- Kumar, M.R.; Murugadoss, G.; Venkatesh, N.; Sakthivel, P. Synthesis of Ag2O-SnO2 and SnO2-Ag2O Nanocomposites and Investigation on Photocatalytic Perfor-mance under Direct Sun Light. ChemistrySelect 2020, 5, 6946–6953. [Google Scholar] [CrossRef]
- Sharma, V.; Verma, D.; Okram, G.S. Influence of surfactant, particle size and dispersion medium on surface plasmon resonance of silver nanoparticles. J. Phys. Condens. Matter 2019, 32, 145302. [Google Scholar] [CrossRef] [PubMed]
- Daniel, L.; Nagai, H.; Sato, M. Photoelectrochemical property and the mechanism of plasmonic Ag-NP/TiO2 composite thin films with high silver content fabricated using molecular precursor method. J. Mater. Sci. 2013, 3, 625–645. [Google Scholar]
- Fakhri, M.A. Annealing effects on opto-electronic properties of Ag2O films growth using thermal evaporation techniques. Int. J. Nanoelectron. Mater. 2016, 9, 93–102. [Google Scholar]
- Jiang, W.; Zeng, Y.; Wang, X.; Yue, X.; Yuan, S.; Lu, H.; Liang, B. Preparation of Silver Carbonate and its Application as Visible Light-driven Photocatalyst Without Sacrifi-cial Reagent. Photochem. Photobiol. 2015, 91, 1315–1323. [Google Scholar] [CrossRef] [PubMed]
- Bazant, P.; Kuritka, I.; Munster, L.; Kalina, L. Microwave solvothermal decoration of the cellulose surface by nanostructured hybrid Ag/ZnO particles: A joint XPS, XRD and SEM study. Cellulose 2015, 22, 1275–1293. [Google Scholar] [CrossRef]
- Kumar-Krishnan, S.; Prokhorov, E.; Hernández-Iturriaga, M.; Mota-Morales, J.D.; Vázquez-Lepe, M.; Kovalenko, Y. Chitosan/silver nanocomposites: Synergistic antibacterial action of silver nanoparticles and sil-ver ions. Eur. Polym. J. 2015, 67, 242–251. [Google Scholar] [CrossRef]
- Wang, H.; Li, J.; Huo, P.; Yan, Y.; Guan, Q. Preparation of Ag2O/Ag2CO3/MWNTs composite photocatalysts for enhancement of ciprofloxacin degrada-tion. Appl. Surf. Sci. 2016, 366, 1–8. [Google Scholar] [CrossRef]
- Fang, D.; He, F.; Xie, J.; Xue, L. Calibration of Binding Energy Positions with C1s for XPS Results. J. Wuhan Univ. Technol. Sci. Ed. 2020, 35, 711–718. [Google Scholar] [CrossRef]
- Gillen, A.J.; Villevieille, C.; Berg, E.J.; Novák, P.; El Kazzi, M. Investigation of the Early Stages of Surface Layer Formation on Cycled HE-NCM vs. LTO Electrodes Using XPS; PSI Electrochemistry Laboratory-Annual Report; Paul Scherrer Institut (PSI): Villigen, Switzerland, 2011; p. 63. [Google Scholar]
- Shi, L.; Liang, L.; Wang, F.; Liu, M.; Sun, J. Enhanced visible-light photocatalytic activity and stability over g-C3N4/Ag2CO3 composites. J. Mater. Sci. 2015, 50, 1718–1727. [Google Scholar] [CrossRef]
- Ladavos, A.; Katsoulidis, A.; Iosifidis, A.; Triantafyllidis, K.; Pinnavaia, T.; Pomonis, P. The BET equation, the inflection points of N2 adsorption isotherms and the estimation of specific surface area of porous solids. Microporous Mesoporous Mater. 2011, 151, 126–133. [Google Scholar] [CrossRef]
- Lee, S.-Y.; Park, S.-J. TiO2 photocatalyst for water treatment applications. J. Ind. Eng. Chem. 2013, 19, 1761–1769. [Google Scholar] [CrossRef]
- Długosz, O.; Szostak, K.; Krupiński, M.; Banach, M. Synthesis of Fe3O4/ZnO nanoparticles and their application for the photodegradation of anionic and cat-ionic dyes. Int. J. Environ. Sci. Technol. 2021, 18, 561–574. [Google Scholar] [CrossRef]
- Dai, K.; Lu, L.; Dawson, G. Development of UV-LED/TiO2 device and their application for photocatalytic degradation of methylene blue. J. Mater. Eng. Perform. 2013, 22, 1035–1040. [Google Scholar] [CrossRef]
- Dariani, R.; Esmaeili, A.; Mortezaali, A.; Dehghanpour, S. Photocatalytic reaction and degradation of methylene blue on TiO2 nano-sized particles. Optik 2016, 127, 7143–7154. [Google Scholar] [CrossRef]


| Sample | Crystallite Size (nm) a | Particle Size (nm) b | Band Gap (eV) c | Surface Area (m2/g) d | Pore Volume (cc/g) d | Pore Radius (nm) d |
|---|---|---|---|---|---|---|
| Ag-1 | 19.8 | 30 | 2.46 | 29.9 | 0.029 | 2.45 |
| Ag-2 | 19.9 | 40 | 2.45 | 42.5 | 0.039 | 2.45 |
| Ag-3 | 29.1 | 42 | 2.29 | 46.0 | 0.045 | 2.84 |
| Ag-4 | 45.3 | 58 | 1.96 | 56.4 | 0.053 | 2.84 |
| Ag-5 | 49.4 | 75 | 2.17 | 48.5 | 0.049 | 2.84 |
| Reaction Parameters | R2 | K (k/min−1) | Photodegradation Efficiency (%) | |
|---|---|---|---|---|
| pH | 10.0 | 0.99 | 0.00862 | 67.91 |
| 7.0 | 0.98 | 0.01203 | 75.47 | |
| 4.0 | 0.99 | 0.01036 | 73.28 | |
| Catalyst Dose | 100 mg | 0.98 | 0.01203 | 75.47 |
| 75 mg | 0.99 | 0.01082 | 72.69 | |
| 50 mg | 0.99 | 0.00375 | 39.94 | |
| p-NP Concentration | 33 mg·L−1 | 0.98 | 0.01203 | 75.47 |
| 25 mg·L−1 | 0.98 | 0.01240 | 80.14 | |
| 16 mg·L−1 | 0.98 | 0.01785 | 86.24 | |
| Sample | Synthesis Conditions | ||||
|---|---|---|---|---|---|
| Template | Solvent | pH (by NaHCO3) | Hydrothermal Treatment | Calcination Temp. (°C) | |
| Ag-1 | PVP-K36 | MeOH:EtOH: H2O | 8 | 100 °C, 24 h | 400 |
| Ag-2 | PVP-K36 | MeOH:EtOH: H2O | 8 | — | 400 |
| Ag-3 | — | MeOH:EtOH: H2O | 8 | — | 250 |
| Ag-4 | — | MeOH:EtOH: H2O | 8 | — | 50 |
| Ag-5 | — | MeOH:EtOH: H2O | 8 | 100 °C, 24 h | 50 |
Publisher’s Note: MDPI stays neutral with regard to jurisdictional claims in published maps and institutional affiliations. |
© 2022 by the authors. Licensee MDPI, Basel, Switzerland. This article is an open access article distributed under the terms and conditions of the Creative Commons Attribution (CC BY) license (https://creativecommons.org/licenses/by/4.0/).
Share and Cite
Al-Malwi, S.D.; Al-Ammari, R.H.; Alshehri, A.; Narasimharao, K. Influence of Synthesis Conditions on Physicochemical and Photocatalytic Properties of Ag Containing Nanomaterials. Catalysts 2022, 12, 1226. https://doi.org/10.3390/catal12101226
Al-Malwi SD, Al-Ammari RH, Alshehri A, Narasimharao K. Influence of Synthesis Conditions on Physicochemical and Photocatalytic Properties of Ag Containing Nanomaterials. Catalysts. 2022; 12(10):1226. https://doi.org/10.3390/catal12101226
Chicago/Turabian StyleAl-Malwi, Salwa D., Rahmah H. Al-Ammari, Abdulmohsen Alshehri, and Katabathini Narasimharao. 2022. "Influence of Synthesis Conditions on Physicochemical and Photocatalytic Properties of Ag Containing Nanomaterials" Catalysts 12, no. 10: 1226. https://doi.org/10.3390/catal12101226
APA StyleAl-Malwi, S. D., Al-Ammari, R. H., Alshehri, A., & Narasimharao, K. (2022). Influence of Synthesis Conditions on Physicochemical and Photocatalytic Properties of Ag Containing Nanomaterials. Catalysts, 12(10), 1226. https://doi.org/10.3390/catal12101226