Abstract
In this study, TiO2 thin films were deposited by ultrasonic spray pyrolysis from solutions with concentrations of 0.1 and 0.2 M. The deposition temperature was adjusted at 350 °C and all samples were annealed at 500 °C for 1 h in air. The thickness of TiO2 films was changed in the range of 50 to ca. 800 nm by varying the number of spray cycles from 1 to 21 and the solution concentration. The results showed that the mean crystallite size of the anatase structure, the surface roughness, and light absorption increased with the film thickness. The effect of film thickness on the photocatalytic activity was investigated with the photodegradation of stearic acid under UV-A irradiation. The optimal thickness of TiO2 films fabricated by ultrasonic spray pyrolysis for photocatalytic self-cleaning applications was in the range of 170–230 nm, indicating a ca. 2.6 times-higher photocatalytic self-cleaning activity compared to the reference sample, Pilkington ActivTM. The photocatalytic results showed that the 190 nm-thick TiO2 film deposited from the 0.1 M solution applying seven spray cycles exhibited the finest grain structure and maximum photocatalytic activity, leading to 94% of stearic acid degradation in 180 min under UV-A light with the reaction rate constant k = 0.01648 min−1.
1. Introduction
Highly active photocatalytic TiO2 thin films are desired in several applications, especially in pollution treatment and self-cleaning technologies [1,2,3]. Among them, self-cleaning coatings have been the most rapidly developed technology during last decades targeting a wide range of applications from window glass and cement to textiles [3,4,5]. The market growth of photocatalytic coatings is expected to be achieved by their ever-growing demand in building construction, and growing concern over pollution and airborne virus outbreaks [4]. Therefore, the application of photocatalytic coatings on high-touch surfaces will be essential in public places such as hospitals, public transportation, athletic centers, schools, acute care facilities, airports, arenas, and other facilities to reduce the spread of airborne toxins and allergens, such as COVID-19 and other viruses [5].
Photocatalytic reaction is fundamentally a surface reaction; however, several studies have shown that the photocatalytic activity of thin films depends on the film thickness [6,7,8].
In the case of photocatalytic self-cleaning surfaces, it is important to define in which thickness the catalyst layer shows the highest photocatalytic activity and transparency in the visible spectral range in order to provide the required self-cleaning activity while retaining the visual appearance of the coated surface. The effect of thickness on photocatalytic activity has been studied for nanocrystalline TiO2 thin films, for example, obtained by atomic layer deposition (ALD) [9,10], sputtering [6,11,12], metal-organic chemical vapor deposition (MOCVD) [13,14], and sol–gel methods [15,16,17,18,19].
Kääriäinen et al. [10] studied the TiO2 thin films in the thickness range of 2.6–260 nm deposited by ALD and reported the highest photocatalytic activity for 130 nm thick films. Blanco et al. [18] reported the highest photocatalytic activity for a 250 nm-thick sol–gel-deposited TiO2 film. On the contrary, Xianyu et al. [19] reported, for sol–gel dip-coated TiO2 films, an increase in photocatalytic activity within a thickness range of 70–670 nm. A similar increase in photocatalytic activity within the thickness range of 100 to 500 nm has also been reported for DC magnetron sputtered TiO2 films [6]. However, Marcello et al. [13] reported an optimum thickness of 395 nm for MOCVD-deposited TiO2 films, whereas Yong-Ick Cho et al. [14] reported, for MOCVD-deposited TiO2 coatings, increases in photocatalytic activity between the thickness range of 110 nm to 5 µm, which remain constant for thicker films between 5 and 15 µm. According to these studies, the photocatalytic activity of the TiO2 films improves with increasing film thickness until a limit, dominantly in the range of 130–500 nm, from which the degradation reaction remains almost constant or decreases. Some studies, on the other hand, confirm the increase in photocatalytic activity with film thickness up to several microns.
Based on the studies above, we could conclude that the photocatalytic activity of thin films is influenced by the film thickness; however, several other film parameters such as crystallinity and grain size, primarily conditioned by the thin-film preparation method, should also be taken into account.
In the wider photocatalytic self-cleaning coating application point of view, coating fabrication technologies must meet the requirements for rapid, robust, cost-effective, and resource-saving technologies, able to coat surfaces with different profiles and shapes. Chemical solution-based technologies provide the technological key for the production of cost-effective nanocrystalline transparent surface coatings. Among them, the ultrasonic spray pyrolysis (USP) method offers a possibility to fabricate nonplanar surfaces with a high uniformity [2,20]. Moreover, when processing a thin film by the chemical spray pyrolysis method, the key to engineering the film properties lays on the solution concentration [21] and deposition temperature [22], giving the fingerprint for the film properties, irrespective of the post-deposition treatment conditions [2,23]. Recently, we showed that the optimal deposition temperature of TiO2 films by USP is 350 °C. These TiO2 films with a material quantity of 0.2 mg/cm2 effectively degraded volatile organic carbon species such as acetone, acetaldehyde, and heptane [2]. However, despite the many advantages, including the easy scale-up in industry and the possibility to promptly cover large areas, there are a limited number of studies about TiO2 thin films deposited by the USP method as a photocatalytic material [2,20,24]. To the best of our knowledge, no comprehensive study has been reported focusing on the thickness effect on the photocatalytic activity of USP-prepared TiO2 thin films.
The aim of the study was to find the optimal thickness range of TiO2 thin films prepared by ultrasonic spray pyrolysis for photocatalytic applications. Therefore, we tested the effect of film thickness with different solution concentrations on the morphological, structural, and optical properties, and photocatalytic activity. In addition, the effect of solution concentration on the fingerprint properties of sprayed TiO2 films was taken into account. The photocatalytic stearic acid degradation results were compared to the commercial Pilkington Active glass as a reference material for the photocatalyst thin films.
2. Results
2.1. Material Characterization
2.1.1. Surface Morphology
Figure 1 shows the SEM surface images of TiO2 thin films deposited with 2, 6, and 15 spray cycles. All TiO2 thin films showed plane-surface morphology regardless of the solution concentration and number of spray cycles. However, with the increase in the number of spray cycles, the formation of nano-cracks become visible. The formation of nano-cracks in the thin films is usually determined by the development of compressive stress [25,26] and thermal expansion (coefficients) mismatch between the TiO2 film (8.4 × 10⁻⁶ K−1) and glass substrate (3.3 × 10⁻⁶ K−1). The effect of cracks formed on the photocatalyst film surfaces is still open for discussion, whether it has a beneficial [27] or backward effect [27,28] on the photocatalytic performance.
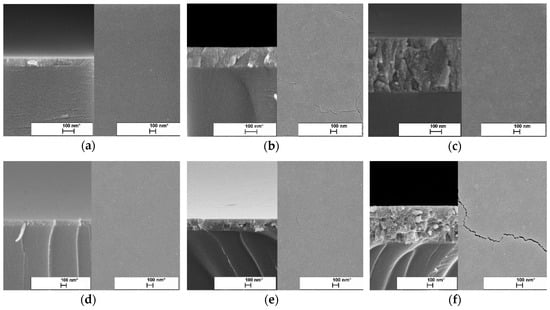
Figure 1.
Surface and cross-sectional SEM images of TiO2 thin films prepared from different solution concentrations and spray cycles. TiO2 thin films deposited from 0.1 M solution with the number of spray cycles: (a) 2, (b) 6, and (c) 15. TiO2 thin films deposited from 0.2 M solution with the number of cycles: (d) 2, (e) 6, and (f) 15.
The thickness of TiO2 films was estimated from SEM cross-sectional images (Figure 1). The thicknesses of the TiO2 films prepared from the 0.1 M solution were 65, 165, and 455 nm, while for the films from the 0.2 M solution, thicknesses of 50, 205, and 635 nm were shown with the increase in number of spray cycles from 2 to 15 (Table 1). In general, TiO2 films deposited from the 0.2 M solution were thicker compared to those deposited from the 0.1 M solution. However, films deposited at two spray cycles showed similar thicknesses.

Table 1.
Summary of the morphological and structural properties of TiO2 thin films.
Figure 2 presents AFM images (scan area 2 × 2 µm2) of the TiO2 films sprayed from the 0.1 and 0.2 M solution applying 2, 6, and 15 spray cycles. The surface of TiO2 films deposited from the 0.1 M solution at 2 and 6 spray cycles is characterized by fine grains with a size of ca. 20 nm and a low rate of agglomeration, as mainly agglomerates with a size of ca. 40 nm are visible. The characteristic RMS roughness of both films is 1.6 nm, indicating that the TiO2 films most probably tend to grow in the early stage of deposition following a layer-by-layer growth under these deposition conditions. By increasing the number of spray cycles to 15, the surface of the TiO2 films reveals agglomerates with a size in the range of 40 to 150 nm, resulting in an increase in the RMS roughness to 2.6 nm. In addition, the nano-cracks on the surface could contribute to the increased RMS roughness values. TiO2 films deposited from the 0.2 M solution show slightly different surface morphology. The characteristic grain size remains at ca. 20 nm; however, the size of agglomerates increases from ca. 50 to 100 nm by increasing the number of spray cycles from 2 to 15. This increase is also reflected in RMS roughness values, which increase from 0.8 to 1.6 nm with the spray cycles. These results are in correlation with our previous studies for TiO2 films deposited from a 0.2 M solution by the pneumatic spray pyrolysis method, indicating that TiO2 films, irrespective of the substrate, follow a 3-D growth profile, where, in the first stage, the formation of a separated island occurs, which, during further deposition, agglomerate to larger islands, retaining the characteristic grain size [29].
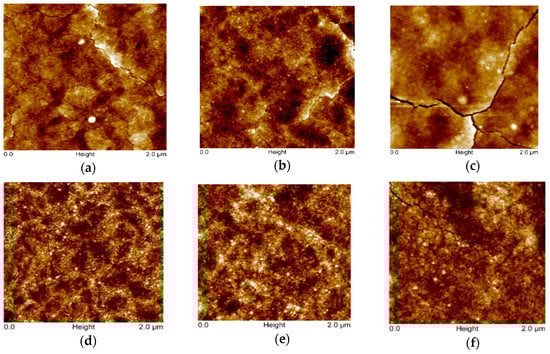
Figure 2.
AFM images of TiO2 thin films deposited from different solution concentrations and cycle numbers. TiO2 thin films deposited from 0.1 M solution with the number of spray cycles: (a) 2, (b) 6, and (c) 15. TiO2 thin films deposited from 0.2 M solution with the number of spray cycles: (d) 2, (e) 6, and (f) 15.
2.1.2. Structural Properties
Figure 3 displays XRD patterns of the TiO2 films deposited from the 0.1 and 0.2 M solution by varying the number of spray cycles from 2 to 15. As it can be seen, all TiO2 films, irrespective of the solution concentration and number of spray cycles, show anatase crystalline structure (JCPDS card No. 01-070-6826).
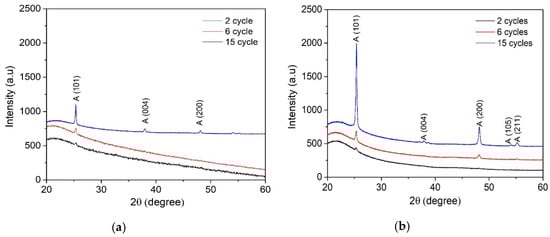
Figure 3.
XRD patterns of TiO2 films deposited from (a) 0.1 M solution with 2, 6, and 15 spray cycles and (b) 0.2 M solution with 2, 6, and 15 spray cycles.
The mean crystalline size of TiO2 films (Table 1) was calculated from the (101) anatase diffraction peak using Scherrer’s equation. It was observed that the mean crystallite size of TiO2 thin films deposited from the 0.1 M solution increased from 30 to 50 nm and that of the 0.2 M solution increased from 25 to 40 nm with the number of spray cycles from 2 to 15. TiO2 films deposited from the 0.1 M solution showed a larger mean crystallite size compared to the films deposited from the 0.2 M solution. This can be explained by the lower amount of organic residues on the film surface deposited from the 0.1 M solution compared to those deposited from the 0.2 M solution, taking into account the constant deposition time per cycle 87 s as the deposition time per cycle was kept constant at 87 s. In our previous study, we showed that sprayed TiO2 films deposited at 315–435 °C contain organic residues originating from the decomposition of the titanium (IV) isopropoxide (TTIP):Acetylacetone (AcacH) precursors system [30], and the further post-deposition treatment at 500 °C promotes the growth of crystalline structure. The presence of organic residues in the as-deposited films, which can be controlled by the deposition temperature, determines the structural properties. The results correlate with the AFM results, showing higher RMS surface roughness for the films deposited from the 0.1 M TTIP solution.
The deposition rate of the TiO2 films from the 0.1 and 0.2 M solution was calculated, taking into account the constant spray cycle time of 87 s. The deposition rate (Table 1) of TiO2 films deposited from the 0.1 M TTIP solution remains between 19 and 22 nm min−1 and is not influenced by the number of spray cycles. In contrary to that, the films deposited from the 0.2 M TTIP solution show an increase in the deposition rate from 17 to 29 nm min−1 with the number of spray cycles from 2 to 15.
Based on the morphological and structural studies of the TiO2 films, we can conclude that the thickness of films is more precisely controlled by the number of spray cycles in the case of the 0.1 M solution, which leads to the formation of TiO2 films with higher surface roughness and larger mean crystallite size compared to films deposited from the 0.2 M solution.
2.1.3. Optical Properties
The total transmittance spectra of TiO2 films deposited from the 0.1 M (Figure 4a) and 0.2 M (Figure 4b) solutions indicate that the films are transparent in the visible spectral range, showing an average transmittance of 70–80%, irrespective of the solution concentration and the number of spray cycles. However, TiO2 films deposited using two spray cycles most probably do not result in uniform coverage on the borosilicate substrate, possibly due to the formation of pinholes, as, in the low-wavelength side at 300 nm, the total transmittance spectrum does not cross the 0 point of the y-axis. The indirect bandgap of TiO2 films was calculated by using the Tauc plot, and the obtained values for films remained at 3.40 ± 0.05 eV. The optical bandgap value of bulk anatase-TiO2 was 3.20 eV. A higher bandgap value than that of the bulk TiO2 has also been observed in the different studies of TiO2 thin films deposited by chemical spray pyrolysis methods [31,32].
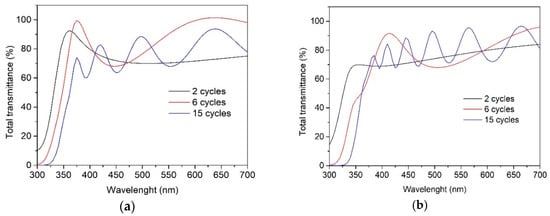
Figure 4.
Total transmittance spectra of the TiO2 films deposited from solution with the concentrations of (a) 0.1 M and (b) 0.2 M onto borosilicate substrate and varying the number of spray cycles from 2 to 15.
The thickness of TiO2 films (Figure 5) as a function of the number of spray cycles was determined from total transmittance spectra interference fringes using an effective refractive index of 2.8 by the Fizeau fringe method. The refractive index was estimated by taking into account the average thickness of the TiO2 film deposited at six spray cycles from SEM cross-sectional images. The film thickness obtained from SEM cross-sectional images is presented for comparison (Figure 5). Some discrepancies in thickness values obtained from SEM cross-sectional images and total transmittance spectra, especially for films from the 0.2 M solution, can originate from the local thickness from SEM and average thickness obtained by UV-VIS.
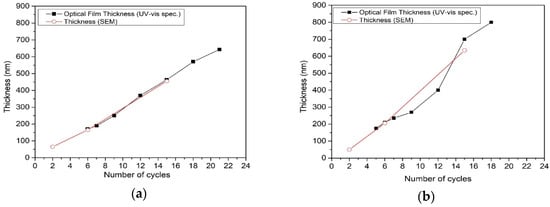
Figure 5.
TiO2 thin film thickness dependence on number of spray cycles and solution concentration (a) 0.1M and (b) 0.2M. Film thickness values obtained from SEM cross-sectional images and UV-Vis spectroscopy using Fizeau method.
In the case of TiO2 films deposited from the 0.1 M solution, the film thickness dependence on the number of spray cycles (Figure 5a) shows almost linear behavior, indicating a similar growth rate within the studied thickness range (Table 1). On the other hand, the thickness of TiO2 films, deposited from the 0.2 M solution, shows exponential behavior on the number of spray cycles and rapid increase in the deposition rate (Table 1), confirming the 3D film growth. In the case of the 0.2 M solution, the rapid film growth rate with the number of spray cycles hinders the formation of films without organic residues, thereby retarding the formation of crystalline material, which is reflected by the lower mean crystallite size of the anatase phase in films deposited from the 0.2 M solution compared to those deposited from the 0.1 M solution (Table 1).
The absorbance spectra of the TiO2 films obtained from 0.1 M solution (Figure 6a) and 0.2 M solution (Figure 6b) show similar tendency. All TiO2 films absorbed light in the UV-A region (a wavelength of 380 nm and below) and showed variation in the degree of absorbance with increasing the number of spray cycles and thereby the film thickness. The absorption edge of TiO2 films is red shifted for thicker films deposited at 6 and 15 cycles, which can be attributed to larger crystallite size of the thicker films, correlating with XRD results (Table 1).
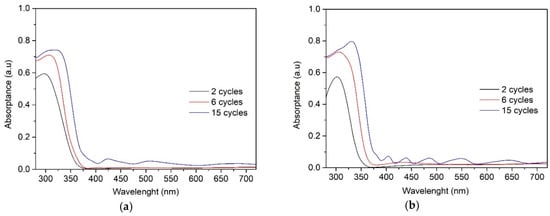
Figure 6.
UV–Vis absorption spectra of the TiO2 films deposited with solutions of (a) 0.1 M and (b) 0.2 M and varying the number of spray cycles from 2 to 15.
2.2. Photocatalytic Activity
The effect of film thickness on the photocatalytic activity was evaluated for TiO2 thin films prepared using 0.1 and 0.2 M solutions. Self-cleaning performance was investigated by spin-coated stearic acid degradation on the surface of TiO2 thin films under UV-A light irradiation. This is a widely applied method for assessing the activity of self-cleaning materials as stearic acid is an adequate model compound for organic fouling [33,34]. Stearic acid absorbs strongly in the region 2700–3000 cm−1, with bands at 2958, 2923, and 2853 cm−1 due to asymmetric in-plane C–H stretching in the CH3 group and asymmetric and symmetric C–H stretching in the CH2 groups, respectively [20]. The degradation of stearic acid was determined by using the integrated area of characteristic bands of stearic acid in the wavenumber range of 2700–3000 cm−1 (Figure 7). The decrease in the specific stearic acid band intensity was monitored using FT-IR spectroscopy as a function of irradiation time. FTIR spectra were measured before the UV-A irradiation and after every 60 min for three hours.
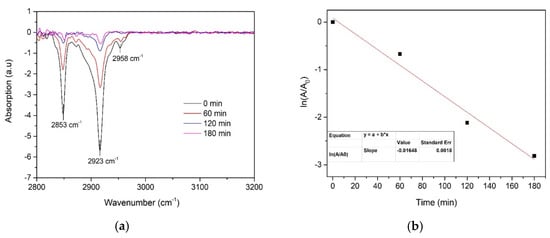
Figure 7.
(a) FTIR spectra of stearic acid on the surface of TiO2 thin-film-deposited 0.1 M solution using 7 spray cycles and (b) the determination of the photodegradation rate constant (k).
Stearic acid degradation under UV-A light is known to follow first-order kinetics, i.e., the integrated band area (A) depends on time as follows:
where k is the photodegradation rate constant. The photodegradation rate constant is the slope value of the linear fit of the plot ln (A/A0) versus time. Photodegradation of stearic acid on the surface of the TiO2 film (thickness ca. 210 nm) and determination of the photodegradation rate constant are presented in Figure 7.
A(t) = A0 e−k
TiO2 thin films were treated with UV-A light for 60 min to make the film surface photo-induced and superhydrophilic prior to coating the surface of the films with stearic acid. After UV-A treatment for 60 min, the water contact angle of all samples drops below 10°, indicating superhydrophilic behavior. It has been observed by several authors that the thin film surface structure and wettability properties of the films affect the growth of the stearic acid layer on the surface of a photocatalytic material [20,35]. It has been reported that the samples having similar structural and wettability properties show the same initial integrated area of stearic acid [35]. Therefore, it can be assumed that the initial integrated area of stearic acid is approximately the same for all samples in the current study.
Photodegradation of stearic acid layer as a function of irradiation time, and the photodegradation rate constants (k) for TiO2 thin films deposited with variable solution concentrations and different cycle numbers are presented in Figure 8 and Figure 9, respectively.
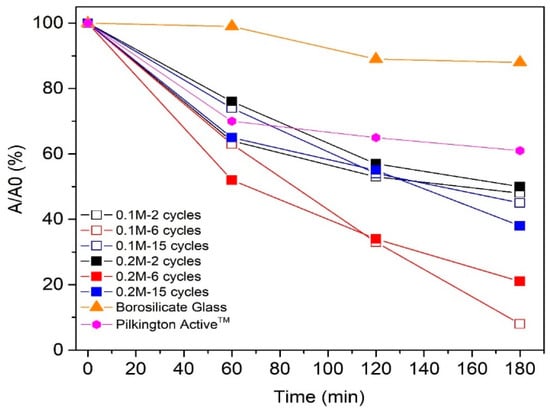
Figure 8.
The degradation of stearic acid as a function of ultraviolet (UV-A) irradiation time on TiO2 films deposited from 0.1 and 0.2 M solution applying 2, 6, and 15 spray cycles.
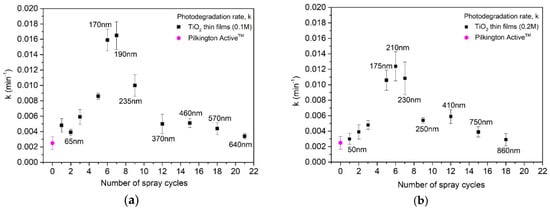
Figure 9.
Photodegradation rate constant (k) values (standard errors shown by error bars) for the TiO2 films deposited from solution with a concentration of (a) 0.1 M and (b) 0.2 M as a function of the number of spray cycles and film thicknesses. Film thicknesses are obtained by UV-Vis spectroscopy (Figure 5).
Photocatalytic degradation of stearic acid layer on TiO2 films deposited by employing 2 (thickness ca. 50–65 nm) and 15 spray cycles (thickness 450 nm (0.1 M) and 635 nm (0.2 M)) was ca. 50% after 180 min exposure to UV-A irradiation (Figure 8). TiO2 films deposited employing 6 cycles with thicknesses of ca. 170 nm (0.1 M) and 210 nm (0.2 M) indicate almost complete degradation (92%) of stearic acid after 180 min of UV-A irradiation. For comparison, the degradation of the stearic acid layer on the commercial Pilktington ActiveTM glass was 1.5 times lower (35%) compared to the sprayed TiO2 films within the same thickness range (50–60 nm) and under the same measurement conditions. According to the SEM cross-sectional image (not shown), the Pilktington Active glass consists of a double-layer structure with a total thickness of ca. 60 nm, comprising a 25 nm-thick TiO2 layer and 35 nm SiO2 barrier layer, similar to the literature [34].
Figure 9 presents the photocatalytic reaction rate constant of the sprayed TiO2 films from 0.1 and 0.2 M solutions compared to the commercial Pilkington ActiveTM as a reference. The photocatalytic reaction rate constant increases with the film thickness from ca. 50 nm (2 cycles) to ca. 200 +/–30 nm (5–7 cycles) and decreases with the further increase in film thickness, viz. the number of spray cycles. TiO2 films deposited from both 0.1 and 0.2 M solutions employing six and seven spray cycles indicate ca. 3.5 times-higher photocatalytic reaction rate constant compared to the films with other thicknesses in both series. Furthermore, TiO2 films deposited from the 0.1 M solution (Figure 9a) indicate a slightly higher photocatalytic reaction rate constant compared to the films with similar thicknesses or cycle numbers deposited from the 0.2 M solution.
The lower activity of the TiO2 films deposited employing one to three spray cycles (Figure 9), with a thickness below 100 nm, compared to the 200 +/− 30 nm TiO2 is related to their lower absorption of UV-A light (Figure 6). When the film is very thin, only a small portion of incident light is absorbed in the catalyst. Thus, the films with low thickness are incapable of high photocatalytic performance [13,17]. The photocatalytic activity increases with the film thickness from 50 to 200 +/− 30 nm, which can be attributable to the increase in the amount of TiO2, and thus higher light absorption (Figure 6), providing more photogenerated carriers for the reaction. However, thicker TiO2 films deposited at a higher number of spray cycles than nine, irrespective of solution concentration, show a decrease in their photocatalytic activity. This phenomenon is characteristic for thin films, observed by other authors as well [17,36], and has been explained by a higher recombination rate of photocarriers [17,34].
TiO2 films deposited employing seven spray cycles from the 0.1 M solution (Figure 9a) show a higher photocatalytic reaction rate constant of 0.01648 min−1 compared to the films with similar thicknesses from the 0.2 M solution of 0.01094 min−1. A similar solution concentration effect on photocatalytic activity has been reported for spin-coated TiO2 films deposited from 0.1 and 0.3 M solutions. However, in their studies, the higher photocatalytic activity of films from the 0.1 M solution was attributed to significantly higher surface roughness compared to 0.3 M, viz. 7.6 and 1.5 nm [17]. In our studies, however, the surface roughness of films deposited from 0.1 and 0.2 M does not differ in such a high level. Therefore, we can conclude that, in this study, the combination of several film properties such as higher mean crystallite size (45 nm vs. 35 nm), finer grain structure with a smaller size of agglomerates (20–40 vs. 70 nm), and higher surface RMS roughness (1.6 nm vs. 1.1 nm) favors the photocatalytic self-cleaning activity of TiO2 films deposited from the 0.1 M solution compared to those from 0.2 M solutions. Furthermore, after the maximum photocatalytic activity (Figure 9), the k value decreases, irrespective of the solution concentration, and not resulting in a plateau as could be expected. We could speculate that the maximum photocatalytic activity of films with a thickness of 200 +/– 30 nm is induced by the reflectance-assisted absorptance, being enhanced by the internal borosilicate glass/TiO2 interface. This phenomenon could promote the additional generation of carriers, which migrates to the film surface and increases the photocatalytic activity of films.
Our study confirms that in the case of the solution-based chemical methods, not only the film thickness but also the solution concentration-derived effect on film properties shall be taken into account when optimizing the deposition protocol for the TiO2 thin films.
As the decomposition rate of stearic acid could depend on many factors, including UV illumination conditions. Thus, it is difficult to directly compare stearic acid decomposition rate values obtained for TiO2 films in the literature. Our results coincide with the ones obtained by Cedillo-Gonzalez et al. [37]. In their study, they have shown that spin-coated TiO2 film with a thickness of 150 nm exhibit stearic acid degradation rate constant of 0.0017 min-1 under UV-A irradiation.
3. Materials and Methods
3.1. Thin-Film Synthesis and Materials Characterization
Thin films were deposited onto 2 × 2 cm2 borosilicate glass substrates at 350 °C by using the ultrasonic spray pyrolysis method. All films were annealed at 500 °C for 1 h in air on a hotplate. The spray solution consisted of titanium (IV) isopropoxide (TTIP) and acetylacetone (AcacH) in a molar ratio of 1:4 in ethanol. The TTIP concentration in spray solution was fixed at 0.1 and 0.2 mol L−1. Compressed air was applied as the carrier gas with a flow rate of 5 L min−1, and the corresponding solutions are named in the text as 0.1 M and 0.2 M solutions. The spraying rate was set up to 2.5 mL min−1. In the current study, the film thickness was controlled by altering the number of spray cycles, adjusted to 1, 2, 3, 6, 9, 12, 15, 18, and 21.
Scanning electron microscopy (SEM) and atomic force microscopy (AFM) were operated to investigate surface morphology. The surface morphology and the film thickness of the films were obtained with the help of Zeiss HR FESEM Ultra 55 scanning electron microscopes with an acceleration voltage of 4.0 kV. The surface morphology of the films was studied using a NT-MDT Solver 47 Pro system, and measurement was carried out in the non-contact mode and the investigated area was 2000 x 2000 nm2 per scan. Surface roughness analysis was carried out through the two-dimensional AFM scan, which was in accordance with the ISO 4287/1 standard. The root mean square (RMS) roughness was calculated over a 2000 × 2000 nm2 scanned surface area with an accuracy of ± 0.5 nm.
The crystalline structure and phases were investigated using an X-ray diffractometer (XRD). XRD patterns were recorded on a Rigaku Ultima IV diffractometer with Cu Ka radiation (λ = 1.5406 A°, 40 kV at 40 mA). The XRD patterns were performed in 2 theta configurations with the 2 theta range of 20–60°, with a scanning speed of 2 min−1 and with a step size of 0.02°. The Scherrer method was used to calculate the mean crystallite size, using the FWHM (full-width at half-maximum) of the (101) reflection of the TiO2 anatase phase.
The total transmittance and reflectance of the TiO2 films on borosilicate glass was measured in the wavelength range of 250–800 nm using a Jasco V-670 UV-VIS-NIR spectrophotometer equipped with a 40 nm integrating sphere. Absorption spectra were calculated by using total transmittance and reflectance spectra of TiO2 films, with the following equation:
A = 1 − T − R
Wettability of the films was determined by water contact angle (WCA) measurement. DSA 25 (KRUSS Instrument) was carried out at room temperature. A sessile drop-fitting method was applied for WCA measurements. An Actinic BL 15 W fluorescent lamp (Philips), with max emission at 365 nm, was used to investigate the dependence of the WCA of aged-TiO2 films on UV-irradiation under ambient conditions.
3.2. Photocatalytic Measurements
The photocatalytic activity was evaluated using stearic acid as a model compound, in which a thin layer of stearic acid is deposited onto 2 × 2 cm2 TiO2 samples and the photocatalytic decomposition of stearic acid is observed as a function of UV-A irradiation time.
Stearic acid coating was performed from a solution of 8.8 mM stearic acid in methanol. In addition, 100 µL of stearic acid solution in methanol was dropped onto the center of the sample and deposited using the sol–gel spin-coating method with a rotation speed of 1000 rpm for 30 s. Samples were then dried at 80 °C in air for 10 min.
Fourier-transform infrared spectroscopy (FTIR) was performed to examine the photocatalytic destruction of stearic acid in a transmission mode as a function of UV irradiation time. FTIR spectra were measured before the UV-A irradiation and every 60 min for three hours. The degradation of stearic acid was determined by using the integrated area of the bands [20].
The following parameters were set-up for FTIR measurement: Wavenumber region 3200–2500 cm−1, number of scans 32, resolution 4 cm−1. The UV Philips Actinic BL 15 W with maximum emission at 365 nm and incident light intensity of 3.5 mW cm−2 was used as an irradiation source. A TiO2 sample without a stearic acid layer on it was used as a reference during the measurements [20].
4. Conclusions
TiO2 thin films were fabricated on a borosilicate glass substrate by using ultrasonic spray pyrolysis. The solution concentrations of 0.1 and 0.2 M and various deposition cycles were used. The deposition temperature was adjusted at 350 °C and the process was followed by annealing at 500 °C for 1 h in air. The results showed that the TiO2 film thickness increases from 50 to 800 nm with the increase in precursor concentration from 0.1 to 0.2 M and the number of spray cycles from 1 to 21. TiO2 films possess smooth surface morphology, showing an RMS roughness in the range of 1.60–2.60 and 0.80–1.60 nm for films deposited from 0.1 and 0.2 M solutions, respectively. XRD analysis showed that the mean crystallite size increases with the number of spray cycles, remaining in the range of 30–50 and 25–40 nm for films deposited from 0.1 and 0.2 M solutions, respectively. All TiO2 films indicate a total transmittance of 70–80% in the visible spectral region.
Photocatalytic activity of the TiO2 thin films was studied by the stearic acid test under UV-A light. The photodegradation rate of stearic acid increases with film thickness from 50 to 200 +/– 30 nm and decreases at higher film thicknesses. A maximum photocatalytic activity of 200 +/– 30 nm thick TiO2 films could be induced by the reflectance-assisted absorptance, supported by the borosilicate glass/TiO2 interface, which could promote additional generation of charge carriers.
The TiO2 thin film from the 0.1 M solution with a thickness of ca. 190 nm showed the highest activity in stearic acid degradation under UV-A with a reaction rate constant k = 0.01648 min−1, and a 6 times higher photocatalytic reaction rate constant than Pilkington ActiveTM self-cleaning glass (k = 0.0025 min−1).
This study revealed that the 150–250 nm-thick TiO2 thin film prepared by ultrasonic spray pyrolysis could be of particular interest for the development of self-cleaning windows providing a low manufacturing cost due to the higher photocatalytic performance obtained from the lower precursor concentration (0.1 M TTIP) without the need of further film thickness.
Author Contributions
I.D. carried out the thin-film deposition and material characterizations (XRD, optical properties, and wettability test), carried out data collection for a photocatalytic activity test by FTIR, took part in the design of all the figures and tables, and participated in the writing of the manuscript and drafted the manuscript. A.M. participated in data analysis and associated preparation of the manuscript. V.M. carried out SEM and AFM measurements. I.O.A. carried out the design of the study and participated in data analysis and associated preparation of the manuscript. M.K. participated in data analysis. All authors have read and agree to the published version of the manuscript.
Funding
I.D. is supported by the Estonian Ministry of Education and Research, Estonian Research Council projects IUT19-4 and PRG627, Estonian Centre of Excellence project TK141, and EU regional Fund project 2014-2020.4.01.16-0032. I.O.A., M.K and A.M. are supported by the Estonian Ministry of Education and Research, Estonian Research Council projects IUT19-4 and PRG627, and Estonian Centre of Excellence project TK141. V.M. is supported by the Estonian Centre of Excellence project TK141. This work has been partially supported by ASTRA ‘TUT Institutional Development Program for 2016–2022′ Graduate School of Functional Materials and Technologies (2014-2020.4.01.16-0032).
Conflicts of Interest
The authors declare no conflict of interest.
References
- Dedova, T.; Oja Acik, I.; Chen, Z.; Katerski, A.; Balmassov, K.; Gromyko, I.; Nagyne-Kovacs, T.; Szilagyi, I.M.; Krunks, M. Enhanced photocatalytic activity of ZnO nanorods by surface treatment with HAuCl4: Synergic effects through an electron scavenging, plasmon resonance and surface hydroxylation. Mater. Chem. Phys. 2020, 245, 122767. [Google Scholar] [CrossRef]
- Dundar, I.; Krichevskaya, M.; Katerski, A.; Oja Acik, I. TiO2 thin films by ultrasonic spray pyrolysis as photocatalytic material for air purification. R. Soc. Open Sci. 2019, 6, 181578. [Google Scholar] [CrossRef] [PubMed]
- Banerjee, S.; Dionysiou, D.D.; Pillai, S.C. Self-cleaning applications of TiO2 by photo-induced hydrophilicity and photocatalysis. Appl. Catal. B 2015, 176–177, 396–428. [Google Scholar] [CrossRef]
- Chen, J.; Poon, C. Photocatalytic construction and building materials: From fundamentals to applications. Build Environ. 2009, 44, 1899–1906. [Google Scholar] [CrossRef]
- Future Markets. Available online: www.futuremarketsinc.com/the-global-market-for-photocatalytic-nanocoatings (accessed on 22 July 2020).
- Daviðsdottira, S.; Shabadi, R.; Galcac, A.C.; Andersend, I.H.; Dirscherle, K.; Ambat, R. Investigation of DC magnetron-sputtered TiO2 coatings: Effect of coating thickness, structure, and morphology on photocatalytic activity. Appl. Surf. Sci. 2014, 313, 677–686. [Google Scholar] [CrossRef]
- Kenanakisa, G.; Vernardoua, D.; Dalamagkasa, A.; Katsarakis, N. Photocatalytic and electrooxidation properties of TiO2 thin films deposited by sol–gel. Catal. Today 2015, 240, 146–152. [Google Scholar] [CrossRef]
- Quici, N.; Vera, L.M.; Choi, H.; Puma, G.L.; Dionysiou, D.D.; Litter, I.M.; Destaillats, H. Effect of key parameters on the photocatalytic oxidation of toluene at low concentrations in air under 254 + 185 nm UV irradiation. Appl. Catal. B Environ. 2010, 95, 312–319. [Google Scholar] [CrossRef]
- Heikkilä, M.; Puukilainen, E.; Ritala, M.; Leskelä, M. Effect of thickness of ALD grown TiO2 films on photoelectrocatalysis. J. Photoch. Photobiol. A Chem. 2009, 204, 200–208. [Google Scholar] [CrossRef]
- Kääriäinen, M.-L.; Kääriäinen, T.O.; Cameron, D.C. Titanium dioxide thin films, their structure and its effect on their photoactivity and photocatalytic properties. Thin Solid Films 2009, 517, 6666–6670. [Google Scholar] [CrossRef]
- Guillén, C.; Herrero, J. TiO2 coatings obtained by reactive sputtering at room temperature: Physical properties as a function of the sputtering pressure and film thickness. Thin Solid Films 2017, 636, 193–199. [Google Scholar] [CrossRef]
- Sheng, J.; Karasawa, J.; Fukami, T. Thickness dependence of photocatalytic activity of anatase film by magnetron sputtering. J. Mater. Sci. 1997, 16, 1709–1711. [Google Scholar]
- Marcello, A.B.; Correa, V.O.; Bento, T.R.; Pillis, F.M. Effect of growth parameters on the photocatalytic performance of TiO2 films prepared by MOCVD. J. Braz. Chem. Soc. 2020, 31, 1270–1283. [Google Scholar] [CrossRef]
- Jung, S.; Kim, S.; Imaishi, N.; Cho, Y. Effect of TiO2 thin film thickness and specific surface area by low-pressure metal–organic chemical vapor deposition on photocatalytic activities. Appl. Catal. B Environ. 2005, 55, 253–257. [Google Scholar] [CrossRef]
- Yu, J.; Zhao, X.; Zhao, Q. Effect of film thickness on the grain size and photocatalytic activity of the sol-gel derived nanometer TiO2 thin films. J. Mater. Sci. 2000, 19, 1015–1017. [Google Scholar]
- Tada, H.; Tanaka, M. Dependence of TiO2 photocatalytic activity upon its film thickness. Langmuir 1997, 13, 360–364. [Google Scholar] [CrossRef]
- Wu, C.; Lee, Y.; Lo, Y.; Lin, C.; Wu, C. Thickness-dependent photocatalytic performance of nanocrystalline TiO2 thin films prepared by sol–gel spin coating. Appl. Surf. Sci. 2013, 280, 737–744. [Google Scholar] [CrossRef]
- Blanco, E.; Gonzalez-Leal, M.J.; Solar, R. Photocatalytic TiO2 sol–gel thin films: Optical and morphological characterization. Sol. Energy 2015, 122, 11–23. [Google Scholar] [CrossRef]
- Xianyu, X.W.; Park, K.M.; Lee, I.W. Thickness effect in the photocatalytic activity of TiO2 thin films derived from sol-gel process. Korean Chem. Eng. 2001, 18, 903–907. [Google Scholar] [CrossRef]
- Spiridonova, J.; Katerski, A.; Danilson, M.; Krichevskaya, M.; Krunks, M.; Oja Acik, I. Effect of the titanium isopropoxide: Acetylacetone molar ratio on the photocatalytic activity of TiO2 thin films. Molecules 2019, 24, 4326. [Google Scholar] [CrossRef]
- Perednis, D.; Gauckler, G.L. Thin film deposition using spray pyrolysis. J. Electroceram. 2005, 14, 103–111. [Google Scholar] [CrossRef]
- Nakaruk, A.; Sorrell, C.C. Conceptual model for spray pyrolysis mechanism: Fabrication and annealing of titania thin films. J. Coat. Technol. Res. 2010, 7, 665–676. [Google Scholar] [CrossRef]
- Oja, I.; Mere, A.; Krunks, M.; Nisuma, R.; Solterbeck, C.-H.; Es-Sounic, M. Structural and electrical characterization of TiO2 films grown by spray pyrolysis. Thin Solid Films 2006, 515, 664–677. [Google Scholar] [CrossRef]
- Dundar, I.; Krichevskaya, M.; Katerski, A.; Krunks, M.; Oja Acik, I. Photocatalytic degradation of different VOCs in the gas-phase over TiO2 thin films prepared by ultrasonic spray pyrolysis. Catalysts 2019, 9, 915. [Google Scholar] [CrossRef]
- Spalatu, N.; Hiie, J.; Kaupmees, R.; Volobujeva, O.; Krustok, J.; Oja Acik, I.; Krunks, M. Postdeposition processing of sns thin films and solar cells: Prospective strategy to obtain large, sintered, and doped SnS grains by recrystallization in the presence of a metal halide flux. ACS Appl. Mater. Interfaces 2019, 11, 17539–17554. [Google Scholar] [CrossRef] [PubMed]
- Spalatu, N.; Krunks, M.; Hiie, J. Structural and optoelectronic properties of CdCl2 activated CdTe thin films modified by multiple thermal annealing. Thin Solid Films 2017, 633, 106–111. [Google Scholar] [CrossRef]
- Vahl, A.; Veziroglu, S.; Henkel, B.; Strunskus, T.; Polonskyi, O.; Aktas, C.O.; Faupel, F. Pathways to tailor photocatalytic performance of TiO2 thin films deposited by reactive magnetron sputtering. Materials 2019, 12, 2840. [Google Scholar] [CrossRef] [PubMed]
- Yazid, A.S.; Rosli, M.Z.; Juoi, M.J. Effect of titanium (IV) isopropoxide molarity on the crystallinity and photocatalytic activity of titanium dioxide thin film deposited via green sol–gel route. J. Mater. Res. Technol. 2019, 8, 1434–1439. [Google Scholar] [CrossRef]
- Oja Acik, I.; Junolainen, A.; Mikli, V.; Danilson, M.; Krunks, M. Growth of ultra-thin TiO2 films by spray pyrolysis on different substrates. Appl. Surf. Sci. 2009, 256, 1391–1394. [Google Scholar] [CrossRef]
- Oja Acik, I.; Mere, A.; Krunks, M.; Solterbeck, C.H.; Es-Souini, M. Properties of TiO2 films prepared by the spray pyrolysis method. Solid State Phenom. 2004, 99, 259–264. [Google Scholar]
- Rauta, N.C.; Mathewsa, T.; Chandramohan, P.; Srinivasan, M.P.; Dasha, S.; Tyagi, A.K. Effect of temperature on the growth of TiO2 thin films synthesized by spray pyrolysis: Structural, compositional and optical properties. Mater. Res. Bull. 2011, 46, 2057–2063. [Google Scholar] [CrossRef]
- Deshmukh, H.P.; Shinde, P.S.; Patil, P.S. Structural, optical and electrical characterization of spray deposited TiO2 thin films. Mater. Sci. Eng. B 2006, 130, 220–227. [Google Scholar] [CrossRef]
- Paz, Y.; Luo, Z. Photooxidative self-cleaning transparent titanium dioxide films on glass. J. Mater. Res. 1995, 10, 2842–2848. [Google Scholar] [CrossRef]
- Mills, A.; Lepre, A.; Elliott, N.; Bhopal, S.; Parkin, P.I.; O’Neill, S.A. Characterisation of the photocatalyst Pilkington Activ TM a reference film photocatalyst? J. Photoch. Photobiol. A. Chem. 2003, 160, 213–224. [Google Scholar] [CrossRef]
- Smirnova, N.; Fesenko, T.; Zhukovsky, M.; Goworek, J.; Eremenko, A. Photodegradation of Stearic Acid Adsorbed on Superhydrophilic TiO2 Surface: In Situ FTIR and LDI Study. Nanoscale Res. Lett. 2015, 10, 7. [Google Scholar] [CrossRef]
- Kumar, J.K.; Raju, R.C.N.; Subrahmanyam, A. Thickness dependent physical and photocatalytic properties of ITO thin films prepared by reactive DC magnetron sputtering. Appl. Surf. Sci. 2011, 257, 3075–3080. [Google Scholar] [CrossRef]
- Cedillo-Gonzalez, I.E.; Hernandez-Lopez, M.J.; Ruiz-Valdez, J.J.; Barbieri, V.; Siligardi, C. Self-cleaning TiO2 coatings for building materials: The influence of morphology and humidity in the stain removal performance. Constr. Build. Mater. 2020, 237, 117692. [Google Scholar] [CrossRef]


© 2020 by the authors. Licensee MDPI, Basel, Switzerland. This article is an open access article distributed under the terms and conditions of the Creative Commons Attribution (CC BY) license (http://creativecommons.org/licenses/by/4.0/).