Article

Promotional Effect of Cu, Fe and Pt on the Performance of Ni/Al2O3 in the Deoxygenation of Used Cooking Oil to Fuel-Like Hydrocarbons

1
Campus Centro Oeste Dona Lindu, Universidade Federal de São João del Rei, Rua São Sebastião 400 Divinópolis, MG 35501-029, Brazil
2
Center for Applied Energy Research, University of Kentucky, 2540 Research Park Drive, Lexington, KY 40511, USA
3
Department of Chemistry, University of Kentucky, Lexington, KY 40506, USA
4
Laboratoire Interdisciplinaire Carnot de Bourgogne (LICB), UMR CNRS 6303, Université de Bourgogne Franche-Comté, 9 avenue Alain Savary, 21078 Dijon CEDEX, France
*
Author to whom correspondence should be addressed.
Catalysts 2020, 10(1), 91; https://doi.org/10.3390/catal10010091
Submission received: 20 December 2019 / Revised: 3 January 2020 / Accepted: 3 January 2020 / Published: 7 January 2020

Abstract

:
Inexpensive Ni-based catalysts can afford comparable performance to costly precious metal formulations in the conversion of fat, oil, or greases (FOG) to fuel-like hydrocarbons via decarboxylation/decarbonylation (deCOx). While the addition of certain metals has been observed to promote Ni-based deCOx catalysts, the steady-state performance of bimetallic formulations must be ascertained using industrially relevant feeds and reaction conditions in order to make meaningful comparisons. In the present work, used cooking oil (UCO) was upgraded to renewable diesel via deCOx over Ni/Al2O3 promoted with Cu, Fe, or Pt in a fixed-bed reactor at 375 °C using a weight hourly space velocity (WHSV) of 1 h−1. Although all catalysts fully deoxygenated the feed to hydrocarbons throughout the entire 76 h duration of these experiments, the cracking activity (and the evolution thereof) was distinct for each formulation. Indeed, that of the Ni-Cu catalyst was low and relatively stable, that of the Ni-Fe formulation was initially high but progressively dropped to become negligible, and that of the Ni-Pt catalyst started as moderate, varied considerably, and finished high. Analysis of the spent catalysts suggests that the evolution of the cracking activity can be mainly ascribed to changes in the composition of the metal particles.

1. Introduction

Interest in renewable energy sources has increased considerably, mainly due to concerns related to the climate change caused by the atmospheric accumulation of greenhouse gases resulting from fossil fuel use [1]. A promising alternative to the fossil fuels used in the transportation sector is the production of biofuels—e.g., biodiesel, green diesel, and biokerosene—from renewable feedstocks, including vegetable oils and animal fats [2,3]. Moreover, to improve the economics of these biofuels and avoid disrupting the food supply, attention has shifted to low-cost inedible feedstocks, including used cooking oil (UCO), which is also known as yellow grease (YG) [4,5,6]. This particular waste stream is both abundant and inexpensive (~$463/ton), with ca. one million tons being produced annually in the U.S. alone [7].
Of the biofuels mentioned above, biodiesel is the name given to the fatty acid methyl esters (FAMEs) resulting from the catalytic transesterification of fat, oil, or greases (FOG) with methanol. Biodiesel has several advantages over petroleum-based diesel, such as being biodegradable and producing less harmful gas emissions and particulate matter upon combustion [8,9]; however, it also displays several drawbacks, including poor cold flow properties as well as relatively low thermal and oxidative stability, mostly arising from its oxygen content [10]. The catalytic deoxygenation of FOG to fuel-like hydrocarbons offers advantages over biodiesel in terms of fuel quality and feedstock flexibility. Indeed, deoxygenation processes are able to handle FOG feeds with significantly higher free fatty acid concentrations relative to those typically required for biodiesel synthesis [11].
As shown in Scheme 1, FOG deoxygenation can proceed via hydrodeoxygenation (HDO) and decarboxylation/decarbonylation (deCOx). In HDO, oxygen is removed as H2O, and the alkanes produced have the same number of carbon atoms as the corresponding fatty acid chains comprising the FOG. In decarboxylation, oxygen is removed in the form of CO2, and in decarbonylation, oxygen is removed as H2O and CO. In both cases, the resulting alkanes have one carbon atom less than the corresponding fatty acid bound in the triglyceride. Depending on the catalyst and the experimental conditions employed, the CO and CO2 produced in the gas phase may react with hydrogen to form CH4. In fact, because of the number of confounding reactions, which include not only methanation but also the water gas shift (WGS) and the Boudouard reaction, these routes cannot be easily distinguished from each other based solely on the amounts of H2O, CO2, and CO produced [12,13].
In recent years, the production of fuel-like hydrocarbons via deCOx has been intensively investigated as a way to avoid the large amounts and pressures of hydrogen, as well as the problematic sulfide catalysts required by HDO, since the hydrogen requirements of deCOx are lower and these reactions proceed over simple supported metal catalysts [14]. Although the majority of deCOx studies have focused on Pd and Pt catalysts, the high price of these metals has spurred the search for alternatives. Saliently, inexpensive Ni-based catalysts can provide comparable results to Pd and Pt formulations in the deCOx of FOG to hydrocarbons [15,16].
Since the high activity of Ni in C–C hydrogenolysis can decrease the carbon yield and the hydrogen efficiency of deCOx processes, the incorporation of a second metal has been investigated as a means to modify the electronic and geometric properties of Ni to ultimately improve its activity and selectivity [17]. Indeed, Ni/Al2O3 promoted with Cu or Pt can afford near quantitative diesel yields in the conversion of both model and realistic lipid feeds to fuel-like hydrocarbons [13,18]. The promotion effect displayed by these bimetallic catalysts is in large part attributed to the ability of Cu and Pt to facilitate NiO reduction at relatively low temperatures since metallic Ni sites constitute the active site for the deCOx reaction. Moreover, Pt addition also curbs the adsorption of CO on the catalyst surface, helping to avoid catalyst inhibition by any CO evolved via decarbonylation and the catalyst coking resulting from the disproportionation of CO via the Boudouard reaction [13].
Supported Ni catalysts promoted with Fe have also afforded promising results in the conversion of model and realistic lipid feeds to hydrocarbons [17], the promoting effect of Fe being attributed to the synergy between nickel sites possessing the ability to activate hydrogen and iron sites with strong oxophilicity [17,19]. Indeed, since Fe has a higher oxygen affinity than Ni, oxygen vacancies within iron oxide species can facilitate the adsorption and subsequent activation of oxygenates. Specifically, H2 activated through its facile dissociative adsorption on Ni sites can spill over to neighboring Fe sites onto which the oxygen atoms of C=O groups are adsorbed, subsequent hydrogenation leading to deoxygenation products. In addition, the formation of Ni-Fe alloys with Fe-rich surfaces disrupts the adjacency of Ni atoms, a geometric effect known to suppress C–C hydrogenolysis, which requires Ni ensembles. Cu is also known to decrease the C–C hydrogenolysis activity of Ni through the same geometric effect [20].
In order to develop practicable catalytic deCOx technology for the conversion of FOG to fuel-like hydrocarbons, it is necessary to study the most promising catalysts using industrially relevant feeds and reaction conditions. In addition, in order to make meaningful comparisons between the performance of different catalysts, measurements must be made at a steady state. Against this backdrop, the present work investigated the conversion of UCO to renewable diesel via deCOx over supported Ni catalysts promoted with Cu, Fe or Pt. The performance of these formulations was tested in a fixed bed reactor using industrially-relevant reaction conditions for 76 h of time on stream (TOS), as previous work has shown that catalysts of this type require >48 h of TOS to attain a steady state [11]. In addition, the analysis of the fresh, spent, and regenerated catalysts was undertaken in an effort to understand the distinct performance displayed by these formulations.

2. Results and Discussion

2.1. Catalytic Deoxygenation of UCO Over Ni/Al2O3 Promoted with Cu, Fe, and Pt

The composition of the UCO employed in this work is shown in Table A1 within Appendix A. The feed is mostly triolein (~95%) with a small amount (~5%) of oleic acid. This feed was upgraded in a fixed bed reactor using a WHSV of 1 h−1 and a reaction temperature of 375 °C (see Section 3.3) in order to investigate and compare the relative effect of Cu, Fe and Pt promotion on the performance of Ni/Al2O3 in the conversion of UCO to diesel-like hydrocarbons. The results of the gas chromatography-mass spectrometry (GC-MS) analysis of the liquid products collected at representative times on stream are summarized in Figure 1, and are presented in more detail in Appendix A (Table A2, Table A3 and Table A4), while the gaseous products are shown in Figure 2. In addition, a blank (sans catalyst) run was performed using an identical set of conditions in order to assess the extent of thermal (as opposed to catalytic) contributions to UCO conversion and diesel yield. The GC-MS analysis of the liquid products obtained in this blank run (see Table A5 in Appendix A) revealed the vast majority (>79%) of the products to be fatty acids and monolein stemming from the thermal conversion of triolein. In addition, the amount of hydrocarbons obtained was <21%, and olefins represented the vast majority of hydrocarbon products irrespective of TOS, which is unsurprising in the absence of a hydrogenation catalyst. Thus, it can be concluded that under the experimental conditions employed, thermal contributions to the conversion of UCO to diesel-like hydrocarbons are relatively minor.
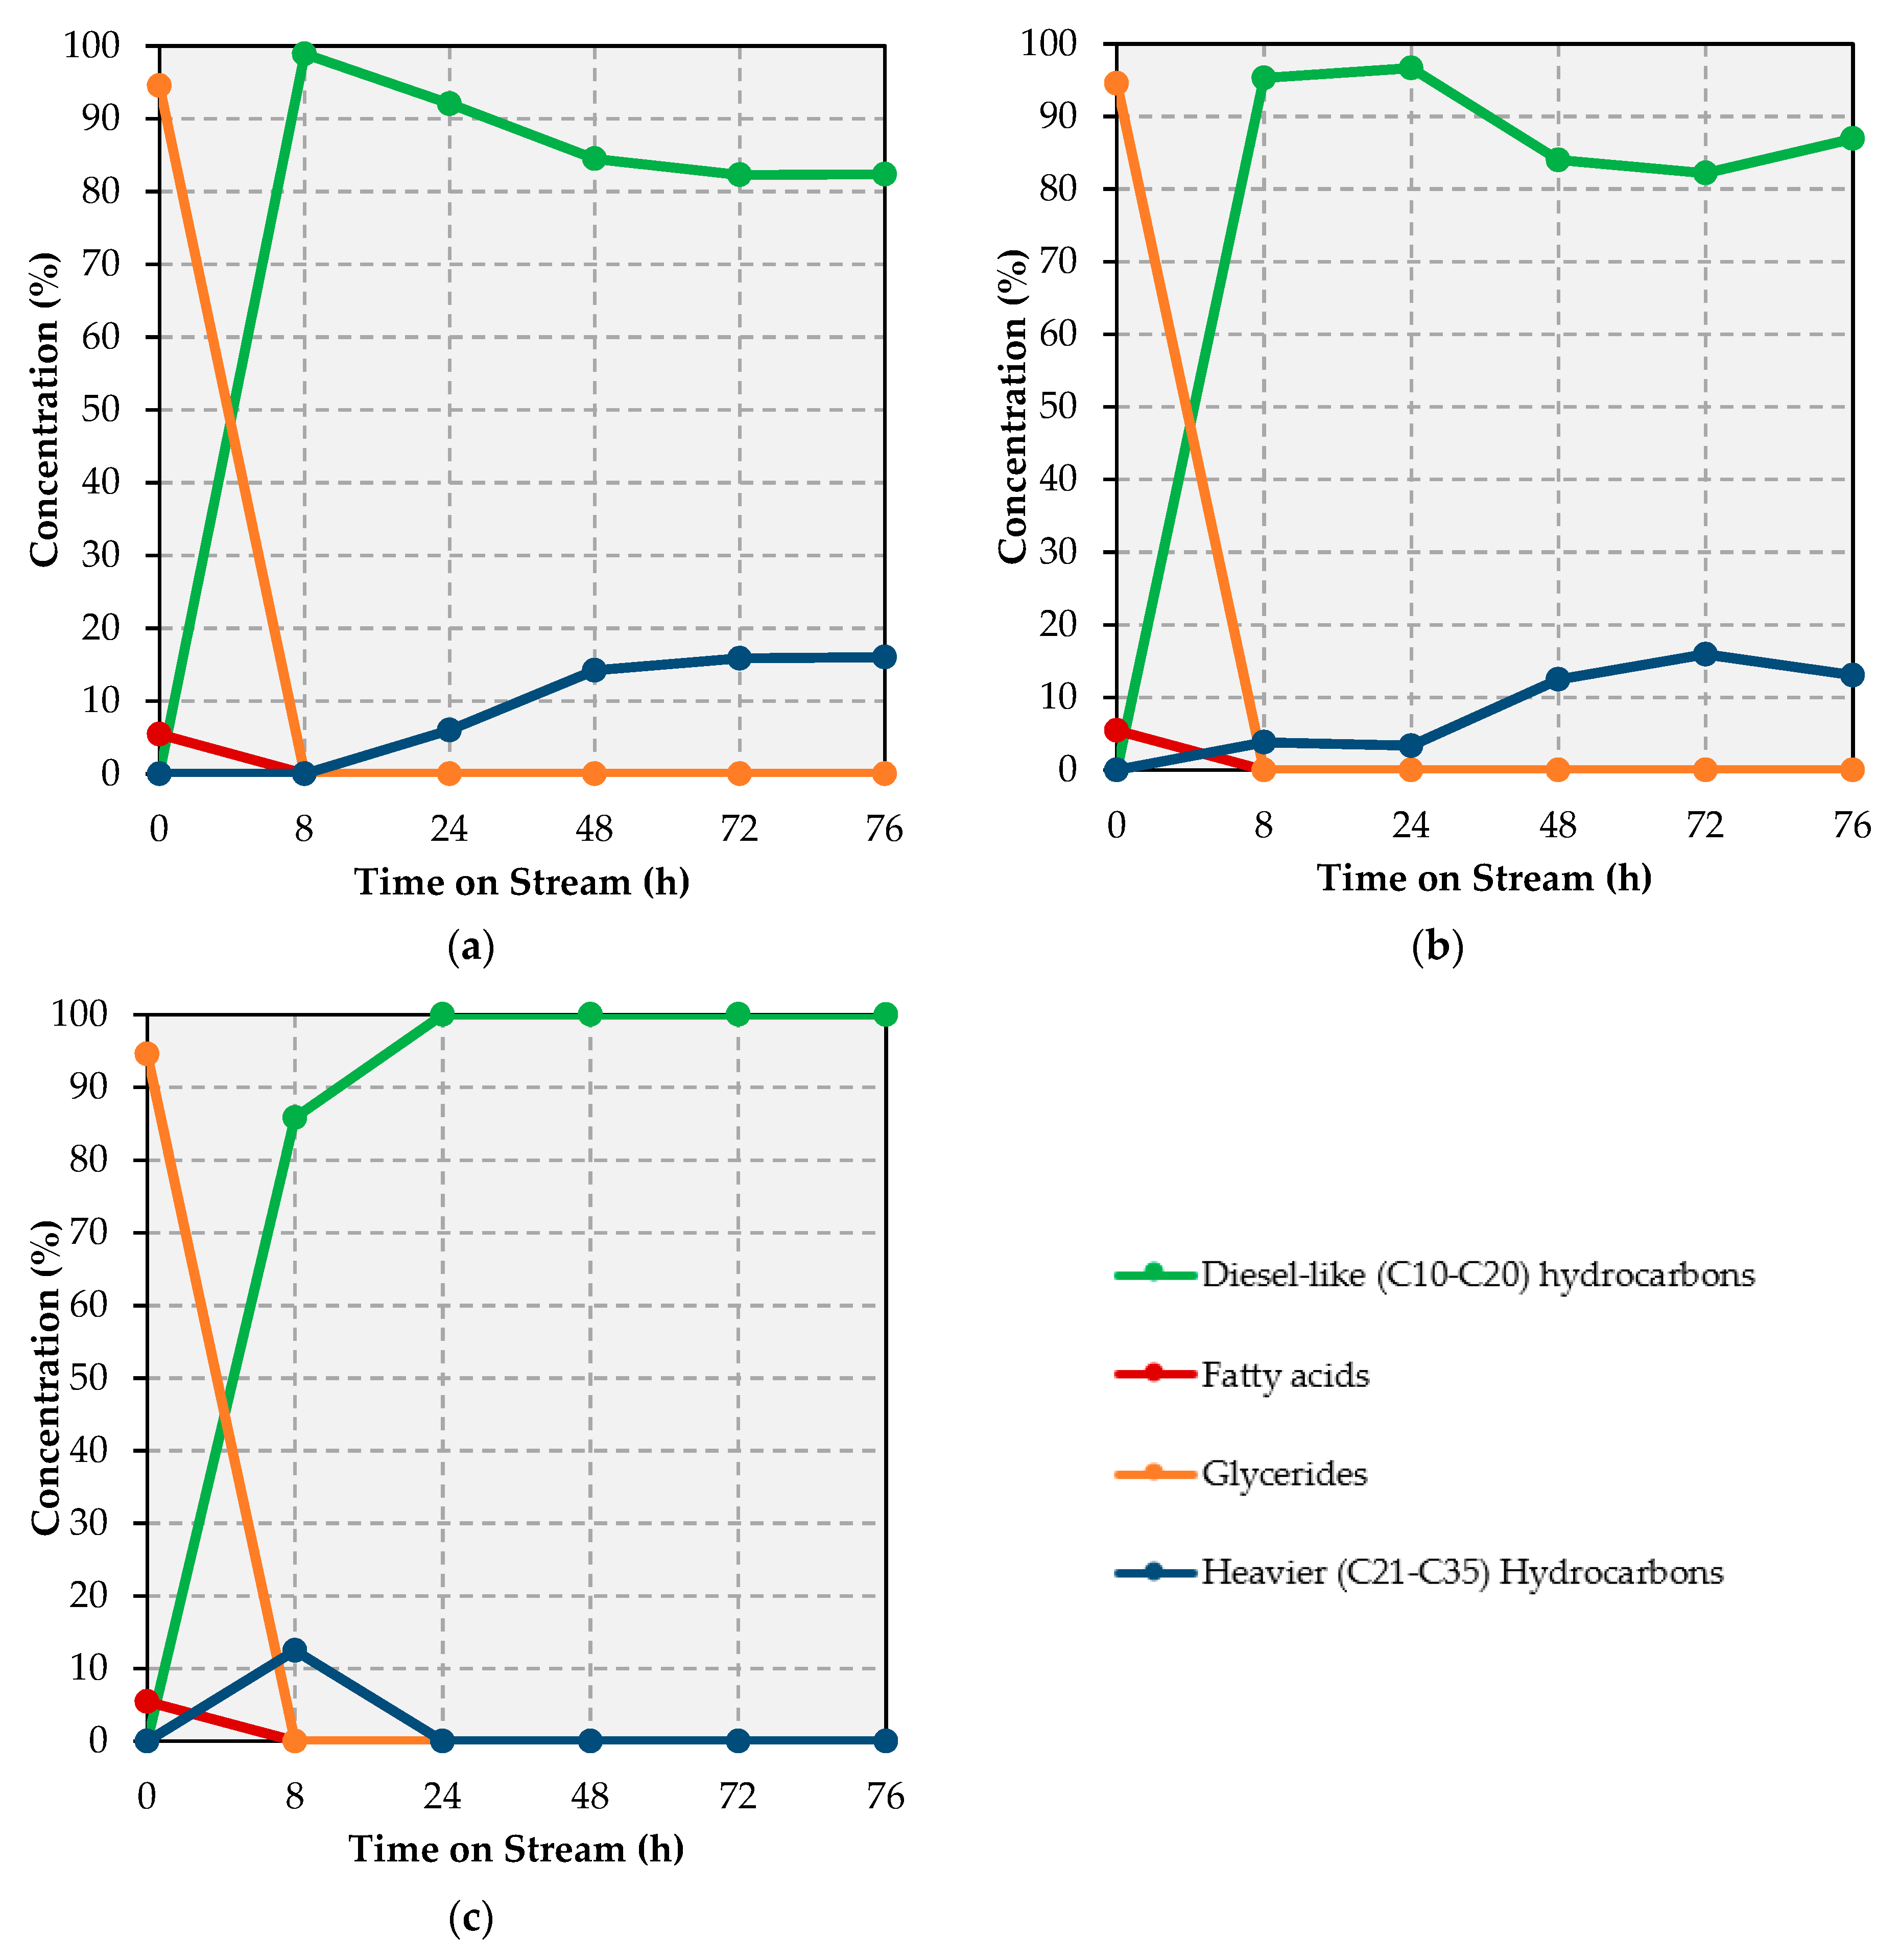
Remarkably, complete deoxygenation occurs over all catalysts tested (see Figure 1 and Table A2, Table A3 and Table A4), the concentration of diesel-like (C10–C20) hydrocarbons in the reaction products being >82% irrespective of both catalyst and TOS, heavier (C21–C35) hydrocarbons comprising the remainder of the product mixtures. Whereas heavier hydrocarbons stem from the deoxygenation of long-chain ester intermediates [21], diesel-like hydrocarbons are the result of the deoxygenation of the triglycerides and the fatty acids constituting the UCO feed (as well as of the cracking of heavier hydrocarbons) [11,18].
It is also worth noting that the Ni-Pt catalyst afforded liquid product mixtures comprised solely of diesel-like hydrocarbons after 24 h on stream. In contrast, the Ni-Cu and Ni-Fe catalysts showed lower diesel amounts along with a higher yield of heavier (C21–C35) hydrocarbons (particularly at ≥48 h on stream) in their liquid products, which suggests that Ni-Pt disfavors the production of long-chain ester intermediates and/or favors cracking reactions. A closer look at the individual components of the liquid products in the diesel range, namely, C10, C11, C14, C15, and C16 (C12 and C13 could not be determined due to the interference of the reaction solvent) provides valuable insights vis-à-vis the changes in selectivity that take place as the reaction progresses over each catalyst (see Table A2, Table A3 and Table A4). While the vast majority of the feed comprised triolein and oleic acid, the most abundant product obtained over all the catalysts is heptadecane (C17), suggesting that the reaction proceeds mainly via deCOx as opposed to HDO, which would afford octadecane (C18). Nevertheless, C18 is also produced in significant amounts, which indicates that HDO also occurs. Whereas the amount of C17 and C18 produced over the Ni-Cu and Ni-Fe catalysts remains relatively stable throughout, the corresponding values drop considerably beyond 28 h on stream over the Ni-Pt formulation. Tellingly, the amount of lighter (C10–C14) diesel-like hydrocarbons—which is the result of (and, thus, a proxy for) cracking activity—remains low and fairly stable, drops significantly, and increases considerably with TOS over the Ni-Cu, Ni-Fe and Ni-Pt catalysts, respectively.
Differences in the evolution of the incondensable gas products observed over each catalyst (see Figure 2) provide insights that are both consistent and complementary to those drawn from the composition of the liquid product mixtures. Briefly, whereas H2 represents the reaction atmosphere, CO and CO2 are produced from glycerides and fatty acids via decarbonylation and decarboxylation, respectively. Butane, propane, and ethane are produced through the internal chain cracking of glycerides, fatty acids, and long-chain hydrocarbons, while propane can also stem from the triglyceride backbone and its cracking can afford additional ethane and methane. Lastly, methane is also produced from the methanation of COx as well as from the cracking of glycerides, fatty acids, and long-chain hydrocarbons via terminal carbon loss, the main chain shortening mechanism according to a previous report [22]. With this in mind, the first thing worth noting is the small amount of COx detected. Indeed, the amount of COx is practically negligible in the gaseous products evolved over both the Fe- and Pt-promoted catalysts (see Figure 2b,c), indicating that the entirety of these gases is converted to methane and/or remain adsorbed on the surface of these formulations. In contrast, a small amount of CO2 is detected in the gaseous products evolved over the Cu-promoted catalyst (see Figure 2a), particularly after a brief induction period observed in the first hours of the experiment. Parenthetically, this induction period has been observed in previous work and attributed to the accumulation of CO2 on the catalyst surface as alumina-bound carbonates [22]. While CO2 eventually breaks through and is detected in the gaseous products, CO remains undetected, likely indicating its full conversion to methane, to CO2, and coke via the Boudouard reaction, or its strong and irreversible adsorption on the surface of the Ni-Cu catalyst (see Section 2.3).
The amount of ethane, propane, and butane in the gaseous products is also telling. Over both the Cu- and Fe-promoted catalysts, the amount of these gases detected at the beginning of the reaction is practically negligible, gradually increasing over the first 24 h on stream (see Figure 2a,b). Beyond this point, the amount of these gases evolved over the Cu-promoted catalyst remains relatively stable for the remainder of the experiment, whereas it becomes negligible once again towards the end of the run over the Fe-promoted formulation. In contrast, the amount of C2–C4 gaseous products evolved over the Pt-promoted catalyst is both higher and constant throughout the entirety of the run (see Figure 2c). Nevertheless, the amount of ethane, propane, and butane is always smaller than that of methane irrespective of both catalyst and TOS; the amount of methane detected being particularly informative. Whereas the quantity of methane evolved over the Ni-Cu catalyst is both small (< 0.6%) and stable (see Figure 2a), the latter only applies to the end of the experiment involving the Ni-Fe formulation (see Figure 2b). At the beginning of the run performed over the Fe-promoted catalysts, the amount of methane in the gaseous products varies from 71% at t = 0 h to 64% at t = 3 h (results not shown), before dropping precipitously to 4% at t = 4 h and then more gradually to reach stability around 0.4% at t = 54 h. In stark contrast, the amount of methane in the gaseous products evolved over the Ni-Pt catalyst varies widely and can be as high as ~75% at t = 24, 48, and 72 h (see Figure 2c).
All of these trends indicate that while the Ni-Cu and Ni-Fe catalysts retain their deoxygenation activity within the time period investigated, cracking activity either remains constant or declines with TOS, consistent with results reported in other studies [11,17,23]. Although the Ni-Pt catalyst also retains its deoxygenation activity throughout the entire experiment, cracking reactions remain prevalent during the entirety of the run. In short, a comparison of the results obtained with 20% Ni–5% Cu/Al2O3, 20% Ni–5% Fe/Al2O3, and 20% Ni-0.5% Pt/Al2O3 catalysts suggests that Cu- and Fe-promoted catalysts are preferable to Ni-Pt formulations. Indeed, the latter is rendered disadvantageous by its higher price and cracking activity, which would reduce the cost and carbon efficiency of a process designed to convert UCO to diesel-like hydrocarbons.

2.2. Characterization of Fresh and Spent Catalysts

The textural properties of the catalysts used in this study are compiled in Table 1. The surface area, pore volume, and pore size of all catalysts fall in very narrow ranges, which is consistent with their total metal loadings and particle sizes (vide infra) and the fact that all catalysts were prepared using the same alumina support. These results indicate that the effects of differences in these properties on catalyst performance should be minimal.
Figure 3 includes the X-ray diffractograms of the catalysts employed in this study. Since diffractograms were acquired using the fresh catalysts in their oxidized form—catalysts were subjected to XRD after the calcination in air constituting the final step of their preparation (see Section 3.1)—the fact that all Ni detected is present as NiO is unsurprising. Indeed, the three diffractograms display several peaks (at 37.2°, 43.3°, 62.9°, 75.4°, and 79.4°) assigned to NiO [24]. The fact that diffraction peaks attributed to Fe3O4 and to Ni-Fe alloy phases [17,19,25,26] are absent from the diffractogram corresponding to 20% Ni–5% Fe/Al2O3 (Figure 3a) is unsurprising since these phases would only be expected in reduced (as opposed to oxidized) catalysts. Peaks associated with Fe2O3 are also absent from this diffractogram, indicating that Fe is highly dispersed. As previously reported [18], the fact that peaks at 35.5° and 38.7° corresponding to a CuO phase [27] are not observed in the diffractogram of 20% Ni–5% Cu/Al2O3 (Figure 3b) can be similarly attributed to the high dispersion of the Cu phase [24,28]. Likewise, no distinct Pt-related features (peaks or peak shifts) can be observed in the diffractogram corresponding to 20% Ni-0.5% Pt/Al2O3 (Figure 3c).
The temperature-programmed reduction (TPR) profiles shown in Figure 4 clearly illustrate that the three catalysts employed in this study display very different reduction behavior. As discussed in a previous report [18], the TPR profile for 20% Ni–5% Cu/Al2O3 shows four distinct reduction events: (1) a sharp peak at 180 °C attributed to the reduction of copper oxide [24,29]; (2) a broader but well-defined peak with a maximum at 360 °C assigned to the reduction of a NiO-CuO phase [30]; (3) a shoulder with a local maximum at 460 °C signaling the reduction of NiO [31]; and (4) a weak and broad signal around 690 °C indicating the reduction of nickel aluminate (NiAl2O4) [32]. The TPR profile for 20% Ni–5% Fe/Al2O3 also shows four (but less distinct) reduction events, namely: (1) a small signal with a maximum at 235 °C corresponding to large (10–50 nm) NiO ensembles (vide infra); (2,3) a very large and broad peak ranging from 260 to 675 °C with a maximum at 350 °C, commingling the reduction of nickel and iron oxides (leading to the formation of a Ni-Fe alloy) [17,19]; and (4) a high-temperature tail of the latter peak, assigned to NiAl2O4 reduction. Lastly, as discussed in a recent report [13] the TPR profile for 20% Ni-0.5% Pt/Al2O3 also displays several reduction events, including (1) a small and broad peak between 300 and 350 °C attributed both to the reduction of surface Pt and of large NiO particles in close proximity to Pt [13,33]; (2) an intense and well-defined signal with a maximum at 460 °C assigned to the Pt-assisted reduction of smaller NiO particles [13]; and (3) a broad peak above 500 °C with a high temperature (>700 °C) shoulder attributed to the reduction of NiO and NiAl2O4, respectively.
Given that Ni-based formulations used in the deoxygenation of FOG to fuel-like hydrocarbons are known to be particularly susceptible to coking [1], the spent catalysts were subjected to thermogravimetric analysis (TGA) in air, the resulting profiles being shown in Figure 5.
The TGA profiles indicate that the total mass loss displayed by the spent catalysts follows the trend Ni-Fe (3.0%) < Ni-Cu (7.6%) < Ni-Pt (10.8%). In addition, the temperature at which mass loss takes place is also noteworthy, since mass loss events <400 °C can be attributed to strongly adsorbed reactants, intermediates and products (or soft coke) and mass loss events >400 °C can be assigned to more recalcitrant carbonaceous deposits (graphitic or hard coke). Tellingly, albeit the majority of the weight loss displayed by all spent catalyst takes place below 400 °C, the Ni-Pt formulation also shows distinct and significant weight loss above this temperature. The increased coking observed on the Ni-Pt catalyst is consistent with its considerably higher cracking activity, which is evinced by the copious amounts of methane produced by this formulation (see Section 2.1). In turn, the fact that both the Ni-Cu and the Ni-Fe catalysts display lower amounts of carbonaceous deposits is in agreement with the known ability of both Cu and Fe to curb the hydrogenolysis activity of Ni via geometric effects (see Section 1).
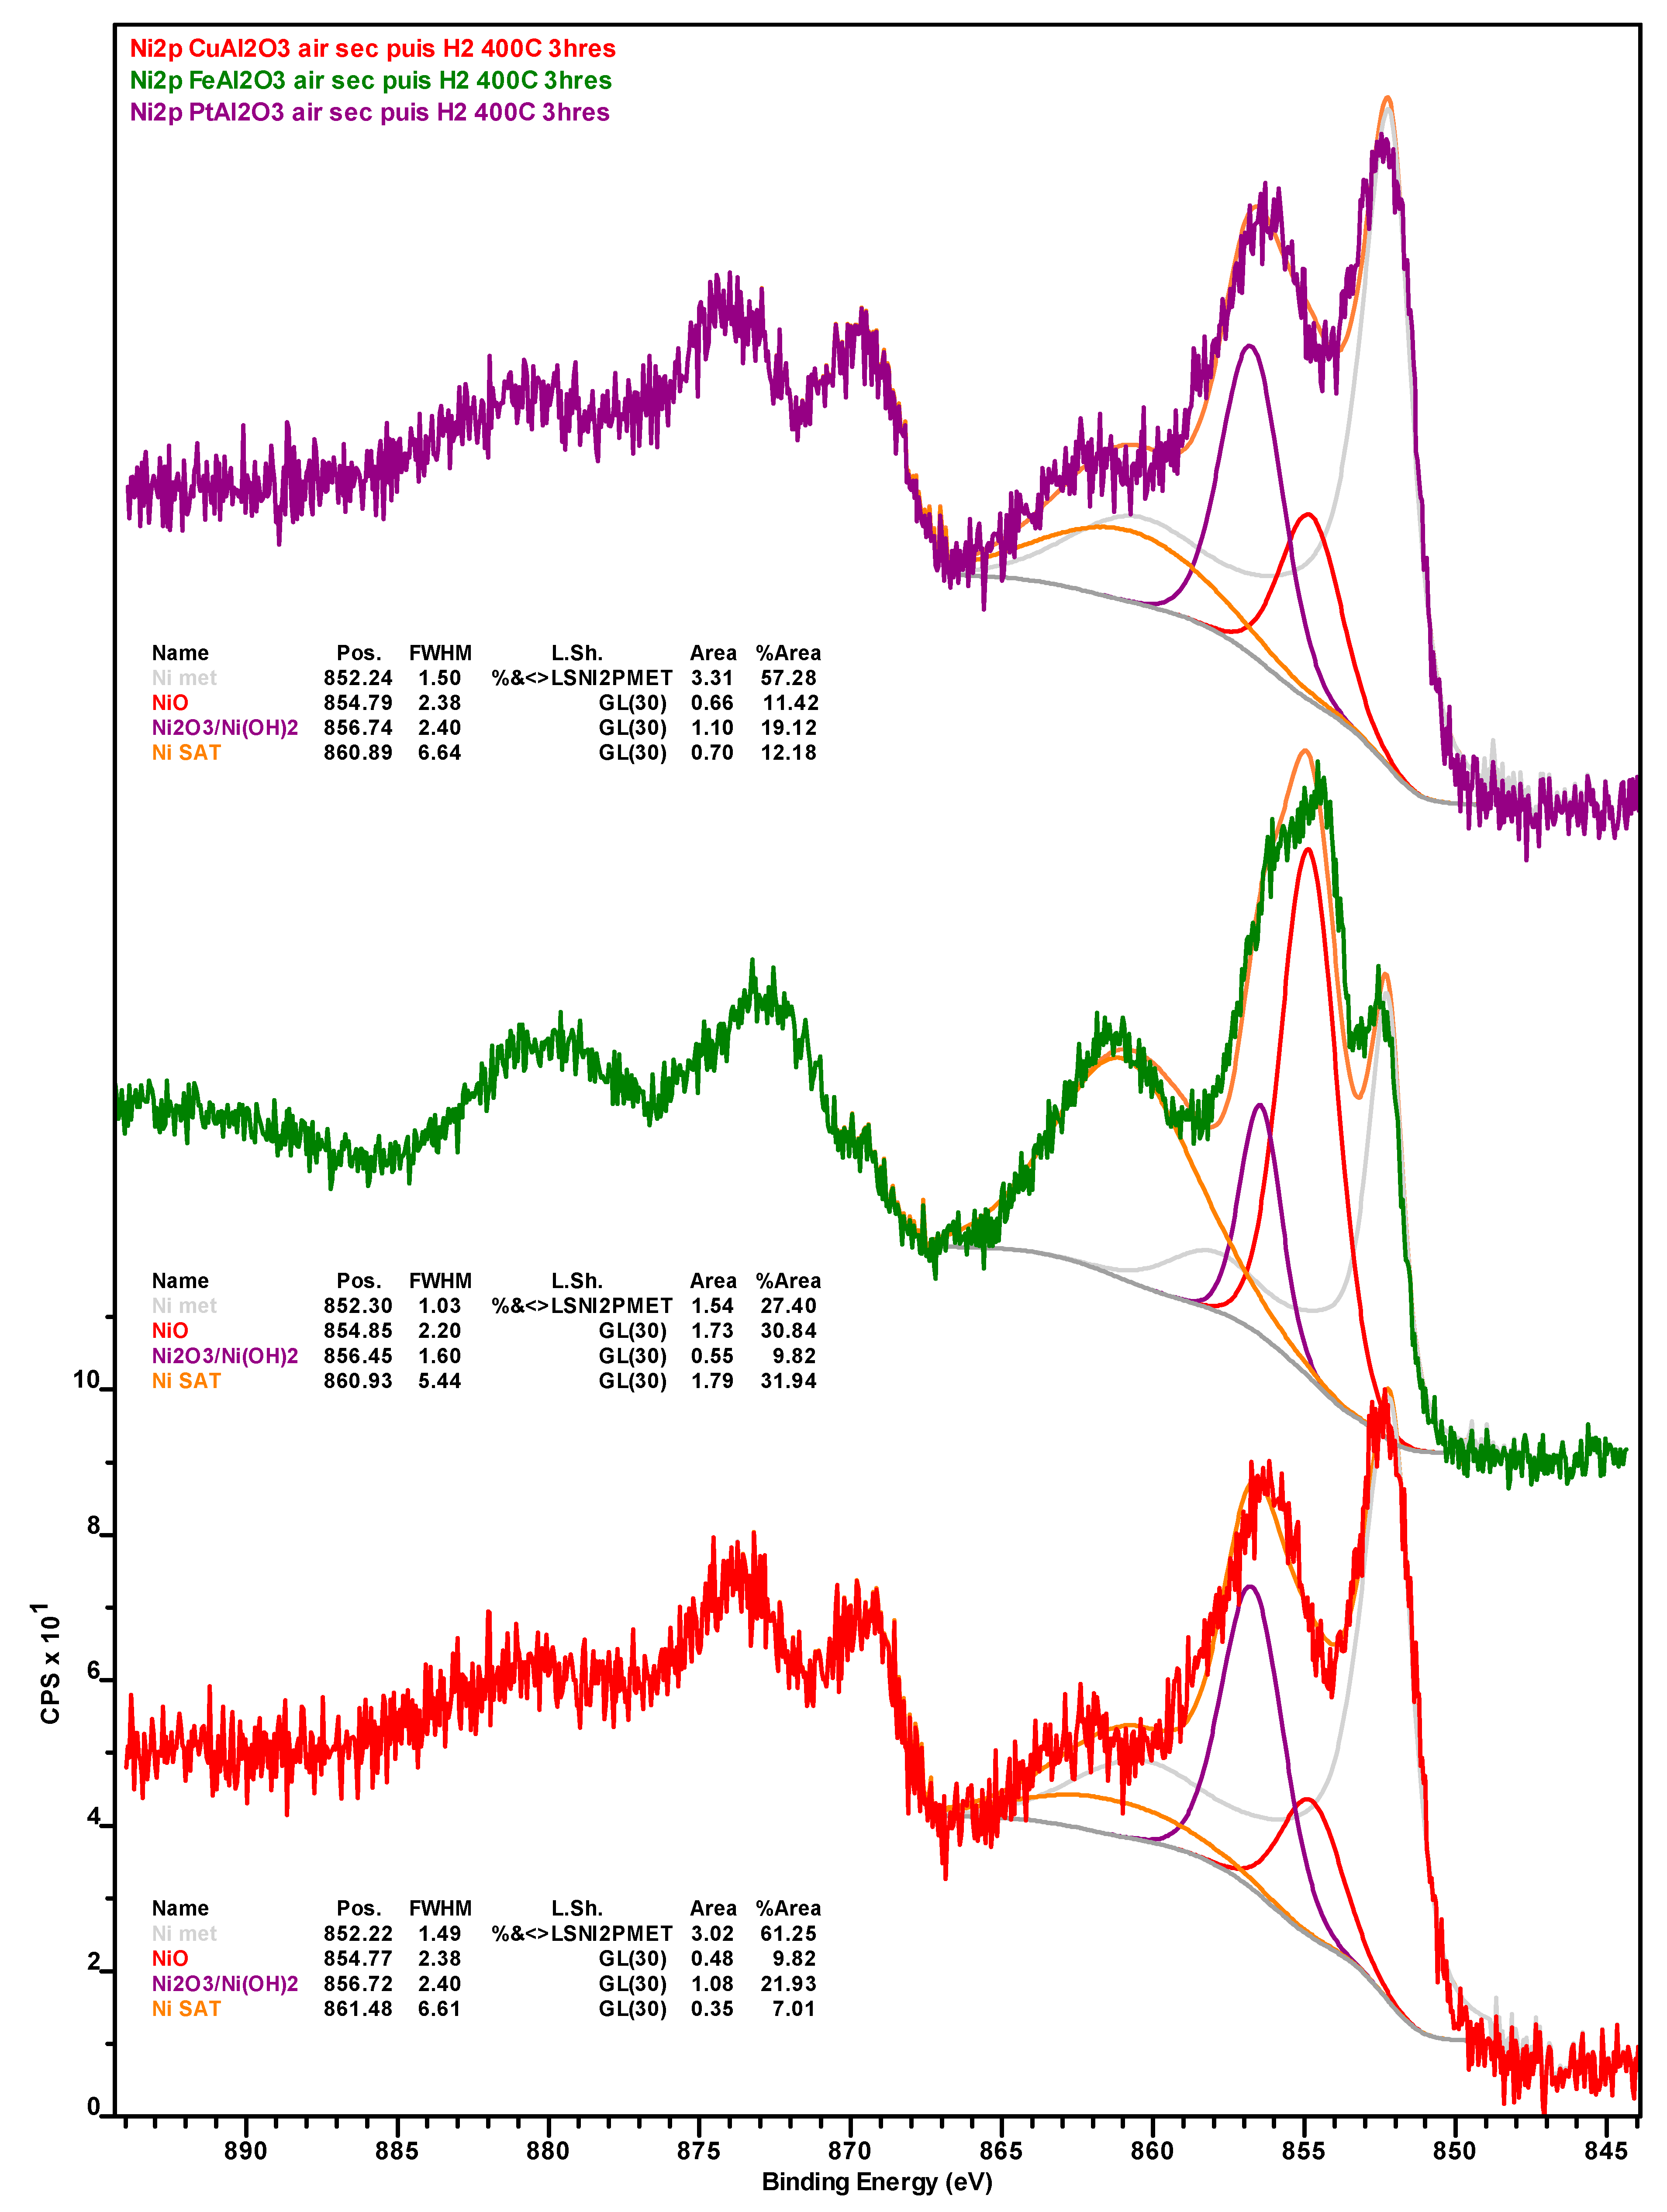
Table 2 shows the surface concentration (in at.%) of the elements detected via x-ray photoelectron spectroscopy (XPS) in the catalysts after (i) 76 h of TOS, followed by washing with dodecane and drying (spent); (ii) their subsequent calcination for 5 h at 450 °C under air (calcined); and (iii) their successive reduction for 3 h at 400 °C under H2 (re-reduced). All XPS spectra can be found in Appendix B (Figure A1, Figure A2, Figure A3, Figure A4, Figure A5, Figure A6, Figure A7 and Figure A8). Carbon in the samples can be divided into inorganic (carbide) and organic (coke) carbon, the inorganic carbon being mostly associated with the SiC used as a diluent in the upgrading experiments (see Section 3.3) and being indicative of the relative amount of sample components—catalyst or diluent—analyzed during XPS measurements. The amount of inorganic carbon can considerably impact the interpretation of the data in Table 2. This is also the case for the amount of organic carbon (calculated by subtracting the inorganic from the total carbon) associated with coke deposits and whose Ni-Pt > Ni-Cu > Ni-Fe trend in the spent catalysts is in agreement with the results of TGA (vide supra). The fact that both spent Ni-Fe and Ni-Pt catalysts display a very similar surface concentration of Si and inorganic carbon indicates that a similar fraction of SiC diluent and catalyst is being analyzed, which in turn confirms that organic carbon (coke) deposits are much more abundant on the Pt- than on the Fe-promoted formulation. Similarly, while both the Si and inorganic carbon concentration of the spent Ni-Cu sample is lower, suggesting that a lower amount of C is contributed by SiC, the fact that the concentration of CTot (and, thus, of COrg) in this formulation is higher than on Ni-Fe indicates that coke deposits on the surface of Ni-Cu are intermediate to those on Ni-Pt and Ni-Fe, which is also consistent with TGA data.
Notably, the amount of Ni in general and Ni0 in particular, is considerably higher on the surface of the spent Ni-Fe catalyst than on the other two formulations, although the observed trend (Ni-Fe >> Ni-Cu > Ni-Pt) likely stems—at least in part—from the relative amount of coke deposits on the surface of these catalysts. Considering the promoter metals, it is worth noting that a much higher amount of Fe in the Ni-Fe catalyst (relative to Cu in the Ni-Cu formulation) is detected at the surface. While this cannot be attributed to the amount of SiC artificially depressing the amount of Cu detected (since the Si and inorganic carbon concentration is higher in the Ni-Fe catalyst) or to the slightly lower atomic weight (Ar) of Fe—the Ar difference is too small—the higher amount of coke deposits on the surface of the Ni-Cu catalyst could partially explain the relatively low Cu concentration, as with the case of Ni. Lastly, while the entirety of Cu is present as Cu+, which is indicative of Cu2O as copper does not form a carbide phase, a small amount (ca. 13%) of Fe is in the metallic state, the remainder being present in oxidic form (see Figure A7 and Figure A8 in Appendix B).
Upon calcination, the amount of CTot is significantly reduced mainly due to the combustion of coke deposits. Consistent with the more graphitic—and thus recalcitrant—nature of the coke on this formulation as indicated by TGA results (see Figure 5), the amount of residual coke after calcination is highest for the Ni-Pt catalyst. Although the amount of Ni in the calcined catalysts is lowest for 20% Ni–5% Cu/Al2O3, the amount of Ni0 follows the trend Ni-Cu > Ni-Pt > Ni-Fe, which is indicative of the resistance of surface Ni in each catalyst to oxidation. Regarding the metallic promoters within the calcined catalyst, which increase in concentration due to the removal of coke, Cu is present as a mixture of Cu2O and CuO, the vast majority of Fe also being present in the oxidized form (only ~3% being present as Fe0).
Changes observed upon the reduction of the calcined catalysts are also informative. The similar amounts of Si, Ni, and Ni0 on the re-reduced Ni-Cu and Ni-Pt formulations and the changes in these values relative to those displayed by their calcined counterparts indicate that (i) the region of the samples analyzed are catalyst-rich and SiC-poor; and (ii) sintering takes place during reduction based on the loss of surface Ni relative to the calcined catalysts. Changes in the Ni/Al ratio—from 0.18 to 0.12 and from 0.65 to 0.27 for calcined to re-reduced Ni-Cu and Ni-Pt, respectively—also suggests that sintering takes place during reduction. Moreover, the amount of CTot and CInorg on the Ni-Pt catalyst is striking and suggests the formation of a considerable amount of metallic carbide(s). Unfortunately, the presence of the latter could not be conclusively confirmed since Pt could not be observed (due to the small amount of Pt and the overlapping of the Pt4f and the Al2p XPS regions) and a distinct nickel carbide signal is not resolved. It is also noteworthy that the surface concentration of Ni (and to a lesser degree that of Ni0) on the re-reduced Ni-Fe catalyst is significantly higher than that of its Ni-Cu and Ni-Pt counterparts, particularly taking into account the considerably larger amount of SiC being analyzed alongside Ni-Fe. Finally, it is interesting to note that the surface concentration of Cu is lower on the re-reduced Ni-Cu catalyst than on its spent and calcined counterparts—particularly taking into account the lower amount of SiC analyzed alongside the re-reduced material and the higher amount of coke on the spent formulation—which may indicate the alloying of Cu with Ni. Regarding the oxidation state of the promoter metals after reduction, while the entirety of Cu is present in the metallic form, only ~9% of iron is present as Fe0, the remainder being present as Fe2+ or Fe3+. Since it has been reported that Fe2O3 undergoes reduction to Fe3O4 in the ~300–400 °C range, while Fe3O4 is reduced between ~400 and 500 °C [34], it is unsurprising that after reduction at 400 °C most of the Fe detected by means of XPS is oxidic.
In short, XPS results indicate that the trend related to the amount of organic (coke) deposits on the surface of spent catalysts (Ni-Pt >> Ni-Cu > Ni-Fe) explains the relative amounts of Ni and Ni0—as well as of promoter metals—on the surface of spent formulations (Ni-Fe >> Ni-Cu > Ni-Pt). Moreover, the trends related to the amount of Ni0 on the surface of calcined and re-reduced catalysts (Ni-Cu > Ni-Pt > Ni-Fe and Ni-Fe > Ni-Cu ≈ Ni-Pt, respectively) indicate that Ni displays distinct redox behavior within each formulation. Indeed, Ni on the surface of 20% Ni–5% Fe/Al2O3 is easier to oxidize and reduce than Ni on the surface of 20% Ni–5% Cu/Al2O3 or 20% Ni–0.5% Pt/Al2O3. Finally, XPS results evince that while the Ni-Cu and Ni-Pt catalysts experience metal particle sintering during re-reduction, Ni-Cu and Ni-Fe alloys form within the Cu- and Fe-promoted catalysts and metallic carbides may form within the Pt-promoted formulation.
The analysis of the fresh and spent catalysts via transmission electron microscopy-energy dispersive X-ray spectroscopy (TEM-EDS) also afforded significant insights. In the case of the Cu-promoted catalyst, TEM results indicate that the particle size distribution—which is narrow and centered around 4 nm particles in the fresh catalyst—is both broader and centered around larger particles in the spent formulation (see Figure 6a), signaling particle sintering. The TEM-EDS results in Figure 6b reveal that the metal particles in the fresh catalyst display a composition that is close to that of the bulk formulation (80% Ni-20% Cu considering only the metallic phase), albeit Ni-rich particles containing 85–95% Ni are also observed. Notably, the spent catalyst comprises particles slightly more enriched in Cu relative to those in the fresh formulation, all particles in the spent catalyst containing between 65 and 80% Ni. This indicates that particles not only grow in size but also become Cu-rich during the reaction, which is also in line with previously reported results [11]. This conclusion is clearly illustrated by the TEM micrographs and the TEM-EDS elemental maps included in Figure A9; the elemental maps also showing that Ni and Cu are present in close association on both the fresh and spent catalysts. The Cu map of the spent Ni-Cu catalyst shown in Figure A9 also provides an example of the Cu-hollow space not observed in the fresh formulation, as Ni-Cu particles likely undergo Cu-hollowing through a mechanism based on the Kirkendall effect [35]. These observations are consistent with the widely reported bulk and surface enrichment of Ni-Cu nanoparticles with Cu [11,36,37].
In the case of the Fe-promoted catalyst, TEM results indicate that a similar particle size change takes place during reaction. Indeed, the particle size distribution—which is narrow in the fresh catalyst as the vast majority of particles range from 3 to 7 nm—is both broader and shifted to larger (8–30 nm) particles in the spent formulation (see Figure 7a). However, the composition of the metal particles does not change much during the reaction in contrast with the Cu-promoted catalyst; the only change observed being the disappearance of Ni-rich (90–100% Ni) particles according to the TEM-EDS results in Figure 7b. These observations are illustrated by the TEM micrographs and the TEM-EDS elemental maps in Figure A10, which show the degree of association between Ni and Fe in both the fresh and the spent catalyst. The Fe maps included in Figure A10 also evince Fe-hollow spaces on both the fresh and spent formulation, albeit the latter displays more of these spaces. Analogous to the case of the Ni-Cu catalyst, Fe-hollowing may occur through a mechanism based on the Kirkendall effect, which has also been reported for Ni-Fe bimetallic formulations [38,39].
In the case of the Pt-promoted catalyst, TEM results indicate a similar particle size change as those experienced during the reaction by the other formulations. Specifically, whereas the fresh catalyst shows a fairly narrow particle size distribution with the vast majority of particles falling within the 5–10 nm range, the spent formulations show a much broader distribution with particles as small as 3 nm and as large as 28 nm (see Figure 8a). Nevertheless, changes in the composition of metal particles within the Pt-promoted catalyst are noteworthy (see Figure 8b). Indeed, the fresh catalyst shows a significant amount of Pt-rich particles—relative to the bulk formulation (97.6 wt.% Ni-2.4 wt.% Pt or 99.3 at. % Ni-0.7 at.% Pt)—whereas the vast majority of metal particles in the spent catalyst show a composition very close to that of the bulk. The TEM micrographs and the TEM-EDS elemental maps in Figure A11 support these conclusions, showing both the increase in metal particle size and the closer association of Ni and Pt in the spent catalysts than in the fresh state.

2.3. Structural and Activity Changes Observed during Catalysts Aging and Regeneration

As mentioned in the preceding section, the similarity between the textural properties (surface area, pore volume, and pore diameter) of all fresh catalysts suggests that the effect of these properties on catalyst performance should be minimal, at least at the onset. However, any variations in these and other properties with TOS may influence catalyst performance. Indeed, based on TGA results, the loss of surface area and porosity attributable to coking and fouling should follow the trend Ni-Fe < Ni-Cu < Ni-Pt, the latter catalyst showing a higher amount of more recalcitrant (graphitic) carbonaceous deposits. Notably, complete deoxygenation of the feed was maintained throughout the experiment for each of the catalysts, which suggests that losses in surface area and porosity due to coking, fouling, and sintering are not sufficient to noticeably impact the deoxygenation activity of these formulations in the time period investigated. Thus, differences in the cracking activity of the catalysts offer better insights vis-à-vis structure-activity relationships.
Looking at both the composition of the liquid and gaseous products, the cracking activity of the Cu-promoted catalyst—although always relatively low—is highest between 8 and 30 h on stream and progressively drops between 30 and 72 h on stream, at which point it becomes stable. Somewhat similarly, the cracking activity of the Fe-promoted formulation is considerably higher in the first 8 h of the experiment, becomes moderate between 24 and 52 h on stream, and is both negligible and stable beyond t = 72 h. Contrastingly, the cracking activity of the Pt-promoted formulation is higher at the end of the run than at its onset. Therefore, at least in the case of the Ni-Pt catalyst, it appears that neither the loss of surface area due to coking, fouling, and sintering, nor changes in the bulk or surface composition of the metal particles, reduce the cracking activity of this formulation in the time period investigated. The opposite is the case for the Cu- and Fe-promoted catalysts, which display a lower cracking activity towards the end of the experiment, this effect being more pronounced for the Ni-Fe formulation.
TPR measurements performed on the spent catalysts after calcination (see Figure A12) provide valuable insights on the structural changes that occur during regeneration. The first thing worth noting is that all peaks (except for those assigned to NiAl2O4) are shifted to lower temperatures, which can be partially attributed to the formation of larger particles that are easier to reduce. However, the more substantial shifts (>100 °C) can only be fully explained by invoking a considerable increase in the association of Ni with the promoter metal. For the Cu-promoted catalyst, changes in the relative intensity of peaks attributed to the reduction of copper oxide, NiO-CuO, and NiO (with respect to that in the fresh formulation) point to a reduction in the amount of unalloyed Cu and the formation of Ni-Cu bimetallic particles with a Cu-rich surface. Indeed, the peaks with maxima at 245 and 375 °C likely correspond to the reduction of NiO-CuO at the surface and of NiO at the core of these particles, respectively. For the Fe-promoted formulation, the narrowness of the main peak relative to that in the fresh formulation indicates a closer association between the metals forming a Ni-Fe alloy, which is consistent with the disappearance of Ni-rich particles observed via TEM-EDS (see Figure 7b). In addition, the intensity of this peak relative to that of peaks shown by other catalysts is in line with the higher amount of surface Ni in the Fe-promoted formulation measured via XPS (vide infra). Lastly, for the Pt-promoted catalyst, the sizable shift (>200 °C) that the main peak displays between the fresh and the regenerated formulation, is indicative of a major increase in the association between Ni and Pt.
The results of the XPS measurements performed on calcined and re-reduced spent catalysts confirm these conclusions and offer additional insights. While most (if not all) of the coke is removed from Cu- and Fe-promoted spent catalysts, the regenerated Ni-Pt formulation displays both a significant amount of residual coke, as well as a possible metallic carbide phase. In addition, metal particle sintering takes place during the regeneration of spent Ni-Cu and Ni-Pt catalysts, likely explaining the lower amount of surface Ni and Ni0 these formulations display relative to their Fe-promoted counterpart.
Finally, the regenerated (i.e., calcined in air at 450 °C for 5 h and re-reduced under H2 at 400 °C for 3 h) spent catalysts were subjected to in-situ diffuse reflectance infrared Fourier transform spectroscopy after CO adsorption (CO-DRIFTS) to gain additional information on their structure post-regeneration (see Figure 9). Since the adsorption of CO on metals is highly temperature-dependent, adsorption was carried out at 25 °C in order to focus on the most active sites for CO adsorption and limit the confounding effects that the presence of multiple metals can have on M-CO spectra [40]. Irrespective of its state (fresh or spent and regenerated), the Cu-promoted catalyst displays a very intense band at 2119–2100 cm−1, which is attributed to CO adsorbed on Cu sites [41,42]. However, this band increases in intensity and shifts to higher wavenumbers on the regenerated catalyst, which signals an increase in the total quantity of Cu sites, as well as a change in their electronic properties. While the increase in intensity is in line with the enrichment of the surface with Cu, the shift in wavenumber may result from a greater extent of Ni-Cu alloying and from the rise of Cu-hollow spaces [43]. Tellingly, while the fresh Ni-Fe catalyst shows a Ni-CO band at 2179 cm−1, this band is absent from the corresponding spectrum post-regeneration. This suggests that the most coordinatively unsaturated Ni sites—which are the most active cracking sites [44]—are irreversibly deactivated during reaction/regeneration. Similarly, while the fresh Ni-Pt catalyst shows a well-defined peak at ~2180 cm−1 and a broad feature at ~2120 cm−1 associated with CO on metallic Ni sites, as well as a large and well-defined peak at ~2077 cm−1 assigned to CO on Pt sites [13], none of these signals are observed post-regeneration. Since XPS results demonstrate the presence of Ni0 on the regenerated Ni-Pt formulation, the dearth of signals can be explained by residual coke blocking the sites responsible for low-temperature CO adsorption.
These observations are reinforced by a recent report in which the performance of a regenerated Ni-Cu catalyst in fatty acid deoxygenation was found to be distinct from—and superior to—that of the fresh formulation [11]. Thus, the need for additional work in which the regenerated catalysts are tested to study their performance (and the evolution thereof) in a second cycle post-regeneration is clearly indicated, particularly since these tests stand to shed light on the recyclability of these formulations and unveil additional structure-activity relationships.

3. Materials and Methods

3.1. Catalyst Preparation

20% Ni–5% Cu/Al2O3, 20% Ni–5% Fe/Al2O3 and 20% Ni-0.5% Pt/Al2O3 catalysts were prepared by excess wetness impregnation using Ni(NO3)2·6H2O (Alfa Aesar, Haverhill, MA, USA), Cu(NO3)2·3H2O (Sigma-Aldrich, St. Louis, MO, USA), Fe(NO3)3·9H2O (Alfa Aesar, Haverhill, MA, USA) and/or Pt(NH3)4(NO3)2 (Sigma Aldrich, St. Louis, MO, USA) as the metal precursors and γ-Al2O3 (Sasol, Johannesburg, South Africa; surface area of 216 m2/g) as the support. Following impregnation, the materials were dried overnight at 60 °C under vacuum and then calcined at 500 °C for 3 h in static air. The catalysts and SiC diluent (Kramer Industries, Piscataway Township, NJ, USA) were sieved separately to the desired particle size (150–300 µm), and stored in a vacuum oven at 60 °C prior to their use.

3.2. Catalyst Characterization

A detailed description of the instrumentation and procedures employed for catalyst characterization—by means of N2 physisorption, XRD, TGA, TEM-EDS, TPR, and DRIFTS—can be found in previous contributions [13,15,45]. Briefly, XRD measurements were performed on a Phillips X’Pert diffractometer using Cu Kα radiation (λ = 1.5406 Å) and a step size of 0.02°. TGA was performed on a TA instrument Q500 thermogravimetric analyzer under flowing air (50 mL min−1) by ramping the temperature from room temperature to 1000 °C at a rate of 10 °C/min. TEM observations were conducted using a Thermo Scientific Talos F200X analytical electron microscope equipped with a SuperX EDS system consisting of 4 windowless silicon drift detectors (SDD) for quantitative chemical composition analysis and elemental distribution mapping. XPS analyses were performed using a PHI 5000 Versaprobe apparatus with monochromatic Al Kα1 X-Ray source (energy of 1486.6 eV, accelerating voltage of 15 kV, power of 50 W and spot size diameter of 200 µm). Pass energies of 187.5 eV and 58.7 eV were used for survey spectra and high-resolution windows, respectively. The signal for Al2O3 (Al2p at 74.4 eV) was employed for energy calibration purposes (measurements being performed with a neutralization system). Spectra were processed with the CasaXPS software package, ionization cross-sections from Landau being used to quantify the semi-empirical relative sensitivity factors. Prior to analysis, powders were deposited on a steatite sample holder made in house. This sample holder enables the transfer of samples between a pre-treatment chamber and the XPS analysis chamber without exposure to air. The pre-treatment chamber—which was also designed and manufactured in house and is equipped with a furnace that can heat samples up to 1050 °C—can be filled with pre-treatment gases (up to 1 bar) and be placed under vacuum, which is done prior to transferring pretreated samples to the XPS analysis chamber.

3.3. Continuous Fixed-Bed Deoxygenation Experiments

Used cooking oil upgrading experiments were performed in continuous mode using previously described equipment and procedures [11]. Briefly, a fixed-bed stainless-steel tubular reactor (1/2 in. o.d., Parr, Moline, IL, USA) with a stainless-steel porous frit to hold the bed—0.5 g of catalyst and 0.5 g of SiC as a diluent (or 1 g of SiC in the blank run)—in place was employed. Prior to each deoxygenation experiment, the catalyst to be tested was reduced in situ for 3 h at 400 °C under 40 bar of flowing H2 (60 mL/min). The same pressure and H2 flow were used during deoxygenation experiments, which were performed at 375 °C. The feed was introduced to the reactor—as a solution of 75 wt.% UCO in dodecane (>99% Alfa Aesar, Haverhill, MA, USA)—at a rate of 0.75 mL/h (equivalent to a WHSV of 1 h−1) using a Harvard Apparatus (Holliston, MA, USA) syringe pump equipped with an 8 mL syringe. Liquid products were sampled from a liquid-gas separator (kept at 0 °C) placed downstream from the catalyst bed. Incondensable gases were directed to a dry test meter before being collected in Tedlar® gas sample bags. Gas sample bags were changed every time a liquid sample was taken to ensure that the gas samples analyzed and the liquid samples collected could be correlated. A blank (sans catalyst) experiment was conducted using 1 g of SiC. Representative experiments were performed in duplicate to ensure reproducibility. The highest average standard deviation values observed in the amount of diesel-like and heavier hydrocarbons formed were ±6.15% and ±5.66%, respectively.

3.4. Analysis of Reaction Products

Liquid products were analyzed using a combined simulated-distillation-GC and GC-MS approach. A detailed description of the development and application of this method is available elsewhere [46]. Briefly, the analyses were performed using an Agilent 7890B GC system equipped with an Agilent 5977A extractor MS detector and flame ionization detector (FID). The multimode inlet was run with an initial temperature of 100 °C. Upon injection, this temperature was immediately increased at a rate of 8 °C/min to 380 °C, which was maintained for the remainder of the analysis. The oven temperature was increased upon injection from 40 °C to 325 °C at a rate of 4 °C/min, followed by a ramp of 10 °C/min to 400 °C, which was maintained for 12.5 min. An Agilent J&W VF-5ht column (30 m × 250 µm × 0.1 µm) rated to 450 °C was used. Gaseous samples were analyzed using an Agilent (Santa Clara, CA, USA) 3000 Micro-GC equipped with 5 Å molecular sieve, PoraPLOT U, alumina, and OV-1 columns, as well as with a universal thermal conductivity detector (TCD). The GC was calibrated for all of the gaseous products obtained, including CO and CO2, as well as straight-chain C1–C6 alkanes and alkenes.

4. Conclusions

In this contribution, an industrially relevant experimental approach was used to upgrade UCO to diesel-like hydrocarbons in order to compare the performance of Ni catalysts promoted with Cu, Fe or Pt. Results indicate that all catalysts tested display and retain the ability to fully deoxygenate the feed to hydrocarbons through the entirety of the time period investigated. However, the cracking activity of Ni-Cu is relatively low and stable throughout, that of Ni-Fe drops with TOS, and that of Ni-Pt is higher, variable, and is still high at the end of a 76 h run. Analysis of the fresh and spent catalysts helps explain these trends and their underlying structure-activity relationships. In the case of the Ni-Pt catalyst, neither coking, fouling, and metal particle sintering—nor changes in the bulk or surface composition of the metal particles—reduce the cracking activity of this formulation in the time period investigated. In contrast, the cracking activity of both the Ni-Cu and the Ni-Fe catalysts decrease with TOS, this decrease being more pronounced for the Fe-promoted formulation. Based on TEM-EDS data, this reduction in cracking activity can be attributed to an increased degree of alloying between Ni and Cu or Fe, the formation of Ni-Cu and Ni-Fe alloys disrupting the adjacency of Ni atoms required for C–C hydrogenolysis. In short, results suggest that Cu- and Fe-promoted catalysts are preferable to Ni-Pt formulations, which are rendered disadvantageous by the fact that their higher price and cracking activity would reduce the cost and carbon efficiency of a process designed to convert UCO to diesel-like hydrocarbons.

Author Contributions

Individual contributions are as follows: conceptualization—E.S.-J. and M.C.; methodology—G.C.R.S., E.S.-J., and M.C.; validation—G.C.R.S.; formal analysis—G.C.R.S., and O.H.; investigation—G.C.R.S., O.H., D.Q., and R.P.; resources—E.S.-J., M.C., and O.H.; data curation—O.H.; writing—original draft preparation—E.S.-J., and G.C.R.S.; writing—review and editing—E.S.-J., and M.C..; visualization—G.C.R.S., and E.S.-J.; supervision—M.C.; project administration—G.C.R.S., E.S.-J., and M.C.; funding acquisition—G.C.R.S., E.S.-J., M.C., and G.C. All authors have read and agreed to the published version of the manuscript.

Funding

This work was supported in part by the National Science Foundation (grant No. 1437604); by the J. William Fulbright Foreign Scholarship Board and the Bureau of Educational and Cultural Affairs of the United States Department of State through a Fulbright Scholarship awarded to G.S; and by the French National Center for Scientific Research (CNRS) Graduate School EIPHI (contract ANR-17-EURE-0002) and through a CNRS visiting researcher position granted to E.S.-J.

Acknowledgments

Sarah Cummins and the Redwood Cooperative School in Lexington, Kentucky, as well as Jennifer Wyatt and personnel from the Lexington-Fayette Urban Country Government, are thanked for collecting and delivering the used cooking oil used in this study. Tonya Morgan is thanked for her help with the GC-MS analysis of liquid reaction products.

Conflicts of Interest

The authors declare no conflict of interest. The funders had no role in the design of the study; in the collection, analyses, or interpretation of data; in the writing of the manuscript, or in the decision to publish the results.

Appendix A

Table A1. GC-MS analysis of the used cooking oil used in the catalytic upgrading experiments. Text in italics corresponds to compound classes comprising the individual compounds listed. Values shown are wt.%.
CompoundUsed Cooking Oil
Fatty Acids5.44
Oleic Acid (C18:1)5.44
Triglycerides94.56
Triolein94.56
Table A2. GC-MS analysis of the liquid products from the catalytic upgrading of used cooking oil (75 wt.% in C12) over 20% Ni–5% Cu/Al2O3 at 375 °C and WHSV = 1.0 h−1, in 100% H2. Text in bold corresponds to compound classes comprising the individual compounds listed. Text in italics corresponds to compound sub-classes comprising the individual compounds detected. Values shown are wt.%.
Compound4 h8 h24 h28 h48 h52 h56 h72 h76 h
Total Hydrocarbons89.9291.4287.4891.94107.3483.9394.3088.5086.58
Normal Alkanes89.9291.4287.4891.94107.3483.9394.3088.5086.58
Decane (C10)2.642.09-2.15--2.682.36-
Undecane (C11)1.010.15-0.37--0.670.85-
Tetradecane (C14)1.141.38-0.95--1.021.30-
Pentadecane (C15)6.175.99-6.52-5.294.994.72-
Hexadecane (C16)5.426.015.015.81-4.365.695.114.95
Heptadecane (C17)47.0538.9644.5438.9864.9537.9132.7332.9036.89
Octadecane (C18)22.6424.4528.0522.9535.0529.3827.5528.7631.15
Nonadecane (C19)-2.17-2.38--2.722.34-
Eicosane (C20)2.061.262.381.28-3.201.741.552.21
Heneicosane (C21)1.060.96-0.89-2.011.101.101.82
Docosane (C22)-0.960.62-1.17-1.570.861.14
Tricosane (C23)-0.521.40-1.70-1.022.062.24
Tetracosane (C24)-0.861.451.372.34-2.152.052.26
Pentacosane (C25)-0.621.782.402.13-1.952.042.01
Hexacosane (C26)0.735.042.255.89-1.786.710.501.91
Olefins3.032.216.402.14-2.241.761.757.21
Heptadecene (C17:1)3.032.216.402.14-2.241.761.757.21
Unidentified1.921.642.471.29-1.981.841.61-
Table A3. GC-MS analysis of the liquid products from the catalytic upgrading of used cooking oil (75 wt.% in C12) over 20% Ni–5% Fe/Al2O3 at 375 °C and WHSV = 1.0 h−1, in 100% H2. Text in bold corresponds to compound classes comprising the individual compounds listed. Text in italics corresponds to compound sub-classes constituting the individual compounds detected. Values shown are wt.%.
Compound4 h8 h24 h28 h48 h52 h56 h72 h76 h
Total Hydrocarbons93.3991.1690.5995.1097.6194.2099.6897.7298.84
Normal Alkanes93.3991.1690.5995.1097.6194.2099.6897.7298.84
Decane (C10)12.2311.064.193.593.42--3.99-
Undecane (C11)19.4614.884.621.482.78----
Tetradecane (C14)6.855.862.691.151.55----
Pentadecane (C15)9.7111.098.997.077.47.597.997.358.57
Hexadecane (C16)10.0611.588.816.716.615.818.297.687.20
Heptadecane (C17)19.2220.234.3338.0538.3942.1940.5740.9449.85
Octadecane (C18)11.589.714.9517.9617.920.0921.0118.3821.03
Nonadecane (C19)-1.692.292.522.62.682.323.06-
Eicosane (C20)-0.91.451.981.451.702.631.39-
Heneicosane (C21)-0.861.361.581.220.94-1.88-
Docosane (C22)0.47-0.991.481.671.510.94-1.42
Tricosane (C23)0.49-1.392.62.592.473.142.652.26
Tetracosane (C24)0.65-1.482.732.462.453.512.342.27
Pentacosane (C25)0.661.031.172.93.142.753.413.532.49
Hexacosane (C26)2.012.311.883.34.434.025.874.533.75
Nonacosane (C29)---------
Hentriacontane (C31)---------
Tetratriacontane (C34)---------
Olefins-1.261.82.362.442.144.143.142.67
Heptadecene (C17:1)-1.261.82.362.442.144.143.142.67
Table A4. GC-MS analysis of the liquid products from the catalytic upgrading of used cooking oil (75 wt.% in C12) over 20% Ni-0.5% Pt/Al2O3 at 375 °C and WHSV = 1.0 h−1, in 100% H2. Text in bold corresponds to compound classes comprising the individual compounds listed. Text in italics corresponds to compound sub-classes constituting the individual compounds detected. Values shown are wt.%.
Compound4 h8 h24 h28 h48 h52 h56 h72 h76 h
Total Hydrocarbons84.6813.29100.0099.9994.5885.3198.4496.2988.63
Normal Alkanes84.6813.29100.0099.9994.5885.3198.4496.2988.63
Decane (C10)4.35---9.0214.9227.3331.7631.38
Undecane (C11)1.84---8.2210.1117.2631.7434.56
Tetradecane (C14)1.62---2.612.683.755.247.80
Pentadecane (C15)6.65-12.0913.467.526.716.105.725.23
Hexadecane (C16)6.89-13.5415.308.696.415.394.162.72
Heptadecane (C17)34.80-46.2350.7835.0828.2620.879.535.08
Octadecane (C18)23.82-28.1420.4523.4413.298.133.991.86
Nonadecane (C19)2.48----1.39---
Eicosane (C20)1.32----0.96---
Heneicosane (C21)0.91----0.58---
Docosane (C22)-0.82----0.84--
Tricosane (C23)-1.94----1.50--
Tetracosane (C24)-1.82----1.44--
Pentacosane (C25)-2.74----1.561.18-
Hexacosane (C26)-5.97----4.272.97-
Olefins1.17---2.551.821.300.710.60
Heptadecene (C17:1)1.17---2.551.821.300.710.60
Table A5. GC-MS analysis of product mixtures in the thermal upgrading of yellow grease (75 wt.% in C12) over 1 g SiC at 375 °C and WHSV = 1.0 h−1, in 100% H2. Text in bold corresponds to compound classes comprising the individual compounds listed. Text in italics corresponds to compound sub-classes constituting the individual compounds detected. Values shown are wt.%.
Compound4 h8 h24 h28 h48 h52 h56 h72 h76 h
Total Hydrocarbons15.2120.5014.9911.9515.7415.2115.7419.5417.50
Normal Alkanes001.871.952.592.642.582.431.55
Decane (C10)001.871.952.592.642.582.431.55
Pentadecane (C15)000000000
Olefins15.2120.5013.1210.0013.1512.5713.1617.1115.95
Heptadecene (C17:1)4.344.740.710.180.091.020.861.371.25
Hexacosene (C26:1)001.140.911.010.621.001.360.50
Tricosene (C23:1)10.8715.7611.278.9112.0510.9311.3014.3814.20
Total Oxygenates84.7979.5085.0288.0584.2684.7984.2780.4682.5
Fatty Acids84.7979.5083.2486.7481.9382.982.1478.5280.46
Palmitic Acid (C16)8.515.276.686.977.477.507.246.716.54
Oleic Acid (C18:1)76.2874.2366.3267.6563.3664.8362.8459.6562.81
Stearic Acid (C18)0010.2412.1211.110.5712.0612.1611.11
Monolein001.781.312.331.892.131.942.04

Appendix B

Figure A1. Nickel 2p X-ray photoelectron spectra of the spent Ni-Cu (red spectrum), Ni-Fe (green spectrum) and Ni-Pt (purple spectrum) catalysts recovered from deoxygenation experiments.
Catalysts 10 00091 g0a1
Figure A2. Nickel 2p X-ray photoelectron spectra of the spent Ni-Cu (red spectrum), Ni-Fe (green spectrum), and Ni-Pt (purple spectrum) catalysts recovered from deoxygenation experiments after calcination in air at 450 °C for 5 h.
Catalysts 10 00091 g0a2
Figure A3. Nickel 2p X-ray photoelectron spectra of the spent Ni-Cu (red spectrum), Ni-Fe (green spectrum) and Ni-Pt (purple spectrum) catalysts recovered from deoxygenation experiments after calcination in air at 450 °C for 5 h and reduction under H2 at 400 °C for 3 h.
Catalysts 10 00091 g0a3
Figure A4. Carbon 1s X-ray photoelectron spectra of the spent Ni-Cu (red spectrum), Ni-Fe (green spectrum), and Ni-Pt (purple spectrum) catalysts recovered from the deoxygenation experiments.
Catalysts 10 00091 g0a4
Figure A5. Carbon 1s X-ray photoelectron spectra of the spent Ni-Cu (red spectrum), Ni-Fe (green spectrum), and Ni-Pt (purple spectrum) catalysts recovered from the deoxygenation experiments after calcination in air at 450 °C for 5 h.
Catalysts 10 00091 g0a5
Figure A6. Carbon 1s X-ray photoelectron spectra of the spent Ni-Cu (red spectrum), Ni-Fe (green spectrum), and Ni-Pt (purple spectrum) catalysts recovered from the deoxygenation experiments after calcination in air at 450 °C for 5 h and reduction under H2 at 400 °C for 3 h.
Catalysts 10 00091 g0a6
Figure A7. Copper 2p X-ray photoelectron spectra of the spent Ni-Cu catalyst after the deoxygenation experiment (red spectrum), after calcination in air at 450 °C for 5 h (green spectrum), and reduction under H2 at 400 °C for 3 h (purple spectrum).
Catalysts 10 00091 g0a7
Figure A8. Iron 2p X-ray photoelectron spectra of the spent Ni-Fe catalyst after the deoxygenation experiment (red spectrum), after calcination in air at 450 °C for 5 h (green spectrum), and reduction under H2 at 400 °C for 3 h (blue spectrum).
Catalysts 10 00091 g0a8
Figure A9. TEM micrographs and elemental maps of the fresh (left) and spent (right) Cu-promoted catalysts showing both the formation of large particles during catalyst aging and the close association of Ni and Cu irrespective of the catalyst state (fresh or spent). Note that micrographs and elemental maps correspond to different regions. The yellow box on the bottom right micrograph denotes the Cu-hollow space.
Catalysts 10 00091 g0a9
Figure A10. TEM micrographs and elemental maps of the fresh (left) and spent (right) Fe-promoted catalysts showing both the formation of large particles during catalyst aging and the degree of association between Ni and Fe in the fresh and spent formulations. Note that micrographs and elemental maps correspond to different regions. The yellow circles on the bottom micrographs denote the Fe-hollow spaces.
Catalysts 10 00091 g0a10
Figure A11. TEM micrographs and elemental maps of the fresh (left) and spent (right) Pt-promoted catalysts showing both the formation of large Ni particles during catalyst aging and the degree of association between Ni and Pt in the fresh and spent formulations. Note that micrographs and elemental maps correspond to different regions.
Catalysts 10 00091 g0a11
Figure A12. TPR profiles of the spent catalysts after calcination in air at 450 °C for 5 h. Variations in the baseline were magnified by the presence of the SiC diluent (which further reduced the limited amount of sample available for analysis); however, all reduction events are clearly resolved.
Catalysts 10 00091 g0a12

References

  1. Kordulis, C.; Bourikas, K.; Gousi, M.; Kordouli, E.; Lycourghiotis, A. Development of nickel based catalysts for the transformation of natural triglycerides and related compounds into green diesel: A critical review. Appl. Catal. B 2016, 181, 156–196. [Google Scholar] [CrossRef]
  2. Orozco, L.M.; Echeverri, D.A.; Sánchez, L.; Rios, L.A. Second-generation green diesel from castor oil: Development of a new and efficient continuous-production process. Chem. Eng. J. 2017, 322, 149–156. [Google Scholar] [CrossRef]
  3. Pimerzin, A.A.; Tomina, N.N.; Nikul’shin, P.A.; Maksimov, N.M.; Mozhaev, A.V.; Ishutenko, D.I.; Vishnevskaya, E.E. Catalysts based on molybdenum and tungsten heteropoly compounds for the hydrotreatment of oil fractions. Catal. Ind. 2015, 7, 30–37. [Google Scholar] [CrossRef]
  4. Douvartzides, S.L.; Charisiou, N.D.; Papageridis, K.N.; Goula, M.A. Green Diesel: Biomass Feedstocks, Production Technologies, Catalytic Research, Fuel Properties and Performance in Compression Ignition Internal Combustion Engines. Energies 2019, 12, 809. [Google Scholar] [CrossRef] [Green Version]
  5. Hilbers, T.J.; Sprakel, L.M.; van den Enk, L.B.; Zaalberg, B.; van den Berg, H.; van der Ham, L.G. Green diesel from hydrotreated vegetable oil process design study. Chem. Eng. Technol. 2015, 38, 651–657. [Google Scholar] [CrossRef]
  6. Chen, S.; Zhou, G.; Miao, C. Green and renewable bio-diesel produce from oil hydrodeoxygenation: Strategies for catalyst development and mechanism. Renew. Sustain. Energy Rev. 2019, 101, 568–589. [Google Scholar] [CrossRef]
  7. Biofuels and Bioproducts from Wet and Gaseous Waste Streams: Challenges and Opportunities; EERE Publication and Product Library; U.S. Department of Energy: Washington, DC, USA, 2017.
  8. Thinnakorn, K.; Tscheikuna, J. Biodiesel production via transesterification of palm olein using sodium phosphate as a heterogeneous catalyst. Appl. Catal. A 2014, 476, 26–33. [Google Scholar] [CrossRef]
  9. Meher, L.C.; Sagar, D.V.; Naik, S. Technical aspects of biodiesel production by transesterification—A review. Renew. Sustain. Energy Rev. 2006, 10, 248–268. [Google Scholar] [CrossRef]
  10. Santillan-Jimenez, E.; Crocker, M. Catalytic deoxygenation of fatty acids and their derivatives to hydrocarbon fuels via decarboxylation/decarbonylation. J. Chem. Technol. Biotechnol. 2012, 87, 1041–1050. [Google Scholar] [CrossRef]
  11. Loe, R.; Lavoignat, Y.; Maier, M.; Abdallah, M.; Morgan, T.; Qian, D.; Pace, R.; Santillan-Jimenez, E.; Crocker, M. Continuous Catalytic Deoxygenation of Waste Free Fatty Acid-Based Feeds to Fuel-Like Hydrocarbons Over a Supported Ni-Cu Catalyst. Catalysts 2019, 9, 123. [Google Scholar] [CrossRef] [Green Version]
  12. Kiméné, A.; Wojcieszak, R.; Paul, S.; Dumeignil, F. Catalytic decarboxylation of fatty acids to hydrocarbons over non-noble metal catalysts: The state of the art. J. Chem. Technol. Biotechnol. 2019, 94, 658–669. [Google Scholar] [CrossRef]
  13. Loe, R.; Huff, K.; Walli, M.; Morgan, T.; Qian, D.; Pace, R.; Song, Y.; Isaacs, M.; Santillan-Jimenez, E.; Crocker, M. Effect of Pt Promotion on the Ni-Catalyzed Deoxygenation of Tristearin to Fuel-Like Hydrocarbons. Catalysts 2019, 9, 200. [Google Scholar] [CrossRef] [Green Version]
  14. Pattanaik, B.P.; Misra, R.D. Effect of reaction pathway and operating parameters on the deoxygenation of vegetable oils to produce diesel range hydrocarbon fuels: A review. Renew. Sustain. Energy Rev. 2017, 73, 545–557. [Google Scholar] [CrossRef]
  15. Morgan, T.; Grubb, D.; Santillan-Jimenez, E.; Crocker, M. Conversion of triglycerides to hydrocarbons over supported metal catalysts. Top. Catal. 2010, 53, 820–829. [Google Scholar] [CrossRef]
  16. Santillan-Jimenez, E.; Morgan, T.; Lacny, J.; Mohapatra, S.; Crocker, M. Catalytic deoxygenation of triglycerides and fatty acids to hydrocarbons over carbon-supported nickel. Fuel 2013, 103, 1010–1017. [Google Scholar] [CrossRef]
  17. Yu, X.; Chen, J.; Ren, T. Promotional effect of Fe on performance of Ni/SiO2 for deoxygenation of methyl laurate as a model compound to hydrocarbons. RSC Adv. 2014, 4, 46427–46436. [Google Scholar] [CrossRef]
  18. Loe, R.; Santillan-Jimenez, E.; Morgan, T.; Sewell, L.; Ji, Y.; Jones, S.; Isaacs, M.A.; Lee, A.F.; Crocker, M. Effect of Cu and Sn promotion on the catalytic deoxygenation of model and algal lipids to fuel-like hydrocarbons over supported Ni catalysts. Appl. Catal. B 2016, 191, 147–156. [Google Scholar] [CrossRef] [Green Version]
  19. Han, Q.; Rehman, M.U.; Wang, J.; Rykov, A.; Gutiérrez, O.Y.; Zhao, Y.; Wang, S.; Ma, X.; Lercher, J.A. The synergistic effect between Ni sites and Ni-Fe alloy sites on hydrodeoxygenation of lignin-derived phenols. Appl. Catal. B 2019, 253, 348–358. [Google Scholar] [CrossRef]
  20. Khromova, S.A.; Smirnov, A.A.; Bulavchenko, O.A.; Saraev, A.A.; Kaichev, V.V.; Reshetnikov, S.I.; Yakovlev, V.A. Anisole hydrodeoxygenation over Ni–Cu bimetallic catalysts: The effect of Ni/Cu ratio on selectivity. Appl. Catal. A 2014, 470, 261–270. [Google Scholar] [CrossRef]
  21. Peng, B.; Zhao, C.; Kasakov, S.; Foraita, S.; Lercher, J.A. Manipulating catalytic pathways: Deoxygenation of palmitic acid on multifunctional catalysts. Chem. Eur. J. 2013, 19, 4732–4741. [Google Scholar] [CrossRef] [PubMed]
  22. Santillan-Jimenez, E.; Loe, R.; Garrett, M.; Morgan, T.; Crocker, M. Effect of Cu promotion on cracking and methanation during the Ni-catalyzed deoxygenation of waste lipids and hemp seed oil to fuel-like hydrocarbons. Catal. Today 2018, 302, 261–271. [Google Scholar] [CrossRef]
  23. Santillan-Jimenez, E.; Morgan, T.; Loe, R.; Crocker, M. Continuous catalytic deoxygenation of model and algal lipids to fuel-like hydrocarbons over Ni–Al layered double hydroxide. Catal. Today 2015, 258, 284–293. [Google Scholar] [CrossRef]
  24. Vizcaíno, A.J.; Carrero, A.; Calles, J.A. Hydrogen production by ethanol steam reforming over Cu–Ni supported catalysts. Int. J. Hydrogen Energy 2007, 32, 1450–1461. [Google Scholar] [CrossRef]
  25. Wang, L.; Li, D.; Koike, M.; Koso, S.; Nakagawa, Y.; Xu, Y.; Tomishige, K. Catalytic performance and characterization of Ni-Fe catalysts for the steam reforming of tar from biomass pyrolysis to synthesis gas. Appl. Catal. A 2011, 392, 248–255. [Google Scholar] [CrossRef]
  26. Gheisari, K.; Javadpour, S.; Oh, J.T.; Ghaffari, M. The effect of milling speed on the structural properties of mechanically alloyed Fe–45%Ni powders. J. Alloys Compd. 2009, 472, 416–420. [Google Scholar] [CrossRef]
  27. Carrero, A.; Calles, J.; Vizcaíno, A. Hydrogen production by ethanol steam reforming over Cu-Ni/SBA-15 supported catalysts prepared by direct synthesis and impregnation. Appl. Catal. A 2007, 327, 82–94. [Google Scholar] [CrossRef]
  28. Lee, J.-H.; Lee, E.-G.; Joo, O.-S.; Jung, K.-D. Stabilization of Ni/Al2O3 catalyst by Cu addition for CO2 reforming of methane. Appl. Catal. A 2004, 269, 1–6. [Google Scholar] [CrossRef]
  29. Miranda, B.C.; Chimentão, R.J.; Szanyi, J.; Braga, A.H.; Santos, J.B.O.; Gispert-Guirado, F.; Llorca, J.; Medina, F. Influence of copper on nickel-based catalysts in the conversion of glycerol. Appl. Catal. B 2015, 166–167, 166–180. [Google Scholar] [CrossRef] [Green Version]
  30. Li, Y.; Chen, J.; Chang, L.; Qin, Y. The Doping Effect of Copper on the Catalytic Growth of Carbon Fibers from Methane over a Ni/Al2O3 Catalyst Prepared from Feitknecht Compound Precursor. J. Catal. 1998, 178, 76–83. [Google Scholar] [CrossRef]
  31. Rynkowski, J.M.; Paryjczak, T.; Lenik, M. On the nature of oxidic nickel phases in NiO/γ-Al2O3 catalysts. Appl. Catal. A 1993, 106, 73–82. [Google Scholar] [CrossRef]
  32. Zieliński, J. Morphology of nickel/alumina catalysts. J. Catal. 1982, 76, 157–163. [Google Scholar] [CrossRef]
  33. Tanksale, A.; Beltramini, J.; Dumesic, J.; Lu, G. Effect of Pt and Pd promoter on Ni supported catalysts—A TPR/TPO/TPD and microcalorimetry study. J. Catal. 2008, 258, 366–377. [Google Scholar] [CrossRef]
  34. Shi, D.; Wojcieszak, R.; Paul, S.; Marceau, E. Ni Promotion by Fe: What Benefits for Catalytic Hydrogenation? Catalysts 2019, 9, 451. [Google Scholar] [CrossRef] [Green Version]
  35. El Mel, A.-A.; Nakamura, R.; Bittencourt, C. The Kirkendall effect and nanoscience: Hollow nanospheres and nanotubes. Beilstein J. Nanotechnol. 2015, 6, 1348–1361. [Google Scholar] [CrossRef] [Green Version]
  36. Van Stiphout, P.; Stobbe, D.; Scheur, F.T.V.; Geus, J. Activity and stability of nickel-copper/silica catalysts prepared by deposition-precipitation. Appl. Catal. 1988, 40, 219–246. [Google Scholar] [CrossRef]
  37. Webber, P.; Rojas, C.; Dobson, P.; Chadwick, D. A combined XPS/AES study of Cu segregation to the high and low index surfaces of a Cu-Ni alloy. Surf. Sci. 1981, 105, 20–40. [Google Scholar] [CrossRef]
  38. Lv, L.; Li, Z.; Ruan, Y.; Chang, Y.; Ao, X.; Li, J.-G.; Yang, Z.; Wang, C. Nickel-iron diselenide hollow nanoparticles with strongly hydrophilic surface for enhanced oxygen evolution reaction activity. Electrochim. Acta 2018, 286, 172–178. [Google Scholar] [CrossRef]
  39. Lv, L.; Li, Z.; Xue, K.-H.; Ruan, Y.; Ao, X.; Wan, H.; Miao, X.; Zhang, B.; Jiang, J.; Wang, C.; et al. Tailoring the electrocatalytic activity of bimetallic nickel-iron diselenide hollow nanochains for water oxidation. Nano Energy 2018, 47, 275–284. [Google Scholar] [CrossRef]
  40. Xu, W.; Si, R.; Senanayake, S.D.; Llorca, J.; Idriss, H.; Stacchiola, D.; Hanson, J.C.; Rodriguez, J.A. In situ studies of CeO2-supported Pt, Ru, and Pt–Ru alloy catalysts for the water–gas shift reaction: Active phases and reaction intermediates. J. Catal. 2012, 291, 117–126. [Google Scholar] [CrossRef]
  41. Gamarra, D.; Martínez-Arias, A. Preferential oxidation of CO in rich H2 over CuO/CeO2: Operando-DRIFTS analysis of deactivating effect of CO2 and H2O. J. Catal. 2009, 263, 189–195. [Google Scholar] [CrossRef]
  42. Boccuzzi, F.; Chiorino, A.; Martra, G.; Gargano, M.; Ravasio, N.; Carrozzini, B. Preparation, Characterization, and Activity of Cu/TiO2 Catalysts. I. Influence of the Preparation Method on the Dispersion of Copper in Cu/TiO2. J. Catal. 1997, 165, 129–139. [Google Scholar] [CrossRef]
  43. Chandler, B.D.; Pignolet, L.H. DRIFTS studies of carbon monoxide coverage on highly dispersed bimetallic Pt-Cu and Pt-Au catalysts. Catal. Today 2001, 65, 39–50. [Google Scholar] [CrossRef]
  44. Parizotto, N.; Zanchet, D.; Rocha, K.; Marques, C.; Bueno, J. The effects of Pt promotion on the oxi-reduction properties of alumina supported nickel catalysts for oxidative steam-reforming of methane: Temperature-resolved XAFS analysis. Appl. Catal. A 2009, 366, 122–129. [Google Scholar] [CrossRef]
  45. Morgan, T.; Santillan-Jimenez, E.; Harman-Ware, A.E.; Ji, Y.; Grubb, D.; Crocker, M. Catalytic deoxygenation of triglycerides to hydrocarbons over supported nickel catalysts. Chem. Eng. J. 2012, 189–190, 346–355. [Google Scholar] [CrossRef]
  46. Morgan, T.; Santillan-Jimenez, E.; Huff, K.; Javed, K.R.; Crocker, M. Use of dual detection in the gas chromatographic analysis of oleaginous biomass feeds and biofuel products to enable accurate simulated distillation and lipid profiling. Energy Fuels 2017, 31, 9498–9506. [Google Scholar] [CrossRef]
Scheme 1. Deoxygenation routes for tristearin as a model compound representing triglycerides (blue shading) and concomitant reactions confounding oxygen-bearing deoxygenation products (red shading).
Catalysts 10 00091 sch001
Figure 1. GC-MS analysis of the liquid products resulting from the deoxygenation of UCO over 20%Ni–5%Cu/Al2O3 (a), 20%Ni–5%Fe/Al2O3 (b), 20%Ni–0.5%Pt/Al2O3 (c).
Catalysts 10 00091 g001
Figure 2. GC analysis of the gaseous products from deoxygenation of UCO at different catalysts for 20%Ni–5%Cu/Al2O3 (a), 20%Ni–5%Fe/Al2O3 (b), 20%Ni–0.5%Pt/Al2O3 (c).
Catalysts 10 00091 g002
Figure 3. X-ray diffraction patterns for 20%Ni–5%Fe/Al2O3 (a), 20%Ni–5%Cu/Al2O3 (b), 20%Ni–0.5%Pt/Al2O3 (c).
Catalysts 10 00091 g003
Figure 4. TPR profiles of the catalysts studied.
Catalysts 10 00091 g004
Figure 5. TGA of the spent catalysts recovered from the deoxygenation experiments.
Catalysts 10 00091 g005
Figure 6. Particle size distribution (a) and metallic composition (b) histograms for the Ni-Cu catalyst.
Catalysts 10 00091 g006
Figure 7. Particle size distribution (a) and metallic composition (b) histograms for the Ni-Fe catalyst.
Catalysts 10 00091 g007
Figure 8. Particle size distribution (a) and metallic composition (b) histograms for the Ni-Pt catalyst.
Catalysts 10 00091 g008
Figure 9. CO-DRIFTS of the catalysts studied.
Catalysts 10 00091 g009
Table 1. Textural properties of the catalysts studied.
CatalystBET Surface Area (m2/g)Pore vol. (cm3/g)Avg. Pore Diameter (nm)
20% Ni–5% Cu/Al2O31290.288.8
20% Ni–5% Fe/Al2O31450.296.7
20% Ni-0.5% Pt/Al2O31340.296.9
Table 2. Surface concentration (at.%) of elements detected via XPS.
SampleCTotCInorg aCOrg bSi cAlNi (Ni0) dCuFe
20% Ni–5% Cu/Al2O3—Spent31.73.827.93.918.62.4 (0.38)0.95
20% Ni–5% Fe/Al2O3—Spent16.56.110.45.613.39.4 (3.10)2.70
20% Ni-0.5% Pt/Al2O3—Spent52.66.646.05.911.21.6 (0.29)
20% Ni–5% Cu/Al2O3—Calcined4.22.31.94.225.04.6 (0.32)3.20
20% Ni–5% Fe/Al2O3—Calcined8.45.43.08.213.59.6 (0.13)4.15
20% Ni-0.5% Pt/Al2O3—Calcined15.211.43.89.514.39.3 (0.22)
20% Ni–5% Cu/Al2O3—Re-reduced4.9ND4.91.530.13.5 (2.10)0.90
20% Ni–5% Fe/Al2O3—Re-reduced8.25.62.67.713.211.0 (3.0)4.70
20% Ni-0.5% Pt/Al2O3—Re-reduced45.733.012.71.312.93.5 (2.00)
a CTot × Carbide %Area; b CTot-CInorg; c This amount should be equal to the amount of C contained in SiC; d Ni × Ni0 %Area.

