Simple Summary
Cancer-associated fibroblasts (CAFs) promote the progression of pancreatic ductal adenocarcinoma by remodeling the microenvironment toward tumor growth, invasion, and metastasis. A sub-population of CAFs originates from adipose stromal cells in adjacent fat tissue through mechanisms that are not well understood. Using co-cultures of human adipose stromal cells with pancreatic cancer cells and a mouse model of pancreatic cancer, we found that tumor cells induce Wnt and TGFβ signaling and extracellular matrix gene expression in adipose stromal cells. We discovered that two important genes, the long non-coding RNA LINC01614 and the Wnt signaling modulator SFRP4, are required for this transition. Loss of SFRP4 reduced cancer cell migration, growth, and metastasis, suggesting that SFRP4 is a promising therapeutic target inhibiting the transition.
Abstract
Background/objectives: Progression of pancreatic ductal adenocarcinoma (PDAC) and other carcinomas relies on cancer-associated fibroblasts (CAFs). A subset of CAFs is derived from adipose stromal cells (ASCs) recruited by tumors and the ASC-CAF conversion has been associated with invasiveness and poor prognosis. Methods: To explore the underlying molecular mechanisms, we used a model based on primary ASCs derived from human visceral adipose tissue co-cultured with human PDAC cell line Capan-1. To investigate cancer progression in vivo, we also used mice orthotopically grafted with mouse KPC cells. Results: Genomic analysis revealed that Capan-1 co-culture induces Wnt and TGFβ signaling and extracellular matrix (ECM) gene expression in ASC. We investigated the function of two markers of the fibroblastic transition highly induced by cancer cells: a long non-coding RNA LINC01614 and a Wnt signaling modulator SFRP4. By using ASCs with either SFRP4 or LINC01614 knocked out (ko), we showed that both genes are required for Wnt/TGFβ signaling and ECM induction in ASCs by Capan-1. Analysis of changes in Capan-1 genes that rely on LINC01614 and SFRP4 expression in ASCs also identified the Wnt and TGF pathways. SFRP4 ko in ASCs suppressed both migration and invasion of Capan-1 cells. We show that tumors in SFRP4 ko mice have less desmoplasia, less epithelial dedifferentiation, reduced growth rate, and reduced progression to metastasis. Conclusions: We conclude that SFRP4 promotes cancer progression in pancreatic cancer and is a promising therapeutic target.
Keywords:
cancer; tumor microenvironment; metastasis; pancreas; fibroblast; stromal; adipose; LINC01614; SFRP4; Wnt; TGF; SMAD 1. Introduction
Despite the progress in cancer medicine, pancreatic ductal adenocarcinoma (PDAC) remains largely incurable. The majority of patients who present with disseminated disease are offered palliative chemotherapy. For certain subtypes of PDAC, chemotherapeutics can prolong survival, but recurrent resistance remains a challenge, with loss of adipose tissue and subsequent cachexia contributing to mortality [1]. The tumor microenvironment (TME) plays an important role in cancer progression to aggressive stages [2]. Cancer-associated fibroblasts (CAFs) are a diverse and dynamic population of non-malignant mesenchymal cells within the TME. CAFs modulate tumor vascularization, remodeling of the extracellular matrix (ECM), proliferation, epithelial–mesenchymal transition (EMT), resistance to chemotherapy, metastatic dissemination, and immunosuppression [3]. In recent years, much progress in understanding CAF heterogeneity and plasticity has been made [4]. However, the origins of distinct CAF subpopulations remain to be debated [5]. Mouse PDAC models have revealed that pancreatic stellate cells contribute little to CAFs [6]. Multiple lines of evidence indicate that CAFs with pro-metastatic properties may originate from other sources of mesenchymal stroma [7].
The increased aggressiveness of various carcinomas, including pancreatic, breast, and prostate cancers, has been linked to obesity and the expansion of adipose tissue [8,9]. Adipose tissue surrounding carcinomas has been identified as a source of CAFs, which becomes particularly important in the context of obesity [10,11]. Studies in mouse models have demonstrated that inflamed and fibrotic adipose tissue in obesity enhances cancer progression [12,13]. Adipose stromal cells (ASCs) consist of a diverse population, including pro-inflammatory and myofibroblastic progenitors [13]. Studies based on adipose transplantation and lineage tracing have revealed that ASCs proliferate in obesity, become mobilized, and migrate to tumors, contributing to poor cancer prognosis in obese patients [14,15]. Furthermore, ASCs infiltrating tumors from adjacent adipose depots have been identified as contributors to CAFs [16]. These adipose-derived CAFs are believed to play a multifaceted role in promoting cancer progression by producing the ECM supporting angiogenesis and metastasis [17,18,19]. They have also been implicated in inducing EMT and enhancing cancer aggressiveness [20,21,22]. However, the specific molecular mechanisms through which ASCs transition to CAFs promoting cancer progression have remained poorly understood.
The clinical relevance of these observations from mouse models has been corroborated by our analysis of single-cell RNA sequencing (RNA-seq) data from human PDAC, which has revealed a gene expression trajectory strongly suggesting that CAFs in aggressive tumors originate from ASCs that gradually evolve during disease progression [23]. Similar observations have been made by other groups in independent studies [24,25]. Based on computational genomic analysis, we have reported that high expression of THBS2, INHBA, and several collagens, with prominent presence of COL11A1 marking the endpoint of the transition, is a signature of CAFs in aggressive tumors in multiple cancer types [23,26]. This gene co-expression is observed only in tumors that had progressed beyond a cancer type-specific stage threshold. For example, in ovarian cancer it appears only after having reached stage III (mainly omental metastasis), while in breast cancer it may appear as early as stage I, but never in carcinoma in situ, consistent with the interaction of cancer cells with ASCs. In this study, we refer to these “aggressive” CAFs as “aCAFs”. The reported computational analysis revealed the induction of genes coding for the secreted frizzled-related protein 4 (SFRP4) and the long intergenic non-protein coding RNA LINC01614 (aka LNC01614, AC093850.2, LCAL4) in the ASC-aCAF transition [23]. The same analysis also identified a gene signature for the progenitor ASC population, which characterizes cells found among fibro-adipogenic progenitors. This population has both adipogenic and fibroblastic differentiation potential, the former being consistent with its presence in the stromal vascular fraction of adipose tissue and the latter with its transition to aCAFs following recruitment by cancer cells [27].
Here, we discover Hedgehog signaling [28] as a mechanism through which PDAC cells activate the ASC-aCAF transition. We identify LINC01614 and SFRP4 as the genes induced in human ASCs by co-culture with human PDAC cells. Our data demonstrate that LINC01614 and SFRP4 expression activate Wnt and TGFβ signaling linked with the production of ECM molecules, including COL11A1. We also show that SFRP4 secreted by ASCs promotes Wnt and TGF signaling and the resulting invasiveness of PDAC cells. SFRP4 is an evolutionary conserved secreted protein with a known mouse ortholog [29]. By using a mouse SFRP4-ko model, we demonstrate that pancreatic tumor growth, desmoplasia, and progression to metastasis are promoted by CAF-derived SFRP4.
2. Materials and Methods
2.1. Cells and Culture
Cells were cultured at 37 °C with 5% CO2. Human primary ASCs obtained from visceral adipose tissue of a healthy donor undergoing bariatric surgery and cryopreserved were reported previously [30]. Cells were expanded in DMEM with 20% fetal bovine serum (FBS) and stably transduced with a lentivirus pLVX-tdTomato-C1 (Takara Bio USA Inc., #632564; San Jose, CA, USA) expressing a red fluorescent protein, tdTomato red fluorescent protein (RFP), and carrying a puromycin selection gene. The RFP+ ASCs were subsequently transduced with a lentivirus Lenti-CRISPR v2-Blast (Addgene, #83480; Watertown, MA, USA) carrying the blasticidin selection gene and with guide RNA for CRISPR knockouts or without guide RNA (empty vector control). For LINC01614, a previously validated sequence CACCGGTGTAAGGTACTCAAGTGCT was used [31]. For SFRP4, a previously validated sequence ACCGACTTGCACGGCTTGAT was used. To select successfully transduced cells, cells were cultured in DMEM + 20% FBS+ 5 μg/mL blasticidin/puromycin for 7 days. Cells that were not transduced were also cultured in DMEM + 20% FBS+ 5 μg/mL blasticidin/puromycin alongside transduced cells to verify complete cell death with the selection antibodies. Stably transfected ko and control (empty RFP+ vector) cells were expanded upon blasticidin/puromycin selection. Capan-1 cells received from ATCC (HTB-79; Manassas, VA, USA) were expanded in DMEM with 20% FBS and stably transduced with a lentivirus pLVX-EGFP (Addgene, #128652) expressing enhanced green fluorescent protein (EGFP) and carrying a puromycin selection gene.
2.2. Gene Expression Analysis
Cells were trypsin-dissociated and co-cultured cells were subjected to FACS sorting with ARIA-II (BD Biosciences; Franklin Lakes, NJ, USA. Separated GFP+ and RFP+ cells were used for total RNA extraction as described previously [32]. For expression measurement by RT-PCR, mRNA was extracted using the Trizol Reagent (Life Technologies, #15596018; Carlsbad, CA, USA). Complementary DNAs were generated using High-Capacity cDNA Reverse Transcription Kit (Applied Biosystems, #4368814; Waltham, MA, USA). PCR reactions were performed on a CFX96 Real-Time System C1000 Touch thermal cycler (Bio-Rad; Hercules, CA, USA) using Q-PCR Master Mix (Gendepot, #Q5600-005, Altair, TX, USA). Expression of genes were normalized to GAPDH RNA. The Sybr green primers were as follows: GAPDH RNA Forward (CATCACTGCCACCCAGAAGACTG), Reverse (ATGCCAGTGAGCTTCCCGTTCAG); SFRP4 Forward GCTTAGGCGTTTACAGTCAACATC, Reverse CTATGACCGTGGCGTGTGCATT; LINC01614 Forward TCAACCAAGAGCGAAGCCAA, and Reverse TTGGACACAGACCCTAGCAC. Total RNA sequencing was performed by UTHealth Cancer Genomics Core. Principal component analysis (PCA) was used to evaluate inter-sample differences. Gene expression distribution was found to be comparable among all samples. To compare gene expression levels, the distribution of gene counts and expected number of fragments per kilobase of transcript sequence per million base pairs sequenced (FPKM) was assessed.
2.3. Bulk RNA-Seq Data Preprocessing and Analysis
For each sample, we performed gene expression quantification using RSEM (RNA-seq by Expectation Maximization) v1.3.1 with STAR (Spliced Transcripts Alignment to a Reference) v2.7.1a as the aligner [33,34]. Paired-end sequencing reads in raw FASTQ format were processed with the “rsem-calculate-expression” function. The raw FASTQ files were aligned to the GRCh38 genome reference, which was prebuilt using the “rsem-prepare-reference” function. Downstream analyses were performed on the resulting gene quantifications. We used the DESeq2 (1.30.1) method to identify differentially expressed genes (DEGs). Genes with fewer than ten raw counts across all samples were excluded from the analysis. To create the DESeq2 object, we used the “DESeqDataSetFromMatrix” function, specifying the design to indicate the various experimental conditions. DEGs were estimated using the “lfcShrink” function with a “normal” estimator [35]. We performed Gene Set Enrichment Analysis (GSEA) using the fgsea (v1.16.0) R package with 50 broad hallmark gene sets and thousands of Gene Ontology (GO) sets. For comparison, we selected DEGs (adj p values < 0.05) and ranked them by fold change. From the ranked list, we chose the top 100 genes for further over-representation analysis. GO term over-representation analysis was conducted using the “enrichGO” function from the clusterProfiler (v3.18.1) package using the org.Hs.eg.db (v3.12.0) annotation database [36]. In independent analyses, Qiagen Ingenuity Pathway Analysis (IPA) software (version 01-22-01) was used to identify condition-dependent changes in signaling networks.
2.4. Protein Expression Analysis
Cultured cells were paraformaldehyde-fixed. For tissue analysis, tumors were fixed in 10% neutral buffered formalin (NBF) for 72 hr for paraffin embedding and tumor cross-sections (5 μM) cut for histology. Trichrome staining was performed using a commercially available kit HT15-1KT (Sigma; St. Louis, MO, USA). Samples were analyzed by immunofluorescence (IF) as described [32,37,38,39]. Upon blocking, the following primary antibodies were used (4 °C, 12 h): E-cadherin (CDH1) antibody 610181 (BD Biosciences) at 1:100; Ki-67 antibody 14-5698-80 (Invitrogen; Carlsbad, CA, USA) at 1:500; SFRP4 antibody HPA009712 (Sigma) at 1:100; COL11A1 antibody orb767627 (Biorbyt; Wuhan, Hubei, China) at 1:100; and -GFP (Gene Tex, #GTX26673; Irvine, CA, USA) at 1:250. As secondary antibody, Donkey Alexa488-conjugated IgG A11055 (Invitrogen) at 1:200 or Cy3-conjugated IgG 711-166-152 (Jackson ImmunoResearch; West Grove, PA, USA) at 1:200 was used. IF images were acquired with Biotek Cytation5/Gen5™ Software (Version 3.08, Biotek; Winooski, VT, USA).
2.5. Cell Culture Functional Assays
Co-cultures were performed in triplicate by plating 25,000 GFP+ Capan-1 cells with/without 25,000 RFP+ ASCs in 24-well plates for 40 hr in FBS-free DMEM. After 40 hr in coculture, cells were trypsinized for transwell assays. For cell migration assay, 900 μL of DMEM/20% FBS was added to each well. Transwell inserts (8 μM, #353097, Corning; Corning, NY, USA) were then placed in each well. Trypsinized cells from cocultures were added to the transwells in 300 μL of FBS-free DMEM and cells were incubated for 5 hr. For cell invasion assays, transwell inserts were placed in 24-well plates and coated with 300 μL of chilled PBS containing 10 mg/mL of Matrigel (#354234, Corning). Plates were then incubated for 3 hr to solidify the Matrigel. Then, 900 μL of DMEM/20% FBS was added to each well. The Matrigel solution was aspirated from the transwells, trypsinized cells from coculture were added to transwells in 300 μL of FBS-free DMEM, and cells were incubated for 24 hr. For analyses, transwells were removed from the plates and the apical side of the membrane was cleaned using a cotton swab wetted with PBS. Cells that migrated to the basal side of the membrane were fixed in 70% ethanol for 15 min. Membranes were removed from the transwells using a razor blade and mounted basal side up on charged glass slides. GFP IF was performed, and then membranes were washed and counterstained with DAPI to visualize nuclei. 15 images (10×) were taken of each membrane using Cytation5 /Gen5™ software (Version 3.08) for quantification.
2.6. Mouse Models
All mouse experiments were approved by and performed in accordance with the University of Texas Health Science Center at Houston Institutional Animal Care and Use Committee. Mice were housed in a barrier facility with ad libitum access to food and water and were maintained on a 12 h light/dark cycle. Frozen sperm of SFRP4-ko mice [29] was provided by Jason Mastaitis (Regeneron; Tarrytown, NY, USA) and mice were re-derived by Charles River (Wilmington, MA, USA). Then, mice were back-crossed into the C57BL/6 background. KPC FC1242 cells, originally isolated from the KPC genetic murine model of PDAC [40], were used as described [38,39]. Mice were anesthetized using inhaled isoflurane and Ethiqa XR, then placed in lateral recumbency on their right side, shaved, and aseptically prepped. A small incision was made in the abdomen to retract the pancreas. Using a 28G needle and a 1 mL syringe 105 KPC or KPC-SMAD4-ko cells were injected into the pancreas over 30 s. The abdominal musculature was sutured, and the skin was closed using metal wound clips. Upon necropsy, tumors were weighed. Livers were minced and digested with collagenase and dispase to quantify metastasis-derived cells by the colony formation assay as described [38] by plating suspensions (1 × 10⁶ cells/well) in triplicate in 6-well plates in DMEM supplemented with 20% FBS for 7 days. Upon fixation with cooled methanol (−20 °C) for 20 min, colonies were visualized using crystal violet staining.
2.7. Statistical Analysis
Microsoft Excel and Graphpad Prism (version 10.6.0) were used to graph data as mean ± SD and to calculate p-values using homoscedastic Student’s t-Test for comparison of two groups or One-Way ANOVA for comparison of >three groups. p < 0.05 was considered significant. The total sample size was at least N = 3 per group, and experiments were repeated at least twice with similar results.
3. Results
3.1. PDAC Cells Activate TGFβ, Wnt, and SHH Signaling; LINC01614, SFRP4, and ECM Genes in ASC
To investigate the effect of PDAC cells on ASCs, we used primary ASCs from human visceral AT. RFP-labeled ASCs were plated at semi-confluence alone or admixed 50:50 with Capan-1 cells expressing GFP. Cells have reached confluence by day 3 (Figure 1A). At day 7 of co-culture, ASC and Capan-1 cells were separated by FACS (Figure S1A) and processed for RNA sequencing. Ingenuity Pathway Analysis (IPA) identified “extracellular matrix organization” as the top significantly induced canonical pathway following co-culture with Capan-1 cells (p = 5 × 10⁻²¹). As top upstream regulatory pathways, beta-estradiol, TGFβ, TNF, and GLI were identified. Indeed, Capan-1 co-culture induced the expression of TGFB3 by 7-fold (Table S1) and of TGFB1 by 1.7-fold. Accordingly, the expression of TCF4 (3-fold) and other TCF/LEF transcription factors (TFs) downstream of Wnt and TGFβ signaling, was activated by Capan-1 co-culture. Gene expression analysis also confirmed a 7-fold induction of GLI1, the TF mediating Sonic Hedgehog (SHH) Hedgehog signaling. The induction of pathways engaging TGFβ, Wnt, and Hedgehog signaling in ASCs by Capan-1 cell co-culture is summarized in Figure 1B and Figure S1B.
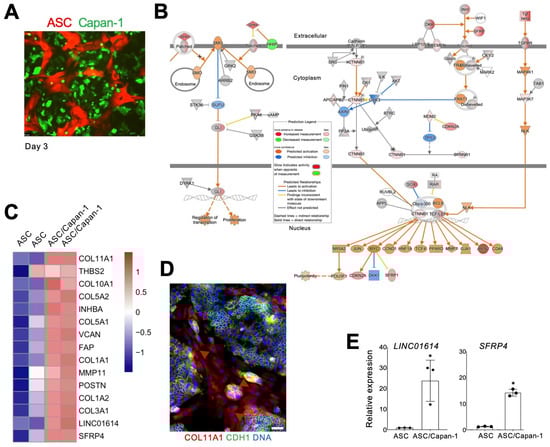
Figure 1.
PDAC cell-induced ASC-CAF transition. (A), ASCs expressing RFP cultured with or without Capan-1 cells expressing GFP co-seeded at a 1:1 ratio. (B), Changes in RFP+ fibroblasts induced by Capan-1 co-culture after 7 days identified by IPA focused on SHH (right) and Wnt (left) signaling pathways. Changes in ASC/Capan-1 co-culture vs. ASCs alone (legend) indicate SHH and Wnt target activation. (C), The heatmap shows gene-wise scaled expression values of two potential therapeutic targets and aCAF genes [26] in two biological replicates of ASCs with/without Capan-1 cell co-culture. Scale bar: gene-wise z-score of relative gene expression from high (red) to low (blue). (D), IF analysis of ASC/Capan-1 co-culture demonstrating COL11A1 expression in CDH1-negative fibroblasts (red, arrowheads). CDH1+ (green): cancer cells. Blue: nuclei. Scale bar: 100 μM. (E), RT-PCR analysis of mRNA expression in RFP+ cells sorted from ASCs with/without Capan-1 co-culture demonstrating the induction of LINC01614 and SFRP4 expression. Plotted: mean +/− SD, * p < 0.05, Student’s t-test.
Co-culture of ASCs with Capan-1 cells led to the upregulation of key genes associated with COL11A1+THBS2+INHBA+ gene signature of aCAFs. Notably, 13 of the top 15 genes listed in Table 4 of Kim et al. [26] were strongly upregulated (Figure 1C). COL11A1, the most strongly induced gene, is activated at a late stage of the ASC-aCAF transition [23,27]. IF analysis confirmed COL11A1 expression in ASCs co-cultured with Capan-1 cells marked by CDH1 (Figure 1D). COL11A1 and most other genes found induced by Capan-1 in ASCs (Figure 1C) have established roles in cancer progression. The exceptions are LINC01614 and SFRP4, for which the function in PDAC CAFs has not been studied. Their upregulation in FACS-sorted ASCs following Capan-1 co-culture was validated both by RT-PCR in FACS-sorted ASCs (Figure 1E). Hence, we proceeded to interrogate their function.
3.2. LINC01614 or SFRP4 Ko in ASCs Prevents ECM Expression and Signaling Induced by PDAC Cells
Expression of LINC01614 and SFRP4 was undetectable by RT-PCR in Capan-1 cells (Figure 2A). To investigate the function of LINC01614 and SFRP4 in ASCs and CAFs, human visceral ASCs used in Figure 1 were transduced with CRISPR vectors to generate gene knockouts (kos). Proliferation of ASCs was not significantly affected by either LINC01614 ko or SFRP4 ko in Capan-1 co-culture (Figure S1A), which made it possible to isolate consistent numbers of cells for comparable analyses for each co-culture. RT-PCR confirmed that the baseline ASC expression of each gene was reduced by each respective ko (Figure 2A). The reduction in LINC01614 and SFRP4 expression in ASCs was significantly higher in co-culture with Capan-1 cells (Figure 2B).
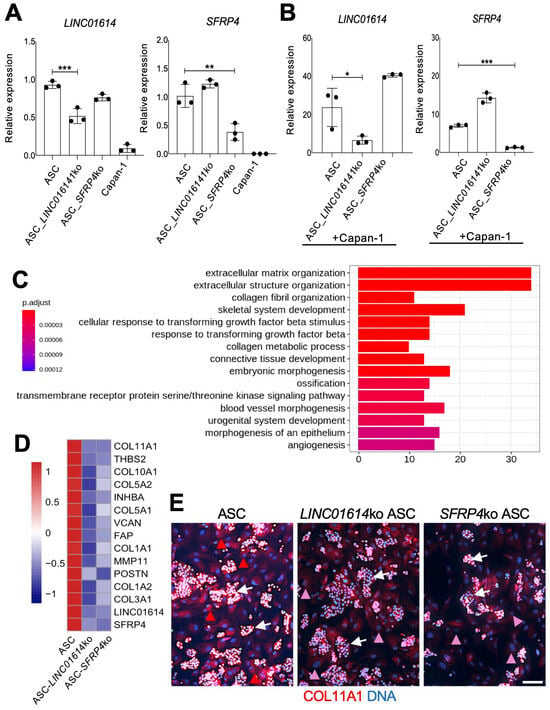
Figure 2.
The effect of LINC01614 ko and SFRP4 ko in ASC-CAFs. (A), RT-PCR analysis of mRNA expression in parental, LINC01614-ko, and SFRP4-ko ASCs confirming reduction in the respective target gene expression. (B), RT-PCR analysis of mRNA expression in parental, LINC01614-ko, and SFRP4-ko RFP+ ASCs sorted from co-culture with GFP+ Capan-1 cells, confirming reduction in the respective target gene expression. A-B, Plotted: mean +/− SD, * p < 0.05, ** p < 0.01, *** p < 0.005, ANOVA. (C), Top 15 GO terms identified from the comparison between parental ASCs and LINC01614-ko ASCs after Capan-1 co-culture. DEGs were filtered based on adjusted p-values (<0.05) and ranked by log2 fold change, with the top 100 DEGs selected for analysis. (D), Knockout of LINC01614 or SFRP4 inhibits the expression of aCAF genes (Figure 1C) induced in Capan-1 co-culture, as measured by RNAseq data. The heatmap shows gene expression values averaged across samples within each condition. Expression values are scaled by gene-wise to highlight relative differences between conditions. Scale bar: gene-wise z-score of relative gene expression from high (red) to low (blue). (E), IF analysis of ASCs co-cultured with Capan-1 cells (arrows), revealing COL11A1 expression (red arrowheads) reduced (pink arrowheads) upon LINC01614 ko and SFRP4 ko. Blue: nuclei. Scale bar: 100 μM. White arrowheads: Capan-1 cell colonies.
We then subjected the LINC01614-ko and SFRP4-ko ASCs to RNA sequencing and comparative genomic analysis. To investigate the biological processes impacted by each ko, we performed GSEA. The hallmark pathways and GO enrichment analysis indicated a marked similarity between LINC01614 ko and SFRP4 ko effects (Figure S2A,B). Hallmark pathways, such as TGFβ signaling, Wnt signaling, EMT, angiogenesis, and hypoxia, were inhibited after either LINC01614 or SFRP4 ko (Figure S2A). There was also a concordance of pathways induced after both knockouts. The dependence of ECM remodeling on LINC01614 and SFRP4 was revealed from GO enrichment analysis (Figure 2C). Figure S2B summarizes it, demonstrating that each ko inhibited key processes related to ECM organization. Indeed, COL11A1 and other collagen genes were not induced by Capan-1 co-culture upon either LINC01614 or SFRP4 ko in ASCs (Figure S2C). ECM organization, connective tissue activation, and fibrosis were also identified by IPA as the top processes dependent on both LINC01614 (p = 7 × 10−37) and SFRP4 (p = 4 × 10⁻³⁰) in ASCs co-cultured with Capan-1, as shown in Figure S3A. Other IPA-identified pathways dependent on LINC01614 and SFRP4 related to cell migration, invasion, and metastasis (Figure S3B). GO over-representation analysis also identified the dependence of TGFβ signaling activation on target gene in Capan-1 co-culture (Figure 2C). That corresponded to the numbers of TGFB1 and TGFB3 reads being dramatically reduced by either LINC01614 or SFRP4 ko in RNAseq data. The dependence of TGFβ/Wnt signaling induction on LINC01614 and SFRP4 was also revealed by IPA focused on these pathways (Figure S3B). According to RNAseq data, GLI1 expression was 9× lower in SFRP4-ko ASCs and 11× lower in LINC01614-ko ASCs than in parental ASCs co-cultured with Capan-1. This observation, also pinpointed by IPA in SFRP4-ko co-cultures (Figure S3A), suggests that the LINC01614/SFRP4 pathway supports the Hedgehog-GLI1 signaling induced in ASCs by PDAC cells.
Top ASC genes found to be downregulated in LINC01614-ko in ASC co-cultured with Capan-1 cells were HEPH, ID4, LINC01614, COL1A2, and FMOD (Table S2). Top ASC genes found to be downregulated in SFRP4-ko in ASCs co-cultured with Capan-1 cells were HEPH, OLFML3, ID4, and CHSY3 (Table S3). The overlap in downregulated gene lists suggested that ASC-expressed LINC01614 and SFRP4 operate within the same pathway. Notably, changes in HEPH, ID4, and other genes reduced in the LINC01614-ko and SFRP4-ko were not observed without Capan-1 co-culture in either LINC01614 ko (Table S4) or SFRP4 ko (Table S5) ASCs. Importantly, the expression on all aCAF signature genes (Figure 1C) was reduced upon either SFRP4 or LINC01614 ko in ASCs co-cultured with cancer cells (Figure 2D). The reduction in COL11A1 expression upon LINC01614 ko or SFRP4 ko in Capan-1 co-culture was confirmed by IF (Figure 2E).
3.3. Co-Culture with ASCs Activates TGF/Wnt Signaling in PDAC Cells
Co-culture of with ASCs led to the activation of multiple signaling pathways in Capan-1 cells, indicating dynamic intercellular communication. Transcriptomics analysis identified Indian Hedgehog (IHH) among the top 10 and SHH among the top 20 genes induced by ASC co-culture (Table S6). Given that GLI1, the Hedgehog effector, is induced in ASCs by Capan-1 (Figure 1B), these data suggest IHH and SHH as PDAC-secreted factors that activate the ASC transition to CAFs. In addition to IHH, the top Capan-1 genes induced by ASCs in Capan-1 cells were OLFM4, LGALS4, CA9, AC020978.6, LYZ, and NOXA1. IPA identified “RHO GTPase cycle” as a top canonical pathway induced by ASCs (p = 2 × 10⁻¹⁵). As top upstream regulators, HNF4A, β-estradiol, K-RAS, and TP53 were identified by IPA. Activation of TGF-regulated networks was revealed in the analysis focused on “pancreatic adenocarcinoma signaling” pathways (Figure 3A). Activation of components of TGFβ/Wnt signaling, culminating in HNF1A induction, was also detected (Figure S3A).
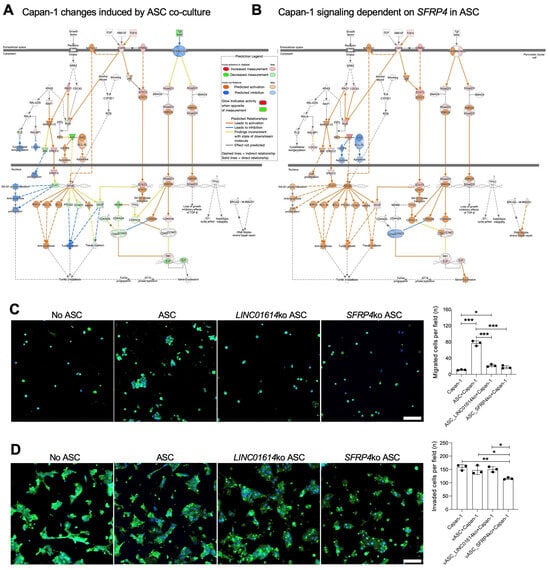
Figure 3.
The effect of ASC-CAFs and their SFRP4 and LINC01614 expressed on PDAC cells. (A), Changes in GFP+ sorted Capan-1 cells induced by ASC-CAF co-culture after 7 days identified by IPA focused on pancreatic adenocarcinoma signaling pathways. Changes in co-cultured Capan-1 vs. Capan-1 alone (legend) indicate TGF target activation. (B), Changes in GFP+ Capan-1 cells in SFRP4-ko vs. parental ASC-CAF co-culture for 7 days identified by IPA focused on pancreatic adenocarcinoma signaling pathways indicate TGF target activation dependency on SFRP4 expression. (C), Migration assay showing GFP+ cells in representative view fields of trans-well bottoms upon Capan-1 culture on the trans-well top with or without indicated RFP+ ASCs for 5 hrs. (D), Trans-well Matrigel invasion assay showing GFP+ cells in representative view fields of trans-well bottoms upon Capan-1 culture on the trans-well top with or without indicated RFP+ ASCs for 24 hrs. Blue: nuclei. Scale bar: 100 μM. Graphs: mean cell number/view field +/− SD, * p < 0.05, ** p < 0.01, *** p < 0.005, ANOVA.
3.4. LINC01614 or SFRP4 Ko in ASCs Prevents TGF/Wnt Signaling Induction in PDAC Cells
To investigate the function of ASC-expressed LINC01614 and SFRP4 in cancer progression, we analyzed Capan-1 cells co-cultured with the corresponding ko ASCs. OLFM4, NOXA1, and IHH were identified as the top three Capan-1 genes found to be dependent on ASC LINC01614 from the dataset (Table S7). Remarkably, the same three genes, OLFM4, NOXA1, and IHH, were found to be dependent on ASC SFRP4 (Table S8). This again demonstrates that LINC01614 and SFRP4 are parts of the same mechanism through which ASCs signal to PDAC cells. Notably, GLI expression is induced in ASCs co-cultured with Capan-1 cells (Figure 1B), whereas IHH is induced in Capan-1 cells co-cultured with ASCs. This suggests that IHH secreted by PDAC cells may be the signal through which the Hedgehog pathway is activated in CAFs. Activation of TGF-regulated networks, dependent on ASC-expressed SFRP4, was revealed in the analysis focused on “pancreatic adenocarcinoma signaling” pathways (Figure 3B). Activation of TGFβ/Wnt signaling, culminating in HNF1A induction, was also found to be dependent on ASC-expressed LINC01614 and SFRP4 (Figure S3B).
To determine the function of ASC-expressed LINC01614 and SFRP4, we analyzed the effect of the knockouts on Capan-1 cells in co-culture. Proliferation of Capan-1 cells was not reduced by either LINC01614 or SFRP4 ko in co-cultured ASCs (Figure S1A). Co-culture with ASCs significantly increased the migration of Capan-1 cells through Matrigel in the trans-well assay (Figure 3C). Knockout of either LINC01614 or SFRP4 in ASCs reduced Capan-1 migration to baseline levels (Figure 3C). Interestingly, only SFRP4 knockout in ASCs significantly suppressed Capan-1 invasion (Figure 3D). These findings suggested that SFRP4 plays a broader role in regulating cancer cell aggressiveness.
3.5. SFRP4 Loss in the TME Suppresses PDAC Progression
We used a previously reported whole-body SFRP4-ko mouse strain [29] to test the role of host SFRP4 on PDAC progression. As a model of PDAC, we used cells from KrasLSL-G12D;p53LoxP;Pdx1-CreER (KPC) mice [40]. KPC cells were orthotopically grafted into the pancreas of SFRP4-ko and WT littermates, and cancer progression was monitored for 3 weeks. The loss of SFRP4 expression by ko ASCs was confirmed by IF on primary adipose-derived stromal/vascular cells adherent in culture (Figure 4A). The ko was also confirmed by IF on tumor sections, which also indicated that SFRP4 expression by cancer cells is negligible (Figure 4B). Tumor growth was significantly reduced by the host SFRP4 ko (Figure 4C). Consistent with that, tumor-free body weight was significantly decreased due to cachexia in WT mice but not in SFRP4 ko littermates (Figure 4D). Tissue section Ki-67 IF revealed decreased cancer cell proliferation in tumors of SFRP4-ko mice, accounting for slower tumor growth (Figure 4E). Although macro-metastases were not evident, we used a previously established colony formation assay [38] to assess micro-metastases. It revealed that metastatic cancer cell dissemination to the liver was significantly reduced by SFRP4 ko in the TME (Figure 4F). Growth of cancer cell colonies from liver cell suspensions of SFRP4-ko mice was also lower in culture (Figure 4G). Desmoplasia, visualized by trichrome staining, was notably lower in tumors of SFRP4-ko littermates (Figure 4H). Specifically, stromal COL11A1 deposition was markedly lower in tumors of SFRP4-ko mice (Figure 4I). KPC tumors in SFRP4-ko littermates also had a higher presence of necrotic areas, indicating a decrease in cancer cell viability (Figure 4H). These differences were concomitant with a higher presence of glandular structures composed of cells with epithelial morphology, confirming a lack of dedifferentiation typical of aggressive PDAC (Figure 4H,I).
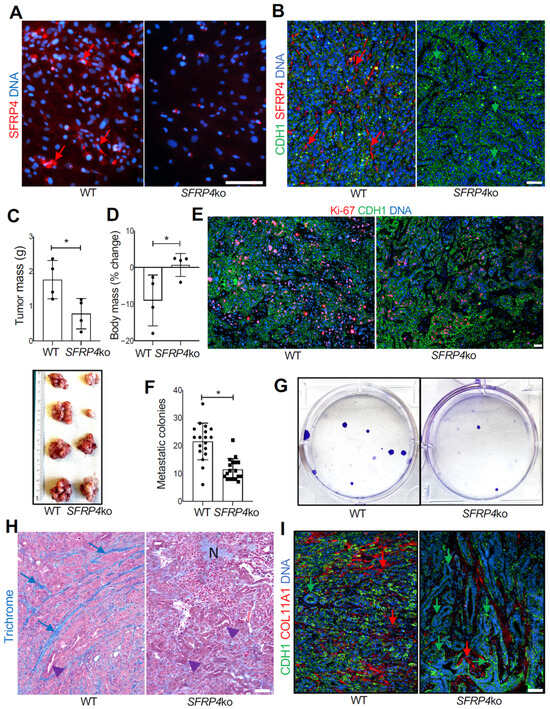
Figure 4.
The effect of SFRP4 ko on SMAD-dependent PDAC progression in mice. (A), IF on adherent ASCs demonstrating that SFRP4 expression (red arrows) is missing in cells from SFRP4-ko mice. (B), IF on KPC tumor sections demonstrating that SFRP4 expression (red arrows) is missing in CAFs of SFRP4-ko mice. CDH1+ (green): cancer cells. (C), Weights (mean +/− SD) and pictures of KPC tumors resected from WT and SFRP4-ko mice after 3 weeks. * p < 0.05, Student’s t-test. (D), Changes in body weight (mean +/− SD) from grafting day in WT and SFRP4-ko mice after 3 weeks. (E), IF on KPC tumor sections showing that the frequency of proliferating Ki-67+ cells (red) is lower in tumors of SFRP4-ko mice. (F), Quantification of metastatic KPC cells based on the numbers of colonies formed by adherent cells from liver cell suspensions. Graphs: mean colony number/well +/− SD. (G), Images of representative wells used for (F). * p < 0.05, Student’s t-test. (H), Representative sections of KPC tumors stained with Trichrome to reveal collagen deposition (blue arrows). N: necrosis; arrowheads: glandular epithelial structures increased in tumors of SFRP4-ko mice. (I), Representative sections of KPC tumors subjected to COL11A1 and CDH1 IF. Green arrows: epithelial CDH1 expression. Red arrows: stromal COL11A1 expression reduced in SFRP4-ko mice. Blue: nuclei. Scale bar: 100 μM.
3.6. SMAD4 Loss in Cancer Cells Overrides the Effect of SFRP4 on Cancer Progression
Capan-1 cells used for human co-culture studies lack the expression of SMAD4, which is often observed in aggressive PDAC [41,42]. To simulate this hallmark in the murine model, we used SMAD4-ko KPC cells, which were orthotopically grafted into the pancreas of SFRP4-ko and WT littermates, and cancer progression was monitored for 3 weeks. As for parental KPC, SFRP4 ko was confirmed by IF on tumor sections (Figure 5A). In contrast to parental KPC, the growth of SMAD4-ko tumors was not reduced by SFRP4 ko in the TME (Figure 5B). There was no difference in body weight loss between SFRP4-ko and WT littermates with SMAD4-ko tumors (Figure 5C). There was also no effect of SFRP4 ko on liver metastases of SMAD4-ko tumors (Figure 5D). Growth of SMAD4-ko cancer cell colonies from liver cell suspensions of SFRP4-ko mice was also comparable in culture (Figure 5E). Desmoplasia, visualized by trichrome staining, was comparable in SMAD4-ko tumors of WT and SFRP4-ko littermates (Figure 5F). Specifically, there was no detectable difference in stromal COL11A1 deposition between WT and SFRP4-ko mice in SMAD4-ko tumors (Figure 5G). This indicates that the stimulatory effect of stromal SFRP4 on PDAC progression depends on functional SMAD4 in murine cancer cells.
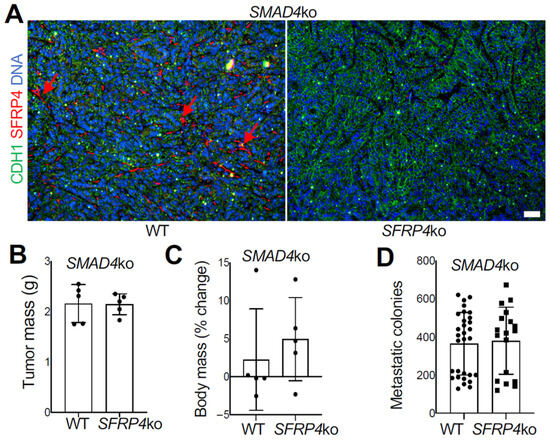
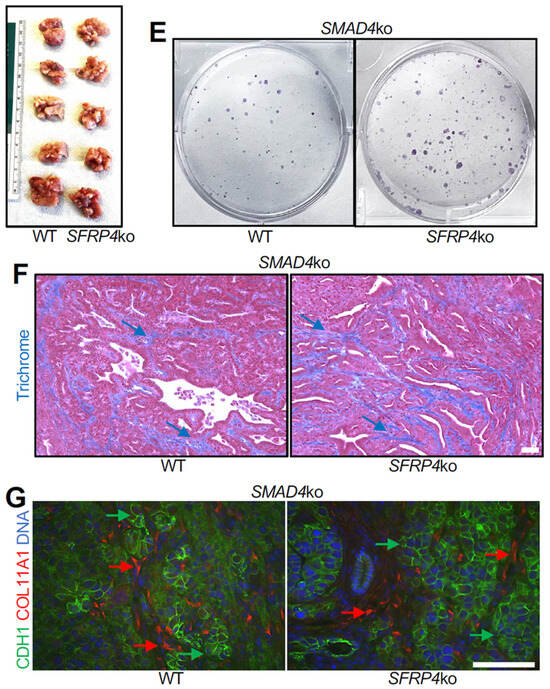
Figure 5.
SMAD4 ko overrides the SFRP4 dependency of PDAC progression in mice. (A), IF on SMAD4-ko KPC tumor sections demonstrating that SFRP4 expression (red arrows) is missing in CAFs of SFRP4-ko mice. CDH1+ (green): cancer cells. (B), Weights (mean +/− SD) and pictures of SMAD4-ko KPC tumors resected from WT and SFRP4-ko mice after 3 weeks. (C), Changes in body weight (mean +/− SD) from grafting day in WT and SFRP4-ko mice after 3 weeks. (D), Quantification of metastatic SMAD4-ko KPC cells based on numbers of colonies formed by adherent cells from liver cell suspensions. Graphs: mean colony number/well +/− SD. (E), Images of representative wells used for (D). (F), Representative sections of SMAD4-ko KPC tumors stained with Trichrome to reveal collagen deposition (blue arrows). (G), Representative sections of SMAD4-ko KPC tumors subjected to COL11A1 and CDH1 IF. Red arrows: stromal COL11A1 expression. Green arrows: epithelial CDH1 expression. Blue: nuclei. Scale bar: 100 μM.
4. Discussion
This study makes an important advance toward understanding the mechanisms through which ASC-derived CAFs regulate PDAC progression. The conversion of ASCs into CAFs, previously revealed by computational analysis of human genomic data [23], was simulated in human cell co-culture. While PDAC is highly heterogeneous, we used a controlled and reproducible co-culture system based on Capan-1 cells, which has limitations and advantages. We demonstrate for the first time that stromal LINC01614 and SFRP4 are required for the activation of TGF and Wnt signaling, as well as ECM production, by ASCs in the presence of cancer cells. SFRP4 ko in mouse TME resulted in increased tumor cell death, reduced cancer cell proliferation and tumor growth, reduced desmoplasia, reduced cachexia, and a decrease in liver micro-metastases.
A previous study using subcutaneous ASCs immortalized by telomerase overexpression also concluded that Capan-1 cells could induce an ASC-aCAF transition [43]. However, the aCAF markers, such as COL11A1, THBS2, MMP11, and SFRP4 [23,26] were not significantly induced in that study after co-culture [24]. Here, we have overcome the limitations of that study by using human ASCs derived from visceral adipose tissue, a depot physiologically relevant to PDAC. Importantly, we used primary ASCs without immortalization. The co-culture experiments resulted in the full transition to aCAFs with the computationally discovered aCAF pan-cancer gene signature described in our original study [26], which is marked by upregulation of COL11A1, THBS2, INHBA, LINC01614, SFRP4, COL10A1, and MMP11 [23]. It remains debated how ASC-derived CAFs compare transcriptionally and functionally to other CAF populations in PDAC. As we recently reported [27], comparative analysis of gene expression profiles of ASC-derived CAFs with CAF transcriptomes reported by other studies will continue to bring clarity.
In our previous study, LINC01614 was found associated with COL11A1 across multiple cancer types (23). LINC01614 has been reported as a promising diagnostic and prognostic marker in various cancers and linked to the tumor microenvironment and oncogenic function. Our previous study [23] identified SFRP4 as a gene upregulated at the initiation of the transition from ASCs to aCAF, suggesting that it plays a role in triggering it. SFRP4 has been indirectly implicated in various cancers, including pancreatic cancer, where its high expression was linked to EMT and poor patient prognosis [44]. The link between obesity/diabetes, the state of adipose remodeling, and PDAC aggressiveness is well established [8]. Overexpression of SFRP4 in type-2 diabetes [45] is consistent with its potential role at an early stage if of ASC recruitment. However, the function of SFRP4 in pancreatic cancer has not been directly interrogated. Here, the observation that ASC-aCAF transition is inhibited in the absence of either LINC01614 or SFRP4 prompted us to investigate the mechanism of their function.
LINC01614 has been previously reported to activate TGFβ signaling in PDAC [46]. Because TGFβ signaling is a well-established driver of fibrosis and cancer desmoplasia [47], it is likely that the induction of ECM genes is regulated by the LINC01614/SFRP4 expression at least in part via TGFβ signaling back to CAFs (Figure S4). Our study identifies a number of other genes important to consider for a role in cancer-fibroblast crosstalk. The top fibroblast gene induced by Capan-1 co-culture is proteoglycan 4 (PRG4). While CAF-derived PRG4 has been shown to inhibit TGFβ and the progression of hepatocellular and breast carcinomas, a direct link of PRG4 to CAFs in PDAC is currently missing. The top genes found to be dependent on LINC01614 and SFRP4 in fibroblasts co-cultured with Capan-1 were HEPH, ID4, and OLFML3. HEPH codes for hephaestin, the plasma membrane ferroxidase that mediates the extracellular conversion of ferrous iron into its ferric form, protecting cells from ferroptosis [48]. Inhibitor of DNA binding 4 (ID4) promotes the proliferation, migration, and invasion of cancer cells [49]. OLFML3, coding for olfactomedin-3, has been implicated in cancer TGFβ and Wnt signaling. The exact roles of these CAF-expressed genes in PDAC are to be further investigated.
Our human genomic analysis reinforces the published evidence that LINC01614 and SFRP4 act through the Wnt pathway. Moreover, it suggests that LINC01614 and SFRP4 promote Wnt signaling in both CAFs and cancer cells. Wnt signaling is required for both initiation and progression of pancreatic cancer [50] in part by promoting the EMT [51]. It has been reported that LINC01614 activates Wnt signaling by suppressing GSK3β [46]. SFRP proteins are generally thought to inhibit Wnt/β-catenin signaling by binding to Wnt ligands or Frizzled receptors [52]. However, some studies have suggested that SFRP4 may instead support Wnt signaling under certain conditions [53]. The Wnt-stimulating role of SFRP4 has been linked to its post-translational modifications and intracellular function [54]. In gastric cancer, increased SFRP4 expression was found to activate the Wnt pathway and promote tumor progression by antagonizing SFRP1 [55]. Specifically, there are correlative data suggesting that SFRP4 promotes Wnt signaling and metastases in PDAC [56]. While there is no known mouse ortholog of LINC01614, the mouse SFRP4-ko model enabled the interrogation of this pathway in vivo. Our mouse experiments demonstrate that it promotes cancer progression to liver metastases.
The model of multi-pronged effects of LINC01614 and SFRP4 on cancer cells is proposed in Figure S5. While this model is supported by transcriptomic analyses, we note that the conclusions are primarily based on RNA-level data. Future work incorporating additional protein-level validation will be important to further clarify pathway directionality and causality. The synergistic effects of increased Wnt signaling, TGF signaling, and ECM remodeling are likely to be responsible for cancer progression, which is suppressed in the SFRP4-ko mouse model. The signaling changes induced by SFRP4 result in increased proliferation and invasiveness of PDAC cells, both facilitating metastases. Wnt and the TGF/SMAD pathways cross-talk in fibrogenesis [57] and their interdependence has been reported in pancreatic cancer [58]. Wnt signaling has been shown to mediate TGF/SMAD activation during myofibroblast proliferation [59]. Therefore, these pathways, regulated by LINC01614 and SFRP4, are likely to stimulate both CAFs and cancer cells. TGF/SMAD signaling is known to have stage-dependent and context-dependent effects in PDAC [60]. While initially it plays a tumor-suppressive role, in advanced cancer it has been shown to promote metastases [61]. Desmoplasia from CAF-secreted collagens is instrumental for metastatic dissemination [17,18]. COL11A1, induced by LINC01614 and SFRP4, has been shown to induce EMT and invasiveness [62]. Emerging data from other cancers suggest COL11A1 as an important driver of disease aggressiveness induced by ASC-derived CAFs [63].
SMAD signaling is one of the key pathways dysregulated in PDAC [41]. Our data indicate that in mice SFRP4 metastasis-promoting function depends on SMAD4 expression in cancer cells. The mechanism through which SMAD4 ko in cancer cells negates the dependency on SFRP4 is partly explained by previous studies. In the absence of SMAD4, non-canonical TGF signaling can become dominant and promote metastasis [64]. While TGF-induced EMT can drive cancer cells into apoptosis, in the absence of SMAD4, cell death is suppressed and EMT becomes unchecked and more aggressive, strongly contributing to the invasive and migratory phenotype of cancer cells [42]. Importantly, in human co-culture SFRP4 promotes invasiveness of Capan-1 cells, which are SMAD4-negative. This suggests that SFRP4 inhibition may suppress the aggressiveness of even SMAD4-negative human cancers. Tumor-targeted CRISPR-mediated inactivation of SFPR4 could be considered for future therapeutic approaches.
Downstream of the Wnt activation in cancer cells, our genomic analysis highlights the induction of HNF1A. This gene, coding for Hepatocyte Nuclear Factor 1-alpha, has been reported as both an oncogene and a promoter of cell proliferation and metabolism in PDAC [65]. Its potential importance in the process remains to be determined. The top genes expressed in Capan-1 found to depend on LINC01614/SFRP4 in ASCs were OLFM4, NOXA1, and IHH, coding for Olfactomedin-4, NADPH oxidase activator 1, and Indian Hedgehog, respectively. OLFM4 has been uncovered as a potential prognostic PDAC biomarker and reported to promote cancer cell proliferation and chemoresistance [66]. NOXA1 regulates reactive oxygen species (ROS) and is hence likely important for cancer cell survival. Its expression in cancer correlates with increased tumor aggressiveness and poor prognosis, although it has not been specifically investigated in PDAC. It has been reported that IHH is induced in cancer cells and functionally contributes to PDAC progression via signaling to CAFs [67]. TGFβ signaling activates IHH transcription [68], which suggests a feedback loop in which SFRP4-driven TGFβ release from CAFs promotes cancer cell expression of IHH signaling back to CAFs (Figure S4). The Hedgehog effector GLI1, which we found to be induced by cancer cells, is known to promote fibroblast activation and ECM remodeling in PDAC [69]. Our data from human cell co-culture indicate that LINC01614 and SFRP4 are important for both TGF signaling and GLI1 activation. Therefore, these genes appear to be the central perpetuators of this vicious cycle driving PDAC progression.
5. Conclusions
In summary, this study establishes a model of human ASC conversion into CAFs and the roles of LINC01614 and SFRP4 as key genes driving this process. It also discovers the function of these genes in activating Wnt and TGFβ signaling, desmoplasia, and metastatic cancer progression. The potential of SFRP4 as a drug target is to be further investigated. While conventional antiproliferative treatments are prone to resistance development due to selection pressure [70,71], blocking SFRP4 to suppress cancer cell invasiveness could offer an advantage.
Supplementary Materials
The following supporting information can be downloaded at: https://www.mdpi.com/article/10.3390/cancers18020233/s1. Table S1. ASC gene expression changes induced by Capan-1 co-culture. Comparison is for FACS-sorted RFP+ cells: ASC/Capan-1 vs. ASC alone. To remove the background of epithelial genes (transmitted by exosomes or/and from occasional Capan-1 cells stuck to RFP+ ACSs during FACS) 5438 genes differentially expressed by Capan-1 but not by ASCs (padj < 0.05; log2FoldChange > 0) were removed from the list. Shown are top genes most upregulated by Capan-1. Table S2. Expression changes upon LINC01614 KO in ASCs co-cultured with Capan-1 cells. Comparison is for FACS-sorted RFP+ cells: ASC/Capan-1 vs. LINC01614-KO ASC/Capan-1. Shown are top genes most reduced by LINC01614 KO. Table S3. Expression changes upon SFRP4 KO in ASCs co-cultured with Capan-1 cells. Comparison is for FACS-sorted RFP+ cells: ASC/Capan-1 vs. SFRP4-KO ASC/Capan-1. Shown are top genes most reduced by SFRP4 KO. Table S4. Expression changes upon LINC01614 KO in ASCs cultured without Capan-1 cells. Comparison is for FACS-sorted RFP+ cells: ASC vs. LINC01614-KO ASC. Shown are top genes most reduced by LINC01614 KO. Table S5. Expression changes upon SFRP4 KO in ASCs cultured without Capan-1 cells. Comparison is for FACS-sorted RFP+ cells: ASC vs. SFRP4-KO ASC. Shown are top genes most reduced by SFRP4 KO. Table S6. Capan-1 gene expression changes induced by ASC co-culture. Comparison is for FACS-sorted GFP+ cells: ASC/Capan-1 vs. Capan-1 alone. To remove the background of mesenchymal genes (transmitted by exosomes or/and from occasional ASCs stuck to GFP+ Capan-1 during FACS), 3764 genes differentially expressed by ASCs but not by Capan-1 cells (padj < 0.05; log2FoldChange > 0) were removed from the list. Shown are top genes most upregulated by ASCs. Table S7. Expression changes in Capan-1 cells upon LINC01614 KO in co-cultured ASCs. Comparison is for GFP+FACS-sorted cells from co-cultures ASC/Capan-1 vs. LINC01614-KO ASC/Capan-1. To remove the background of mesenchymal genes (transmitted by exosomes or/and from occasional ASCs stuck to GFP+ Capan-1 during FACS), 3726 genes differentially expressed by ASCs but not by Capan-1 cells (padj < 0.05; log2FoldChange > 0) were removed from the list. Shown are top genes most reduced by LINC01614 KO. Table S8. Expression changes in Capan-1 cells upon SFRP4 KO in co-cultured ASCs. Comparison is for GFP+FACS-sorted cells from co-cultures ASC/Capan-1 vs. SFRP4-KO ASC/Capan-1. To remove the background of mesenchymal genes (transmitted by exosomes or/and from occasional ASCs stuck to GFP+ Capan-1 during FACS), 3967 genes differentially expressed by ASCs but not by Capan-1 cells (padj < 0.05; log2FoldChange > 0) were removed from the list. Shown are top genes most reduced by SFRP4 KO. Figure S1. The effect of PDAC cell co-culture on ASCs. ASCs expressing RFP were cultured with or without Capan-1 cells expressing GFP, co-seeded at a 1:1 ratio. (A) After 7 days of co-culture, cells were FACS-separated and quantified (graphs). Plotted are mean values from three independent co-culture experiments and sorts. (B) Top pathway changes induced in ASC by Capan-1 co-culture identified in RNA-seq data by IPA. Activation of SHH signaling is highlighted. Figure S2. The effect of SFRP4 and LINC01614 ko on ASC gene expression in Capan-1 co-culture analyzed by GSEA. (A) Plot of NES and adjusted p values for the combined set of the top 10 most upregulated and top 10 most downregulated hallmark gene sets from each comparison indicated. The color scale represents the normalized enrichment score (NES) calculated by GSEA, while the circle size represents the significant level, measured by -log10 of the adjusted p-value. (B) Plot of NES and adjusted p values for the combined set of the top 10 most upregulated and top 10 most downregulated GO terms. (C) Expression of genes identified by Gene Set Enrichment Analysis (GSEA) for “GOMF extracellular matrix structural constituent conferring tensile strength” compared for parental, LINC01614-ko, and SFRP4-ko ASCs after co-culture with Capan-1. Heatmap shows gene-wise scaled average expression per condition. Scale bar: gene-wise z-score of relative gene expression from high (red) to low (blue). Figure S3. The effect of SFRP4 and LINC01614 ko on ASC gene expression in Capan-1 co-culture analyzed by IPA. (A) Top cellular processes and top canonical pathways downregulated by LINC01614 ko and SFRP4 ko in Capan-1 co-culture. TGFB1 and GLI1 signaling being centered on are highlighted. (B) Signaling focused on TGFβ and Wnt pathways, downregulated by LINC01614 ko and SFRP4 ko in Capan-1 co-culture. Figure S4. The effect of ASC, SFRP4 ko in ASC, and LINC01614 ko in ASCs on cancer cells. Data from total RNA expression comparison of Capan-1 co-cultured with parental ASCs vs. LINC01614-ko ASCs and vs. SFRP4-ko ASCs was analyzed by IPA to focus on the TGFβ/Wnt signaling pathways. (A) Capan-1 vs. Capan-1 + parental ASCs; (B) Capan-1 + parental ASCs vs. Capan-1 + LINC01614-ko ASCs; (C) Capan-1 + parental ASCs vs. Capan-1 + SFRP4-ko ASCs. Figure S5. The model of ASC-CAF cross-talk with PDAC cells. Upregulation of LINC01614 and SFRP4 by cancer cells induces Wnt signaling and the expression of TGFs and ECM in CAFs. TGFs and SFRP4 secreted from CAFs promote Wnt and TGF signaling in cancer cells, which synergize with desmoplastic changes, promote PDAC cell proliferation, survival, and migration, which collectively enable metastasis. Inactivation of SMAD4 short-circuits cancer cells to become more metastatic irrespective of SFRP4 signaling.
Author Contributions
M.G.K. and D.A. designed this study. J.R. and A.C.D. performed the experiments. J.R., A.C.D. and L.C. performed the data analysis. M.G.K. wrote the draft of the manuscript. D.A., J.R., A.C.D. and L.C. reviewed the manuscript. All authors have read and agreed to the published version of the manuscript.
Funding
This research was in part funded by the Bovay Foundation, and the Levy-Longenbaugh Fund.
Institutional Review Board Statement
The animal study protocol was approved by the Institutional Review Board of UT Houston (protocol code AWC-21-0145, approval 15 January 2023).
Informed Consent Statement
Not applicable.
Data Availability Statement
The datasets generated for this study can be found in the GEO database, accession GSE314456.
Acknowledgments
We thank Rolf Brekken for gifting SMAD4-ko KPC cells.
Conflicts of Interest
L.C., D.A. and M.G.K. have filed a patent application related to this work.
References
- Principe, D.R.; Underwood, P.W.; Korc, M.; Trevino, J.G.; Munshi, H.G.; Rana, A. The Current Treatment Paradigm for Pancreatic Ductal Adenocarcinoma and Barriers to Therapeutic Efficacy. Front. Oncol. 2021, 11, 688377. [Google Scholar] [CrossRef]
- Rozenblatt-Rosen, O.; Regev, A.; Oberdoerffer, P.; Nawy, T.; Hupalowska, A.; Rood, J.E.; Ashenberg, O.; Cerami, E.; Coffey, R.J.; Demir, E.; et al. The Human Tumor Atlas Network: Charting Tumor Transitions across Space and Time at Single-Cell Resolution. Cell 2020, 181, 236–249. [Google Scholar] [CrossRef]
- Chen, Y.; McAndrews, K.M.; Kalluri, R. Clinical and therapeutic relevance of cancer-associated fibroblasts. Nat. Rev. Clin. Oncol. 2021, 18, 792–804. [Google Scholar] [CrossRef] [PubMed]
- Caligiuri, G.; Tuveson, D.A. Activated fibroblasts in cancer: Perspectives and challenges. Cancer Cell 2023, 41, 434–449. [Google Scholar] [CrossRef] [PubMed]
- Sahai, E.; Astsaturov, I.; Cukierman, E.; DeNardo, D.; Egeblad, M.; Evans, R.; Fearon, D.; Greten, F.; Hingorani, S.; Hunter, T.; et al. A Framework for Advancing our Understanding of Cancer-Associated Fibroblasts. Nat. Rev. Cancer 2020, 20, 174–186. [Google Scholar] [CrossRef]
- Helms, E.J.; Berry, M.W.; Chaw, R.C.; DuFort, C.C.; Sun, D.; Onate, M.K.; Oon, C.; Bhattacharyya, S.; Sanford-Crane, H.; Horton, W.; et al. Mesenchymal Lineage Heterogeneity Underlies Nonredundant Functions of Pancreatic Cancer-Associated Fibroblasts. Cancer Discov. 2022, 12, 484–501. [Google Scholar] [CrossRef] [PubMed]
- Vennin, C.; Melenec, P.; Rouet, R.; Nobis, M.; Cazet, A.S.; Murphy, K.J.; Herrmann, D.; Reed, D.A.; Lucas, M.C.; Warren, S.C.; et al. CAF hierarchy driven by pancreatic cancer cell p53-status creates a pro-metastatic and chemoresistant environment via perlecan. Nat. Commun. 2019, 10, 3637. [Google Scholar] [CrossRef]
- Pellegata, N.S.; Berriel Diaz, M.; Rohm, M.; Herzig, S. Obesity and cancer-extracellular matrix, angiogenesis, and adrenergic signaling as unusual suspects linking the two diseases. Cancer Metastasis Rev. 2022, 41, 517–547. [Google Scholar] [CrossRef]
- Kolonin, M.G. Preface: Obesity and Cancer. Cancer Metastasis Rev. 2022, 41, 461–462. [Google Scholar] [CrossRef]
- Bochet, L.; Lehuede, C.; Dauvillier, S.; Wang, Y.Y.; Dirat, B.; Laurent, V.; Dray, C.; Guiet, R.; Maridonneau-Parini, I.; Le Gonidec, S.; et al. Adipocyte-derived fibroblasts promote tumor progression and contribute to the desmoplastic reaction in breast cancer. Cancer Res. 2013, 73, 5657–5668. [Google Scholar] [CrossRef]
- Zhang, Y.; Daquinag, A.; Traktuev, D.O.; Amaya, F.; Simmons, P.J.; March, K.L.; Pasqualini, R.; Arap, W.; Kolonin, M.G. White adipose tissue cells are recruited by experimental tumors and promote cancer progression in mouse models. Cancer Res. 2009, 69, 5259–5266. [Google Scholar] [CrossRef]
- Zhang, Y.; Daquinag, A.C.; Amaya-Manzanares, F.; Sirin, O.; Tseng, C.; Kolonin, M.G. Stromal progenitor cells from endogenous adipose tissue contribute to pericytes and adipocytes that populate the tumor microenvironment. Cancer Res. 2012, 72, 5198–5208. [Google Scholar] [CrossRef] [PubMed]
- Lengyel, E.; Makowski, L.; DiGiovanni, J.; Kolonin, M.G. Cancer as a Matter of Fat: The Crosstalk between Adipose Tissue and Tumors. Trends Cancer 2018, 4, 374–384. [Google Scholar] [CrossRef]
- Saha, A.; Kolonin, M.G.; DiGiovanni, J. Obesity and prostate cancer—Microenvironmental roles of adipose tissue. Nat. Rev. Urol. 2023, 20, 579–596. [Google Scholar] [CrossRef]
- Zhang, T.; Tseng, C.; Daquinag, A.C.; Corn, P.G.; Troncoso, P.; Pettaway, C.; Logothetis, C.; Kolonin, M.G. CXCL1 mediates obesity-associated adipose stromal cell trafficking and function in the tumor microenvironment. Nat. Comm. 2016, 7, 11674–11690. [Google Scholar] [CrossRef] [PubMed]
- Okumura, T.; Ohuchida, K.; Kibe, S.; Iwamoto, C.; Ando, Y.; Takesue, S.; Nakayama, H.; Abe, T.; Endo, S.; Koikawa, K.; et al. Adipose tissue-derived stromal cells are sources of cancer-associated fibroblasts and enhance tumor progression by dense collagen matrix. Int. J. Cancer 2018, 144, 1401–1413. [Google Scholar] [CrossRef]
- Alexander, J.; Cukierman, E. Stromal dynamic reciprocity in cancer: Intricacies of fibroblastic-ECM interactions. Curr. Opin. Cell Biol. 2016, 42, 80–93. [Google Scholar] [CrossRef] [PubMed]
- Finger, A.M.; Hendley, A.M.; Figueroa, D.; Gonzalez, H.; Weaver, V.M. Tissue mechanics in tumor heterogeneity and aggression. Trends Cancer 2025, 11, 806–824. [Google Scholar] [CrossRef] [PubMed]
- Seo, B.R.; Bhardwaj, P.; Choi, S.; Gonzalez, J.; Andresen Eguiluz, R.C.; Wang, K.; Mohanan, S.; Morris, P.G.; Du, B.; Zhou, X.K.; et al. Obesity-dependent changes in interstitial ECM mechanics promote breast tumorigenesis. Sci. Transl. Med. 2015, 7, 301–311. [Google Scholar] [CrossRef]
- Su, F.; Daquinag, A.C.; Ahn, S.; Saha, A.; Dai, Y.; Zhao, Z.; DiGiovanni, J.; Kolonin, M.G. Progression of prostate carcinoma is promoted by adipose stromal cell-secreted CXCL12 signaling in prostate epithelium. NPJ Precis. Oncol. 2021, 5, 26. [Google Scholar] [CrossRef]
- Su, F.; Wang, X.; Pearson, T.; Lee, J.; Krishnamurthy, S.; Ueno, N.T.; Kolonin, M.G. Ablation of Stromal Cells with a Targeted Proapoptotic Peptide Suppresses Cancer Chemotherapy Resistance and Metastasis. Mol. Ther. Oncolytics 2020, 18, 579–586. [Google Scholar] [CrossRef]
- Su, F.; Ahn, S.; Saha, A.; DiGiovanni, J.; Kolonin, M.G. Adipose stromal cell targeting suppresses prostate cancer epithelial-mesenchymal transition and chemoresistance. Oncogene 2019, 38, 1979–1988. [Google Scholar] [CrossRef]
- Zhu, K.; Cai, L.; Cui, C.; de Los Toyos, J.R.; Anastassiou, D. Single-cell analysis reveals the pan-cancer invasiveness-associated transition of adipose-derived stromal cells into COL11A1-expressing cancer-associated fibroblasts. PLoS Comput. Biol. 2021, 17, e1009228. [Google Scholar] [CrossRef]
- Miyazaki, Y.; Oda, T.; Inagaki, Y.; Kushige, H.; Saito, Y.; Mori, N.; Takayama, Y.; Kumagai, Y.; Mitsuyama, T.; Kida, Y.S. Adipose-derived mesenchymal stem cells differentiate into heterogeneous cancer-associated fibroblasts in a stroma-rich xenograft model. Sci. Rep. 2021, 11, 4690. [Google Scholar] [CrossRef]
- Kolonin, M.G.; Anastassiou, D. Adipose Stromal Cell-Derived Cancer-Associated Fibroblasts Suppress FGFR Inhibitor Efficacy. Cancer Res. 2024, 84, 648–649. [Google Scholar] [CrossRef]
- Kim, H.; Watkinson, J.; Varadan, V.; Anastassiou, D. Multi-cancer computational analysis reveals invasion-associated variant of desmoplastic reaction involving INHBA, THBS2 and COL11A1. BMC Med. Genom. 2010, 3, 51. [Google Scholar] [CrossRef] [PubMed]
- Cai, L.; Kolonin, M.G.; Anastassiou, D. The fibro-adipogenic progenitor APOD+DCN+LUM+ cell population in aggressive carcinomas. Cancer Metastasis Rev. 2024, 43, 977–980. [Google Scholar] [CrossRef] [PubMed]
- Olive, K.P.; Jacobetz, M.A.; Davidson, C.J.; Gopinathan, A.; McIntyre, D.; Honess, D.; Madhu, B.; Goldgraben, M.A.; Caldwell, M.E.; Allard, D.; et al. Inhibition of Hedgehog signaling enhances delivery of chemotherapy in a mouse model of pancreatic cancer. Science 2009, 324, 1457–1461. [Google Scholar] [CrossRef]
- Mastaitis, J.; Eckersdorff, M.; Min, S.; Xin, Y.; Cavino, K.; Aglione, J.; Okamoto, H.; Na, E.; Stitt, T.; Dominguez, M.G.; et al. Loss of SFRP4 Alters Body Size, Food Intake, and Energy Expenditure in Diet-Induced Obese Male Mice. Endocrinology 2015, 156, 4502–4510. [Google Scholar] [CrossRef][Green Version]
- Gao, Z.; Daquinag, A.C.; Fussell, C.; Zhao, Z.; Dai, Y.; Rivera, A.; Snyder, B.E.; Eckel-Mahan, K.L.; Kolonin, M.G. Age-associated telomere attrition in adipocyte progenitors predisposes to metabolic disease. Nat. Metab. 2020, 2, 1482–1497. [Google Scholar] [CrossRef] [PubMed]
- Chen, Y.; Cheng, W.Y.; Shi, H.; Huang, S.; Chen, H.; Liu, D.; Xu, W.; Yu, J.; Wang, J. Classifying gastric cancer using FLORA reveals clinically relevant molecular subtypes and highlights LINC01614 as a biomarker for patient prognosis. Oncogene 2021, 40, 2898–2909. [Google Scholar] [CrossRef] [PubMed]
- Gao, Z.; Santos, R.B.; Rupert, J.; Van Drunen, R.; Yu, Y.; Eckel-Mahan, K.; Kolonin, M.G. Endothelial-specific telomerase inactivation causes telomere-independent cell senescence and multi-organ dysfunction characteristic of aging. Aging Cell 2024, 23, e14138. [Google Scholar] [CrossRef] [PubMed]
- Li, B.; Dewey, C.N. RSEM: Accurate transcript quantification from RNA-Seq data with or without a reference genome. BMC Bioinform. 2011, 12, 323. [Google Scholar] [CrossRef] [PubMed]
- Dobin, A.; Davis, C.A.; Schlesinger, F.; Drenkow, J.; Zaleski, C.; Jha, S.; Batut, P.; Chaisson, M.; Gingeras, T.R. STAR: Ultrafast universal RNA-seq aligner. Bioinformatics 2013, 29, 15–21. [Google Scholar] [CrossRef]
- Love, M.I.; Huber, W.; Anders, S. Moderated estimation of fold change and dispersion for RNA-seq data with DESeq2. Genome Biol. 2014, 15, 550. [Google Scholar] [CrossRef]
- Yu, G.; Wang, L.G.; Han, Y.; He, Q.Y. clusterProfiler: An R package for comparing biological themes among gene clusters. OMICS 2012, 16, 284–287. [Google Scholar] [CrossRef]
- Gao, Z.; Yu, Y.; Eckel-Mahan, K.; Kolonin, M.G. Caloric restriction and telomere preservation in TERT knockout adipocyte progenitors does not rescue mice from metabolic dysfunction due to a TERT function in adipocyte mitochondria. Aging Cell 2025, 24, e14499. [Google Scholar] [CrossRef]
- Rupert, J.; Daquinag, A.; Yu, Y.; Dai, Y.; Zhao, Z.; Kolonin, M.G. Depletion of adipose stroma-like cancer-associated fibroblasts potentiates pancreatic cancer immunotherapy. Cancer Res. Commun. 2025, 5, 5–12. [Google Scholar] [CrossRef]
- Rupert, J.E.; Narasimhan, A.; Jengelley, D.H.A.; Jiang, Y.; Liu, J.; Au, E.; Silverman, L.M.; Sandusky, G.; Bonetto, A.; Cao, S.; et al. Tumor-derived IL-6 and trans-signaling among tumor, fat, and muscle mediate pancreatic cancer cachexia. J. Exp. Med. 2021, 218, e20190450. [Google Scholar] [CrossRef]
- Hingorani, S.R.; Wang, L.; Multani, A.S.; Combs, C.; Deramaudt, T.B.; Hruban, R.H.; Rustgi, A.K.; Chang, S.; Tuveson, D.A. Trp53R172H and KrasG12D cooperate to promote chromosomal instability and widely metastatic pancreatic ductal adenocarcinoma in mice. Cancer Cell 2005, 7, 469–483. [Google Scholar] [CrossRef]
- Mullen, K.M.; Hong, J.; Attiyeh, M.A.; Hayashi, A.; Sakamoto, H.; Kohutek, Z.A.; McIntyre, C.A.; Zhang, H.; Makohon-Moore, A.P.; Zucker, A.; et al. The Evolutionary Forest of Pancreatic Cancer. Cancer Discov. 2025, 15, 329–345. [Google Scholar] [CrossRef]
- David, C.J.; Huang, Y.H.; Chen, M.; Su, J.; Zou, Y.; Bardeesy, N.; Iacobuzio-Donahue, C.A.; Massague, J. TGF-beta Tumor Suppression through a Lethal EMT. Cell 2016, 164, 1015–1030. [Google Scholar] [CrossRef] [PubMed]
- Miyazaki, Y.; Oda, T.; Mori, N.; Kida, Y.S. Adipose-derived mesenchymal stem cells differentiate into pancreatic cancer-associated fibroblasts in vitro. FEBS Open Bio 2020, 10, 2268–2281. [Google Scholar] [CrossRef] [PubMed]
- Yang, M.W.; Tao, L.Y.; Yang, J.Y.; Jiang, Y.S.; Fu, X.L.; Liu, W.; Huo, Y.M.; Li, J.; Zhang, J.F.; Hua, R.; et al. SFRP4 is a prognostic marker and correlated with Treg cell infiltration in pancreatic ductal adenocarcinoma. Am. J. Cancer Res. 2019, 9, 363–377. [Google Scholar]
- Mahdi, T.; Hanzelmann, S.; Salehi, A.; Muhammed, S.J.; Reinbothe, T.M.; Tang, Y.; Axelsson, A.S.; Zhou, Y.; Jing, X.; Almgren, P.; et al. Secreted frizzled-related protein 4 reduces insulin secretion and is overexpressed in type 2 diabetes. Cell Metab. 2012, 16, 625–633. [Google Scholar] [CrossRef] [PubMed]
- Chen, L.J.; Wu, L.; Wang, W.; Zhai, L.L.; Xiang, F.; Li, W.B.; Tang, Z.G. Long non-coding RNA 01614 hyperactivates WNT/β-catenin signaling to promote pancreatic cancer progression by suppressing GSK-3β. Int. J. Oncol. 2022, 61, 116. [Google Scholar] [CrossRef]
- Pickup, M.; Novitskiy, S.; Moses, H.L. The roles of TGFbeta in the tumour microenvironment. Nat. Rev. Cancer 2013, 13, 788–799. [Google Scholar] [CrossRef]
- Tang, D.; Chen, X.; Kang, R.; Kroemer, G. Ferroptosis: Molecular mechanisms and health implications. Cell Res. 2021, 31, 107–125. [Google Scholar] [CrossRef]
- Yan, Z.; Yin, H.; Lin, G. CircDDX42 Accelerates the Development of Pancreatic Cancer via miR-613/ID4/PI3K/AKT Axis. Onco Targets Ther. 2020, 13, 10945–10957. [Google Scholar] [CrossRef]
- Zhang, Y.; Morris, J.P.t.; Yan, W.; Schofield, H.K.; Gurney, A.; Simeone, D.M.; Millar, S.E.; Hoey, T.; Hebrok, M.; Pasca di Magliano, M. Canonical wnt signaling is required for pancreatic carcinogenesis. Cancer Res. 2013, 73, 4909–4922. [Google Scholar] [CrossRef]
- Aguilera, K.Y.; Dawson, D.W. WNT Ligand Dependencies in Pancreatic Cancer. Front. Cell Dev. Biol. 2021, 9, 671022. [Google Scholar] [CrossRef] [PubMed]
- Kawano, Y.; Kypta, R. Secreted antagonists of the Wnt signalling pathway. J. Cell Sci. 2003, 116, 2627–2634. [Google Scholar] [CrossRef] [PubMed]
- Muley, A.; Majumder, S.; Kolluru, G.K.; Parkinson, S.; Viola, H.; Hool, L.; Arfuso, F.; Ganss, R.; Dharmarajan, A.; Chatterjee, S. Secreted frizzled-related protein 4: An angiogenesis inhibitor. Am. J. Pathol. 2010, 176, 1505–1516. [Google Scholar] [CrossRef]
- Jhe, Y.L.; Lee, S.; Jung, Y.; Cheong, J.H. PKA-Mediated Phosphorylation of SFRP4 Promotes Wnt/beta-Catenin Activation and Cancer Stemness in Gastric Cancer. Int. J. Mol. Sci. 2025, 26, 5572. [Google Scholar] [CrossRef] [PubMed]
- Li, H.; Zhao, J.; Sun, J.; Tian, C.; Jiang, Q.; Ding, C.; Gan, Q.; Shu, P.; Wang, X.; Qin, J.; et al. Demethylation of the SFRP4 Promoter Drives Gastric Cancer Progression via the Wnt Pathway. Mol. Cancer Res. 2021, 19, 1454–1464. [Google Scholar] [CrossRef]
- Jiang, H.; Li, Q.; He, C.; Li, F.; Sheng, H.; Shen, X.; Zhang, X.; Zhu, S.; Chen, H.; Chen, X.; et al. Activation of the Wnt pathway through Wnt2 promotes metastasis in pancreatic cancer. Am. J. Cancer Res. 2014, 4, 537–544. [Google Scholar]
- Dzialo, E.; Tkacz, K.; Blyszczuk, P. Crosstalk between the TGF-beta and WNT signalling pathways during cardiac fibrogenesis. Acta Biochim. Pol. 2018, 65, 341–349. [Google Scholar] [CrossRef]
- Ram Makena, M.; Gatla, H.; Verlekar, D.; Sukhavasi, S.; K. Pandey, M.; C. Pramanik, K. Wnt/beta-Catenin Signaling: The Culprit in Pancreatic Carcinogenesis and Therapeutic Resistance. Int. J. Mol. Sci. 2019, 20, 4242. [Google Scholar] [CrossRef]
- Xu, L.; Cui, W.H.; Zhou, W.C.; Li, D.L.; Li, L.C.; Zhao, P.; Mo, X.T.; Zhang, Z.; Gao, J. Activation of Wnt/beta-catenin signalling is required for TGF-beta/Smad2/3 signalling during myofibroblast proliferation. J. Cell. Mol. Med. 2017, 21, 1545–1554. [Google Scholar] [CrossRef]
- Schniewind, B.; Groth, S.; Sebens Muerkoster, S.; Sipos, B.; Schafer, H.; Kalthoff, H.; Fandrich, F.; Ungefroren, H. Dissecting the role of TGF-beta type I receptor/ALK5 in pancreatic ductal adenocarcinoma: Smad activation is crucial for both the tumor suppressive and prometastatic function. Oncogene 2007, 26, 4850–4862. [Google Scholar] [CrossRef]
- Principe, D.R.; DeCant, B.; Mascarinas, E.; Wayne, E.A.; Diaz, A.M.; Akagi, N.; Hwang, R.; Pasche, B.; Dawson, D.W.; Fang, D.; et al. TGFbeta Signaling in the Pancreatic Tumor Microenvironment Promotes Fibrosis and Immune Evasion to Facilitate Tumorigenesis. Cancer Res. 2016, 76, 2525–2539. [Google Scholar] [CrossRef] [PubMed]
- Wang, H.; Zhou, H.; Ni, H.; Shen, X. COL11A1-Driven Epithelial-Mesenchymal Transition and Stemness of Pancreatic Cancer Cells Induce Cell Migration and Invasion by Modulating the AKT/GSK-3beta/Snail Pathway. Biomolecules 2022, 12, 391. [Google Scholar] [CrossRef] [PubMed]
- Nallanthighal, S.; Heiserman, J.P.; Cheon, D.J. Collagen Type XI Alpha 1 (COL11A1): A Novel Biomarker and a Key Player in Cancer. Cancers 2021, 13, 935. [Google Scholar] [CrossRef]
- Zhao, M.; Mishra, L.; Deng, C.X. The role of TGF-beta/SMAD4 signaling in cancer. Int. J. Biol. Sci. 2018, 14, 111–123. [Google Scholar] [CrossRef]
- Abel, E.V.; Goto, M.; Magnuson, B.; Abraham, S.; Ramanathan, N.; Hotaling, E.; Alaniz, A.A.; Kumar-Sinha, C.; Dziubinski, M.L.; Urs, S.; et al. HNF1A is a novel oncogene that regulates human pancreatic cancer stem cell properties. eLife 2018, 7, e33947. [Google Scholar] [CrossRef]
- Ohkuma, R.; Yada, E.; Ishikawa, S.; Komura, D.; Ishizaki, H.; Tamada, K.; Kubota, Y.; Hamada, K.; Ishida, H.; Hirasawa, Y.; et al. High expression of olfactomedin-4 is correlated with chemoresistance and poor prognosis in pancreatic cancer. PLoS ONE 2020, 15, e0226707. [Google Scholar] [CrossRef]
- Steele, N.G.; Biffi, G.; Kemp, S.B.; Zhang, Y.; Drouillard, D.; Syu, L.; Hao, Y.; Oni, T.E.; Brosnan, E.; Elyada, E.; et al. Inhibition of Hedgehog Signaling Alters Fibroblast Composition in Pancreatic Cancer. Clin. Cancer Res. 2021, 27, 2023–2037. [Google Scholar] [CrossRef]
- Yan, J.; Li, J.; Hu, J.; Zhang, L.; Wei, C.; Sultana, N.; Cai, X.; Zhang, W.; Cai, C.L. Smad4 deficiency impairs chondrocyte hypertrophy via the Runx2 transcription factor in mouse skeletal development. J. Biol. Chem. 2018, 293, 9162–9175. [Google Scholar] [CrossRef] [PubMed]
- Vera, R.E.; Lamberti, M.J.; Almada, L.L.; Tolosa, E.J.; Vrabel, A.M.; Sigafoos, A.N.; Toruner, M.D.; Flores, L.F.; Rivarola, V.A.; Rumie Vittar, N.B.; et al. GLI1 interaction with p300 modulates SDF1 expression in cancer-associated fibroblasts to promote pancreatic cancer cells migration. Biochem. J. 2023, 480, 225–241. [Google Scholar] [CrossRef]
- Rosel, D.; Fernandes, M.; Sanz-Moreno, V.; Brabek, J. Migrastatics: Redirecting R&D in Solid Cancer Towards Metastasis? Trends Cancer 2019, 5, 755–756. [Google Scholar] [CrossRef]
- Raudenska, M.; Petrlakova, K.; Jurinakova, T.; Leischner Fialova, J.; Fojtu, M.; Jakubek, M.; Rosel, D.; Brabek, J.; Masarik, M. Engine shutdown: Migrastatic strategies and prevention of metastases. Trends Cancer 2023, 9, 293–308. [Google Scholar] [CrossRef] [PubMed]


Disclaimer/Publisher’s Note: The statements, opinions and data contained in all publications are solely those of the individual author(s) and contributor(s) and not of MDPI and/or the editor(s). MDPI and/or the editor(s) disclaim responsibility for any injury to people or property resulting from any ideas, methods, instructions or products referred to in the content. |
© 2026 by the authors. Licensee MDPI, Basel, Switzerland. This article is an open access article distributed under the terms and conditions of the Creative Commons Attribution (CC BY) license.