
Simultaneous Inhibition of Ceramide Hydrolysis and Glycosylation Synergizes to Corrupt Mitochondrial Respiration and Signal Caspase Driven Cell Death in Drug-Resistant Acute Myeloid Leukemia
 , , , , , ,
  , and
, and 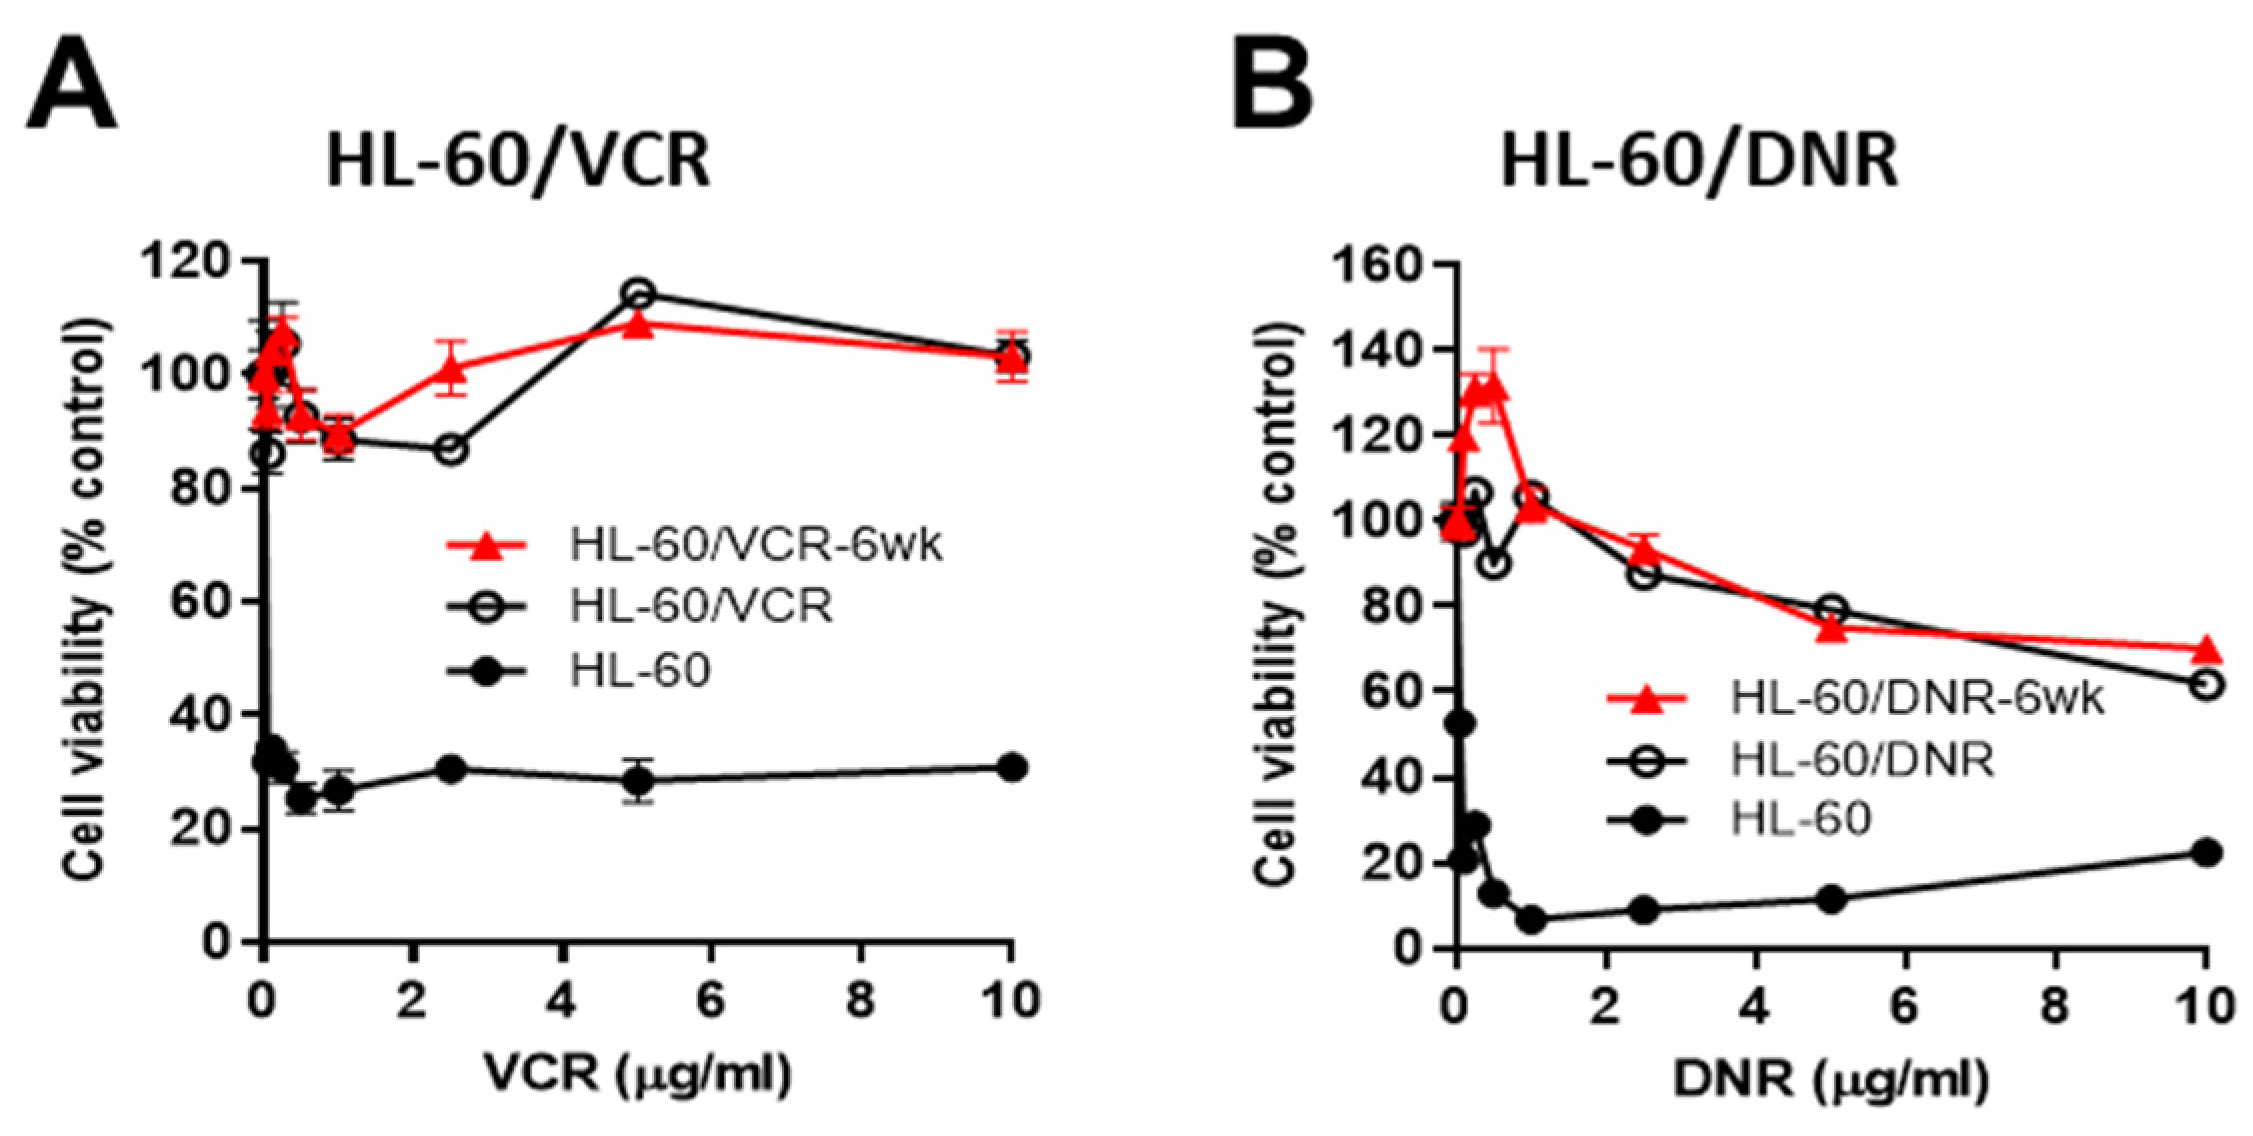
Abstract
Simple Summary
Abstract
1. Introduction
2. Materials and Methods
2.1. Materials
2.2. Cell Culture, AML Cell Lines, and Establishment of Daunorubicin Resistant HL-60 Cells
2.3. Cell Viability Assays
2.4. AML Patient Samples and Patient Cell Viability Assay
2.5. Mass Spectrometry
2.6. Cellular Respirometry
2.7. Immunoblotting
2.8. Rhodamine Assay
2.9. Flow Cytometry
2.10. Tumor Xenograft Model
2.11. Statistical Analysis
3. Results
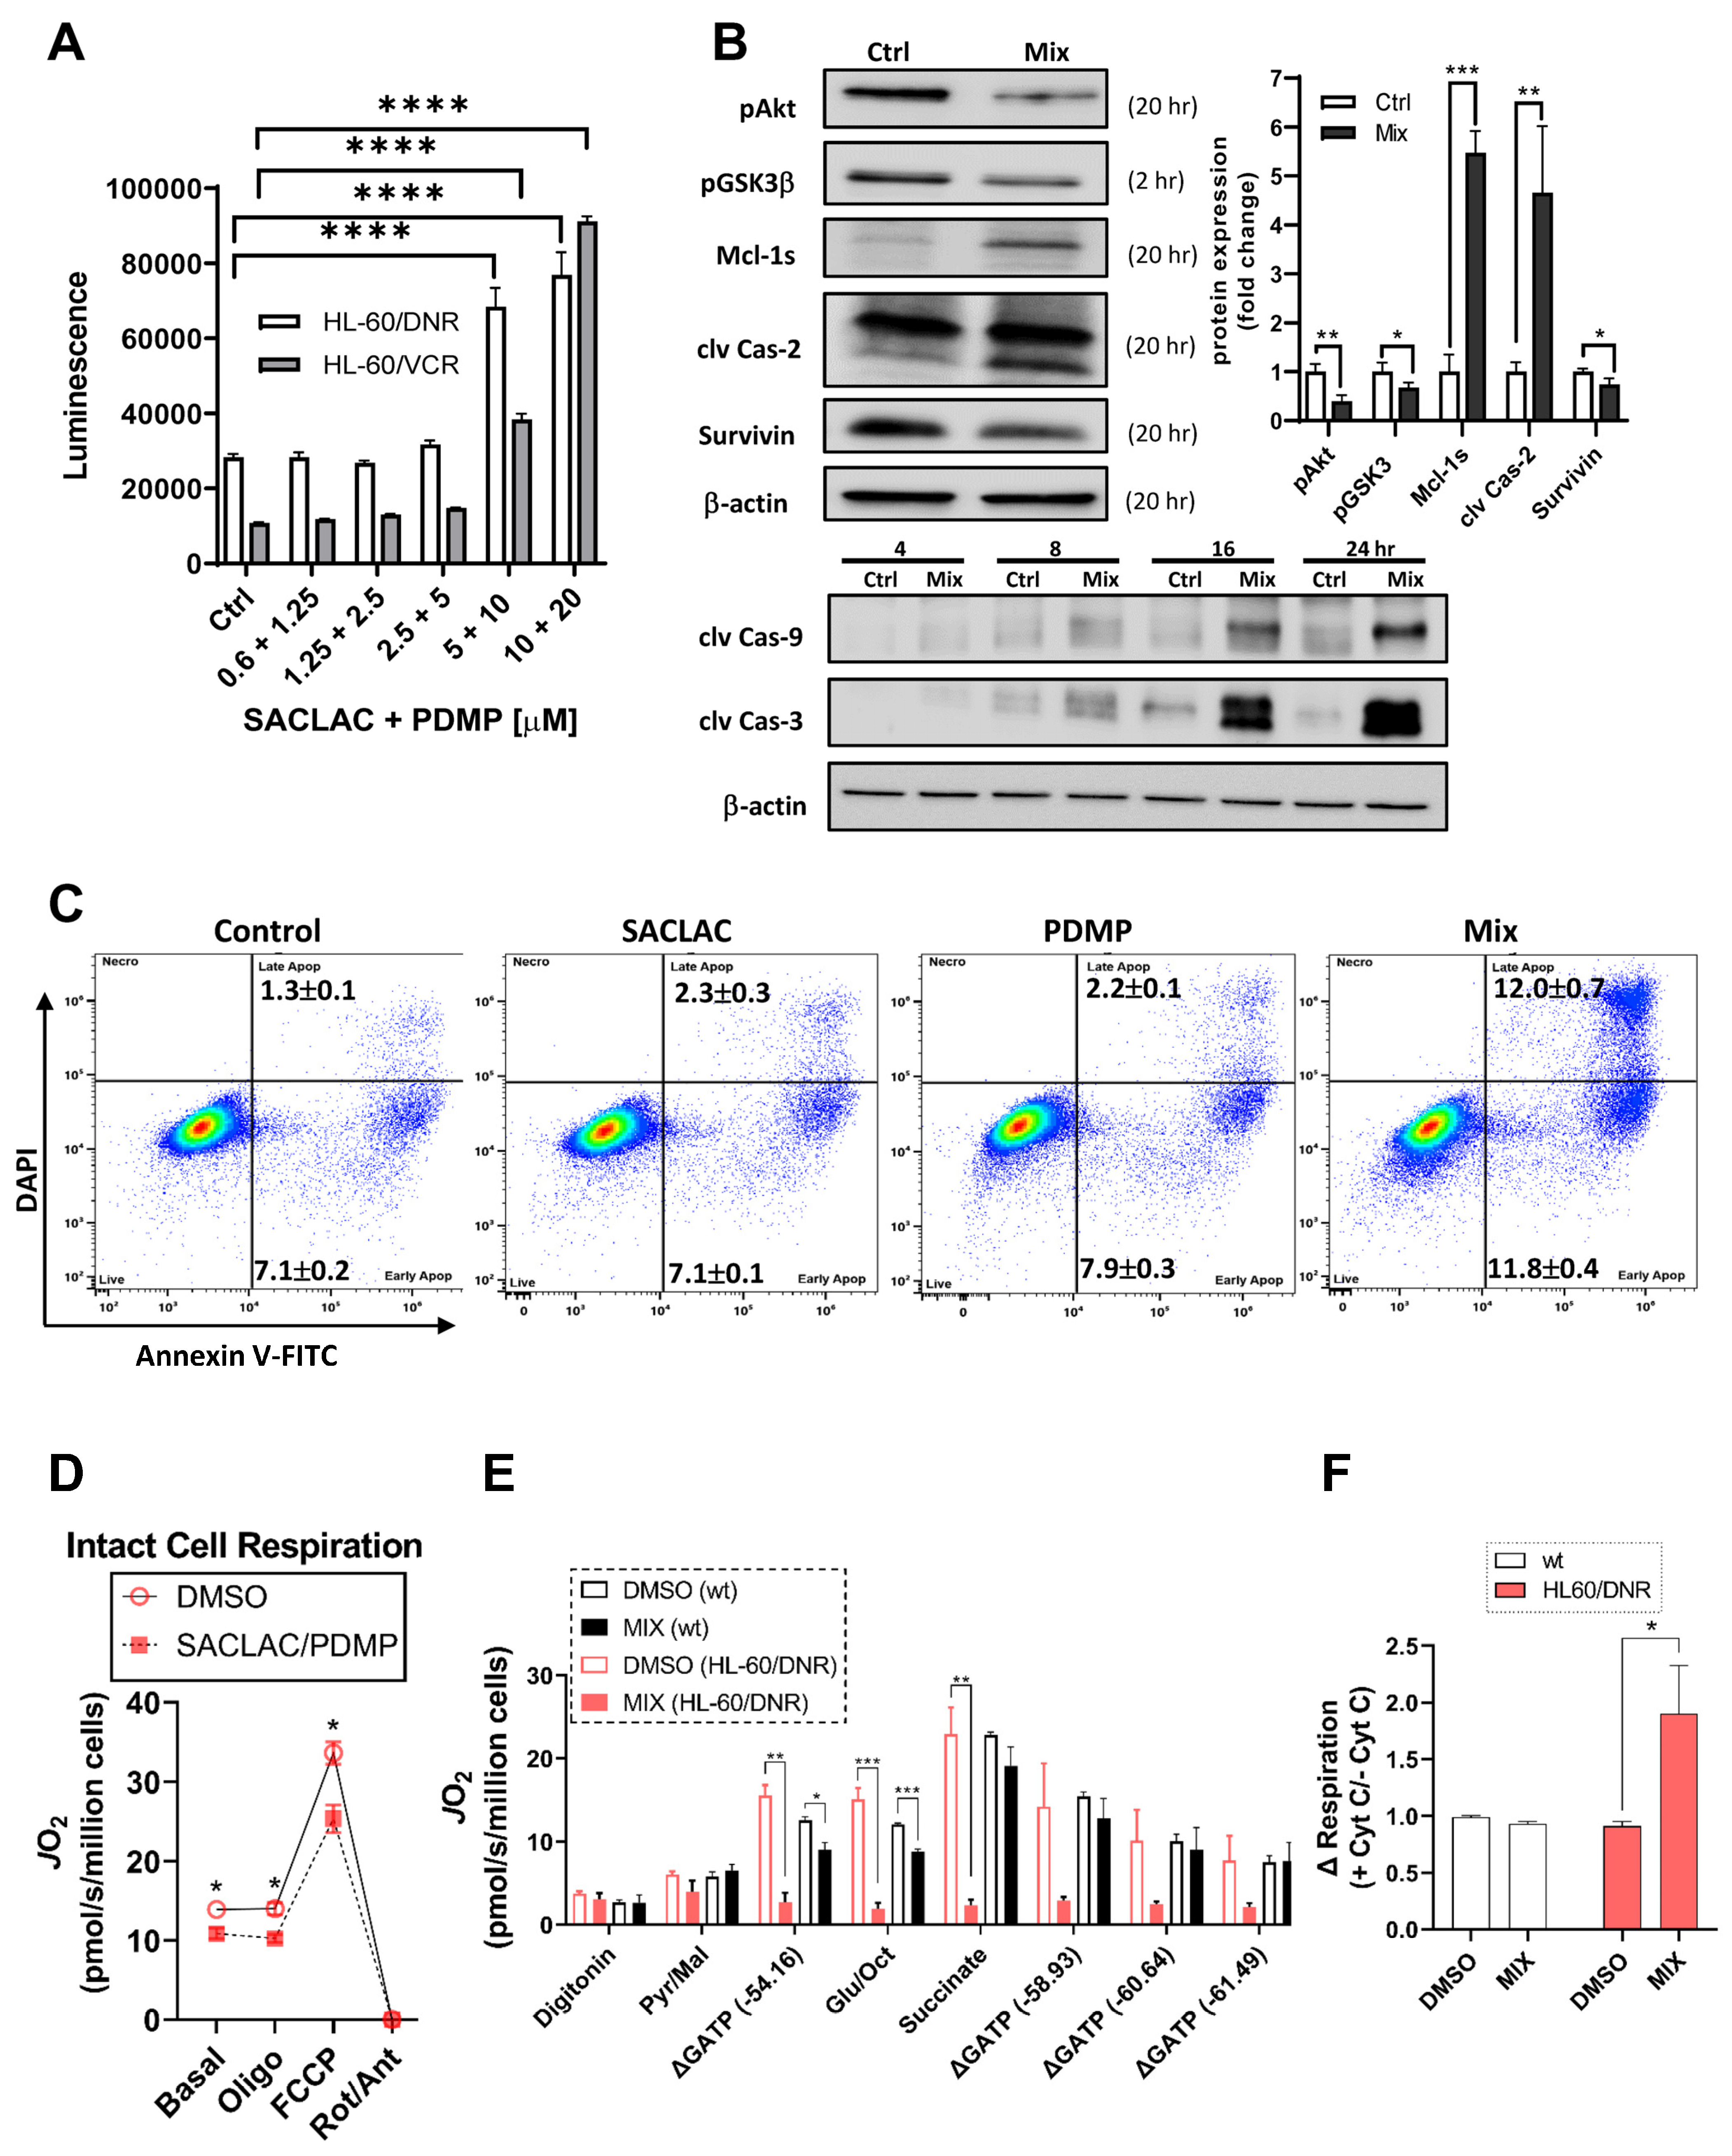
3.1. Response to Chemotherapy Challenge in HL-60 Wild-Type and in Drug-Resistant VCR- and DNR-Selected Counterparts
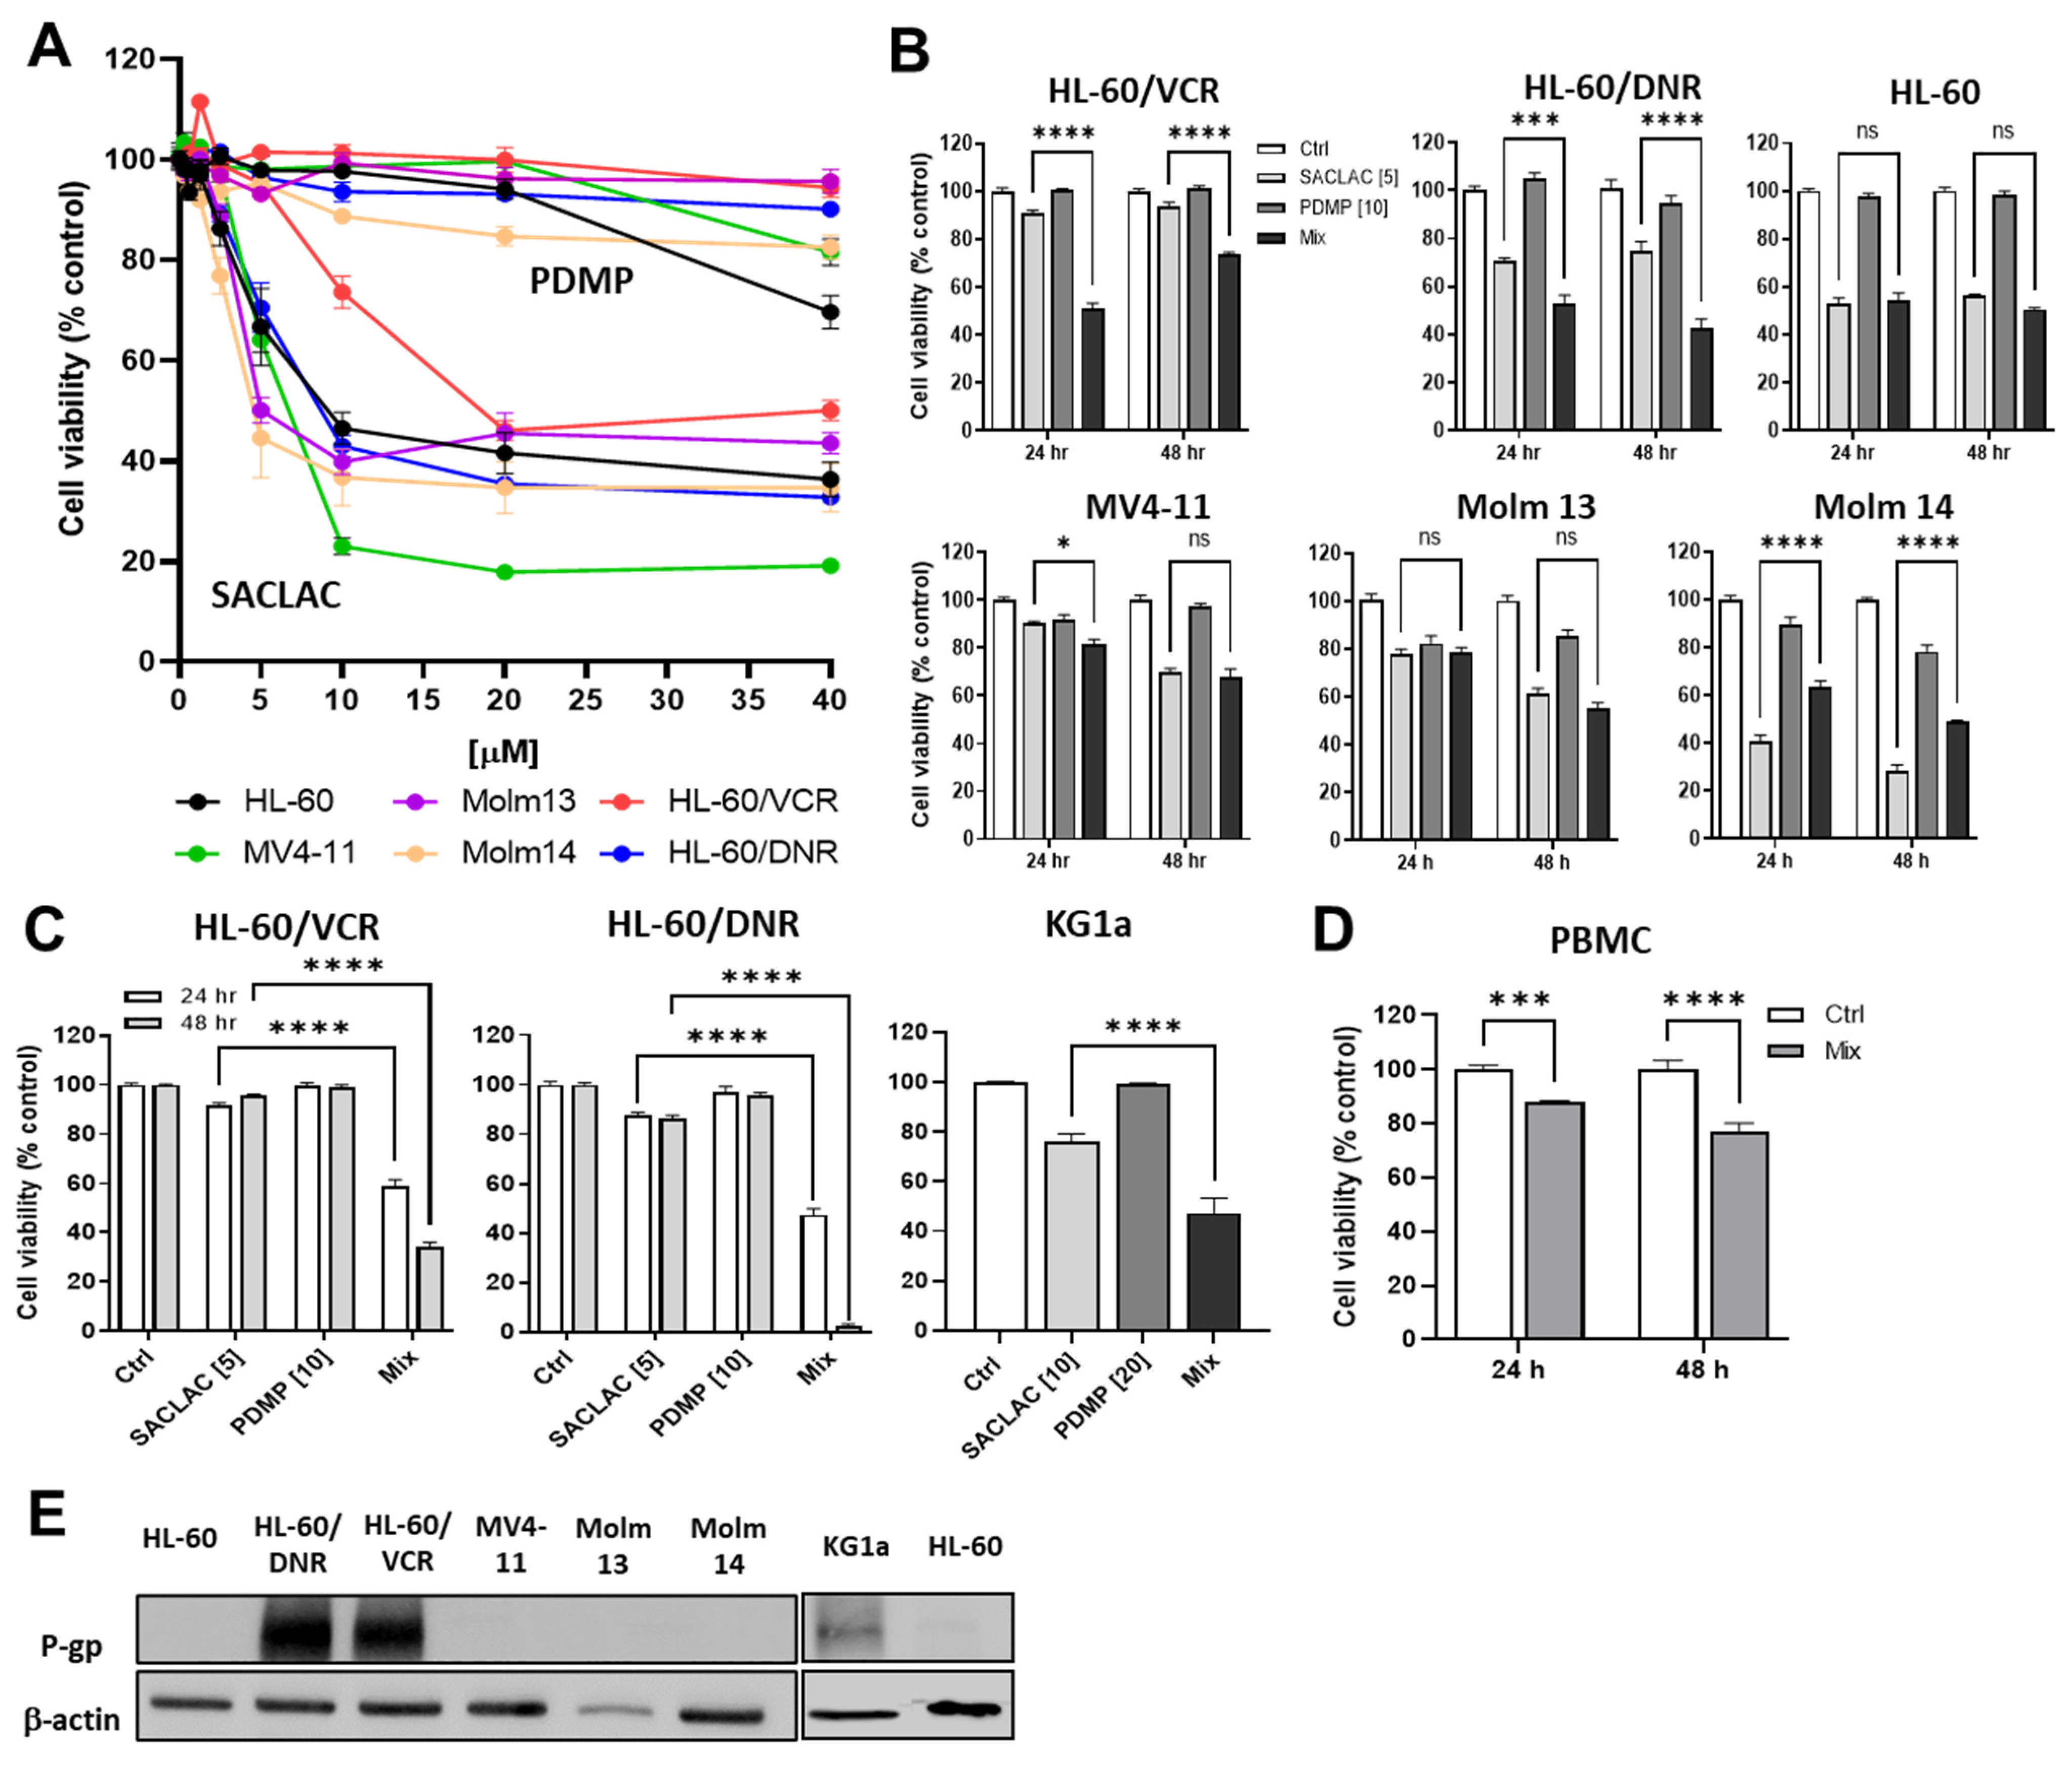
3.2. Impact of SACLAC, D-threo-PDMP, and Mix on Viability in Drug-Resistant and Wild-Type Human AML Cell Lines
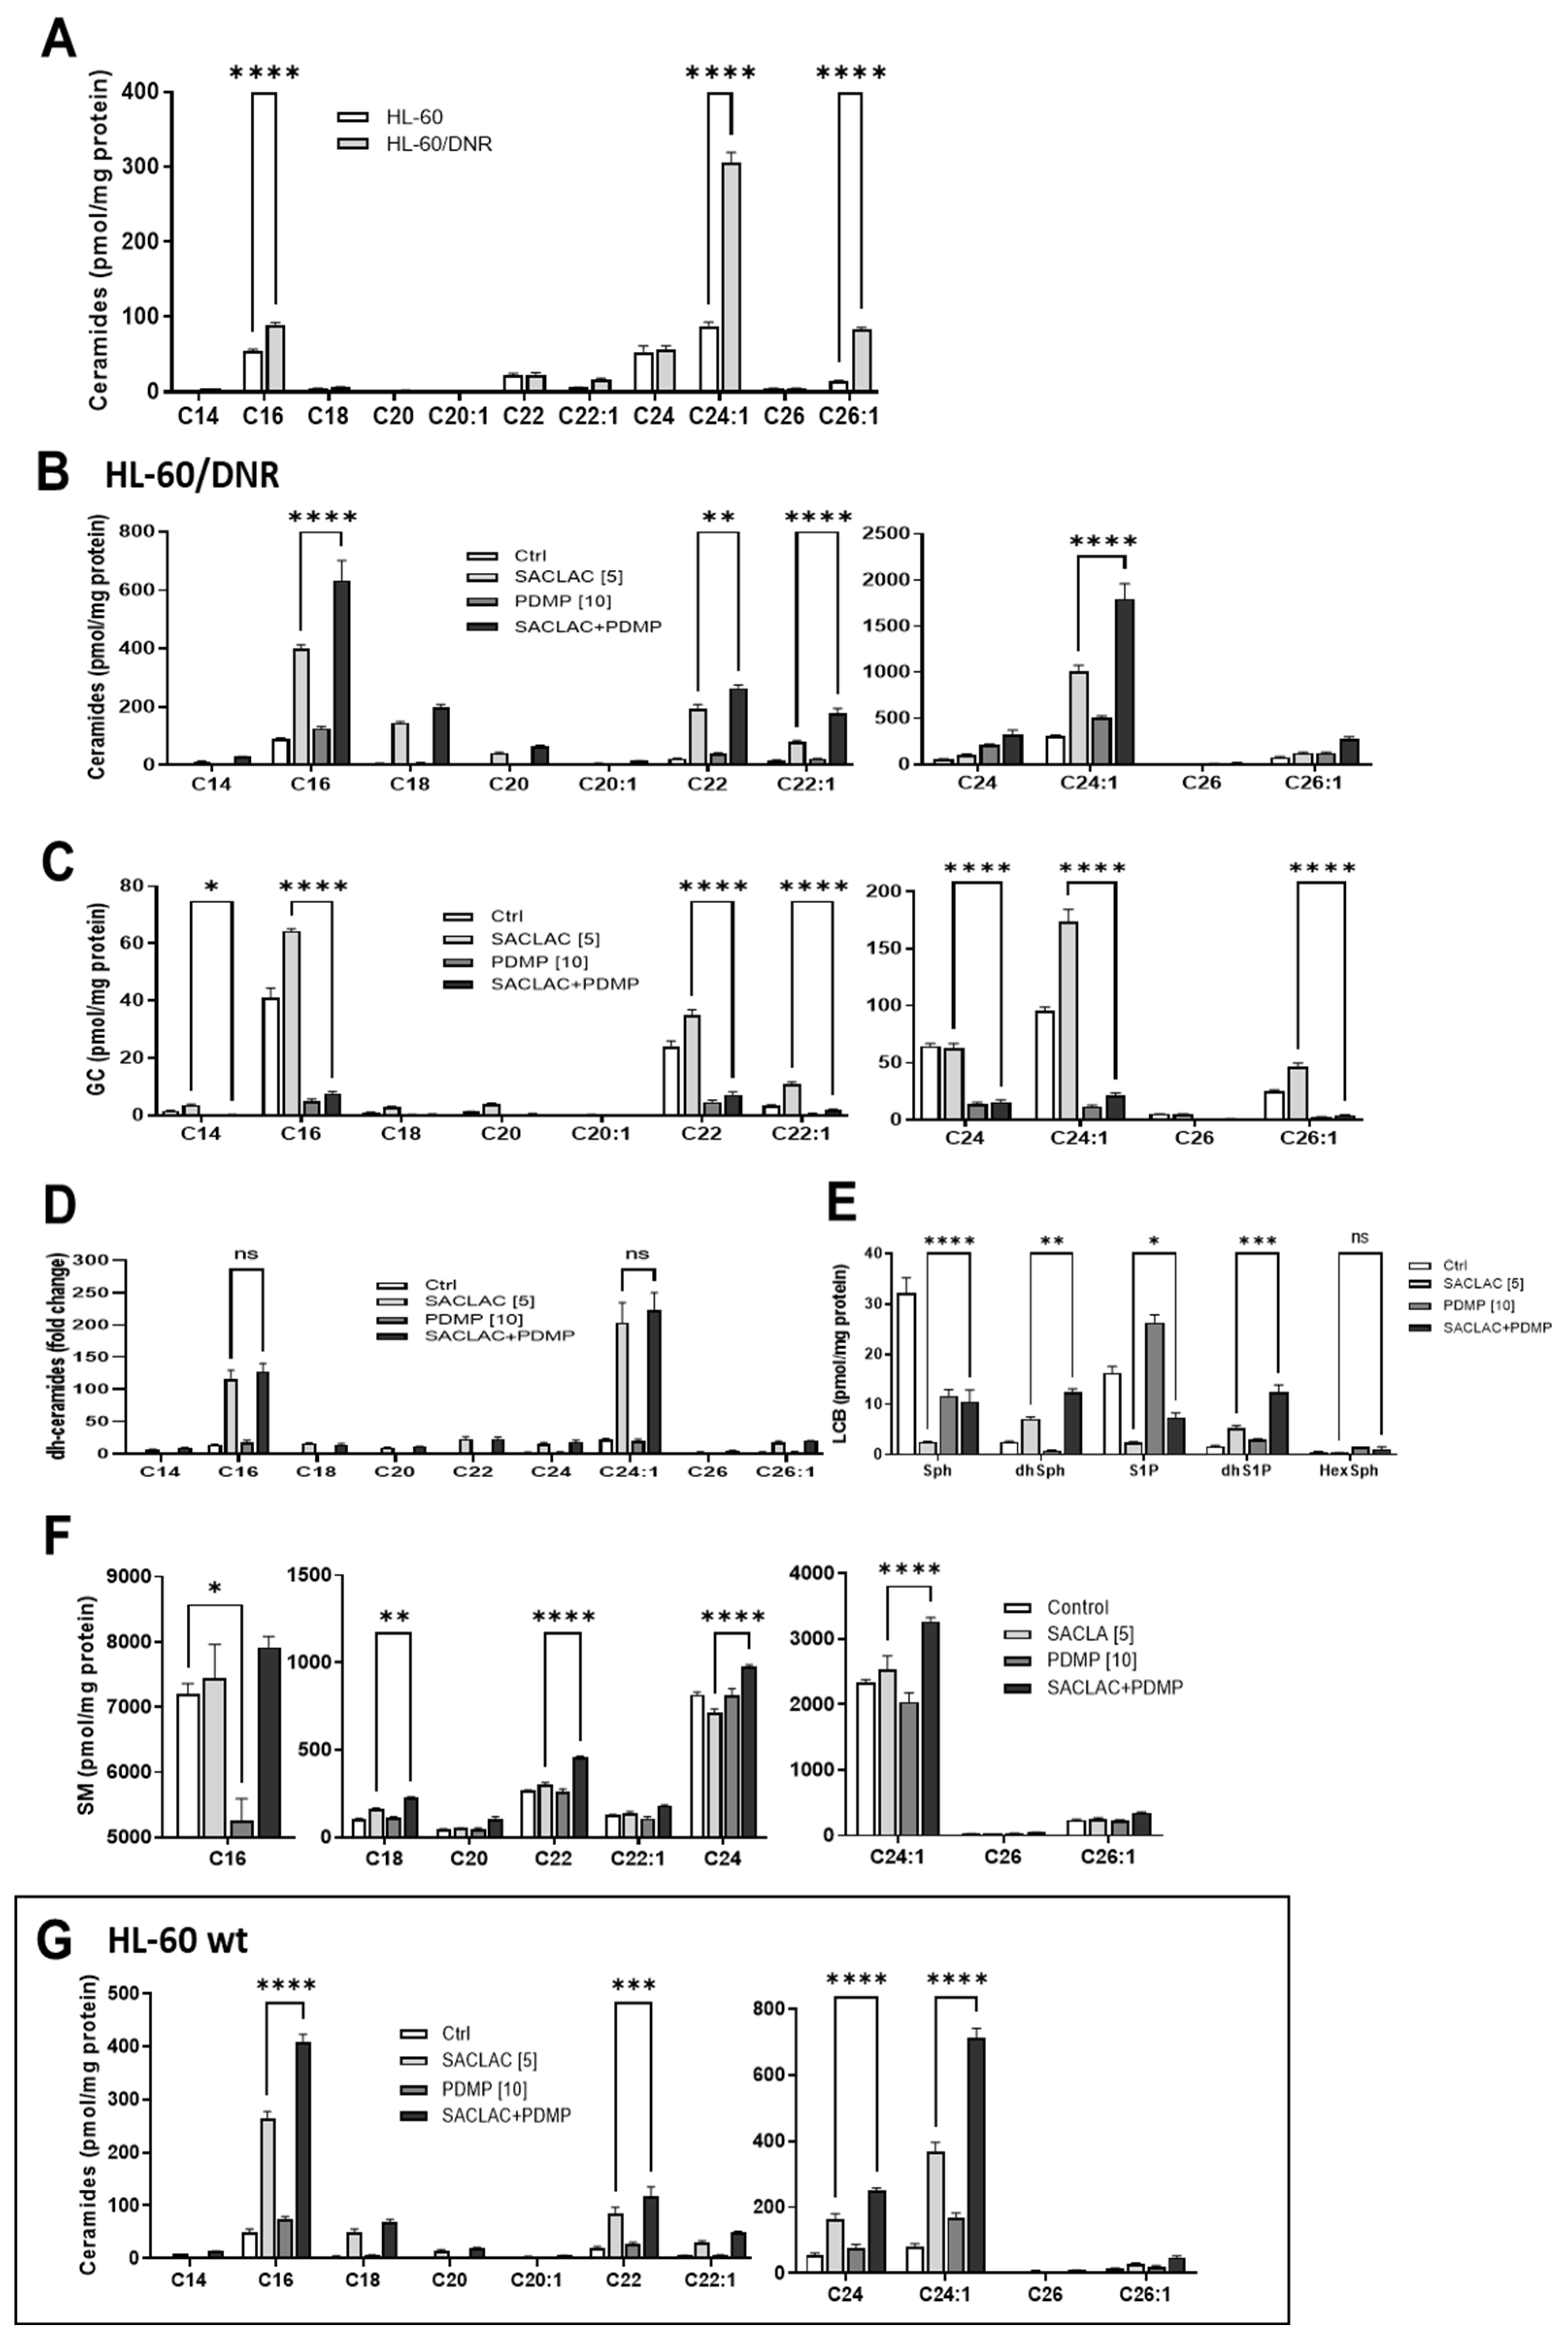
3.3. Lipidomics—Impact of SACLAC and D-threo-PDMP on Sphingolipid Profiles, a Recipe for Cytotoxicity
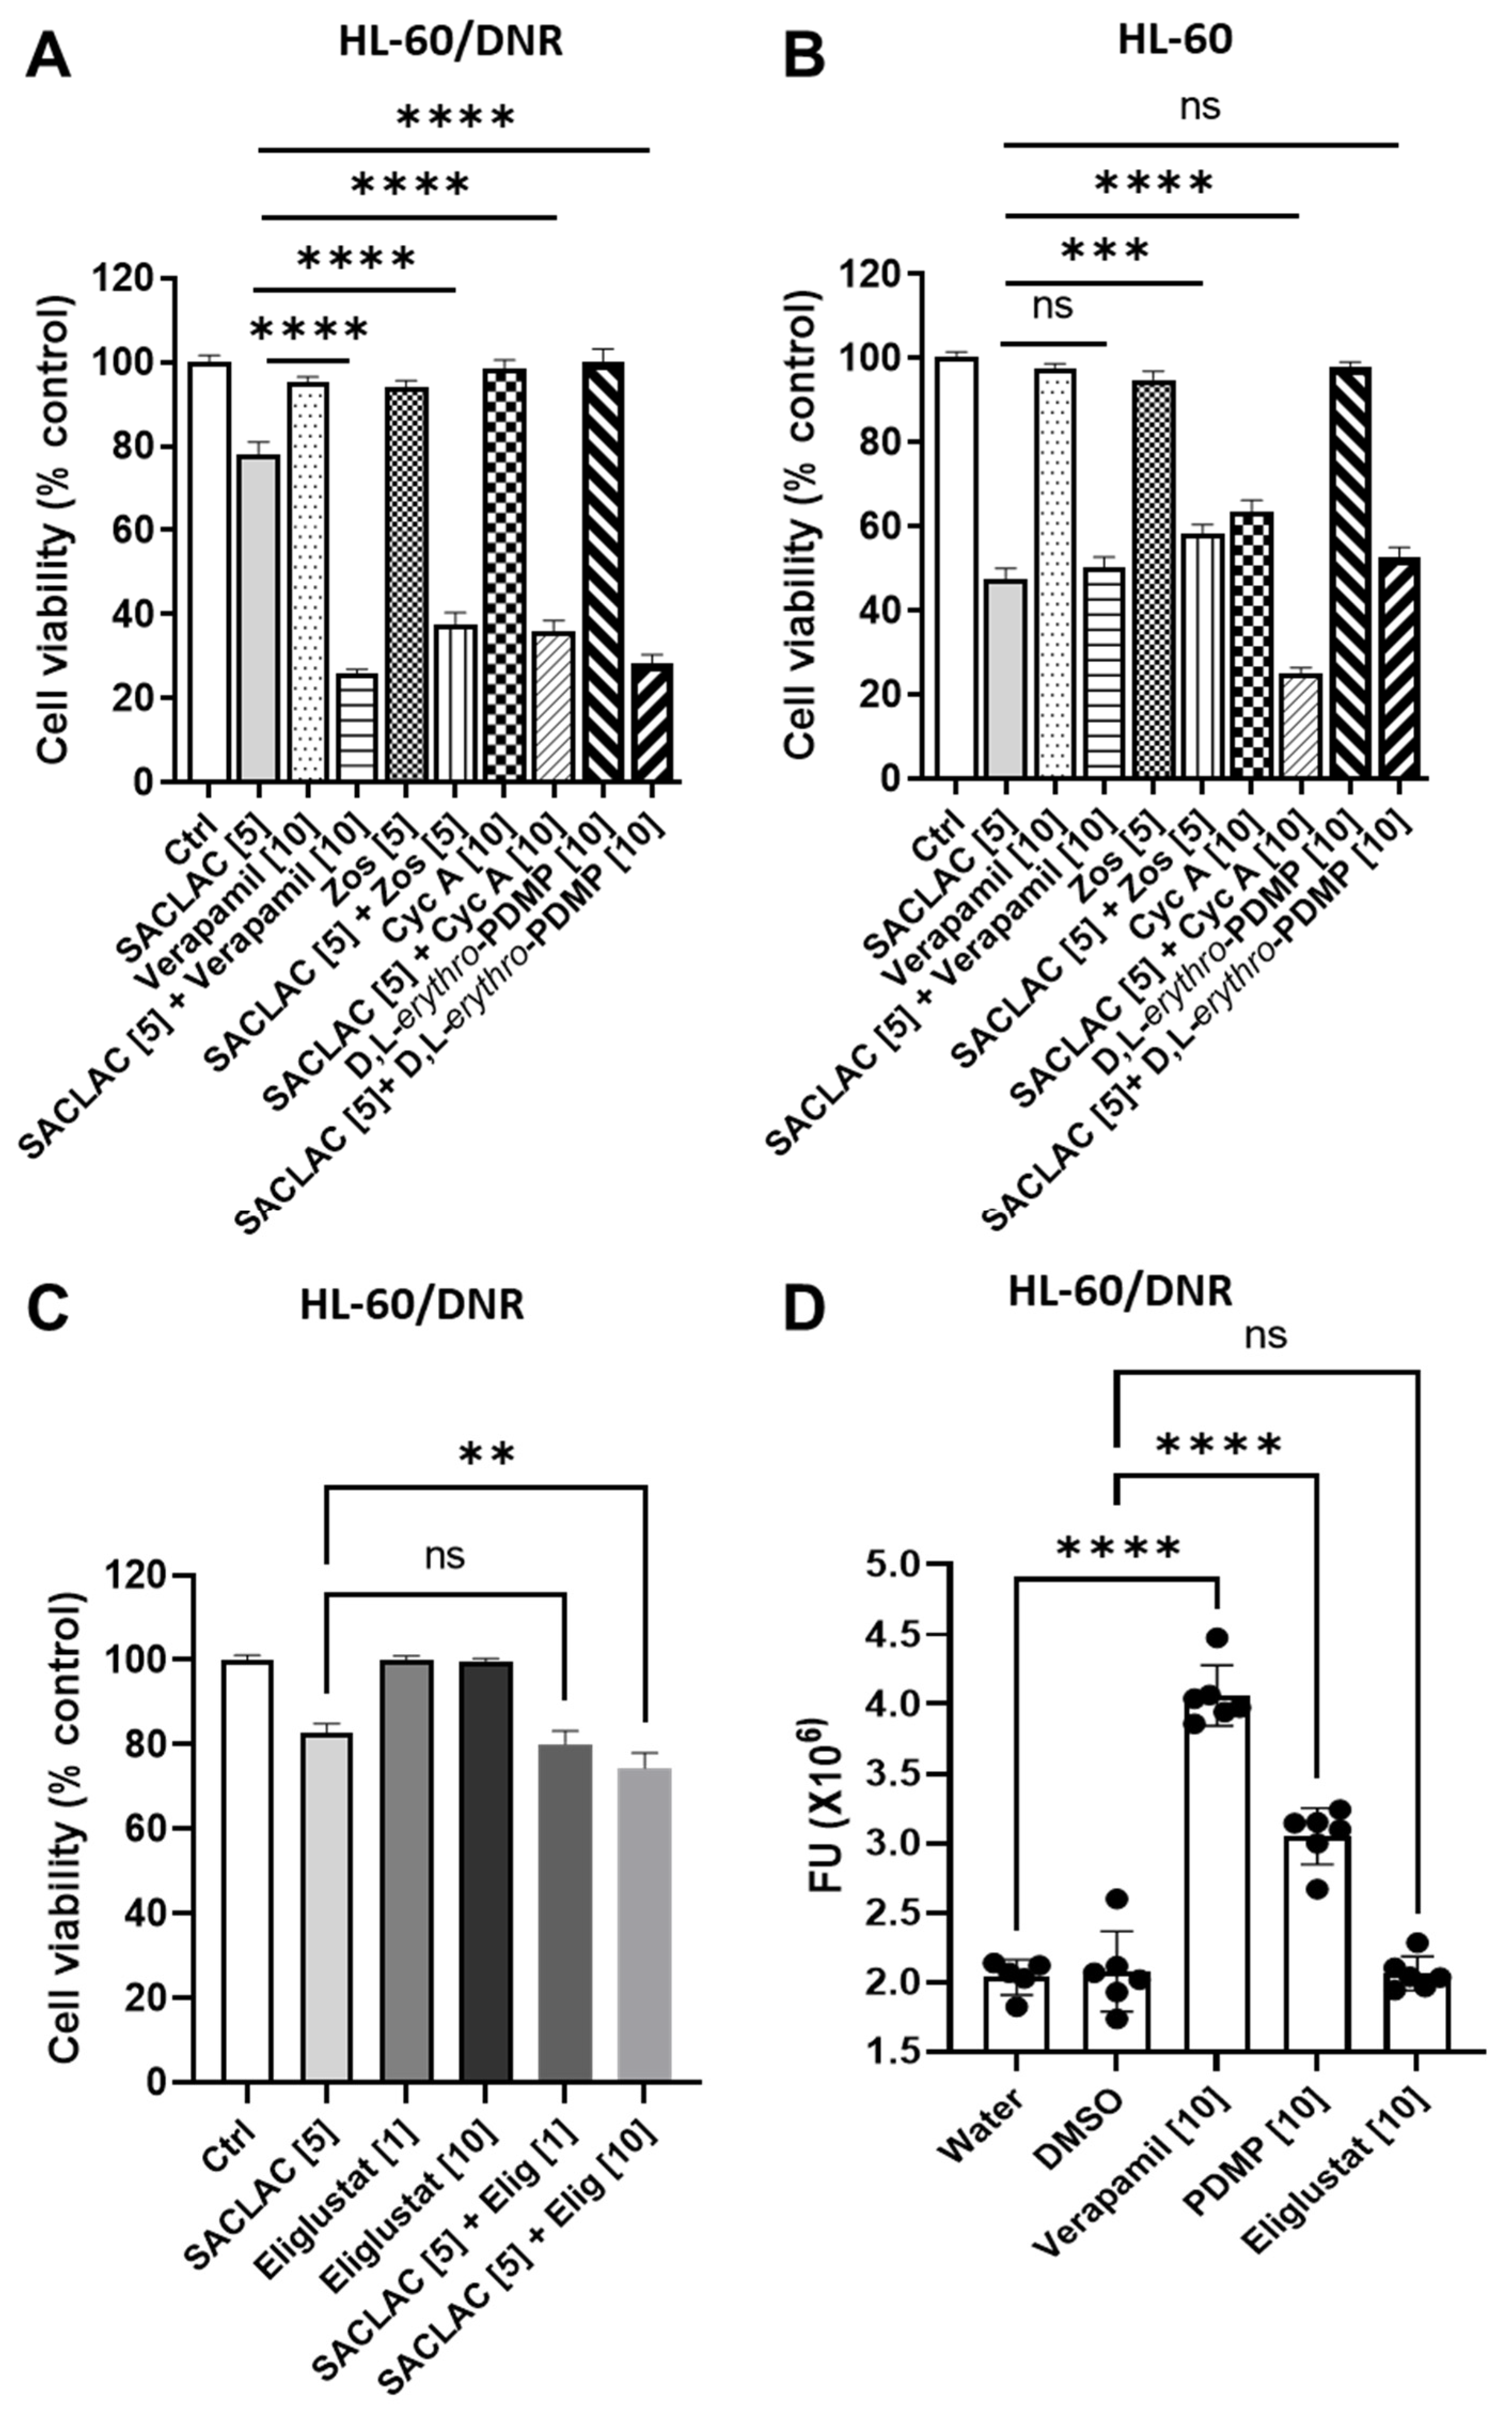
3.4. Dissecting the Role of P-gp in Manipulating Ceramide Metabolism in the SACLAC D-threo-PDMP Regimen
3.5. Mechanisms Underlying Cytotoxicity—Signaling Events and Mitochondrial Perturbation
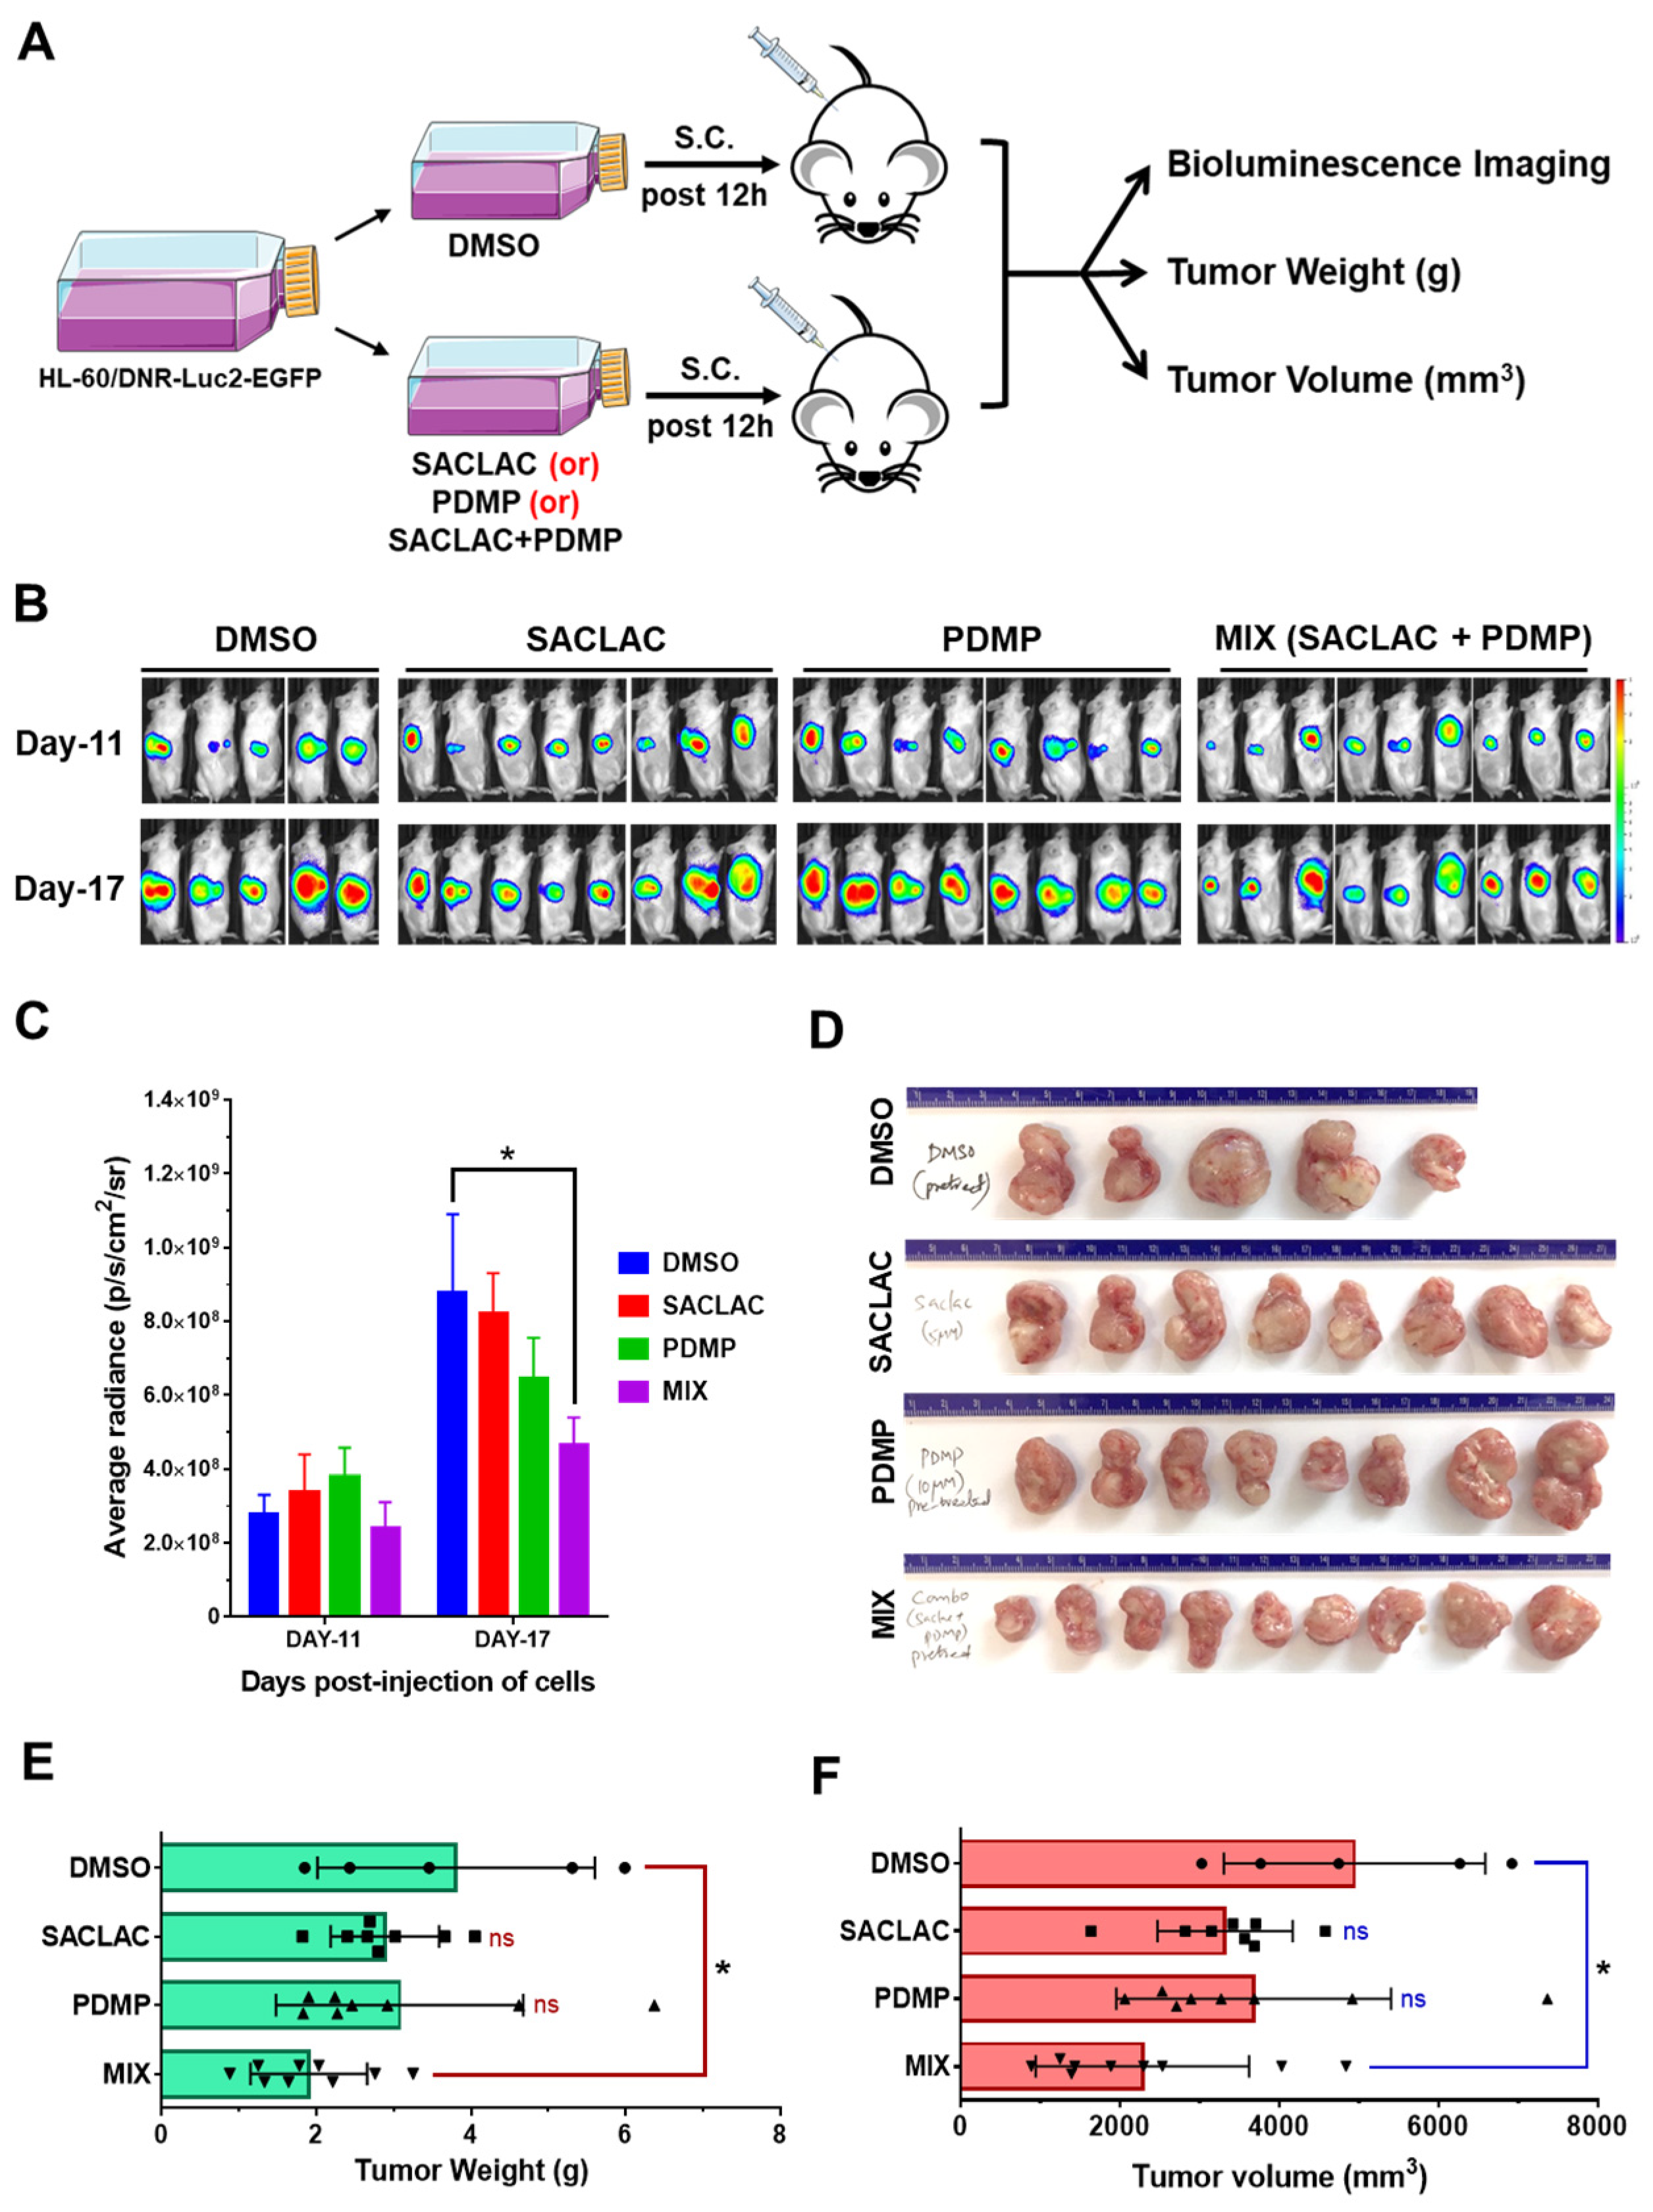
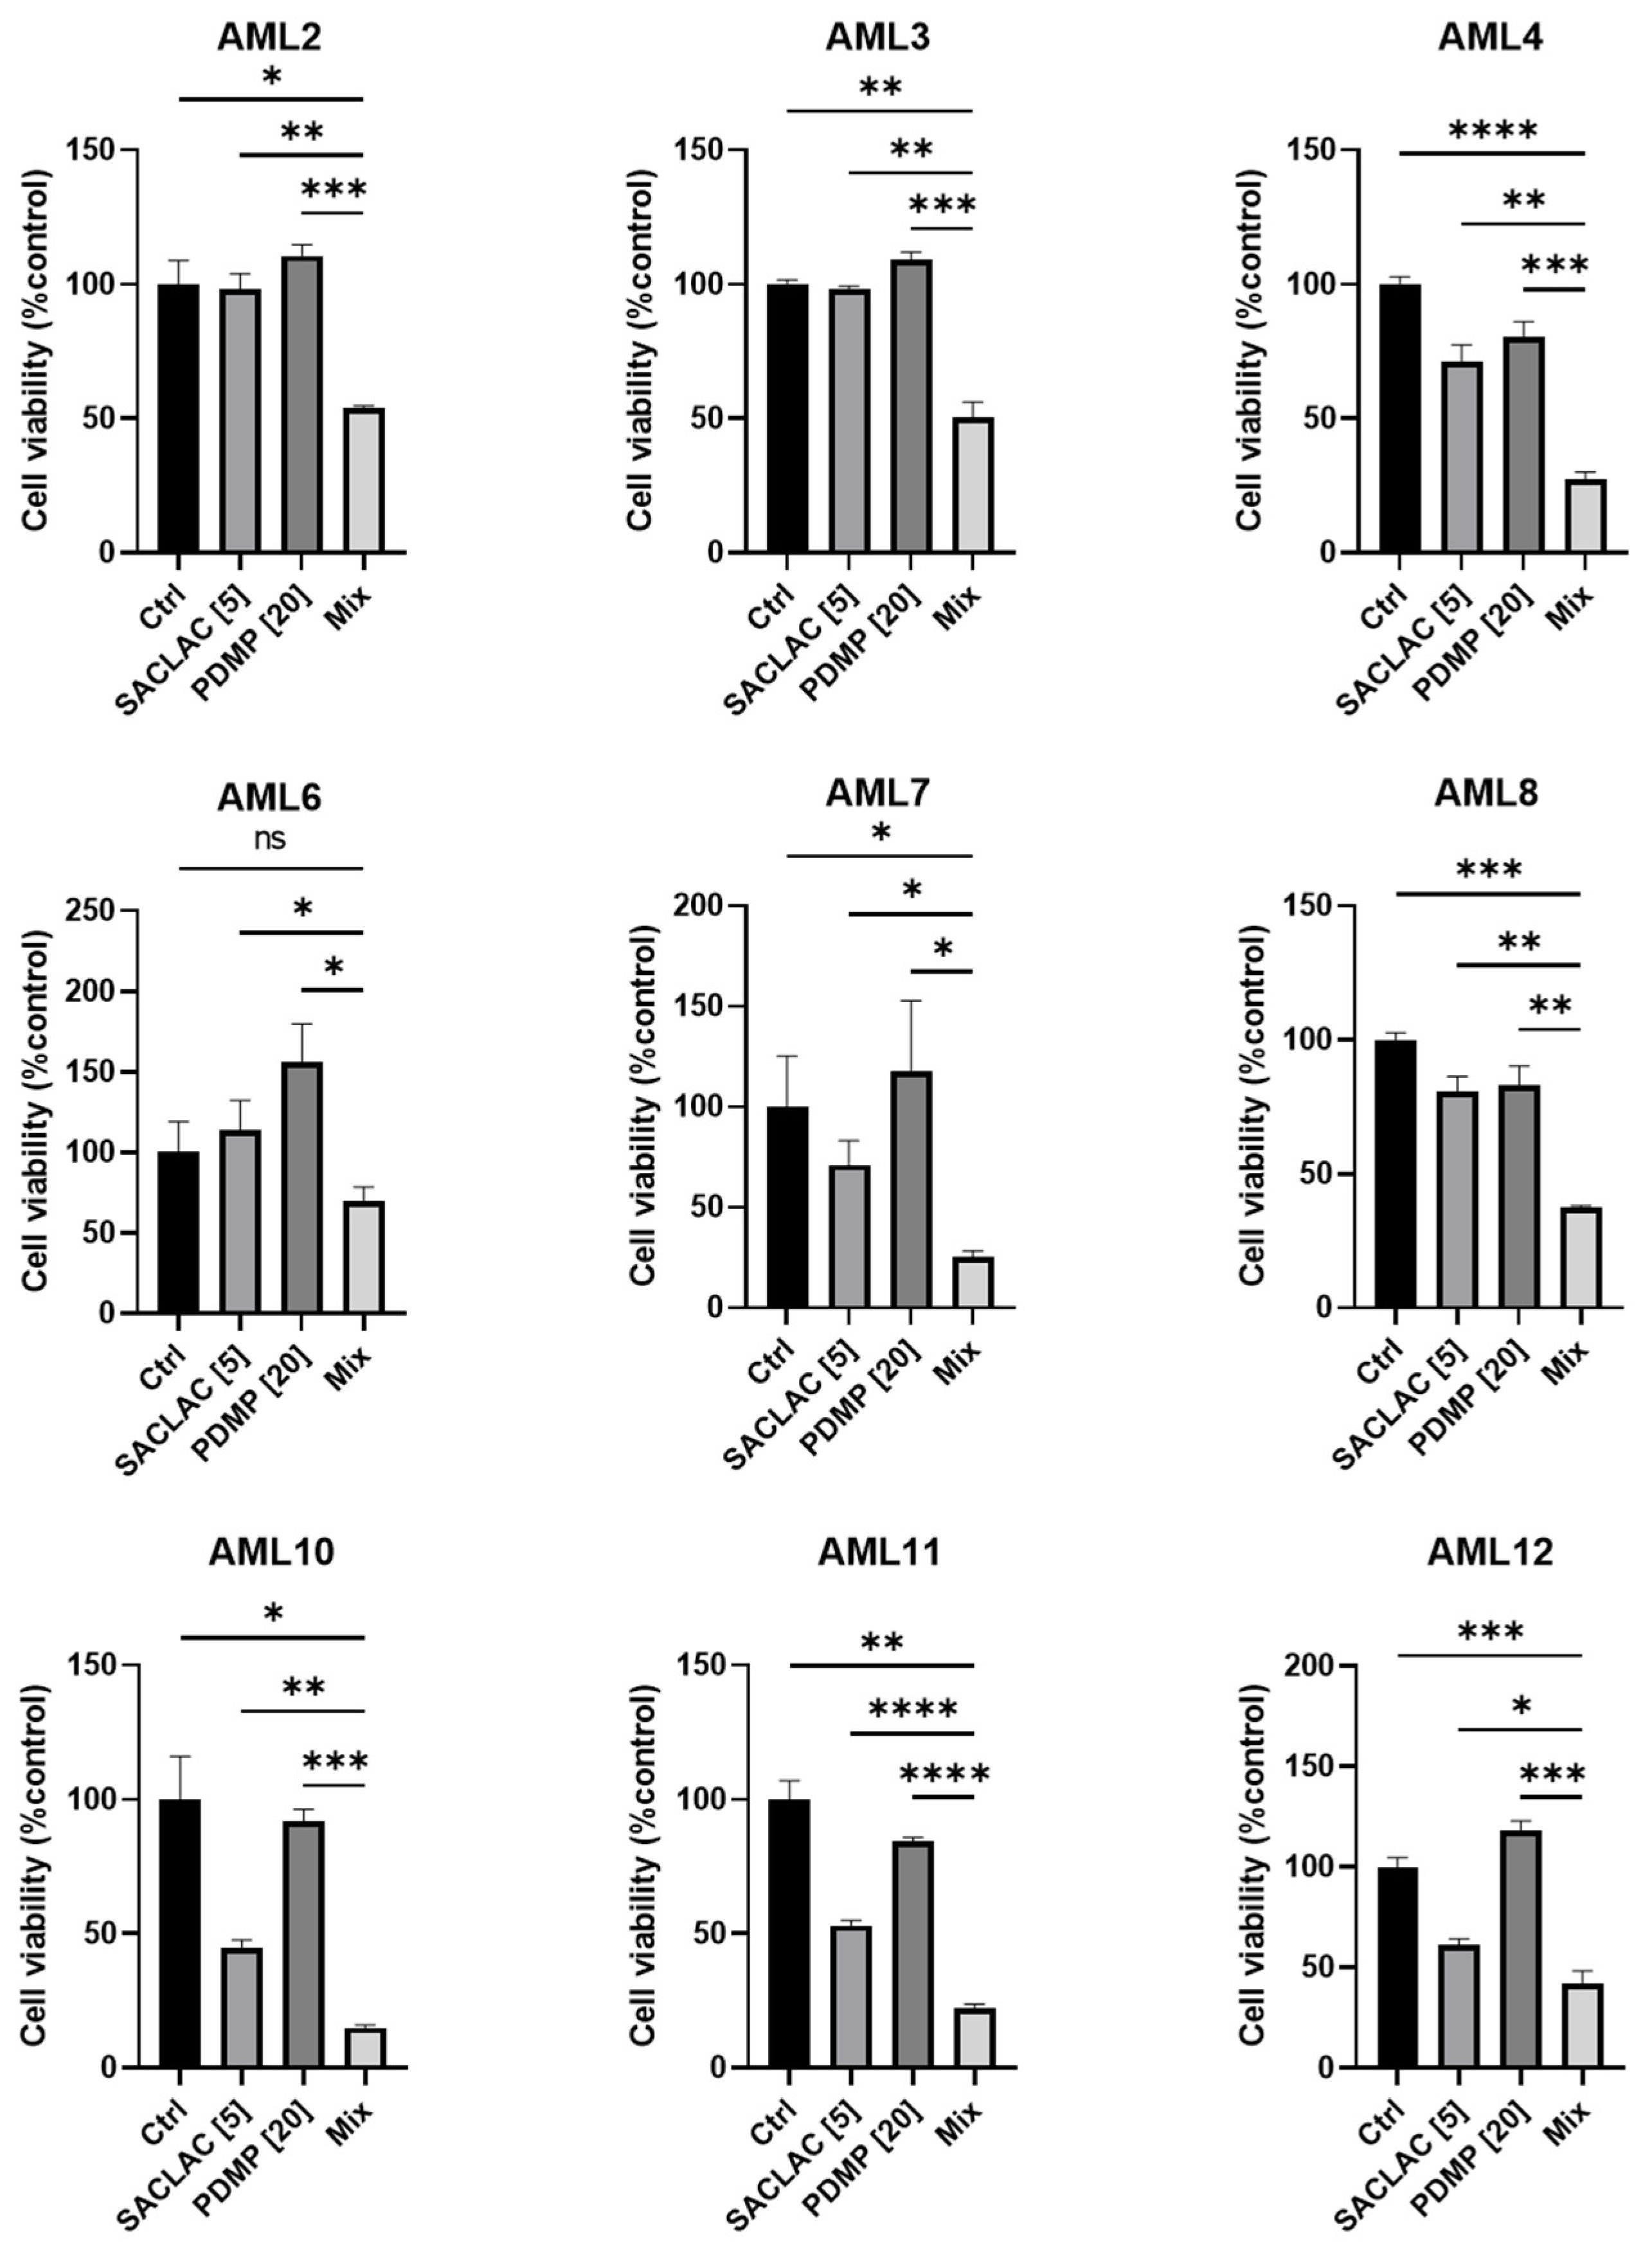
3.6. In Vivo Efficacy in an Animal Model and Activity in Patient-Derived AML Cells
4. Discussion
5. Conclusions
Supplementary Materials
Author Contributions
Funding
Institutional Review Board Statement
Informed Consent Statement
Data Availability Statement
Conflicts of Interest
Abbreviations
References
- Bose, P.; Gandhi, V.; Konopleva, M. Pathways and mechanisms of venetoclax resistance. Leuk. Lymphoma 2017, 58, 2026–2039. [Google Scholar] [CrossRef] [PubMed]
- Gottesman, M.M.; Lavi, O.; Hall, M.D.; Gillet, J.P. Toward a Better Understanding of the Complexity of Cancer Drug Resistance. Annu. Rev. Pharmacol. Toxicol. 2016, 56, 85–102. [Google Scholar] [CrossRef] [PubMed]
- Shaffer, B.C.; Gillet, J.P.; Patel, C.; Baer, M.R.; Bates, S.E.; Gottesman, M.M. Drug resistance: Still a daunting challenge to the successful treatment of AML. Drug Resist. Updat. Rev. Comment. Antimicrob. Anticancer Chemother. 2012, 15, 62–69. [Google Scholar] [CrossRef]
- Liu, B.; Li, L.J.; Gong, X.; Zhang, W.; Zhang, H.; Zhao, L. Co-expression of ATP binding cassette transporters is associated with poor prognosis in acute myeloid leukemia. Oncol. Lett. 2018, 15, 6671–6677. [Google Scholar] [CrossRef] [PubMed]
- Kao, L.P.; Morad, S.A.F.; Davis, T.S.; MacDougall, M.R.; Kassai, M.; Abdelmageed, N.; Fox, T.E.; Kester, M.; Loughran, T.P., Jr.; Abad, J.L.; et al. Chemotherapy selection pressure alters sphingolipid composition and mitochondrial bioenergetics in resistant HL-60 cells. J. Lipid Res. 2019, 60, 1590–1602. [Google Scholar] [CrossRef] [PubMed]
- Gouaze-Andersson, V.; Cabot, M.C. Sphingolipid metabolism and drug resistance in hematological malignancies. Anti-Cancer Agents Med. Chem. 2011, 11, 891–903. [Google Scholar] [CrossRef]
- Chapman, J.V.; Gouazé-Andersson, V.; Cabot, M.C. Expression of P-glycoprotein in HeLa cells confers resistance to ceramide cytotoxicity. Int. J. Oncol. 2010, 37, 1591–1597. [Google Scholar] [CrossRef]
- Morad, S.A.F.; Davis, T.S.; MacDougall, M.R.; Tan, S.F.; Feith, D.J.; Desai, D.H.; Amin, S.G.; Kester, M.; Loughran, T.P., Jr.; Cabot, M.C. Role of P-glycoprotein inhibitors in ceramide-based therapeutics for treatment of cancer. Biochem. Pharmacol. 2017, 130, 21–33. [Google Scholar] [CrossRef]
- Zheng, W.; Kollmeyer, J.; Symolon, H.; Momin, A.; Munter, E.; Wang, E.; Kelly, S.; Allegood, J.C.; Liu, Y.; Peng, Q.; et al. Ceramides and other bioactive sphingolipid backbones in health and disease: Lipidomic analysis, metabolism and roles in membrane structure, dynamics, signaling and autophagy. Biochim. Et Biophys. Acta 2006, 1758, 1864–1884. [Google Scholar] [CrossRef]
- Bose, R.; Verheij, M.; Haimovitz-Friedman, A.; Scotto, K.; Fuks, Z.; Kolesnick, R. Ceramide synthase mediates daunorubicin-induced apoptosis: An alternative mechanism for generating death signals. Cell 1995, 82, 405–414. [Google Scholar] [CrossRef]
- Jaffrézou, J.P.; Levade, T.; Bettaïeb, A.; Andrieu, N.; Bezombes, C.; Maestre, N.; Vermeersch, S.; Rousse, A.; Laurent, G. Daunorubicin-induced apoptosis: Triggering of ceramide generation through sphingomyelin hydrolysis. EMBO J. 1996, 15, 2417–2424. [Google Scholar] [CrossRef]
- Morad, S.A.; Cabot, M.C. Ceramide-orchestrated signalling in cancer cells. Nat. Rev. Cancer 2013, 13, 51–65. [Google Scholar] [CrossRef]
- Xie, P.; Shen, Y.F.; Shi, Y.P.; Ge, S.M.; Gu, Z.H.; Wang, J.; Mu, H.J.; Zhang, B.; Qiao, W.Z.; Xie, K.M. Overexpression of glucosylceramide synthase in associated with multidrug resistance of leukemia cells. Leuk. Res. 2008, 32, 475–480. [Google Scholar] [CrossRef]
- Tan, S.F.; Liu, X.; Fox, T.E.; Barth, B.M.; Sharma, A.; Turner, S.D.; Awwad, A.; Dewey, A.; Doi, K.; Spitzer, B.; et al. Acid ceramidase is upregulated in AML and represents a novel therapeutic target. Oncotarget 2016, 7, 83208–83222. [Google Scholar] [CrossRef]
- Fisher-Wellman, K.H.; Hagen, J.T.; Kassai, M.; Kao, L.P.; Nelson, M.A.M.; McLaughlin, K.L.; Coalson, H.S.; Fox, T.E.; Tan, S.F.; Feith, D.J.; et al. Alterations in sphingolipid composition and mitochondrial bioenergetics represent synergistic therapeutic vulnerabilities linked to multidrug resistance in leukemia. FASEB J. Off. Publ. Fed. Am. Soc. Exp. Biol. 2022, 36, e22094. [Google Scholar] [CrossRef]
- McLaughlin, K.L.; Hagen, J.T.; Coalson, H.S.; Nelson, M.A.M.; Kew, K.A.; Wooten, A.R.; Fisher-Wellman, K.H. Novel approach to quantify mitochondrial content and intrinsic bioenergetic efficiency across organs. Sci. Rep. 2020, 10, 17599. [Google Scholar] [CrossRef]
- Fisher-Wellman, K.H.; Davidson, M.T.; Narowski, T.M.; Lin, C.T.; Koves, T.R.; Muoio, D.M. Mitochondrial Diagnostics: A Multiplexed Assay Platform for Comprehensive Assessment of Mitochondrial Energy Fluxes. Cell Rep. 2018, 24, 3593–3606.e3510. [Google Scholar] [CrossRef]
- Veech, R.L.; Kashiwaya, Y.; Gates, D.N.; King, M.T.; Clarke, K. The energetics of ion distribution: The origin of the resting electric potential of cells. IUBMB Life 2002, 54, 241–252. [Google Scholar] [CrossRef]
- Morad, S.A.; Ryan, T.E.; Neufer, P.D.; Zeczycki, T.N.; Davis, T.S.; MacDougall, M.R.; Fox, T.E.; Tan, S.F.; Feith, D.J.; Loughran, T.P., Jr.; et al. Ceramide-tamoxifen regimen targets bioenergetic elements in acute myelogenous leukemia. J. Lipid Res. 2016, 57, 1231–1242. [Google Scholar] [CrossRef]
- Liu, Y.Y.; Han, T.Y.; Giuliano, A.E.; Cabot, M.C. Ceramide glycosylation potentiates cellular multidrug resistance. FASEB J. Off. Publ. Fed. Am. Soc. Exp. Biol. 2001, 15, 719–730. [Google Scholar] [CrossRef]
- Park, L.M.; Lannigan, J.; Jaimes, M.C. OMIP-069: Forty-Color Full Spectrum Flow Cytometry Panel for Deep Immunophenotyping of Major Cell Subsets in Human Peripheral Blood. Cytometry. Part A J. Int. Soc. Anal. Cytol. 2020, 97, 1044–1051. [Google Scholar] [CrossRef] [PubMed]
- Plo, I.; Lehne, G.; Beckstrøm, K.J.; Maestre, N.; Bettaïeb, A.; Laurent, G.; Lautier, D. Influence of ceramide metabolism on P-glycoprotein function in immature acute myeloid leukemia KG1a cells. Mol. Pharmacol. 2002, 62, 304–312. [Google Scholar] [CrossRef] [PubMed]
- Hartmann, D.; Lucks, J.; Fuchs, S.; Schiffmann, S.; Schreiber, Y.; Ferreirós, N.; Merkens, J.; Marschalek, R.; Geisslinger, G.; Grösch, S. Long chain ceramides and very long chain ceramides have opposite effects on human breast and colon cancer cell growth. Int. J. Biochem. Cell Biol. 2012, 44, 620–628. [Google Scholar] [CrossRef] [PubMed]
- Hartmann, D.; Wegner, M.S.; Wanger, R.A.; Ferreirós, N.; Schreiber, Y.; Lucks, J.; Schiffmann, S.; Geisslinger, G.; Grösch, S. The equilibrium between long and very long chain ceramides is important for the fate of the cell and can be influenced by co-expression of CerS. Int. J. Biochem. Cell Biol. 2013, 45, 1195–1203. [Google Scholar] [CrossRef]
- Inokuchi, J.; Radin, N.S. Preparation of the active isomer of 1-phenyl-2-decanoylamino-3-morpholino-1-propanol, inhibitor of murine glucocerebroside synthetase. J. Lipid Res. 1987, 28, 565–571. [Google Scholar] [CrossRef]
- Chai, L.; McLaren, R.P.; Byrne, A.; Chuang, W.L.; Huang, Y.; Dufault, M.R.; Pacheco, J.; Madhiwalla, S.; Zhang, X.; Zhang, M.; et al. The chemosensitizing activity of inhibitors of glucosylceramide synthase is mediated primarily through modulation of P-gp function. Int. J. Oncol. 2011, 38, 701–711. [Google Scholar] [CrossRef]
- Twentyman, P.R. Cyclosporins as drug resistance modifiers. Biochem. Pharmacol. 1992, 43, 109–117. [Google Scholar] [CrossRef]
- Lavie, Y.; Cao, H.; Volner, A.; Lucci, A.; Han, T.Y.; Geffen, V.; Giuliano, A.E.; Cabot, M.C. Agents that reverse multidrug resistance, tamoxifen, verapamil, and cyclosporin A, block glycosphingolipid metabolism by inhibiting ceramide glycosylation in human cancer cells. J. Biol. Chem. 1997, 272, 1682–1687. [Google Scholar] [CrossRef]
- Wilson, M.W.; Shu, L.; Hinkovska-Galcheva, V.; Jin, Y.; Rajeswaran, W.; Abe, A.; Zhao, T.; Luo, R.; Wang, L.; Wen, B.; et al. Optimization of Eliglustat-Based Glucosylceramide Synthase Inhibitors as Substrate Reduction Therapy for Gaucher Disease Type 3. ACS Chem. Neurosci. 2020, 11, 3464–3473. [Google Scholar] [CrossRef]
- McEachern, K.A.; Fung, J.; Komarnitsky, S.; Siegel, C.S.; Chuang, W.L.; Hutto, E.; Shayman, J.A.; Grabowski, G.A.; Aerts, J.M.; Cheng, S.H.; et al. A specific and potent inhibitor of glucosylceramide synthase for substrate inhibition therapy of Gaucher disease. Mol. Genet. Metab. 2007, 91, 259–267. [Google Scholar] [CrossRef]
- Pearson, J.M.; Tan, S.F.; Sharma, A.; Annageldiyev, C.; Fox, T.E.; Abad, J.L.; Fabrias, G.; Desai, D.; Amin, S.; Wang, H.G.; et al. Ceramide Analogue SACLAC Modulates Sphingolipid Levels and MCL-1 Splicing to Induce Apoptosis in Acute Myeloid Leukemia. Mol. Cancer Res. MCR 2020, 18, 352–363. [Google Scholar] [CrossRef]
- Ordóñez, Y.F.; Abad, J.L.; Aseeri, M.; Casas, J.; Garcia, V.; Casasampere, M.; Schuchman, E.H.; Levade, T.; Delgado, A.; Triola, G.; et al. Activity-Based Imaging of Acid Ceramidase in Living Cells. J. Am. Chem. Soc. 2019, 141, 7736–7742. [Google Scholar] [CrossRef]
- Shayman, J.A. The design and clinical development of inhibitors of glycosphingolipid synthesis: Will invention be the mother of necessity? Trans. Am. Clin. Climatol. Assoc. 2013, 124, 46–60. [Google Scholar]
- Morad, S.A.F.; Cabot, M.C. The Onus of Sphingolipid Enzymes in Cancer Drug Resistance. Adv. Cancer Res. 2018, 140, 235–263. [Google Scholar] [CrossRef]
- Abe, A.; Inokuchi, J.; Jimbo, M.; Shimeno, H.; Nagamatsu, A.; Shayman, J.A.; Shukla, G.S.; Radin, N.S. Improved inhibitors of glucosylceramide synthase. J. Biochem. 1992, 111, 191–196. [Google Scholar] [CrossRef]
- Senkal, C.E.; Ponnusamy, S.; Rossi, M.J.; Bialewski, J.; Sinha, D.; Jiang, J.C.; Jazwinski, S.M.; Hannun, Y.A.; Ogretmen, B. Role of human longevity assurance gene 1 and C18-ceramide in chemotherapy-induced cell death in human head and neck squamous cell carcinomas. Mol. Cancer Ther. 2007, 6, 712–722. [Google Scholar] [CrossRef]
- Dany, M.; Gencer, S.; Nganga, R.; Thomas, R.J.; Oleinik, N.; Baron, K.D.; Szulc, Z.M.; Ruvolo, P.; Kornblau, S.; Andreeff, M.; et al. Targeting FLT3-ITD signaling mediates ceramide-dependent mitophagy and attenuates drug resistance in AML. Blood 2016, 128, 1944–1958. [Google Scholar] [CrossRef]
- Tan, S.F.; Pearson, J.M.; Feith, D.J.; Loughran, T.P., Jr. The emergence of acid ceramidase as a therapeutic target for acute myeloid leukemia. Expert Opin. Ther. Targets 2017, 21, 583–590. [Google Scholar] [CrossRef]
- Vijayan, Y.; Lankadasari, M.B.; Harikumar, K.B. Acid Ceramidase: A Novel Therapeutic Target in Cancer. Curr. Top. Med. Chem. 2019, 19, 1512–1520. [Google Scholar] [CrossRef]
- Cho, S.M.; Kwon, H.J. Acid ceramidase, an emerging target for anti-cancer and anti-angiogenesis. Arch. Pharmacal Res. 2019, 42, 232–243. [Google Scholar] [CrossRef]
- Chapman, J.V.; Gouazé-Andersson, V.; Karimi, R.; Messner, M.C.; Cabot, M.C. P-glycoprotein antagonists confer synergistic sensitivity to short-chain ceramide in human multidrug-resistant cancer cells. Exp. Cell Res. 2011, 317, 1736–1745. [Google Scholar] [CrossRef] [PubMed]
- van Helvoort, A.; Smith, A.J.; Sprong, H.; Fritzsche, I.; Schinkel, A.H.; Borst, P.; van Meer, G. MDR1 P-glycoprotein is a lipid translocase of broad specificity, while MDR3 P-glycoprotein specifically translocates phosphatidylcholine. Cell 1996, 87, 507–517. [Google Scholar] [CrossRef] [PubMed]
- Shabbits, J.A.; Mayer, L.D. P-glycoprotein modulates ceramide-mediated sensitivity of human breast cancer cells to tubulin-binding anticancer drugs. Mol. Cancer Ther. 2002, 1, 205–213. [Google Scholar] [PubMed]
- Charles, A.G.; Han, T.Y.; Liu, Y.Y.; Hansen, N.; Giuliano, A.E.; Cabot, M.C. Taxol-induced ceramide generation and apoptosis in human breast cancer cells. Cancer Chemother. Pharmacol. 2001, 47, 444–450. [Google Scholar] [CrossRef] [PubMed]
- Sietsma, H.; Veldman, R.J.; Kolk, D.; Ausema, B.; Nijhof, W.; Kamps, W.; Vellenga, E.; Kok, J.W. 1-phenyl-2-decanoylamino-3-morpholino-1-propanol chemosensitizes neuroblastoma cells for taxol and vincristine. Clin. Cancer Res. Off. J. Am. Assoc. Cancer Res. 2000, 6, 942–948. [Google Scholar]
- Budani, M.; Auray-Blais, C.; Lingwood, C. ATP-binding cassette transporters mediate differential biosynthesis of glycosphingolipid species. J. Lipid Res. 2021, 62, 100128. [Google Scholar] [CrossRef]
- Colombini, M. Ceramide channels and mitochondrial outer membrane permeability. J. Bioenerg. Biomembr. 2017, 49, 57–64. [Google Scholar] [CrossRef]
- Fisher-Wellman, K.H.; Hagen, J.T.; Neufer, P.D.; Kassai, M.; Cabot, M.C. On the nature of ceramide-mitochondria interactions—Dissection using comprehensive mitochondrial phenotyping. Cell. Signal. 2021, 78, 109838. [Google Scholar] [CrossRef]
- Nelson, M.A.; McLaughlin, K.L.; Hagen, J.T.; Coalson, H.S.; Schmidt, C.; Kassai, M.; Kew, K.A.; McClung, J.M.; Neufer, P.D.; Brophy, P.; et al. Intrinsic OXPHOS limitations underlie cellular bioenergetics in leukemia. eLife 2021, 10, e63104. [Google Scholar] [CrossRef]
- Xu, L.; Zhang, Y.; Gao, M.; Wang, G.; Fu, Y. Concurrent targeting Akt and sphingosine kinase 1 by A-674563 in acute myeloid leukemia cells. Biochem. Biophys. Res. Commun. 2016, 472, 662–668. [Google Scholar] [CrossRef]
- Park, S.; Chapuis, N.; Tamburini, J.; Bardet, V.; Cornillet-Lefebvre, P.; Willems, L.; Green, A.; Mayeux, P.; Lacombe, C.; Bouscary, D. Role of the PI3K/AKT and mTOR signaling pathways in acute myeloid leukemia. Haematologica 2010, 95, 819–828. [Google Scholar] [CrossRef]
- Rahman, A.; Thayyullathil, F.; Pallichankandy, S.; Galadari, S. Hydrogen peroxide/ceramide/Akt signaling axis play a critical role in the antileukemic potential of sanguinarine. Free Radic. Biol. Med. 2016, 96, 273–289. [Google Scholar] [CrossRef]
- Xiang, W.; Yang, C.Y.; Bai, L. MCL-1 inhibition in cancer treatment. OncoTargets Ther. 2018, 11, 7301–7314. [Google Scholar] [CrossRef]
- Negi, A.; Murphy, P.V. Development of Mcl-1 inhibitors for cancer therapy. Eur. J. Med. Chem. 2021, 210, 113038. [Google Scholar] [CrossRef]
- Wei, A.H.; Roberts, A.W.; Spencer, A.; Rosenberg, A.S.; Siegel, D.; Walter, R.B.; Caenepeel, S.; Hughes, P.; McIver, Z.; Mezzi, K.; et al. Targeting MCL-1 in hematologic malignancies: Rationale and progress. Blood Rev. 2020, 44, 100672. [Google Scholar] [CrossRef]
- Li, X.X.; Zhou, J.D.; Wen, X.M.; Zhang, T.J.; Wu, D.H.; Deng, Z.Q.; Zhang, Z.H.; Lian, X.Y.; He, P.F.; Yao, X.Y.; et al. Increased MCL-1 expression predicts poor prognosis and disease recurrence in acute myeloid leukemia. OncoTargets Ther. 2019, 12, 3295–3304. [Google Scholar] [CrossRef]
- Bae, J.; Leo, C.P.; Hsu, S.Y.; Hsueh, A.J. MCL-1S, a splicing variant of the antiapoptotic BCL-2 family member MCL-1, encodes a proapoptotic protein possessing only the BH3 domain. J. Biol. Chem. 2000, 275, 25255–25261. [Google Scholar] [CrossRef]
- Morciano, G.; Giorgi, C.; Balestra, D.; Marchi, S.; Perrone, D.; Pinotti, M.; Pinton, P. Mcl-1 involvement in mitochondrial dynamics is associated with apoptotic cell death. Mol. Biol. Cell 2016, 27, 20–34. [Google Scholar] [CrossRef]
- Morad, S.A.; Cabot, M.C. Tamoxifen regulation of sphingolipid metabolism--Therapeutic implications. Biochim. Et Biophys. Acta 2015, 1851, 1134–1145. [Google Scholar] [CrossRef]


Disclaimer/Publisher’s Note: The statements, opinions and data contained in all publications are solely those of the individual author(s) and contributor(s) and not of MDPI and/or the editor(s). MDPI and/or the editor(s) disclaim responsibility for any injury to people or property resulting from any ideas, methods, instructions or products referred to in the content. |
© 2023 by the authors. Licensee MDPI, Basel, Switzerland. This article is an open access article distributed under the terms and conditions of the Creative Commons Attribution (CC BY) license (https://creativecommons.org/licenses/by/4.0/).
Share and Cite
Fisher-Wellman, K.H.; Kassai, M.; Hagen, J.T.; Neufer, P.D.; Kester, M.; Loughran, T.P., Jr.; Chalfant, C.E.; Feith, D.J.; Tan, S.-F.; Fox, T.E.; et al. Simultaneous Inhibition of Ceramide Hydrolysis and Glycosylation Synergizes to Corrupt Mitochondrial Respiration and Signal Caspase Driven Cell Death in Drug-Resistant Acute Myeloid Leukemia. Cancers 2023, 15, 1883. https://doi.org/10.3390/cancers15061883
Fisher-Wellman KH, Kassai M, Hagen JT, Neufer PD, Kester M, Loughran TP Jr., Chalfant CE, Feith DJ, Tan S-F, Fox TE, et al. Simultaneous Inhibition of Ceramide Hydrolysis and Glycosylation Synergizes to Corrupt Mitochondrial Respiration and Signal Caspase Driven Cell Death in Drug-Resistant Acute Myeloid Leukemia. Cancers. 2023; 15(6):1883. https://doi.org/10.3390/cancers15061883
Chicago/Turabian StyleFisher-Wellman, Kelsey H., Miki Kassai, James T. Hagen, P. Darrell Neufer, Mark Kester, Thomas P. Loughran, Jr., Charles E. Chalfant, David J. Feith, Su-Fern Tan, Todd E. Fox, and et al. 2023. "Simultaneous Inhibition of Ceramide Hydrolysis and Glycosylation Synergizes to Corrupt Mitochondrial Respiration and Signal Caspase Driven Cell Death in Drug-Resistant Acute Myeloid Leukemia" Cancers 15, no. 6: 1883. https://doi.org/10.3390/cancers15061883
APA StyleFisher-Wellman, K. H., Kassai, M., Hagen, J. T., Neufer, P. D., Kester, M., Loughran, T. P., Jr., Chalfant, C. E., Feith, D. J., Tan, S.-F., Fox, T. E., Ung, J., Fabrias, G., Abad, J. L., Sharma, A., Golla, U., Claxton, D. F., Shaw, J. J. P., Bhowmick, D., & Cabot, M. C. (2023). Simultaneous Inhibition of Ceramide Hydrolysis and Glycosylation Synergizes to Corrupt Mitochondrial Respiration and Signal Caspase Driven Cell Death in Drug-Resistant Acute Myeloid Leukemia. Cancers, 15(6), 1883. https://doi.org/10.3390/cancers15061883