Simple Summary
Deregulated expression of the c-MYC oncogene activates the tumor suppressor p53, which has been suggested to represent a failsafe mechanism against the uncontrolled expansion of tumor cells. Here, we analyzed the role of the c-MYC-induced TFAP4/AP4 gene in this context using a genetic approach in MCF-7 breast cancer cells. Inactivation of AP4 resulted in elevated levels of both spontaneous and c-MYC-induced DNA damage, senescence, and diminished cell proliferation. Inactivation of p53 in AP4-deficient cells reverted senescence and proliferative defects. Furthermore, loss of AP4 resulted in p53-dependenct, enhanced repression of DREAM and E2F target genes after the induction of c-MYC, which could be abrogated by the concomitant depletion of p21 or the DREAM complex component LIN37. These p53-dependent effects were reflected on the levels of gene expressions and clinical associations in primary breast cancer tumors from patient cohorts. Our results established AP4 as a pivotal factor at the crossroads of c-MYC, E2F, and p53-mediated target gene regulation.
Abstract
Background: The deregulated expression of the c-MYC oncogene activates p53, which is presumably mediated by ARF/INK4, as well as replication-stress-induced DNA damage. Here, we aimed to determine whether the c-MYC-inducible AP4 transcription factor plays a role in this context using a genetic approach. Methods: We used a CRISPR/Cas9 approach to generate AP4- and/or p53-deficient derivatives of MCF-7 breast cancer cells harboring an ectopic, inducible c-MYC allele. Cell proliferation, senescence, DNA damage, and comprehensive RNA expression profiles were determined after activation of c-MYC. In addition, we analyzed the expression data from primary breast cancer samples. Results: Loss of AP4 resulted in elevated levels of both spontaneous and c-MYC-induced DNA damage, senescence, and diminished cell proliferation. Deletion of p53 in AP4-deficient cells reverted senescence and proliferation defects without affecting DNA damage levels. RNA-Seq analyses showed that loss of AP4 enhanced repression of DREAM and E2F target genes after p53 activation by c-MYC. Depletion of p21 or the DREAM complex component LIN37 abrogated this effect. These p53-dependent effects were conserved on the level of clinical and gene expression associations found in primary breast cancer tumors. Conclusions: Our results establish AP4 as a pivotal factor at the crossroads of c-MYC, E2F, and p53 target gene regulation.
Keywords:
c-MYC; AP4; TFAP4; p53; p21; DREAM complex; ARF/INK4A; senescence; cell cycle progression; breast cancer; E2F target genes 1. Introduction
The c-MYC transcription factor is encoded by a proto-oncogene, which shows elevated and/or deregulated expression in more than 70% of all cancers [1]. In breast cancer, c-MYC is expressed at elevated levels in 30–50% and amplified in nearly 15% of cases [2].
Oncogenic, deregulated c-MYC expression induces unscheduled DNA replication [3]. Furthermore, activation of c-MYC leads to the accumulation of the p53 tumor suppressor protein, which mediates c-MYC-induced apoptosis [4,5]. Evidence from mouse models suggests that post-transcriptional activation of p53 is mediated by Arf/Ink4 activation, which blocks the p53-specific E3-ligase Mdm2 [6]. The relevance of INK4A/ARF for p53 activation by c-MYC in human cells has not been unambiguously clarified [7]. The INK4A/B locus, which encodes p14/ARF and the CDK-inhibitor p16, is frequently inactivated in cancer cell lines due to DNA methylation, mutations, or chromosomal deletions [8]. In human cells, p53 activation induced by c-MYC has been shown to occur due to DNA damage, which is caused by oncogene-induced replication stress [3,9,10]. Interestingly, c-MYC abrogates a p53-mediated cell cycle arrest as it induces DNA replication in the presence of high p53 activity [11]. However, the mechanism underlying the ability of c-MYC to override the anti-proliferative activity of p53 has remained largely unknown.
We identified the AP4 gene as a direct target of c-MYC in the breast cancer cell line MCF-7 [12]. AP4 encodes a BR-HLH-LZ transcription factor that binds to so-called E-boxes (CAGCTG) in the vicinity of target genes [13] and mediates their repression or induction [14]. The CDK inhibitor CDKN1A/p21 and MDM2 represent targets for direct repression by AP4 [12,15,16] and are directly induced by p53 [17,18]. So far, the role and outcome of their antagonistic regulation by AP4 and p53 have not been studied.
The DREAM complex has been implicated in the repression of gene expression by p53 [19]. DREAM is composed of dimerization partner (DP), retinoblastoma-(RB)-like, E2F4-5, and MuvB proteins. It is involved in the down-regulation of numerous genes, which encode factors mediating cell cycle progression and checkpoint control. Mechanistically, the induction of p21 by p53 leads to hypo-phosphorylation of the pRB-related proteins p107/RBL1 and p130/RBL2, which then associate with E2F4-5/DP and additional proteins, such as LIN54, LIN37, LIN9, and RBBP4 [19]. The resulting DREAM complex then represses transcription by binding to E2F or cell cycle genes homology region (CHR) promoter sites. Conversely, the repression of p21 by AP4 is predicted to attenuate DREAM complex activity and alleviate the repression of its target genes. This suggests that the activation of AP4 may contribute to the abrogation of p53 function by c-MYC.
The p53-proficient MCF-7 breast cancer cell line, which is deficient of p14/ARF and p16, represents a luminal, estrogen-receptor-positive breast cancer subtype in which endogenous c-MYC expression is amenable to regulation by both estrogens and anti-estrogens [12,20,21]. Ectopic expression of c-MYC has been shown to override the cell cycle arrest caused by estrogen antagonists in MCF-7 cells [12,22]. Here we determined the role of AP4 and p53 downstream of c-MYC activation in MCF-7 cells by using a genetic approach. When c-MYC was ectopically activated in MCF-7 cells with the deletion of AP4, it resulted in decreased proliferation and increased induction of p21, which was associated with increased DNA damage and senescence when compared with c-MYC activation in AP4-proficient cells. Additional deletion of p53 fully reverted the proliferative defects and the senescent phenotype of AP4-deficient cells. Comprehensive gene expression profiling revealed that c-MYC-induced AP4 mitigates DREAM-mediated gene repression. Thereby, AP4 presumably limits the inhibitory effects of p53 and contributes to productive cell cycle progression after activation of c-MYC.
2. Materials and Methods
2.1. Cell Culture and Treatments
The human breast cancer cell line MCF-7 and its derivatives generated here were grown in Dulbecco’s modified Eagle’s medium (DMEM, Invitrogen, Carlsbad, CA, USA) supplemented with 10% fetal bovine serum (FBS) (Invitrogen), 100 units/mL penicillin, and 0.1 mg/mL streptomycin in an incubator with 5% CO2 at 37 °C. siRNAs and negative controls were transfected with Lipofectamine RNAi MAX Transfection Reagent (Invitrogen, Carlsbad, CA, USA) at a final concentration of 12.5 nM. Hygromycin with a final concentration of 0.25 mg/mL was used to maintain MCF-7 cells harboring pRTR-c-MYC vectors. The anti-estrogen ICI 182,780/Fulvestrant [23] was applied at a final concentration of 1 μM for 72 h before doxycycline (DOX, Sigma-Aldrich, St. Louis, MO, USA) dissolved in water was applied at a final concentration of 1 µg/mL. FlexiTube siRNAs (consisting of a pool of 4 different siRNAs) targeting p21 or LIN37) and control siRNAs were purchased from Qiagen (Hilden, Germany). The sequence information of guide RNAs used for AP4 and p53 deletion are listed in Tables S1 and S2.
2.2. Generation of AP4-Deficient MCF-7 Cells
MCF-7 cells harboring a pRTR-c-MYC expression vector (MCF-7/pRTR-c-MYC), which ectopically expresses c-MYC and mRFP from a bidirectional, DOX-inducible promoter, were previously described in [12]. Deletion of exon 2 of the AP4 gene was achieved as described in [24]. In short, 48 h after transfection with pSpCas9(BB)-2A-GFP vectors [25], each expressing 1 of 3 guide RNAs (Table S1), single GFP-positive cells were sorted into individual 96-wells using a FACSARIA cell sorter (BD Biosystems, Franklin Lakes, NJ, USA). Single-cell clones were expanded for two weeks and subjected to Western blot analysis to verify the loss of AP4 protein expression.
2.3. Generation of p53-Deficient Cell Pools
In order to delete p53, a CRISPR/Cas9 approach was used in both AP4 wild-type and AP4-deficient cells. A guide RNA targeting exon 3 of the TP53 gene (Table S2, [26]) was cloned into pSpCas9(BB)-2A-GFP. Cells were seeded at 2 × 10⁵ cells/6-well and transfected with 2 µg pSpCas9(BB)-2A-GFP-p53 (kind gift from Peter Jung) using Lipofectamine LTX (Invitrogen, Carlsbad, CA, USA). Cells were transferred into 25T flasks 48 h after transfection. Nutlin-3a (10 µM) was applied for two weeks to select p53-deficient cells. The resulting p53-deficient cell pools were subjected to Western Blot analysis to verify the loss of p53 protein expression.
2.4. Western Blot Analysis
Samples were lysed in RIPA buffer supplemented with Mini Protease Inhibitor (Roche, Basel, Switzerland), sonicated, and centrifuged at 16,000× g at 4 °C for 15 min. A Micro BCA Protein Assay Kit (Pierce, Appleton, WI, USA) was used to determine the protein concentrations. 60–70 μg protein per sample was used for SDS-PAGE. The antibodies used are listed in Table S3. Uncropped Western blot membranes are displayed in Figure S1.
2.5. Beta-Galactosidase (β-Gal) Staining
β-gal staining was performed using a Senescence β-Galactosidase Staining Kit (#9860, Cell Signaling Technology, Danvers, MA, USA) according to the manufacturer’s instructions. Cells were seeded into 6-well plates at a density of 2 × 10⁵ cells/well. Cells were washed twice with HBSS before fixation for 30 min at room temperature. The final pH of the staining solution containing X-gal was adjusted to around pH 5.9–6.1. After overnight incubation at 37 °C, cells were stained and imaged by using a microscope (Axiovert 25, Zeiss, Jena, Germany) with Axiovision software (Version 4.8, Zeiss).
2.6. Immunofluorescence Analysis
Cells were seeded on sterile round 12 mm coverslips in a 6-well plate at a density of 2 × 10⁵ cells/well. Cells were grown to 40–60% confluency, washed twice with PBS, fixed with 4% paraformaldehyde for 10 min, permeabilized with 0.2% Triton X-100 for 5 min, then blocked in 1% BSA/PBS for 1 h at room temperature. DNA damage foci were detected by a γH2AX-specific antibody incubated at 4 °C overnight. Cellular chromatin was stained by DAPI (Roche, Basel, Switzerland). For F-Actin staining, samples were incubated with Alexa Fluor 488-coupled phalloidin (Thermo Fisher, Waltham, MA, USA) in 1% BSA in HBSS for 45 min at room temperature and washed 3× with 1 mL 0.05% Tween-20 in PBS for 5 min. Stained cells were covered with ProLong Gold antifade (Invitrogen) and recorded with a confocal microscope (LSM 700, Zeiss) equipped with 405 nm, 488 nm, and 555 nm lasers using a Plan-Apochromat 63×/1.40 Oil DIC M27 objective and ZEN 2009 software. After image acquisition (2048 × 2048 pixel 16 bit), original LSM files were converted into TIFF files. Foci quantification was performed with the Image J software (Version 1.53t). Nuclei with more than 10 foci were considered γH2AX-positive. The fluorescence intensity was normalized to DAPI. For each condition, at least three microscope fields with a total of 150 cells were quantified. The antibodies used are listed in Table S3.
2.7. Comet Assay
Comet assays were performed using the Comet Assay Kit (3-well slides, ab238544, Abcam, Boston, MA, USA), as described previously [24], and imaged by using a microscope (Axiovert 25, Zeiss, Jena, Germany) with Axiovision software (Version 4.8, Zeiss).
2.8. RNA Isolation and Quantitative Real-Time Polymerase Chain Reaction (qPCR) Analysis
Cells were seeded at 0.5 × 10⁵ cells/mL in 6-well plates and treated with ICI for 72 h. Subsequently, ectopic expression of c-MYC was induced with DOX for the indicated time points in the presence of ICI. A High Pure RNA Isolation Kit (Roche) was used to isolate RNA from cells. For cDNA synthesis, the Verso cDNA kit (ThermoScientific, Waltham, MA, USA) was used according to the manufacturer’s instructions. A total of 1 µg of RNA and anchored oligo-dT primers were used for reverse transcription. For qPCR analysis, a LightCycler 480 Instrument II (Roche) and Fast SYBR Green Master Mix (Applied Biosystems, Foster City, CA, USA) were used. Relative gene expression was determined using the 2−ΔΔCt method [27]. The individual mRNA levels were normalized to β-actin. All qPCR primers are listed in Table S4.
2.9. Assessment of Proliferation by Real-Time Impedance Measurement
Cell proliferation was measured with impedance measurements (X-celligence RTCA DP, Roche). Cells were seeded at a density of 6 × 10³ cells in a 96-well microtiter plate (E-Plate Cardio 96, Agilent, Santa Clara, CA, USA) in triplicate and subjected to the indicated treatments. Cellular impedance was measured every 60 min for a period of up to 72 h with the X-celligence system (Roche). In parallel, cells were also seeded into 48-well plates in triplicate and counted at the end time point using a Neubauer chamber to validate impedance measurements.
2.10. Colony Formation Assay
A total of 1 × 10³ cells per well were seeded into 6-well plates and cultured for 14 days. Subsequently, cells were stained with crystal violet after fixation.
2.11. Transcriptomic Analysis
Total RNA from MCF-7/pRTR-c-MYC cells was isolated using a High Pure RNA Isolation Kit (Roche). Random primed cDNA libraries were constructed and sequenced using the NovaSeq 6000 (Illumina, San Diego, CA, USA) platform by GATC (Konstanz, Germany). Each sample was covered by at least 30 million paired-end read pairs of 150 bp length. RNA-Seq FASTQ files were processed using the RNA-Seq module implemented in the CLC Genomics Workbench v20.0.2 software (Qiagen Bioinformatics, Dusseldorf, Germany) and mapped to the GRCh38/hg38 human reference genome and its associated gene and transcript annotation (ENSEMBL) using the settings mismatch cost = 2, insertion cost = 2, deletion cost = 3, length fraction = 0.8, and similarity fraction = 0.8. RNA-Seq data were filtered to exclude weakly expressed transcripts with less than 20 mapped exon reads in all samples from the analysis and subjected to upper quartile normalization using the R/Bioconductor RUVSeq (remove unwanted variation from RNA-Seq data) package as described in Risso et al. [28]. Differential gene expression analysis was performed with DESeq2 [29] after normalization using the RUVg approach to remove variation between RNA samples resulting from differences in library preparation. Principal component analysis (PCA) was performed using the PCA functionality of the EDASeq R package as implemented in RUVSeq. Gene set enrichment analysis (GSEA) was performed with the fgsea R package [30]. Prior to GSEA, expression changes from low-count genes were adjusted using the ashr (adaptive shrinkage) estimator [31]. The significance of enrichments is presented by normalized enrichment scores (NES) and Benjamini-Hochberg-adjusted p values. Heat-maps were generated with Morpheus (Broad Institute, Cambridge, MA, USA). Gene sets were obtained from the Molecular Signatures database (MSigDB) [32].
2.12. Analysis of ChIP-Seq, RNA Expression, and Clinical Data from Public Databases
Direct regulation of DREAM targets was assessed by analysis of publicly available ChIP-Seq data for E2F4 (SRX194566, MCF-7), LIN9 (SRX4213896, MCF-10A), and RBL2 (SRX016031, IMR90) obtained from ChIP-Atlas (https://chip-atlas.org (accessed on 19 December 2022)) [33]. The Integrative Genomics Viewer (IGV) [34] was used for the visualization of ChIP-Seq profiles. For the analysis of human breast cancer samples, we retrieved expression and clinical data from the TCGA-BRCA cohort [35]. The statistics for forest plots were calculated with a log-rank test. For binary classification of cases (high/low expression), the Survminer R package (https://CRAN.R-project.org/package=survminer (accessed on 18 February 2020)) was used to determine optimal cutoff values.
2.13. Statistical Analysis
Results are presented as mean +/− standard deviation (SD). Each set of experiments was repeated at least three times. A Student’s t-test was used to test the null hypothesis stating no significant differences between each individual parameter were measured. Differences were considered to be significant if p < 0.05. Statistics were performed with Prism 8 (GraphPad Software, San Diego, CA, USA).
3. Results
3.1. Generation and Characterization of AP4-and/or p53-Deficient MCF-7/pRTR-c-MYC Cell Lines
In order to study the role of AP4 downstream of c-MYC in breast cancer cells, AP4 was inactivated in MCF-7/pRTR-c-MYC cells using a CRISPR/Cas9 approach, as described earlier [24]. In addition, we inactivated p53 in these cells by introducing InDel mutations into exon 3 of p53 by CRISPR/Cas9, as described previously [26]. The induction of the ectopic c-MYC allele, activation of AP4, and loss of p53 expression was verified by Western blot analysis (Figure 1A). The c-MYC-induced elevation of p53 protein levels was similar in AP4 wild-type and AP4-deficient cells, indicating that loss of AP4 had no significant effect on the c-MYC-mediated activation of p53. As expected, basal expression levels, as well as c-MYC-induced up-regulation of the direct p53 targets p21 and MDM2, were highly dependent on the presence of p53 in these cells (Figure 1A(lower panel),B). Moreover, in AP4-deficient cells harboring wild-type p53, basal expression, as well as c-MYC-induced up-regulation of p21 and MDM2, were elevated when compared to AP4 wild-type cells (Figure 1A). Similar results were obtained by qPCR analysis of p21 and MDM2 mRNA expression (Figure 1B). Hence, both p21 and MDM2 expression are antagonistically regulated by AP4 and p53 after induction of c-MYC in MCF-7 cells.
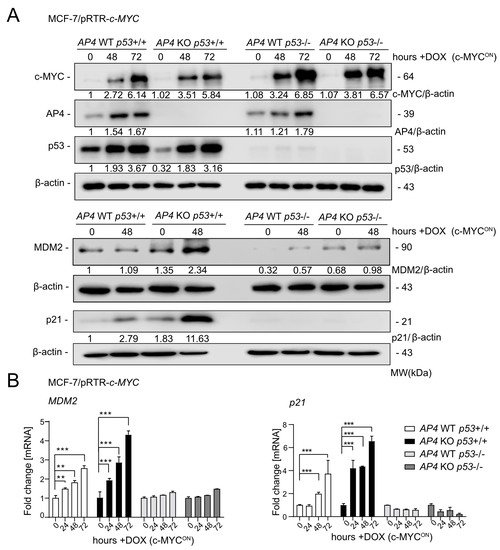
Figure 1.
Effects of AP4 and/or p53 deletion on p21/CDKN1A and MDM2 expression after activation of c-MYC. (A) Western blot analysis of the indicated cells after treatment with DOX for the indicated periods. β-actin served as a loading control. (B) qPCR analysis of the indicated cells after treatment with DOX for the indicated period. The mean +/− SD (n = 3) is provided with **: p < 0.01, ***: p < 0.001. The uncropped blots are shown in Figure S1.
3.2. Loss of AP4 Suppresses Induction of Cell Proliferation by Ectopic c-MYC
Activation of ectopic c-MYC by DOX treatment resulted in a significant increase in proliferation in MCF-7 cells with wild-type AP4 and p53 alleles, as shown by cellular impedance measurements. The induction of cell proliferation was severely diminished in AP4-deficient p53 wild-type cells (Figure 2A). In the absence of ectopic c-MYC expression, the inactivation of AP4 resulted in a pronounced decrease in cell proliferation when compared with AP4-proficient cells (Figure 2B). Interestingly, the deletion of p53 not only reverted the proliferative defect of AP4-deficient cells but led to a strong increase in proliferative capacity independent of the AP4 status (Figure 2B). Furthermore, an enhancement of cell proliferation by activation of ectopic c-MYC could not be observed after deletion of p53 irrespective of the AP4 status, presumably since p53-negative MCF-7 cells are already proliferating at the maximum rate (Figure 2C,D).
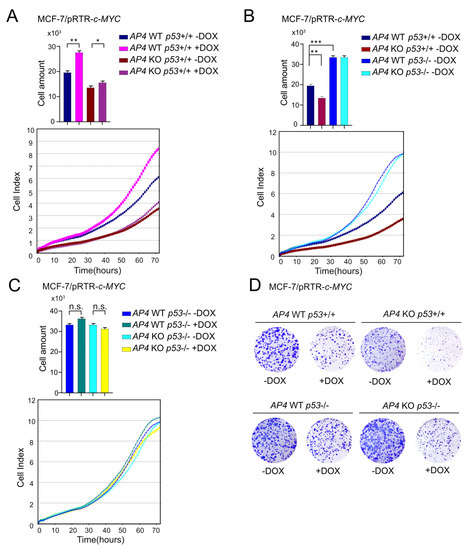
Figure 2.
Effects of AP4- and p53-deficiency on basal and c-MYC-induced cell proliferation. (A–C) Cell proliferation of the indicated cell lines was determined by impedance measurement. Cell numbers were determined at 72 h. Results are presented as the mean +/− SD with *: p < 0.05, **: p < 0.01, ***: p < 0.001, n.s.: no significance. (D) Colony formation assays with the indicated cell lines. Cells are shown 14 days after seeding.
The p53-dependent proliferative defects of AP4-deficient cells were confirmed by assaying colony formation (Figure 2D). Here, the loss of AP4 in p53 wild-type cells resulted in decreased colony-forming capacity when compared to AP4 wild-type cells. Conversely, the loss of p53 dramatically increased colony formation. Furthermore, the deletion of p53 in AP4-deficient cells reverted their decreased colony-forming capacity and resulted in colony numbers comparable to p53-deficient/AP4 wild-type cells. Interestingly, prolonged activation of c-MYC for two weeks resulted in an overall decrease in the number and size of colonies, irrespective of AP4 and p53 status. However, while this suppression of colony formation was less pronounced in AP4 wild-type/p53-deficient cells compared with AP4/p53 wild-type cells, it was dramatically enhanced in AP4/p53-deficient cells, suggesting that AP4/p53-deficient cells were particularly sensitive to prolonged activation of c-MYC. Taken together, these results showed that the decreased proliferation of AP4-deficient MCF-7 cells was dependent on the presence of wild-type p53, suggesting that p53 acts as a major suppressor of proliferation in these cells. These findings were different from our previously published results obtained in p53-mutant CRC cell lines SW480 and DLD1 [24], where deletion of AP4 resulted in a significantly diminished proliferative capacity.
3.3. Loss of AP4 Causes Senescence in Breast Cancer Cells, Which Is Dependent on Wild-Type p53
Next, we analyzed whether the decreased proliferation of AP4-deficient cells was associated with increased senescence, as shown previously in CRC cell lines and MEFs [24,36]. The fraction of senescent, β-galactosidase positive cells was elevated in untreated AP4-deficient cells when compared with AP4 wild-type cells (Figure 3A). Deletion of p53 resulted in a decrease in basal senescence. Furthermore, the deletion of p53 reverted the increased basal senescence levels observed in AP4-deficient cells. Induction of ectopic c-MYC for up to 72 h led to a significant increase in the fraction of senescent, β-galactosidase positive cells independently of the AP4 or p53 status (Figure 3A,B). However, in AP4-deficient/p53 wild-type cells, the frequency of β-galactosidase positive cells was higher when compared with AP4/p53 wild-type cells after activation of c-MYC for up to 72 h. Moreover, the deletion of p53 reverted the increased senescence levels observed in AP4-deficient cells after activation of c-MYC. Taken together, these results showed that the loss of AP4 results in increased senescence in MCF-7 cells and strongly suggested that functional p53 mediates, at least in part, the induction of a senescent phenotype in AP4-deficient cells. However, the relative increase in senescence after activation of c-MYC appeared to be largely independent of p53.
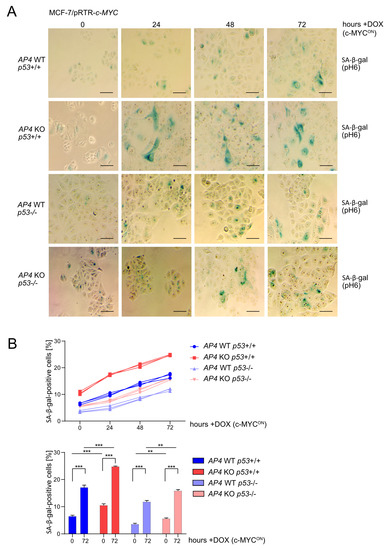
Figure 3.
Effects of AP4 and/or p53 inactivation on basal and c-MYC-induced senescence. (A) Detection of basal (no DOX treatment) and c-MYC-induced (24, 48, and 72 h DOX treatment) senescence by β-gal detection at pH 6. Scale bars: 100 µm. (B) Quantification of β-gal detection as shown in (A). Three microscopic fields with 120 cells in total were evaluated. Results are presented as the mean +/− SD with **: p < 0.01, ***: p < 0.001.
3.4. Deletion of AP4 or p53 Increases Spontaneous and c-MYC-Induced DNA Damage in Breast Cancer Cells
We have previously shown that AP4 suppresses DNA damage, which occurs spontaneously or at an increased rate after c-MYC activation. AP4 suppresses DNA damage by directly and indirectly (via repressing miR-22) inducing MDC1/Mediator of DNA damage checkpoint 1 [24]. Therefore, we determined whether the loss of AP4 in breast cancer cells also increases DNA damage. Indeed, after the deletion of AP4, increased levels of γH2AX-positive nuclear foci were detected in MCF-7 cells (Figure 4A and Figure S2). Induction of ectopic c-MYC for up to 72 h led to a significant and time-dependent increase in the fraction of γH2AX-positive cells irrespective of their AP4 and p53 status (Figure 4A). Furthermore, both basal and c-MYC-induced levels of DNA damage were elevated in AP4- and/or p53-deficient cells when compared with AP4/p53 wild-type cells. These results were corroborated by comet assays (Figure 4B and Figure S3), which also showed that both spontaneous and c-MYC-induced DNA damage was strongly elevated in AP4/p53-deficient compared to AP4/p53 wild-type cells. In addition, a dramatic increase in micronuclei was detected in AP4- and AP4/p53 double-deficient cells after induction of c-MYC, which could not be observed in AP4/p53 wild-type or p53-deficient cells (Figure 4C and Figure S4). Micronuclei result from the missegregation of chromosomes during mitosis. Since AP4- and AP4/p53 double-deficient cells accumulate high levels of DNA damage after c-MYC activation, they may enter mitosis with unrepaired DNA damage, causing the missegregation of chromosomes.
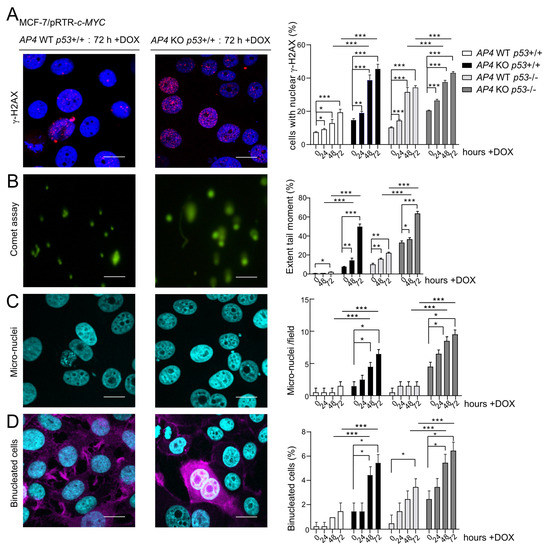
Figure 4.
Effects of AP4- and/or p53-deficiency on basal and c-MYC-induced DNA damage. (A–D) Activation of c-MYC in the indicated cells by treatment with DOX for the indicated periods. (A) Evaluation of DNA damage by detection of γH2AX foci in five microscopic fields with 150 cells in total. Scale bars: 20 µm. (B) Evaluation of unrepaired DNA damage by Comet assays in ten microscopic fields with 150 cells in total. Scale bars: 10 µm. (C) Quantification of micronuclei by DAPI staining in five microscopic fields with 150 cells in total. Scale bars: 20 μm. (D) Detection of bi-nucleated cells by DAPI and F-actin staining in ten microscopic fields with 300 cells in total. Scale bars: 20 μm. (A–D) Representative images of all time points and genotypes analyzed are provided in Figures S2–S5. (A–D) Results are presented as the mean +/− SD with *: p < 0.05, **: p < 0.01, ***: p < 0.001.
Furthermore, the number of bi-nucleated cells was highly elevated in AP4- and AP4/p53-deficient cells when compared with AP4/p53 wild-type cells (Figure 4D and Figure S5). p53-deficient cells also displayed an increase in the number of bi-nucleated cells, albeit to a lesser extent. Similar to micronuclei, bi-nucleated cells presumably result from unrepaired DNA damage in AP4-deficient cells, which leads to incomplete chromosome segregation and incomplete cytokinesis. These results show that while AP4- and AP4/p53-deficient cells accumulate high levels of either spontaneous or c-MYC-induced DNA damage, the decreased proliferation of AP4-deficient cells is completely reverted by additional inactivation of p53.
3.5. Characterization of AP4- and p53-Dependent Effects in the c-MYC-Regulated Transcriptome
To determine the potential impact of AP4 and/or p53 on c-MYC-induced differential gene expression, we performed a comprehensive Next Generation Sequencing (NGS) analysis after the activation of ectopic c-MYC in the AP4- and/or p53-deficient MCF-7 cells characterized above. To do so, cells were pre-treated with ICI for 72 h in order to down-regulate endogenous c-MYC. Ectopic expression of c-MYC was induced by addition of DOX for 48 h in the presence of ICI. For each of the four genotypes, NGS libraries representing RNAs isolated from both DOX-treated (n = 3) and ICI-only (i.e., un-) treated cells (n = 3) were generated and subjected to RNA-Seq analysis with more than 30 million paired-end reads per library. Principal component analysis (PCA) showed that both untreated and DOX-treated AP4/p53 wild-type, AP4- and/or p53-deficient MCF-7/pRTR-c-MYC cells were characterized by distinct transcriptomes (Figure 5A).
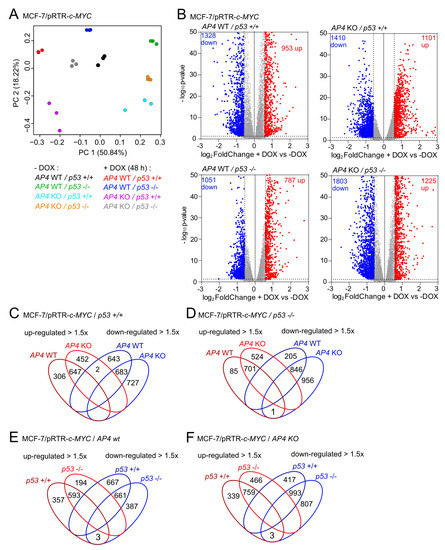
Figure 5.
Transcriptional profiling of genotype-dependent and c-MYC-induced RNA expression changes in breast cancer cells. (A) Principal component analysis (PCA) of RNA expression in MCF-7/pRTR-c-MYC cells with the indicated genotypes and treatments. (B) Volcano plots showing differential RNA expression (fold changes > 1.5, FDR q-value < 0.05) between DOX-treated and untreated cells with the indicated genotypes. Significantly up- and down-regulated RNAs are highlighted as indicated. Non-significantly regulated genes are shown in gray. The numbers of differentially regulated RNAs are indicated. (C–F) Venn diagrams showing overlap between up- and down-regulated genes in MCF-7/pRTR-c-MYC with the indicated AP4 and p53 status after induction of c-MYC with DOX.
Of note, the majority of variation between DOX-treated and untreated cells was captured by principal component (PC) one in all genotypes, strongly indicating that c-MYC-induced gene expression changes were similar between the different genotypes for a large number of genes.
Differential gene expression analyses using DESeq2 showed that, in MCF-7/pRTR-c-MYC cells (AP4/p53 wild-type), 953 genes were significantly up-regulated, and 1328 genes were down-regulated after treatment with DOX for 48 h (Figure 5B, Table S5). In AP4-deficient/p53 wild-type MCF-7/pRTR-c-MYC cells, 1101 genes were significantly up-regulated, and 1410 genes were down-regulated after activation of c-MYC by DOX treatment (Figure 5B, Table S6). In AP4-proficient/p53-deficient MCF-7/pRTR-c-MYC cells, 787 genes were significantly up-regulated, and 1051 genes were down-regulated after DOX treatment (Figure 5B, Table S7). In AP4/p53-deficient MCF-7/pRTR-c-MYC cells, 1225 genes were significantly up-regulated, and 1803 genes were down-regulated after DOX treatment (Figure 5B, Table S8). Interestingly, the overlap between mRNAs differentially either up- or down-regulated (≥1.5× fold change) genes in AP4-deficient or AP4 wild-type MCF-7/pRTR-c-MYC cells after treatment with DOX was substantial but not complete, irrespective of the p53 status (Figure 5C,D). Likewise, the overlap between mRNAs differentially either up- or down-regulated (≥1.5× fold change) in p53-deficient or p53 wild-type MCF-7/pRTR-c-MYC cells after treatment with DOX was substantial but not complete, irrespective of the AP4 status (Figure 5E,F). This suggested that the regulation of molecular and cellular pathways by c-MYC while sharing commonalities, showed differences that were dependent on the AP4 and/or p53 status of the respective cells. However, using this approach, we observed very little or no overlap between genes showing strong opposing regulation (≥1.5× fold change up- or down-regulation) in AP4 wild-type and AP4 KO cells, neither in p53 wild-type or KO background. Notably, one of the three genes displaying opposing regulation in p53 wild-type versus p53 KO cells irrespective of their AP4 status (Figure 5E,F) was CDKN1A/p21, as shown by qPCR (Figure 1B), suggesting that its up-regulation after activation of c-MYC may be a critical factor for limiting the c-MYC-induced increase in proliferation in p53 wild-type cells.
Next, we employed gene set enrichment analyses (GSEA) in order to identify molecular and cellular pathways which display differences in the regulation of their components in MCF-7/pRTR-c-MYC cells with divergent AP4 and/or p53 status after treatment with DOX (Figure 6). Direct c-MYC targets were activated after treatment with DOX, irrespective of the AP4 or p53 status. As expected, the activation of p53 targets after treatment with DOX was highly dependent on the presence of functional p53.
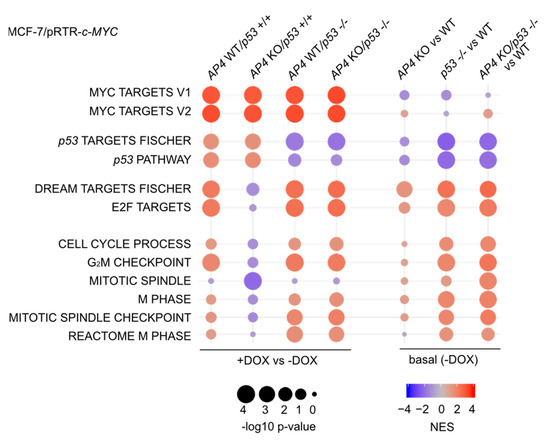
Figure 6.
Loss of AP4 results in p53-dependent differences in c-MYC-induced RNA expression changes of genes involved in cell proliferation. Dot plot representation of gene set enrichment analyses (GSEA) of the indicated functional categories obtained from comparisons of DOX-treated (48 h DOX) vs. untreated samples of the indicated genotypes (left), as well as the comparison of basal (no DOX treatment) expression levels in the indicated genotypes vs. AP4/p53 wild-type cells (WT). The significance of enrichments is presented by normalized enrichment scores (NES) and Benjamini-Hochberg-adjusted p values.
The repression of p21 by AP4 is predicted to attenuate DREAM complex activity and alleviate the repression of its target genes. This suggested that the activation of AP4 by c-MYC may contribute to the abrogation of p53-mediated gene repression. Interestingly, an up-regulation of E2F- and DREAM-target gene signatures was observed in AP4/p53 wild-type cells after treatment with DOX and was reversed in AP4-deficient/p53 wild-type cells (Figure 6). Moreover, the differential regulation of E2F/DREAM target genes between AP4 wild-type and KO cells was not observed when p53 was inactivated, suggesting a direct involvement of p53. In addition, the activation of mRNAs belonging to functional categories largely comprising E2F/DREAM targets, such as gene sets representing processes involved in cell cycle progression (e.g., “G2/M checkpoint”, “Mitotic spindle”), were also abrogated in AP4-deficient cells in a p53-dependent manner. We thus hypothesized that loss of AP4 may lead to enhanced repression of E2F target genes via hyper-activation of the DREAM complex.
Of note, a direct comparison of basal expression levels (i.e., MCF-7 cells not treated with DOX) indicated that the expression of E2F/DREAM targets, as well as the functional categories represented by these, was increased in p53-deficient cells when compared with AP4/p53 wild-type cells, suggesting an inhibitory effect of wild-type p53 on their expression (Figure 6). The elevated basal expression of genes involved in cell cycle progression in p53-deficient cells, irrespective of their AP4 status, may explain the increased proliferation of these cells, as well as their lack of responsiveness to ectopic c-MYC. The basal expression of E2F/DREAM targets in AP4-deficient cells was increased compared to AP4/p53 wild-type cells (Figure 6).
In order to identify genes with similar genotype-dependent differences in regulations after activation of c-MYC, we employed a two-factor (genotype and treatment) interaction analysis design using DESeq2, followed by KMeans clustering (n = 20) (Figure 7A). In total, we identified 2309 genes that displayed genotype-dependent differences in c-MYC-induced regulation (Figure S6, Table S9). Next, we determined which functional categories were significantly over-represented in at least one of the identified transcriptional clusters. Thereby, we identified a strong enrichment of E2F/DREAM targets, as well as pathways involved in cell cycle progression in the transcriptional clusters 1 and 2 (Figure 7B). Interestingly, the DREAM target genes in these clusters were characterized by elevated basal expression in AP4- and/or p53-deficient cells and p53-dependent down-regulation in AP4-deficient cells (Figure 8A), thus corroborating the findings of GSEA (Figure 6). A total of 202 E2F/DREAM targets were associated with clusters 1 (129/156) and 2 (73/155) (listed in Table S10). Of note, we also identified a subset of DREAM targets over-represented in cluster 3 (34/99), which does not display p53-dependent down-regulation in AP4-deficient cells but is induced upon activation of c-MYC. However, induction of the majority of these genes was attenuated in AP4-deficient cells, suggesting potential opposing regulation via the p53-21 axis also for these genes (Figure 8A). Representative examples of DREAM targets of clusters 1, 2, and 3 are shown in Figure 8B.
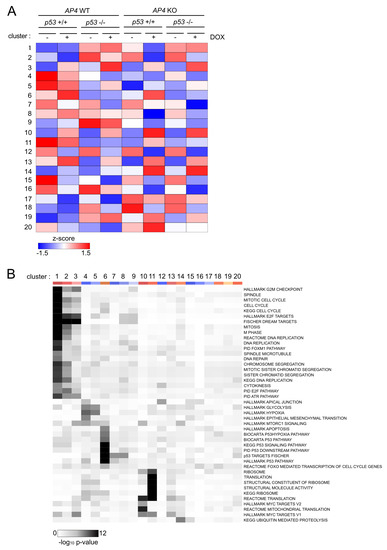
Figure 7.
Clustering of gene expressions with genotype-dependent differences in c-MYC-mediated regulation. (A) Heat-map of RNA expression clusters comprising genes with statistically significant, genotype-dependent differences in regulation after induction of c-MYC. Clusters were determined using KMeans clustering. Cluster numbers are indicated on the left. (B) Heat-map of enrichment of functional categories in the transcriptional clusters as determined in (A). Cluster numbers are indicated on top. Statistical significance was determined by Fisher’s exact test.
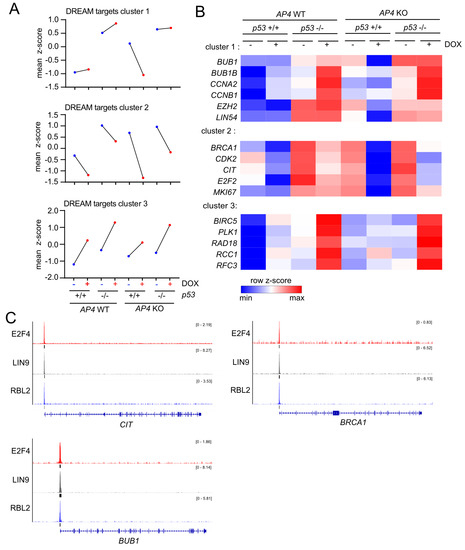
Figure 8.
Expression clusters of DREAM targets with distinct genotype-dependent differences in c-MYC-mediated regulation. (A) Dot plot representation of normalized RNA expression of all DREAM targets with statistically significant, genotype-dependent differences in regulation after induction of c-MYC grouped in the indicated transcriptional clusters. (B) Heat-map of RNA expression of selected DREAM target genes with statistically significant, genotype-dependent differences in regulation after induction of c-MYC grouped in the indicated transcriptional clusters. (C) ChIP-Seq enrichment profiles for E2F4, LIN9, and RBL2 were obtained from ChIP-Atlas and generated with the Integrative Genomics Viewer (IGV). Black vertical bars below ChIP-Seq histograms indicate peaks called with MACS2 (q-value < 1 × 10⁻⁵). Gene structure ideograms are shown below the ChIP-seq tracks.
We verified the regulation of several exemplary, previously validated DREAM targets (BUB1, CIT1, and BRCA1 [37,38]) by DREAM using publicly available ChIP-Seq data, which confirmed binding of the DREAM complex components E2F4, LIN9, and RBL2 in the promoter regions of the respective genes (Figure 8C). Notably, we also identified a subset of direct c-MYC targets displaying AP4-dependent differences in c-MYC-induced activation (cluster 10). These genes were characterized by stronger induction by c-MYC in AP4-deficient cells compared with AP4 wild-type cells irrespective of p53 status. This indicated that AP4 is not required for their activation by c-MYC but rather attenuates their induction by c-MYC. Whether their increased expression contributes to the decreased c-MYC-induced proliferation in AP4-deficient cells remains to be determined. Collectively, these results showed that the inactivation of AP4 results in the down-regulation of numerous E2F/DREAM targets after activation of c-MYC in a p53-dependent manner.
3.6. Repression of DREAM Targets after c-MYC Activation Is Mediated by p21 and LIN37
Next, we verified the c-MYC-induced downregulation of the DREAM targets BUB1, CIT1, and BRCA1 [37,38] in AP4-deficient/p53 wild-type MCF-7 cells by qPCR (Figure 9A–C). Indeed, while expression of these genes remained rather unchanged in AP4 wild-type cells, they were significantly repressed in AP4-deficient cells, thus confirming our NGS data. Therefore, we analyzed whether siRNA-mediated down-regulation of either p21 or the DREAM component LIN37 [39] (Figure S7) may revert the effect of loss of AP4 on DREAM target gene repression. Of note, while p21 was induced after activation of c-MYC, LIN37 was repressed after activation of c-MYC in MCF-7 cells (Figure 9D,E), suggesting that their siRNA-mediated down-regulation may have divergent effects. Interestingly, the three analyzed genes (BUB1, CIT, and BRCA1) where induced by c-MYC activation after RNAi-mediated inactivation of either p21 or LIN37 in AP4 wild-type cells (Figure 9F–H). However, after activation of c-MYC in AP4-deficient cells repression of these genes was observed which was either converted into an induction (BUB1, CIT) or abrogated (BRCA1) upon RNAi-mediated inactivation of p21 or LIN37 (Figure 9F–H). While the effect of RNAi-mediated inactivation of LIN37 was stronger than that of p21 in AP4 wild-type cells, it was weaker in AP4-deficient cells, which may in part be explained by the different regulation of p21 and LIN37 after activation of c-MYC (Figure 9D,E): the effect of p21 knockdown may be more pronounced in AP4-deficient cells due to elevated p21 levels in these cells compared to AP4 wild-type cells, whereas the levels of LIN37 are presumably already rather low after activation of c-MYC. In summary, these results validated that c-MYC–induced regulation of DREAM target genes is modulated by the opposing effects of AP4 and p53 on the p21-DREAM axis. These context-dependent, differential gene regulations down-stream of c-MYC are likely to have important consequences for the cellular outcome of c-MYC activation.
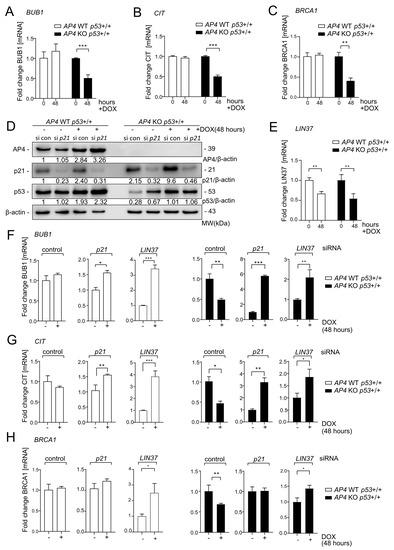
Figure 9.
c-MYC-induced down-regulation of DREAM target genes in AP4-deficient breast cancer cells is dependent on p21 and LIN37. (A–H) Cells were pre-treated with ICI for 72 h before addition of DOX for 48 h. (A–C) qPCR analysis of BUB1, CIT, and BRCA1 expression after induction of c-MYC in MCF7-pRTR-c-MYC cells. (D) Western blot analysis of AP4, p21, and p53 expression after p21 siRNA (si p21) or control siRNA (si con) transfection and activation of c-MYC with DOX for 48 h. β-actin served as a loading control. € qPCR analysis of LIN37 expression after induction of c-MYC in p53 wild-type cells with the indicated AP4 genotype. (F–H) qPCR analysis of BUB1, CIT, and BRCA1 expression after induction of c-MYC in p53 wild-type cells with the indicated AP4 status after transfection with p21- or LIN37-specific siRNAs, or control siRNA. Cells were transfected with siRNAs immediately before addition of DOX. (A–C,E,F) Results are presented as mean +/− SD (n = 3) with *: p < 0.05, **: p < 0.01, ***: p < 0.001. The uncropped blots are shown in Figure S1.
3.7. Association of c-MYC and AP4 Expression with p21, DREAM Targets and Patient Survival Is Dependent on p53 Status
Next, we analyzed whether the regulations identified above are conserved in primary breast carcinomas. For this, we analyzed RNA expression data from primary breast carcinomas and their associated clinico-pathological characteristics deposited in the TCGA database [35]. Expression of c-MYC and AP4 showed a positive correlation (Figure 10A), as shown previously by us for CRC [24,40]. Interestingly, expression of c-MYC displayed a positively correlation with p21/CDKN1A expression. In line with our observations, this was only evident in tumors with wild-type p53 but not those with mutant p53.
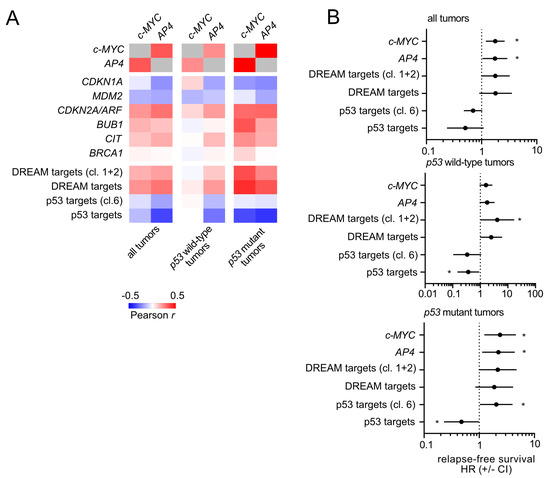
Figure 10.
Conservation of c-MYC/AP4/p53/p21/DREAM targets correlation and clinico-pathological associations in primary breast cancer. (A) Expression correlations (Pearson r) of c-MYC and AP4 with p21/CDKN1A, DREAM target and p53 target gene signatures were analyzed using public expression data (TCGA-BRCA). (B) Association analysis of the indicated factors and gene signatures with patient survival with regard to p53 status using public expression data (TCGA-BRCA). Asterisks indicate statistically significant associations (p < 0.05).
Moreover, the expression of DREAM targets was associated with c-MYC to a lesser extent in p53 wild-type tumors when compared with p53 mutant tumors. Conversely, a negative association of c-MYC with p53 target expression could not be observed in p53 wild-type but only in p53 mutant tumors. Taken together, these strongly imply that in p53 wild-type tumors, high c-MYC levels may induce p53 and p21, which counteracts the c-MYC-induced activation of E2F/DREAM target expression.
Moreover, a high expression of c-MYC or AP4 was associated with shortened relapse-free survival and an increased hazard ratio (Figure 10B). Interestingly, this association was only significant in p53 mutant tumors but not in p53 wild-type tumors. Hence, the presence of wild-type p53 appears to suppress the detrimental effects of high c-MYC/AP4 levels in breast carcinomas, possibly via activation of p21 and consequently, DREAM-mediated repression of cell cycle regulatory genes.
4. Discussion
Deregulated c-MYC expression has been shown to activate the p53 tumor suppressor, either by activation of p14/ARF or the induction of DNA damage due to unscheduled DNA replication. We have previously shown that the c-MYC-induced transcription factor AP4 regulates several pro-tumorigenic processes, including cell proliferation, EMT, and stemness, and suppresses DNA damage and senescence [14,36,40,41]. In addition, AP4 represses several p53 direct target genes, such as MDM2 or p21/CDKN1A [12,15,16]. However, whether the c-MYC-mediated induction of AP4 might play a role in inhibiting the tumor-suppressive effects of p53 activation has not been comprehensively analyzed to date.
Here, we abrogated AP4 expression in the breast cancer cell line MCF-7 harboring an ectopic, inducible c-MYC allele previously generated by us [12] using a CRISPR/Cas9 approach. Ectopic expression of c-MYC activates p53 in these cells, which allowed us to employ this system to analyze the effects of AP4 loss on c-MYC-mediated activation of p53 and on processes downstream of p53.
The E3-ligase MDM2 is a negative regulator of p53 protein levels [42,43]. Since c-MYC-induced levels of p53 protein were highly similar in AP4 wild-type and AP4-deficient cells, we concluded that repression of MDM2 by AP4 is unlikely to account for the activation of p53 after induction of c-MYC. In mouse embryo fibroblasts (MEFs) and murine models of lymphomagenesis, the up-regulation of p53 after activation of c-MYC has been shown to be caused by induction of p19ARF, as it inhibits Mdm2 and thus leads to stabilization of p53 [6,44]. The MCF-7 cell line used here harbors homozygous deletions of the INK4A/ARF locus [45,46]. Therefore, ARF expression cannot be detected in these cells and does not account for the up-regulation of p53 by c-MYC observed here. Hence, a more likely scenario in this context is that the induction of DNA damage due to DNA replication stress induced by c-MYC ultimately leads to activation of p53 [9,47].
Here, deletion of AP4 resulted in increased spontaneous DNA damage, senescence and reduced proliferation. We have previously shown that AP4 loss has similar effects in colorectal cell lines and mouse embryo fibroblasts [24,36,41]. Interestingly, additional deletion of p53 in AP4-deficient MCF-7 cells fully reverted their proliferative defects, and furthermore rendered these AP4/p53-deficient cells insensitive towards ectopic c-MYC expression, at least with regard to proliferation. Furthermore, even though c-MYC activation in AP4/p53-deficient breast cancer cells resulted in a dramatic increase in DNA damage, it did not result in senescence. These results are different from our previous findings obtained with p53-mutant CRC cell lines, where deletion of AP4 caused a significant decrease in cell proliferation due to the induction of senescence. Potentially, the difference may be due to the complete loss of p53 activity in MCF-7 cells versus the presence of a mutant p53 in the CRC cell lines studied before. Alternatively, cell-type specific differences in the role of AP4 may exist. How AP4/p53-deficient cells regain high proliferative capacity and suppress senescence, even in the presence of high levels of spontaneous and/or c-MYC-induced DNA damage, is currently not understood and remains to be elucidated. It is likely that deletion of p53 allows cell cycle progression and proliferation in the presence of DNA damage, whereas in wild-type p53 cells uncoordinated DNA replication in the absence of AP4 activates p53 and attenuates cell cycle progression. Interestingly, we found recently that AP4 enhances DNA repair by inducing MDC1 expression [24], which may contribute to the positive effect of AP4 on c-MYC-induced proliferation.
The antagonistic regulation of p21 by AP4 and p53 predicted that inactivation of AP4 in p53-proficient cells would result in enhanced repression of DREAM and E2F target genes via the p21-DREAM axis after p53 activation by c-MYC. We generated comprehensive profiles of c-MYC-induced changes in RNA expression to determine which molecular and cellular pathways were affected by loss of AP4 and/or p53. Thereby, we determined that an important role of AP4 after activation of c-MYC in p53-proficient cells lies in the maintenance of E2F/DREAM target gene expression. Gene set enrichment analysis (GSEA) showed that while the DREAM and E2F target gene signatures were up-regulated in AP4 wild-type cells upon activation of c-MYC, they were repressed in AP4-deficient cells. Furthermore, we identified three subsets of DREAM targets that displayed distinct regulatory patterns after activation of c-MYC that were significantly affected by loss of either AP4 and/or p53. For DREAM targets showing a slight induction or repression after activation of c-MYC, deletion of AP4 in p53 wild-type cells caused significantly stronger repression (clusters 1, 2). For DREAM targets showing an induction after activation of c-MYC, deletion of AP4 in p53 wild-type cells caused significantly weaker induction (cluster 3). This effect of loss of AP4 could be abrogated or reverted by additional deletion of p53. Collectively, these differences in regulation all contributed to the regulatory patterns observed in GSEA. For the selected DREAM targets BUB1, CIT, and BRCA1, the effect of AP4 inactivation could be reverted by concomitant siRNA-mediated depletion of p21 or the DREAM complex component LIN37, providing strong evidence that the enhanced activity of the p21-DREAM axis in AP4-deficient cells is causally involved in the repression of these genes by p53 after c-MYC activation. We had previously observed that siRNA-mediated depletion of p21 reduces the number of senescent cells in AP4-deficient MEFs [36], strongly suggesting that the AP4-mediated inhibition of the p53-p21-DREAM axis may also be critical for the suppression of senescence.
The regulation of E2F activity by c-MYC is well established [48]. For example, c-MYC regulates E2F activity via direct transcriptional activation of G1 cyclins, such as Cyclin D1 and cyclin-dependent kinases (e.g., CDK4 [49]), as well as by directly inducing expression of E2F1 [50,51]. This interplay between c-MYC and E2F transcriptional activities is crucial for the control of cell-cycle progression. The results presented here strongly argue for a role of AP4 downstream of c-MYC in the regulation of E2F and DREAM activities via its repression of p21, which presumably contributes to the cell-cycle progression-enhancing effects of AP4 [12,41], as well as to the abrogation of p53 activity by c-MYC [11]. Moreover, the p53-dependent nature of the regulatory relationship between the c-MYC/AP4 axis and p21/DREAM-mediated gene repression was at least in part reflected by RNA expression correlations, as well as clinical associations in primary breast carcinomas. Since AP4 expression has been shown to be elevated in various types of cancer besides breast cancer and is associated with poor prognosis [52], this function of AP4 may also be relevant in other tumor entities.
5. Conclusions
Here we show that activation of p53 by c-MYC is largely driven by replication stress-induced DNA damage and not mediated by p14/ARF in MCF-7 breast cancer cells. After c-MYC activation, AP4 was necessary to suppress DNA damage and senescence and thereby facilitates cell proliferation. In AP4-deficient cells, p53 mediates senescence and inhibits cell proliferation. Our results show that AP4 represents a pivotal factor required for the balancing of c-MYC, E2F, and p53 activities via repressing p21 and thereby attenuating the activity of the repressive DREAM complex. This function of AP4 appears to be important for a coordinated induction of cell cycle progression by c-MYC and presumably contributes to c-MYC-driven tumorigenesis.
Supplementary Materials
The following supporting information can be downloaded at: https://www.mdpi.com/article/10.3390/cancers15041162/s1. Figure S1: Original, uncropped Western Blot images. Figure S2: Characterization of AP4- and p53-deficiency on basal and c-MYC-induced DNA damage by γH2AX staining. Figure S3: Characterization of AP4- and p53-deficiency on basal and c-MYC-induced DNA damage by Comet assays. Figure S4: Basal and c-MYC-induced formation of micronuclei in AP4- and p53-deficient cells. Figure S5: Characterization of AP4- and p53-deficiency on basal and c-MYC-induced formation of bi-nucleated cells. Figure S6: Clustering of gene expressions with genotype-dependent differences in c-MYC-mediated regulation. Figure S7: Validation of siRNA-mediated depletion of LIN37 and p21 by qPCR. Table S1: Sequence information for guide RNAs used for AP4 deletion. Table S2: Sequence information for guide p53 used for p53 deletion. Table S3: List of Antibodies used. Table S4: Oligonucleotides used for qPCR. Table S5: mRNAs significantly up- or downregulated (≥1.5× fold change) in MCF-7/pRTR-c-MYC cells (AP4 wild-type/p53 wild-type). Table S6: mRNAs significantly up- or downregulated (≥1.5× fold change) in MCF-7/pRTR-c-MYC cells (AP4 KO/p53 wild-type). Table S7: mRNAs significantly up- or downregulated (≥1.5× fold change) in MCF-7/pRTR-c-MYC cells (AP4 wild-type/p53−/−). Table S8: mRNAs significantly up- or downregulated (≥1.5× fold change) in MCF-7/pRTR-c-MYC cells (AP4 KO/p53−/−). Table S9: 2309 mRNAs with genotype-dependent differences in c-MYC-induced regulation. Table S10: E2F/DREAM targets associated with transcriptional clusters 1, 2 and 3.
Author Contributions
Conceptualization, H.H.; validation, W.S.; formal analysis, W.S. and M.K.; investigation, W.S. and M.K.; writing—original draft preparation, H.H., M.K. and W.S.; writing—review and editing, H.H. and M.K.; supervision, H.H.; funding acquisition, H.H. All authors have read and agreed to the published version of the manuscript.
Funding
This work was supported by the German Cancer Aid/Deutsche Krebshilfe (Grants 70114235 and 70112245 to H.H.) and the Rudolf-Bartling-Stiftung (to H.H.). Wenjing Shi is a recipient of a China Scholarship Council fellowship.
Data Availability Statement
RNA expression profiling data obtained in this study were deposited in the Gene Expression Omnibus website (accession no. GSE221265).
Acknowledgments
We thank Ursula Götz for technical assistance, Peter Jung for plasmids, and Raffaele Conca (von Haunersches Childrenss Hospital, Munich) for FACS sorting.
Conflicts of Interest
The authors declare no conflict of interest.
References
- Madden, S.K.; de Araujo, A.D.; Gerhardt, M.; Fairlie, D.P.; Mason, J.M. Taking the Myc out of cancer: Toward therapeutic strategies to directly inhibit c-Myc. Mol. Cancer 2021, 20, 3. [Google Scholar] [CrossRef] [PubMed]
- Green, A.R.; Aleskandarany, M.A.; Agarwal, D.; Elsheikh, S.; Nolan, C.C.; Diez-Rodriguez, M.; Macmillan, R.D.; Ball, G.R.; Caldas, C.; Madhusudan, S.; et al. MYC functions are specific in biological subtypes of breast cancer and confers resistance to endocrine therapy in luminal tumours. Br. J. Cancer 2016, 114, 917–928. [Google Scholar] [CrossRef]
- Dominguez-Sola, D.; Ying, C.Y.; Grandori, C.; Ruggiero, L.; Chen, B.; Li, M.; Galloway, D.A.; Gu, W.; Gautier, J.; Dalla-Favera, R. Non-transcriptional control of DNA replication by c-Myc. Nature 2007, 448, 445–451. [Google Scholar] [CrossRef] [PubMed]
- Wagner, A.J.; Kokontis, J.M.; Hay, N. Myc-mediated apoptosis requires wild-type p53 in a manner independent of cell cycle arrest and the ability of p53 to induce p21waf1/cip1. Genes Dev. 1994, 8, 2817–2830. [Google Scholar] [CrossRef]
- Hermeking, H.; Eick, D. Mediation of c-Myc-induced apoptosis by p53. Science 1994, 265, 2091–2093. [Google Scholar] [CrossRef] [PubMed]
- Eischen, C.M.; Weber, J.D.; Roussel, M.F.; Sherr, C.J.; Cleveland, J.L. Disruption of the ARF-Mdm2-p53 tumor suppressor pathway in Myc-induced lymphomagenesis. Genes Dev. 1999, 13, 2658–2669. [Google Scholar] [CrossRef]
- Kung, C.P.; Weber, J.D. It’s Getting Complicated-A Fresh Look at p53-MDM2-ARF Triangle in Tumorigenesis and Cancer Therapy. Front. Cell Dev. Biol. 2022, 10, 818744. [Google Scholar] [CrossRef] [PubMed]
- Farooq, U.; Notani, D. Transcriptional regulation of INK4/ARF locus by cis and trans mechanisms. Front. Cell Dev. Biol. 2022, 10, 948351. [Google Scholar] [CrossRef]
- Vafa, O.; Wade, M.; Kern, S.; Beeche, M.; Pandita, T.K.; Hampton, G.M.; Wahl, G.M. c-Myc can induce DNA damage, increase reactive oxygen species, and mitigate p53 function: A mechanism for oncogene-induced genetic instability. Mol. Cell 2002, 9, 1031–1044. [Google Scholar] [CrossRef]
- Menssen, A.; Epanchintsev, A.; Lodygin, D.; Rezaei, N.; Jung, P.; Verdoodt, B.; Diebold, J.; Hermeking, H. c-MYC delays prometaphase by direct transactivation of MAD2 and BubR1: Identification of mechanisms underlying c-MYC-induced DNA damage and chromosomal instability. Cell Cycle 2007, 6, 339–352. [Google Scholar] [CrossRef]
- Hermeking, H.; Funk, J.O.; Reichert, M.; Ellwart, J.W.; Eick, D. Abrogation of p53-induced cell cycle arrest by c-Myc: Evidence for an inhibitor of p21WAF1/CIP1/SDI1. Oncogene 1995, 11, 1409–1415. [Google Scholar]
- Jung, P.; Menssen, A.; Mayr, D.; Hermeking, H. AP4 encodes a c-MYC-inducible repressor of p21. Proc. Natl. Acad. Sci. USA 2008, 105, 15046–15051. [Google Scholar] [CrossRef]
- Dang, C.V.; O’Donnell, K.A.; Zeller, K.I.; Nguyen, T.; Osthus, R.C.; Li, F. The c-Myc target gene network. Semin. Cancer Biol. 2006, 16, 253–264. [Google Scholar] [CrossRef]
- Jackstadt, R.; Roh, S.; Neumann, J.; Jung, P.; Hoffmann, R.; Horst, D.; Berens, C.; Bornkamm, G.W.; Kirchner, T.; Menssen, A.; et al. AP4 is a mediator of epithelial-mesenchymal transition and metastasis in colorectal cancer. J. Exp. Med. 2013, 210, 1331–1350. [Google Scholar] [CrossRef]
- Huang, Q.; Raya, A.; DeJesus, P.; Chao, S.H.; Quon, K.C.; Caldwell, J.S.; Chanda, S.K.; Izpisua-Belmonte, J.C.; Schultz, P.G. Identification of p53 regulators by genome-wide functional analysis. Proc. Natl. Acad. Sci. USA 2004, 101, 3456–3461. [Google Scholar] [CrossRef]
- Ku, W.C.; Chiu, S.K.; Chen, Y.J.; Huang, H.H.; Wu, W.G.; Chen, Y.J. Complementary quantitative proteomics reveals that transcription factor AP-4 mediates E-box-dependent complex formation for transcriptional repression of HDM2. Mol. Cell. Proteom. 2009, 8, 2034–2050. [Google Scholar] [CrossRef]
- Fischer, M. Census and evaluation of p53 target genes. Oncogene 2017, 36, 3943–3956. [Google Scholar] [CrossRef]
- Fischer, M.; Schwarz, R.; Riege, K.; DeCaprio, J.A.; Hoffmann, S. TargetGeneReg 2.0: A comprehensive web-atlas for p53, p63, and cell cycle-dependent gene regulation. NAR Cancer 2022, 4, zcac009. [Google Scholar] [CrossRef] [PubMed]
- Engeland, K. Cell cycle arrest through indirect transcriptional repression by p53: I have a DREAM. Cell Death Differ. 2018, 25, 114–132. [Google Scholar] [CrossRef] [PubMed]
- Dubik, D.; Shiu, R.P. Transcriptional regulation of c-myc oncogene expression by estrogen in hormone-responsive human breast cancer cells. J. Biol. Chem. 1988, 263, 12705–12708. [Google Scholar] [CrossRef] [PubMed]
- Carroll, J.S.; Swarbrick, A.; Musgrove, E.A.; Sutherland, R.L. Mechanisms of growth arrest by c-myc antisense oligonucleotides in MCF-7 breast cancer cells: Implications for the antiproliferative effects of antiestrogens. Cancer Res. 2002, 62, 3126–3131. [Google Scholar]
- Prall, O.W.; Rogan, E.M.; Musgrove, E.A.; Watts, C.K.; Sutherland, R.L. c-Myc or cyclin D1 mimics estrogen effects on cyclin E-Cdk2 activation and cell cycle reentry. Mol. Cell Biol. 1998, 18, 4499–4508. [Google Scholar] [CrossRef] [PubMed]
- Robertson, J.F. ICI 182,780 (Fulvestrant)—The first oestrogen receptor down-regulator--current clinical data. Br. J. Cancer 2001, 85 (Suppl. S2), 11–14. [Google Scholar] [CrossRef] [PubMed]
- Chou, J.; Kaller, M.; Jaeckel, S.; Rokavec, M.; Hermeking, H. AP4 suppresses DNA damage, chromosomal instability and senescence via inducing MDC1/Mediator of DNA damage Checkpoint 1 and repressing MIR22HG/miR-22-3p. Mol. Cancer 2022, 21, 120. [Google Scholar] [CrossRef] [PubMed]
- Ran, F.A.; Hsu, P.D.; Wright, J.; Agarwala, V.; Scott, D.A.; Zhang, F. Genome engineering using the CRISPR-Cas9 system. Nat. Protoc. 2013, 8, 2281–2308. [Google Scholar] [CrossRef]
- Drost, J.; van Jaarsveld, R.H.; Ponsioen, B.; Zimberlin, C.; van Boxtel, R.; Buijs, A.; Sachs, N.; Overmeer, R.M.; Offerhaus, G.J.; Begthel, H.; et al. Sequential cancer mutations in cultured human intestinal stem cells. Nature 2015, 521, 43–47. [Google Scholar] [CrossRef]
- Livak, K.J.; Schmittgen, T.D. Analysis of relative gene expression data using real-time quantitative PCR and the 2(-Delta Delta C(T)) Method. Methods 2001, 25, 402–408. [Google Scholar] [CrossRef]
- Risso, D.; Ngai, J.; Speed, T.P.; Dudoit, S. Normalization of RNA-seq data using factor analysis of control genes or samples. Nat. Biotechnol. 2014, 32, 896–902. [Google Scholar] [CrossRef]
- Love, M.I.; Huber, W.; Anders, S. Moderated estimation of fold change and dispersion for RNA-seq data with DESeq2. Genome Biol. 2014, 15, 550. [Google Scholar] [CrossRef]
- Korotkevich, G.; Sukhov, V.; Sergushichev, A. Fast gene set enrichment analysis. bioRxiv 2019, 060012. [Google Scholar] [CrossRef]
- Stephens, M. False discovery rates: A new deal. Biostatistics 2016, 18, 275–294. [Google Scholar] [CrossRef] [PubMed]
- Liberzon, A.; Birger, C.; Thorvaldsdottir, H.; Ghandi, M.; Mesirov, J.P.; Tamayo, P. The Molecular Signatures Database (MSigDB) hallmark gene set collection. Cell Syst. 2015, 1, 417–425. [Google Scholar] [CrossRef]
- Oki, S.; Ohta, T.; Shioi, G.; Hatanaka, H.; Ogasawara, O.; Okuda, Y.; Kawaji, H.; Nakaki, R.; Sese, J.; Meno, C. ChIP-Atlas: A data-mining suite powered by full integration of public ChIP-seq data. EMBO Rep. 2018, 19, e46255. [Google Scholar] [CrossRef]
- Robinson, J.T.; Thorvaldsdottir, H.; Winckler, W.; Guttman, M.; Lander, E.S.; Getz, G.; Mesirov, J.P. Integrative genomics viewer. Nat. Biotechnol. 2011, 29, 24–26. [Google Scholar] [CrossRef] [PubMed]
- Cancer Genome Atlas, N. Comprehensive molecular portraits of human breast tumours. Nature 2012, 490, 61–70. [Google Scholar] [CrossRef] [PubMed]
- Jackstadt, R.; Jung, P.; Hermeking, H. AP4 directly downregulates p16 and p21 to suppress senescence and mediate transformation. Cell Death Dis. 2013, 4, e775. [Google Scholar] [CrossRef]
- Fischer, M.; Grossmann, P.; Padi, M.; DeCaprio, J.A. Integration of TP53, DREAM, MMB-FOXM1 and RB-E2F target gene analyses identifies cell cycle gene regulatory networks. Nucleic Acids Res. 2016, 44, 6070–6086. [Google Scholar] [CrossRef]
- Fischer, M.; Quaas, M.; Steiner, L.; Engeland, K. The p53-p21-DREAM-CDE/CHR pathway regulates G2/M cell cycle genes. Nucleic Acids Res. 2016, 44, 164–174. [Google Scholar] [CrossRef]
- Uxa, S.; Bernhart, S.H.; Mages, C.F.S.; Fischer, M.; Kohler, R.; Hoffmann, S.; Stadler, P.F.; Engeland, K.; Muller, G.A. DREAM and RB cooperate to induce gene repression and cell-cycle arrest in response to p53 activation. Nucleic Acids Res. 2019, 47, 9087–9103. [Google Scholar] [CrossRef]
- Jaeckel, S.; Kaller, M.; Jackstadt, R.; Gotz, U.; Muller, S.; Boos, S.; Horst, D.; Jung, P.; Hermeking, H. Ap4 is rate limiting for intestinal tumor formation by controlling the homeostasis of intestinal stem cells. Nat. Commun. 2018, 9, 3573. [Google Scholar] [CrossRef]
- Jackstadt, R.; Hermeking, H. AP4 is required for mitogen- and c-MYC-induced cell cycle progression. Oncotarget 2014, 5, 7316–7327. [Google Scholar] [CrossRef] [PubMed]
- Wu, X.; Bayle, J.H.; Olson, D.; Levine, A.J. The p53-mdm-2 autoregulatory feedback loop. Genes Dev. 1993, 7, 1126–1132. [Google Scholar] [CrossRef] [PubMed]
- Honda, R.; Tanaka, H.; Yasuda, H. Oncoprotein MDM2 is a ubiquitin ligase E3 for tumor suppressor p53. FEBS Lett. 1997, 420, 25–27. [Google Scholar] [CrossRef] [PubMed]
- Sherr, C.J. Tumor surveillance via the ARF-p53 pathway. Genes Dev. 1998, 12, 2984–2991. [Google Scholar] [CrossRef]
- Craig, C.; Kim, M.; Ohri, E.; Wersto, R.; Katayose, D.; Li, Z.; Choi, Y.H.; Mudahar, B.; Srivastava, S.; Seth, P.; et al. Effects of adenovirus-mediated p16INK4A expression on cell cycle arrest are determined by endogenous p16 and Rb status in human cancer cells. Oncogene 1998, 16, 265–272. [Google Scholar] [CrossRef]
- Hollestelle, A.; Nagel, J.H.; Smid, M.; Lam, S.; Elstrodt, F.; Wasielewski, M.; Ng, S.S.; French, P.J.; Peeters, J.K.; Rozendaal, M.J.; et al. Distinct gene mutation profiles among luminal-type and basal-type breast cancer cell lines. Breast Cancer Res. Treat. 2010, 121, 53–64. [Google Scholar] [CrossRef]
- Ray, S.; Atkuri, K.R.; Deb-Basu, D.; Adler, A.S.; Chang, H.Y.; Herzenberg, L.A.; Felsher, D.W. MYC can induce DNA breaks in vivo and in vitro independent of reactive oxygen species. Cancer Res. 2006, 66, 6598–6605. [Google Scholar] [CrossRef]
- Bretones, G.; Delgado, M.D.; Leon, J. Myc and cell cycle control. Biochim. Biophys. Acta 2015, 1849, 506–516. [Google Scholar] [CrossRef]
- Hermeking, H.; Rago, C.; Schuhmacher, M.; Li, Q.; Barrett, J.F.; Obaya, A.J.; O’Connell, B.C.; Mateyak, M.K.; Tam, W.; Kohlhuber, F.; et al. Identification of CDK4 as a target of c-MYC. Proc. Natl. Acad. Sci. USA 2000, 97, 2229–2234. [Google Scholar] [CrossRef]
- Amati, B.; Alevizopoulos, K.; Vlach, J. Myc and the cell cycle. Front. Biosci 1998, 3, d250–d268. [Google Scholar] [CrossRef]
- Lutz, W.; Leon, J.; Eilers, M. Contributions of Myc to tumorigenesis. Biochim. Biophys. Acta 2002, 1602, 61–71. [Google Scholar] [CrossRef] [PubMed]
- Wong, M.M.; Joyson, S.M.; Hermeking, H.; Chiu, S.K. Transcription Factor AP4 Mediates Cell Fate Decisions: To Divide, Age, or Die. Cancers 2021, 13, 676. [Google Scholar] [CrossRef] [PubMed]
Disclaimer/Publisher’s Note: The statements, opinions and data contained in all publications are solely those of the individual author(s) and contributor(s) and not of MDPI and/or the editor(s). MDPI and/or the editor(s) disclaim responsibility for any injury to people or property resulting from any ideas, methods, instructions or products referred to in the content. |
© 2023 by the authors. Licensee MDPI, Basel, Switzerland. This article is an open access article distributed under the terms and conditions of the Creative Commons Attribution (CC BY) license (https://creativecommons.org/licenses/by/4.0/).