Article

18F-FDOPA PET/CT Combined with MRI for Gross Tumor Volume Delineation in Patients with Skull Base Paraganglioma

1
Biophysics and Nuclear Medicine, University Hospitals of Strasbourg, 67098 Strasbourg, France
2
Radiophysics, Centre Paul-Strauss, UNICANCER, 67065 Strasbourg, France
3
Radiotherapy, Centre Paul-Strauss, 67065 Strasbourg, France
4
ICube, University of Strasbourg/CNRS (UMR 7357) and FMTS, Faculty of Medicine, 67000 Strasbourg, France
5
Internal Medicine, University Hospitals of Strasbourg, Strasbourg University, 67098 Strasbourg, France
6
Radiology, University Hospitals of Strasbourg, Strasbourg University, 67098 Strasbourg, France
7
Otolaryngology and Maxillofacial Surgery, University Hospitals of Strasbourg, 67098 Strasbourg, France
8
Université de Strasbourg, CNRS, IPHC UMR 7178, Centre Paul Strauss, UNICANCER, 67065 Strasbourg, France
*
Author to whom correspondence should be addressed.
Cancers 2019, 11(1), 54; https://doi.org/10.3390/cancers11010054
Submission received: 15 November 2018 / Revised: 30 December 2018 / Accepted: 2 January 2019 / Published: 8 January 2019
(This article belongs to the Special Issue Pheochromocytoma (PHEO) and Paraganglioma (PGL))

Abstract

:
In this simulation study, we assessed differences in gross tumor volume (GTV) in a series of skull base paragangliomas (SBPGLs) using magnetic resonance imaging (MRI), 18F-dihydroxyphenylalanine (18F-FDOPA) combined positron emission tomography/computed tomography (PET/CT), and 18F-FDOPA PET/MRI images obtained by rigid alignment of PET and MRI. GTV was delineated in 16 patients with SBPGLs on MRI (GTVMRI), 18F-FDOPA PET/CT (GTVPET), and combined PET/MRI (GTVPET/MRI). GTVPET/MRI was the union of GTVMRI and GTVPET after visual adjustment. Three observers delineated GTVMRI and GTVPET/MRI independently. Excellent interobserver reproducibility was found for both GTVMRI and GTVPET/MRI. GTVPET and GTVMRI were not significantly different. However, there was some spatial difference between the locations of GTVMRI, GTVPET, and GTVPET/MRI. The Dice similarity coefficient median value was 0.4 between PET/CT and MRI, and 0.8 between MRI and PET/MRI. The combined use of PET/MRI produced a larger GTV than MRI alone. Nevertheless, both the target-delivered dose and organs-at-risk conservancy were respected when treatment was planned on the PET/MRI-matched data set. Future integration of 18F-FDOPA PET/CT into clinical practice will be necessary to evaluate the influence of this diagnostic modality on SBPGL therapeutic management. If the clinical utility of 18F-FDOPA PET/CT and/or PET/MRI is confirmed, GTVPET/MRI should be considered for tailored radiotherapy planning in patients with SBPGL.

1. Introduction

Head and neck paragangliomas (HNPGLs) are rare and slow-growing tumors that result from paraganglia, neural crest-derived clusters of neuroendocrine cells. HNPGLs account for about 70% of extra-adrenal PGLs and develop from parasympathetic paraganglia of the jugular bulb and carotid body, or along the tympanic branch of the glossopharyngeal nerve, the vagus nerve, and its auricular branch [1]. About a third of HNPGLs are hereditary, mostly related to the mutation of the succinate dehydrogenase (SDH) complex genes [2]. When malignant, HNPGLs generally spread into the regional lymph nodes, lung, and bone [3]. Magnetic resonance imaging (MRI) and MR angiography are very accurate for tumor detection and local extension definition [4]. Combined positron emission tomography and computed tomography (PET/CT) with 18F-dihydroxyphenylalanine (18F-FDOPA) is highly sensitive (91%) and specific (95%) and is currently proposed as the first-line nuclear imaging modality in HNPGLs both at staging and during the post-treatment follow-up [5,6,7]. Once internalized, 18F-FDOPA is decarboxylated to 18F-dopamine, transported and stored in secretory vesicles. Indirectly, in PGLs, 18F-FDOPA uptake reflects the pathological up-regulation of the catecholamine biosynthetic pathway [8].
Treatment of HNPGLs is often personalized and influenced by genetic status, lesion size and location, tumoral multifocality, patient age, and comorbidities [9]. Radiotherapy and stereotactic radiotherapy are proposed as valuable therapeutic options for HNPGLs as they are less invasive than surgery, especially for patients with skull-base paragangliomas (SBPGLs) [10,11,12,13]. Due to continuing technological advances, the role of such treatments has increased progressively in the last few decades, achieving excellent rates of local tumor control and patient outcome with few iatrogenic effects [14]. It is important to underline that PGLs are frequently characterized by slow cellular turnover rates, efficient DNA repair mechanisms, and consequently low radiosensitivity, requiring an elevated radiation dose to overcome radioresistance. On the other hand, the presence of surrounding critical neuroanatomical structures is an important factor to be taken into account, usually limiting the tumor’s delivered dose [13]. The definition of gross tumor volume (GTV) is the first step of primary importance in planning external radiation therapy and is strictly related to the final irradiated volume. In the last few decades, continuous and successful technical improvements for external radiotherapy treatment have been seen, leading to the development of highly conformal intensity-modulated radiation therapy (IMRT) and personalized irradiation approaches. Consequently, remarkable efforts have been made to optimize GTV delineation. The current availability of hybrid multimodality imaging is gradually changing the paradigm for radiotherapy planning definition, which is classically based on CT or MRI imaging. Tumor morphological definition and functional characterization, combined in a single diagnostic exploration (i.e., PET/CT), could improve the definition of both GTV, which will receive the highest dose, and clinical target volume (CTV), which includes the subclinical tumor extension not visible on imaging modalities and subjective for many locations. Moreover, the recent availability of PET/MRI devices offers the potential advantages of high soft-tissue contrast and functional MRI capability to improve the diagnosis of cancer and its phenotype characterization. Several authors showed that the combination of MRI and PET potentially improves the accuracy of both the primary tumor and metastatic lymph node delineation in patients with HN malignancies, with consequent clinical advantages in disease control and toxicity reduction [15,16]. At present, radiotherapy planning for HNPGLs is defined utilizing contrast-enhanced CT and/or MRI. Metabolic information provided by PET/CT is only sporadically integrated. Moreover, no definitive consensus has been reached on the optimal modality for GTV definition on 18F-FDOPA PET/CT in patients with HNPGLs. On the other hand, semi-quantitative uptake parameters such as the tumor-to-brain ratio (TBR) were successfully used to delineate gliomas on PET imaging with radiolabeled amino acids [17,18,19,20,21]. Overall, despite potential diagnostic advantages related to functional imaging [22], to our knowledge there are no reports concerning the use of 18F-FDOPA PET/CT to delineate target volumes in patients with HNPGLs. In view of the above, the purpose of this simulation study was to assess the differences in GTV using contrast-enhanced MRI, 18F-FDOPA PET/CT, and combined PET/MRI images in a series of SBPGLs. We also evaluated the safety of irradiation therapy using PET/MRI fusion images, and in selected patients, compared the radiation treatment planning and dosimetry obtained from GTV assessed by MRI, which is the standard at several institutions, and PET/MRI-registered images.

2. Results

2.1. Patients

Sixteen consecutive patients with jugulotympanic SBPGLs were retrospectively included (nine men and seven women, mean age: 57 years, range: 37–84 years). Patient characteristics are detailed in Table 1. Seven and nine patients were evaluated at primary staging and during follow-up, respectively, because of clinical suspicion of tumor recurrence. Previous treatment included surgery, radiotherapy, and 90Y-DOTATOC peptide receptor radionuclide therapy in seven, three, and three patients, respectively. Two patients were succinate dehydrogenase subunit B (SDHB) and SDHC mutation carriers. In the remaining 14 cases, the PGLs were apparently sporadic. No patient presented with regional lymph nodes or systemic metastases at the time of diagnostic imaging.

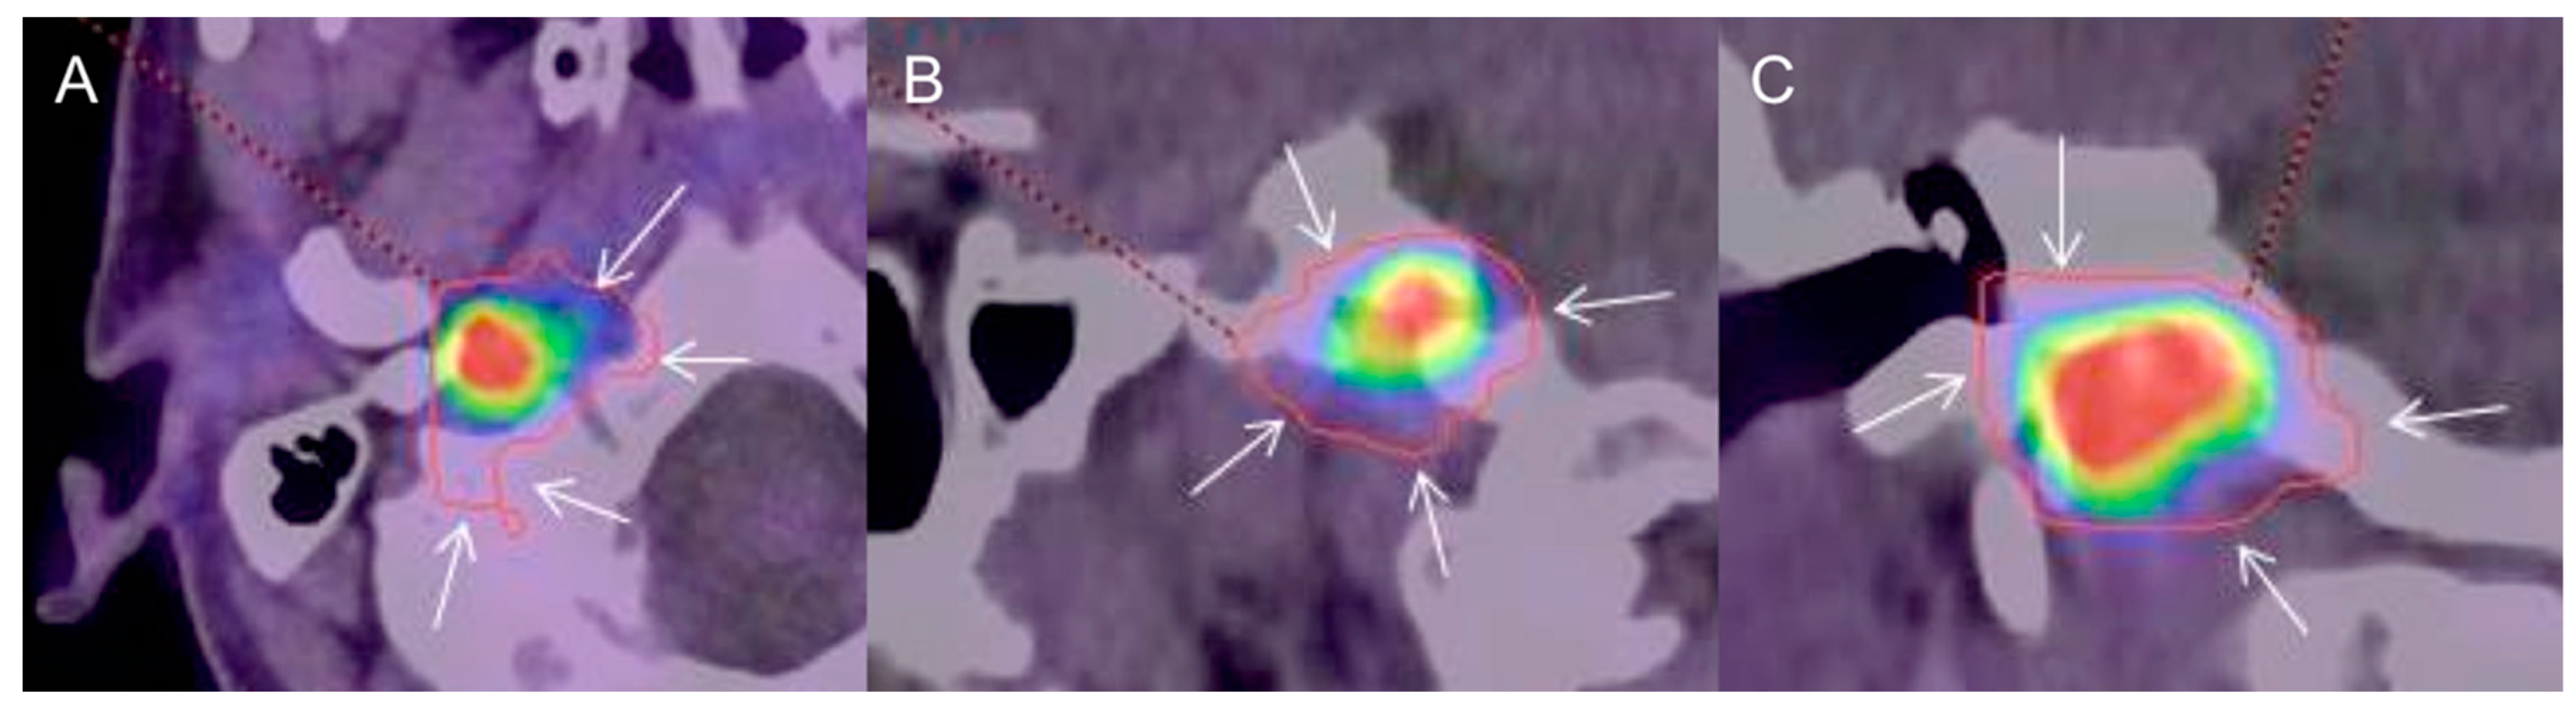
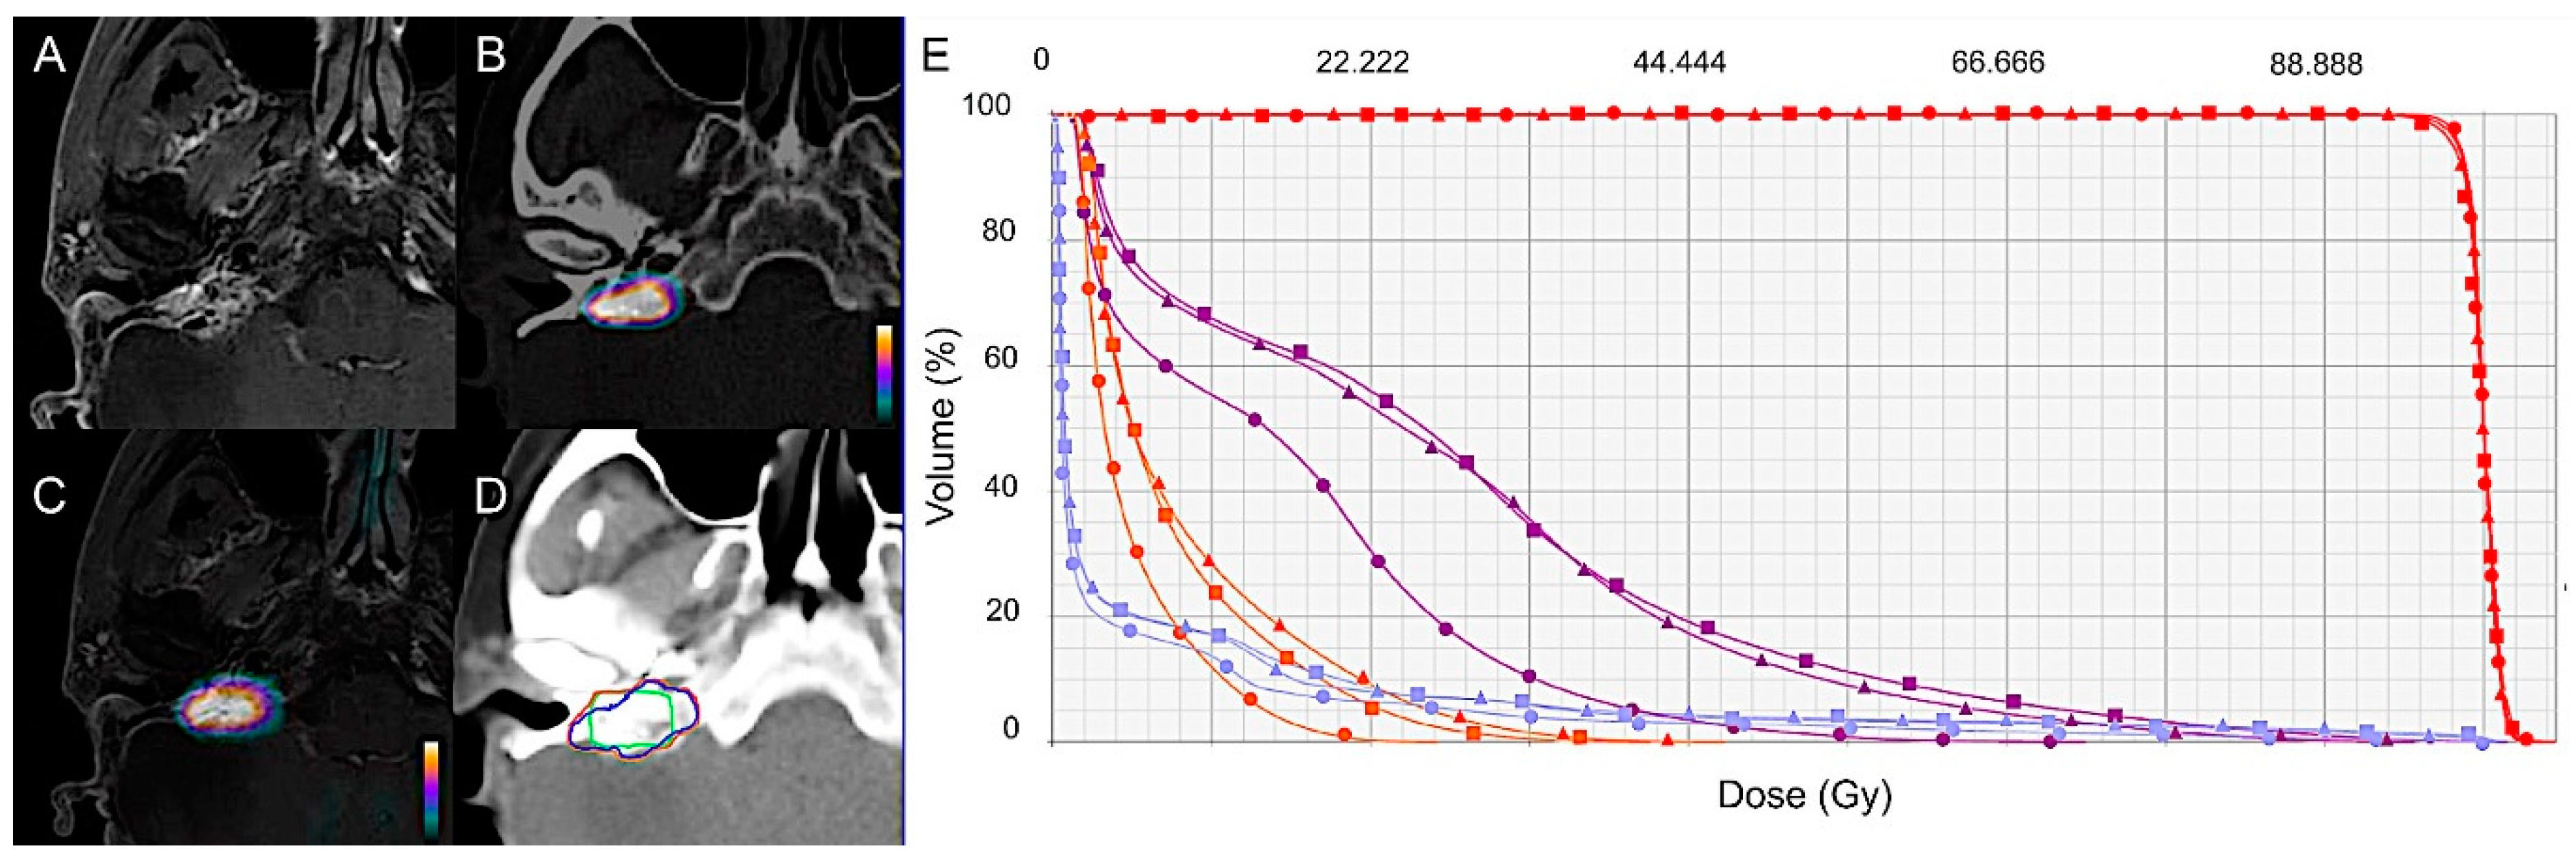
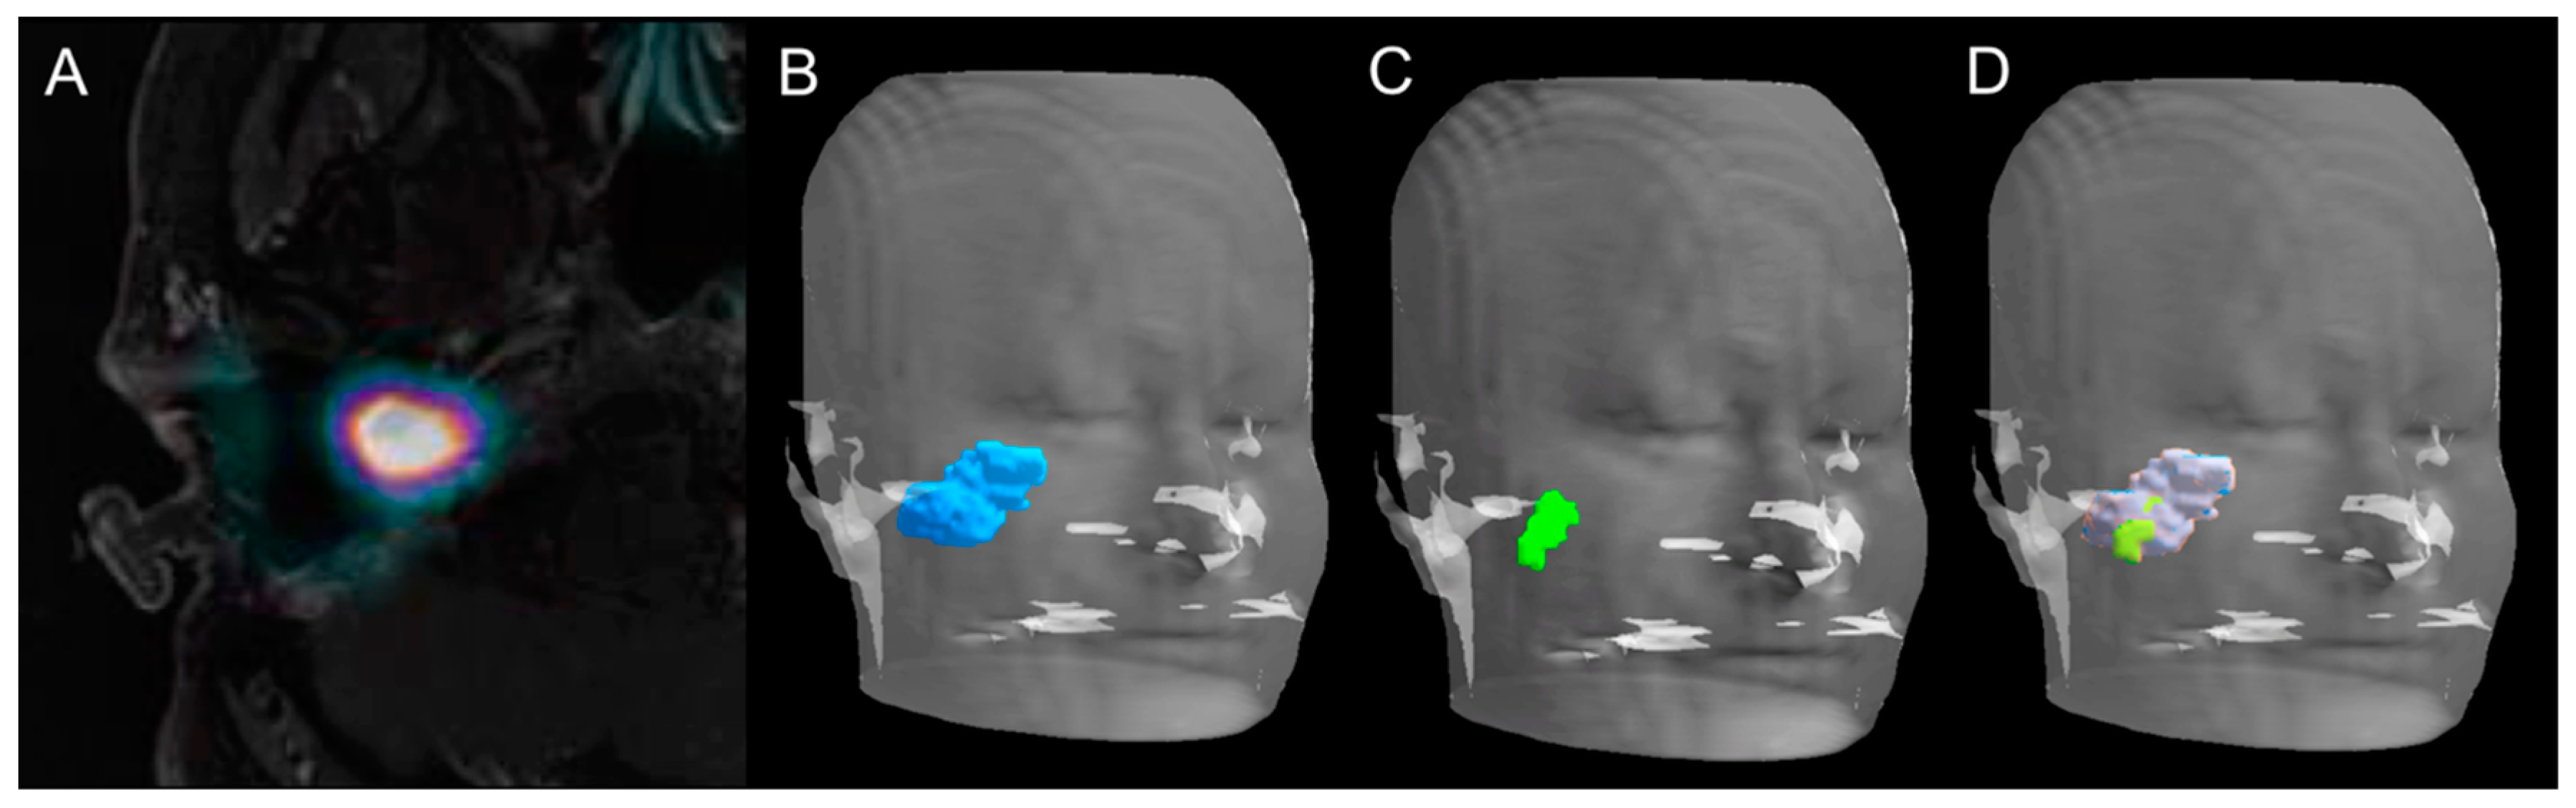
2.2. Tumor Volume Assessment

• MRI
The median lesion size was 17 mm (range: 7–40 mm). The median values of GTVMRI were 1.4 cm3 (range: 0.2–8.6 cm3), 1.7 cm3 (range: 0.3–9.6 cm3), and 1.2 cm3 (range: 0.2–8.7 cm3) for the three observers. According to intraclass correlation coefficient (ICC) analysis, MRI was a highly reproducible method for GTV delineation (agreement coefficient: 0.95). The GTVMRI assessed by the most experienced radiation oncologist (observer 1) was considered for the definition of both CTVMRI (median value: 26.2 cm3; range: 11.9–51.2 cm3), and planning target volume (PTVMRI) (median value: 54.1 cm3; range: 21.8–79.1 cm3).
• 18F-FDOPA PET/CT and PET/MRI
Despite substantial heterogeneity of tumoral 18F-FDOPA uptake among the patients studied, SBPGLs were distinctly detectable by PET/CT in all cases (median value of maximum standardized uptake value (SUVmax): 11.5; range: 1.4–82.8). The median value of GTVPET was 0.9 cm3 (range: 0.3–17.1 cm3). In this series, although GTVPET was lower than GTVMRI, no significant difference was assessed when considering the entire population (p = 0.09), or only previously treated patients (p = 0.12), or only treatment-naïve patients (p = 1). GTVTBR (median value: 5.1 cm3; range: 0.3–26.1 cm3) was significantly larger than both GTVPET (p = 0.01) and GTVMRI (p = 0.006). GTVTBR largely exceeded tumoral boundaries on PET images, including several extratumoral voxels (with a similar activity to that of the background), often protruding in apparently healthy bone structures and an adjacent vasculonervous pedicle (Figure 1). Therefore, GTVTBR has not been further considered and the GTVPET/MRI was assessed combining GTVMRI and GTVPET after visual adjustment by the radiation oncologist. The median values of GTVPET/MRI were 3.2 cm3 (range: 0.5–18.8 cm3), 2.7 cm3 (range: 0.3–11.8 cm3), and 2.3 cm3 (range: 0.4–17.1 cm3) for the three observers. ICC analysis showed excellent interobserver reproducibility with an agreement coefficient of 0.91. GTVPET/MRI assessed by the most experienced radiation therapist (observer 1) was used to estimate both CTVPET/MRI (median value: 33.8 cm3; range: 15–82.7 cm3) and PTVPET/MRI (median value: 62.7 cm3; range: 26.5–112.7 cm3). GTVPET/MRI, CTVPET/MRI, and PTVPET/MRI were significantly larger than GTVMRI (p = 0.00003), CTVMRI (p = 0.003), and PTVMRI (p = 0.003), respectively. The details of GTV comparison between MRI and PET/CT, and between MRI and PET/MRI are reported in Table 2.

2.3. Positional GTV Assessment

There was some spatial difference between the locations of GTV delineated on MRI, PET/CT, and PET/MRI (Figure 2 and Figure 3). According to the analysis of positional variability of GTVs, the median intersection volume between GTVPET and GTVMRI was 0.6 cm3 (range: 0.1–6.0 cm3), and between GTVMRI and GTVPET/MRI it was 1.5 cm3 (range: 0.3–9.3 cm3). The median DSC was 0.4 (range: 0.1–0.8) between PET and MRI, and 0.8 (range: 0.4–1) between MRI and PET/MRI. The intersection volume between GTVPET and GTVMRI correlated positively with the size of the lesion (R = 0.84, p = 0.0001) and was significantly lower (p = 0.04) in patients with relapsing tumor (median: 0.9 cm3; range: 0.3–12.1 cm3) compared to newly diagnosed patients (median: 2.4 cm3; range: 1.2–8.8 cm3). Table 2 summarizes the results of positional GTV analysis and the DSC index.
Uniform expansions of the GTVMRI contours were performed in increments of 1 mm until 100% of the GTVPET/MRI was covered. An average expansion of 7 mm (median: 7 mm; range: 2–9 mm) beyond contrast-enhanced T1-weighted MRI contours was necessary to cover 100% of the 18F-FDOPA PET/MRI primary tumor volume. Finally, a mean contraction of 3.6 mm (median: 3 mm; range: 1–8 mm) of CTVMRI made it possible to encompass the GTVPET/MRI.

2.4. Radiation Treatment Planning

MRI and PET/MRI-based radiation treatment planning was assessed in three patients with apparently sporadic relapsing jugulotympanic PGLs (Table 1, cases 2, 3, and 5). Patients were selected according to tumor size aiming to simulate treatment for tumors of different sizes, ranging from a few millimeters to several centimeters. Detailed results of the dosimetric evaluation in each patient are listed in Table 3 and Table 4. Overall, all the plans generated on 18F-FDOPA PET/MRI were able to respect clinical objectives despite the size discrepancy existing between GTVMRI and GTVPET/MRI. PTVMRI and PTVPET/MRI plans were similar concerning both target delivered dose and OAR conservancy (deviation under 2.7% of prescription dose and 0.6% of OAR volume for dose and volume, respectively) without underdosing of GTVPET/MRI compared to target volumes generated on treatment plans using MRI alone (Table 3, Figure 3). Dosimetric details concerning tumoral target and OAR are reported in Table 4.

3. Discussion

To our knowledge, the present study evaluates for the first time the differences in GTV delineation using contrast-enhanced MRI, 18F-FDOPA PET/CT, and combined PET/MRI images in patients with SBPGLs. We also compared the radiation treatment planning based on the MRI and PET/MRI data set, suggesting the safety of irradiation therapy using PET/MRI fusion images showing no differences in tumor-delivered dose and OAR conservancy between MRI- and PET/MRI-based radiation planning, regardless of the intermodality degree of volumetric agreement.
Although there were individual cases with greater volumetric disparities, GTVPET and GTVMRI were not significantly different. However, a trend toward significance was observed when considering the entire patient cohort, and the lack of statistical significance might be due to the limited number of patients studied. GTVPET/MRI, which was defined as the union of GTVMRI and GTVPET after adjustment by a radiation oncologist, encompasses nearly all GTV regions. An average expansion of 7 mm beyond the MRI T1-gadolinum contours allowed 100% coverage of the 18F-FDOPA PET/MRI volumes. Accordingly, as expected, the combined use of PET/MRI produced a larger GTV than MRI alone. In spite of this, both target delivered dose and OAR conservancy were respected when PTV was planned on MRI or the PET/MRI matched data set, probably due to the slight positional discordance as shown by the good DSC average value (0.8). V95 (i.e.: volume of PTV receiving 95% of prescription) was near the prescribed dose and was not significantly different between MRI- and PET/MRI-based GTVs for each patient and on average.
The integration of 18F-FDOPA PET/CT to MRI was evaluated for radiotherapy planning of gliomas. In these patients, 18F-FDOPA PET/CT generated larger target volumes compared to the standard-of-care MRI. The result was a customization of radiotherapy plans by the inclusion of “metabolic disease” without contrast enhancement [23,24,25]. Navarria et al. emphasized the idea of “biologic tumor volume” in a population of 69 patients with high-grade gliomas [26]. They showed that 50% of radiotherapy failures occurred outside the contrast-enhanced volume on T1-weighted MRI sequences and would have been included within the target volume generated according to 11C-methionine PET.
DSC analysis revealed incongruences of GTV position between MRI and 18F-FDOPA PET/CT in patients with SBPGL, warranting further investigations, longitudinal patient follow-up, and histopathology correlation. Overlap differences between GTVMRI and GTVPET could be attributable to several factors and needs to be discussed. First of all, no hybrid PET/MRI device was used for patient exploration. Indeed, for GTV delineation, the PET/CT and MRI data set were matched using a semi-automated volume-based registration algorithm with consequent potential spatial uncertainty in target volume identification induced by image misalignment. Secondly, a semi-automated SUVmax-based segmentation algorithm was used to outline the target volume on PET/CT images, taking into account the value of 40% of SUVmax according to 18F-Fluorodeoxyglucose (18F-FDG) PET/CT-related literature in general oncology. As reported, automated methods of image segmentation would be preferable to determine the metabolically active tumor volume (MATV) [27]. MATV delineation based on semi-quantitative uptake parameters such as the TBR has long been used for PET imaging of brain tumors with radiolabeled amino acids. In a biopsy-controlled study using 18F-Fluoroethyl-l-tyrosine (18F-FET) PET in patients with brain tumors [17], a threshold value of 1.6 over the background uptake was taken as the reference for a semi-automatic definition of tumor volume (GTVTBR). Based on the assumption that the TBR contrast of 18F-FDOPA uptake in brain tumor is similar to that of 18F-FET [20,21], other authors successfully adopted the same approach in patients with gliomas investigated by 18F-FDOPA PET/CT [18,19]. In our patients, GTVTBR assessed in a similar manner was significantly larger than that obtained using 40% of tumor SUVmax or MRI. Moreover, GTVTBR largely exceeded tumoral limits on PET images, covering apparently healthy bone or adjacent vasculonervous structures (Figure 1). Therefore, both the lack of biopsy-proven evidence of tumoral invasion (contrary to what Pauleit et al. have proven in gliomas [17]) and the potential high risk of radiation after-effects require further investigation before clinical utilization of this type of delineation method for SBPGLs. The heterogeneity of tumor size, ranging from 7 mm to 40 mm, and the high inter-tumor variability of 18F-FDOPA uptake (range: 1.4–82.8) could contribute to explaining the difficulty in properly defining GTVTBR, especially for lesions with metabolic activity as high as PGLs. Interestingly, in our population, the overall mean TBR was 16.3 (range: 1.4–83.4), approximately nine-fold higher than the TBR reported for brain tumors on 18F-FDOPA PET studies (1.76 ± 0.60) [18]. Finally, optimal 18F-FDOPA PET/CT segmentation algorithms for SBPGL GTVPET contouring need to be optimized, also taking into account the lessons learned from patients with gliomas.
The third and last point to discuss concerns the population studied for GTV delineation, including patients naïve of treatment and subjects with relapsing tumors after surgery and/or radiotherapy. The iatrogenic distortion of regional anatomic architecture may lead to modification of vascular patterns and tissue enhancement on CT and MRI studies. Contrast medium arrival during the early arterial phases could be delayed and less pronounced, leading to erroneous image interpretations in patients with relapsing local disease [7,28]. Interestingly, overlap differences between GTVPET and GTVMRI were more pronounced for relapsing tumor compared to newly diagnosed lesions. In those patients, an average 46% of the 18F-FDOPA PET/CT target volume extended outside GTVMRI showing no pathological gadolinium enhancement. Integration of PET to MRI data could be advantageous for GTV delineation in previously treated patients due to a potentially challenging definition of tumoral infiltration [7]. In view of the above, the availability of PET/MRI hybrid devices will lead to radiotherapy planning based on spatially and temporally registered morphofunctional images [29].
It is important to underline that the majority of patients included in the present study presented with relatively small, benign and sporadic SBPGLs and that even the two cases of SDH-related PGLs did not have regional lymph node metastases. Consequently, to confirm our preliminary results, additional studies are required including patients with more aggressive and locally advanced tumors, in which modifications of GTV could have an important dosimetric impact and possibly clinical consequences. An additional attractive axis of clinical research, which would advance a further step towards the transition from the morphological tumor volume to the morphofunctional tumor volume concept, could be the comparison of 18F-FDOPA, 18F-FDG, and 68Ga-DOTA-peptides for PET-based GTV delineation.
In a real clinical scenario, one more point of volumetric uncertainty is the definition of CTV usually made on CT or MRI. Ligtenberg et al. [30] recently determined the modality-specific CTV margins for CT, MRI, and 18F-FDG PET in patients with laryngohypopharyngeal tumors. Although GTV overestimated the tumor volume in all modalities, CTV margins were needed to achieve complete tumor delineation. Interestingly, PET-based CTVs were the smallest and considered to be the most accurate, while MRI-based CTVs were larger than PET- and CT-based CTVs. In our patient population, by a mean contraction of 3.6 mm (median: 3 mm; range: 1–8 mm) of CTVMRI, we encompassed every GTVPET/MRI. This observation could contribute to the debate regarding the choice of CTV threshold, suggesting a role of hybrid PET/MRI imaging to modulate CTV margin expansion tailored to each clinical situation. It is possible that increased accuracy in GTV delineation with PET/MRI could allow the application of smaller CTV margins, possibly reducing toxicity while conserving reliability in tumor coverage and treatment efficacy.
Another advantage of multimodality imaging is likely the ability to specify a volume at high risk of relapse, which could be better controlled by the use of simultaneous integrated boost (SIB). This method has already been used in several tumors without deterioration of OAR protection [31,32].

4. Materials and Methods

4.1. Patients

The medical records of patients with clinical, radiological, and/or pathological diagnosis of HNPGLs referred to the Nuclear Medicine Department of Strasbourg University Hospitals from May 2012 to April 2017 for 18F-FDOPA PET/CT were retrospectively reviewed. Only patients with confirmed SBPGLs, with positive 18F-FDOPA PET/CT findings, and who underwent MRI within less than 3 months of 18F-FDOPA PET/CT were retrospectively included. Conversely, patients without a final diagnosis of PGL, or patients with PGLs not arising from the skull base, or patients for whom MRI data were not fully available were not selected for the study.
Consistent with local institutional guidelines, all patients included gave free and informed consent for the use of anonymous personal medical data extracted from their file for scientific purposes. The local institutional review board approved this retrospective study (FC/dossier 2018-49).

4.2. Reference Diagnostic Imaging

HN MRI investigations were performed with a 1.5-T (Avanto, Siemens, Medical Systems, Erlangen, Germany) or a 3-T (Signa, General Electric Medical System, Milwaukee, WI, USA) scanner. Morphological T1-weighted contrast-enhanced axial and coronal images with a 1-mm slice thickness were used for diagnostic purposes and for radiotherapy volume delineation. 18F-FDOPA PET/CT scans were performed using a combined PET/CT equipped by time of flight measurement capacity (Biograph mCT, Siemens Medical Systems, Erlangen, Germany). 18F-FDOPA was used in the setting of approved marketing authorization. Patients fasted for at least 4 h before tracer injection. In all patients, 4 MBq/kg of 18F-FDOPA was intravenously injected without carbidopa premedication. Whole-body 18F-FDOPA PET/CT acquisition was performed about 30 min after radiotracer injection from the top of the skull to the upper thigh (4 min per step) starting from the head. CT studies for attenuation correction and anatomic registration were performed without administration of contrast medium. PET data were reconstructed iteratively. CT, PET (after attenuation correction), and PET/CT images were displayed on a dedicated workstation for analysis. A focal area of increased 18F-FDOPA uptake in a usual anatomical site for paraganglia was considered as a positive finding. The tumor maximum standardized uptake value (SUVmax) was defined within a spherical volume of interest (VOI) centered on the tumor and including it completely. To obtain PET/MRI images, 18F-FDOPA PET/CT were matched and registered with T1-weighted contrast-enhanced MRI including the whole SBPGL. MRI sequences were rigidly aligned to the CT data set of PET/CT using a semi-automated volume-based registration algorithm (Focal software, CMS-XIO).

4.3. Tumor Volume Assessment

Tumor volumes and radiation plans based on 18F-FDOPA PET/CT, MRI, and matched PET/MRI images were delineated for research purposes only and were not used prospectively for radiation treatment planning in any patient. GTV encompasses the recognizable macroscopic tumor infiltration and defines both the extent and position of the primary tumor. In our series, GTV was assessed on the MRI (GTVMRI), 18F-FDOPA PET/CT (GTVPET), and matched PET/MRI data set (GTVPET/MRI). Two experienced radiation oncologists (observers 1 and 2) and one nuclear medicine physician (observer 3) independently performed the GTV delineation on MRI and fused PET/MRI data while aware of patient clinical history. To prevent biases, 18F-FDOPA PET/CT results were not available before GTVMRI definition. Similarly, GTVMRI data were not accessible before GTVPET/MRI delineation. GTVMRI was delineated using axial contrast-enhanced T1-weighted MRI images. GTVPET was assessed on axial images using the automatic assistant arbitrarily calibrated at 40% of SUVmax of the primary tumor (Syngo.via VB10B, Siemens) according to the 18F-FDG PET/CT-related literature in clinical oncology [33]. To delineate SBPGL on PET/CT imaging, the tumor-to-brain ratio (TBR) was also used. Based on previous studies on gliomas [17,18,19,20,21], a threshold value of 1.6 over the background uptake was taken as the reference for a semi-automatic definition of tumor volume (GTVTBR). To measure background activity, a large region of interest above the upper ventricle and including both gray and white matter was used. Lastly, GTVPET/MRI was the union of GTVMRI and GTVPET and the final contour assessment was made based on visual adjustment of the images by the treating radiation oncologist. MRI- and PET/CT-related GTV and intersection volume were assessed using ARTIVIEW™ software (AQUILAB®, Lille, France). Concordance between GTVMRI and GTVPET contours and between GTVMRI and GTVPET/MRI contours was evaluated according to the Dice similarity coefficient (DSC), a validated index measuring spatial overlap between two volumes. The DSC was calculated as follows: 2 × (A ∩ B)/(A + B), where A and B represent two volumes, (A ∩ B) represents the volume of intersection, and (A + B) represents the sum of their volumes. A DSC ≥ 0.7 can be considered as a “good” overlap [34]. According to the standard of care of our institution, CTV and PTV of patients were defined by adding a 10-mm three-dimensional (3D) margin to GTV and a 3-mm 3D margin to CTV, respectively. Hence, starting from GTV, we assessed CTV and PTV on the MRI (CTVMRI, PTVMRI), 18F-FDOPA PET/CT (CTVPET, PTVPET), and matched PET/MRI data set (CTVPET/MRI, PTVPET/MRI).

4.4. Radiation Treatment Planning

Dosimetric evaluation was performed for research purposes only aiming to assess the potential consequence of any volumetric differences between gold standard MRI and new PET/MRI-related GTV. In other words, we researched the eventual reduction of tumoral dose delivered when metabolic GTVPET data were combined with GTVMRI. Complete radiation treatment planning was assessed for volumetric-modulated arc therapy (VMAT). VMAT is a technique for IMRT that simultaneously combines varying dose rate, gantry speed, and the shape of the multileaf collimator aperture [35]. VMAT plans were generated using the Eclipse treatment planning system (version 11.0.31, Varian Medical Systems) on for a delivered dose of 45 Gy with 1.8-Gy fractions. The dose calculation was performed with the AAA algorithm and a 2.5-mm grid size; for the optimization, the PRO3 algorithm was used. Two co-planar double-arcs were generated for each PTV, where the collimator angle was set to 30° for counter-clockwise rotation and 330° for clockwise rotation. During the first optimizing process, the objectives (PTV and OAR) were the same for the two plans. During a second optimizing process, the penalties (dose-volume objective and/or weight) corresponding to the OAR were manually adapted to minimize the absorbed dose according to the clinical objectives. Dose to PTV was optimized and normalized to obtain the same V95% (volume of PTV receiving 95% of prescription dose), D98% (dose received by 98% of the PTV) and D2% (dose received by 2% of the PTV), with a maximum deviation of 1%. Radiotherapy planning was based on the MRI and PET/MRI GTV data set adding a standard 10-mm 3D margin to GTV to obtain CTV, and a 3-mm 3D margin to CTV for PTV definition.

4.5. Statistical Analysis

The results for continuous data were expressed as median and range, whereas categorical variables were presented as numbers and percentages. GTV, CTV, and PTV data were expressed in cubic centimeters. The intraclass correlation coefficient (ICC) was used for interobserver reproducibility assessment of both GTVMRI and GTVPET/MRI. ICC inter-rater agreement measurements were interpreted according to the following criteria: less than 0.40 = poor agreement; 0.40–0.59 = fair agreement; 0.60–0.74 = good agreement; 0.75–1 = excellent agreement [36]. A two-way mixed effect model with absolute agreement definition parameters was applied to the ICC. The nonparametric paired-sample Wilcoxon signed-rank test was used to evaluate differences between GTVMRI and GTVPET, and between GTVMRI and GTVPET/MRI, and to compare doses delivered according to GTV obtained from MRI and PET/MRI data. The nonparametric Mann–Whitney U test was used to test differences between patient groups. The Spearman rank correlation test was conducted to assess the relationship between variables. All statistical analyses were performed using R Studio (Version 1.0.153 2017, R Studio, Inc., Boston, MA, USA). A p-value less than 0.05 was considered significant.

5. Conclusions

In this era of multimodality imaging, we should consider that no single imaging modality encompasses an entire microscopic and macroscopic tumor, pointing out the difficulty selecting which imaging modality is superior for target volume delineation. In our opinion, the real question that at present remains without a definitive response is whether any difference in GTV delineation according to the available imaging modalities (MRI, PET/CT, and PET/MRI) is clinically significant in patients with SBPGL. For the moment, we can note that no differences exist in terms of tumor-delivered dose between MRI and PET/MRI-based radiation planning, regardless of the inter-modality degree of volumetric agreement. Future integration of 18F-FDOPA PET/CT into clinical practice for SBPGL radiotherapy planning will be necessary to evaluate the influence of this combined diagnostic modality on tumor eradication or local control. If the clinical utility of 18F-FDOPA PET/MRI is further confirmed in a large patient population, combined GTVPET/MRI should be considered for tailored SBPGL radiotherapy planning to identify positive disease not clearly detected by conventional MRI, to redefine CTV margins, or to give a radiation boost treatment.

Author Contributions

M.H.: manuscript writing, reviewing and approval, data analysis and interpretation. M.M.: manuscript writing, reviewing and approval; C.L.F.: GTV data analysis, manuscript reviewing and approval. C.H.: manuscript reviewing and approval. C.B.: manuscript reviewing and approval. F.H.: statistical analysis, manuscript reviewing and approval. C.H.: manuscript reviewing and approval. B.G.: patient clinical management, manuscript reviewing and approval. F.V.: MRI examinations, manuscript reviewing and approval. A.C.: patient surgical management, manuscript reviewing and approval. G.N.: GTV data analysis, manuscript reviewing and approval. A.I.: conception of the work, data analysis and interpretation, manuscript writing, reviewing and approval.

Funding

This research received no external funding.

Conflicts of Interest

The authors declare no conflict of interest.

References

  1. Kumar, V.; Abbas, A.; Fausto, N.; Aster, J. Robbins and Cotran: Pathological Basis of Disease, 8th ed.; Saunders: Philadelphia, PA, USA, 2010. [Google Scholar]
  2. Baysal, B.E.; Willett-Brozick, J.E.; Lawrence, E.C.; Drovdlic, C.M.; Savul, S.A.; McLeod, D.R.; Yee, H.A.; Brackmann, D.E.; Slattery, W.H.; Myers, E.N.; et al. Prevalence of SDHB, SDHC, and SDHD germline mutations in clinic patients with head and neck paragangliomas. J. Med. Genet. 2002, 39, 178–183. [Google Scholar] [CrossRef] [PubMed] [Green Version]
  3. Lenders, J.W.M.; Duh, Q.-Y.; Eisenhofer, G.; Gimenez-Roqueplo, A.-P.; Grebe, S.K.G.; Murad, M.H.; Naruse, M.; Pacak, K.; Young, W.F.; et al. Pheochromocytoma and Paraganglioma: An Endocrine Society Clinical Practice Guideline. J. Clin. Endocrinol. Metab. 2014, 99, 1915–1942. [Google Scholar] [CrossRef] [PubMed] [Green Version]
  4. Manolidis, S.; Shohet, J.A.; Jackson, C.G.; Glasscock, M.E., 3rd. Malignant glomus tumors. Laryngoscope 1999, 109, 30–34. [Google Scholar] [CrossRef] [PubMed]
  5. Taïeb, D.; Timmers, H.J.; Hindié, E.; Guillet, B.A.; Neumann, H.P.; Walz, M.K.; Opocher, G.; Herder, W.W.; Boedeker, C.C.; Krijger, R.R.; et al. EANM 2012 guidelines for radionuclide imaging of phaeochromocytoma and paraganglioma. Eur. J. Nucl. Med. Mol. Imaging 2012, 39, 1977–1995. [Google Scholar] [CrossRef] [PubMed] [Green Version]
  6. Treglia, G.; Cocciolillo, F.; De Waure, C.; Di Nardo, F.; Gualano, M.R.; Castaldi, P.; Rufini, V.; Giordano, A. Diagnostic performance of 18F-dihydroxyphenylalanine positron emission tomography in patients with paraganglioma: A meta-analysis. Eur. J. Nucl. Med. Mol. Imaging 2012, 39, 1144–1153. [Google Scholar] [CrossRef] [PubMed]
  7. Heimburger, C.; Veillon, F.; Taïeb, D.; Goichot, B.; Riehm, S.; Petit-Thomas, J.; Averous, G.; Cavalcanti, M.; Hubelé, F.; Chabrier, G.; et al. Head-to-head comparison between 18F-FDOPA PET/CT and MR/CT angiography in clinically recurrent head and neck paragangliomas. Eur. J. Nucl. Med. Mol. Imaging 2017, 44, 979–987. [Google Scholar] [CrossRef] [PubMed]
  8. Amodru, V.; Guerin, C.; Delcourt, S.; Romanet, P.; Loundou, A.; Viana, B.; Brue, T.; Castinetti, F.; Sebag, F.; Pacak, K.; et al. Quantitative 18F-DOPA PET/CT in pheochromocytoma: The relationship between tumor secretion and its biochemical phenotype. Eur. J. Nucl. Med. Mol. Imaging 2018, 45, 278–282. [Google Scholar] [CrossRef]
  9. Taïeb, D.; Kaliski, A.; Boedeker, C.C.; Martucci, V.; Fojo, T.; Adler, J.R.; Pacak, K. Current approaches and recent developments in the management of head and neck paragangliomas. Endocr. Rev. 2014, 35, 795–819. [Google Scholar] [CrossRef]
  10. Wanna, G.B.; Sweeney, A.D.; Haynes, D.S.; Carlson, M.L. Contemporary management of jugular paragangliomas. Otolaryngol. Clin. N. Am. 2015, 48, 331–341. [Google Scholar] [CrossRef]
  11. Moore, M.G.; Netterville, J.L.; Mendenhall, W.M.; Isaacson, B.; Nussenbaum, B. Head and Neck Paragangliomas: An Update on Evaluation and Management. Otolaryngol. Head Neck Surg. 2016, 154, 597–605. [Google Scholar] [CrossRef]
  12. Marchetti, M.; Pinzi, V.; Tramacere, I.; Bianchi, L.C.; Ghielmetti, F.; Fariselli, L. Radiosurgery for paragangliomas of the head and neck: Another step for the validation of a treatment paradigm. World Neurosurg. 2017, 98, 281–287. [Google Scholar] [CrossRef] [PubMed]
  13. Hu, K.; Persky, M.S. Treatment of head and neck paragangliomas. Cancer Control 2016, 23, 228–241. [Google Scholar] [CrossRef] [PubMed]
  14. Huy, P.T.B. Radiotherapy for glomus jugulare paraganglioma. Eur. Ann. Otorhinolaryngol. Head Neck Dis. 2014, 131, 223–226. [Google Scholar] [CrossRef] [Green Version]
  15. Queiroz, M.A.; Hüllner, M.; Kuhn, F.; Huber, G.; Meerwein, C.; Kollias, S.; Von Schulthess, G.; Veit-Haibach, P. PET/MRI and PET/CT in follow-up of head and neck cancer patients. Eur. J. Nucl. Med. Mol. Imaging 2014, 41, 1066–1075. [Google Scholar] [CrossRef] [PubMed]
  16. Schaarschmidt, B.M.; Heusch, P.; Buchbender, C.; Ruhlmann, M.; Bergmann, C.; Ruhlmann, V.; Schlamann, M.; Antoch, G.; Forsting, M.; Wetter, A.; et al. Locoregional tumour evaluation of squamous cell carcinoma in the head and neck area: A comparison between MRI, PET/CT and integrated PET/MRI. Eur. J. Nucl. Med. Mol. Imaging 2016, 43, 92–102. [Google Scholar] [CrossRef] [PubMed]
  17. Pauleit, D.; Floeth, F.; Hamacher, K.; Riemenschneider, M.J.; Reifenberger, G.; Müller, H.-W.; Zilles, K.; Coenen, H.H.; Langen, K.-J. O-(2-[18F]fluoroethyl)-l-tyrosine PET combined with MRI improves the diagnostic assessment of cerebral gliomas. Brain 2005, 128, 678–687. [Google Scholar] [CrossRef] [PubMed]
  18. Cicone, F.; Filss, C.P.; Minniti, G.; Rossi-Espagnet, C.; Papa, A.; Scaringi, C.; Galldiks, N.; Bozzao, A.; Shah, N.J.; Scopinaro, F.; et al. Volumetric assessment of recurrent or progressive gliomas: Comparison between F-DOPA PET and perfusion-weighted MRI. Eur. J. Nucl. Med. Mol. Imaging 2015, 42, 905–915. [Google Scholar] [CrossRef]
  19. Carideo, L.; Minniti, G.; Mamede, M.; Scaringi, C.; Russo, I.; Scopinaro, F.; Cicone, F. 18F-DOPA uptake parameters in glioma: Effects of patients’ characteristics and prior treatment history. Br. J. Radiol. 2018, 91, 20170847. [Google Scholar] [CrossRef] [PubMed]
  20. Kratochwil, C.; Combs, S.E.; Leotta, K.; Afshar-Oromieh, A.; Rieken, S.; Debus, J.; Haberkorn, U.; Giesel, F.L. Intra-individual comparison of 18F-FET and 18FDOPA in PET imaging of recurrent brain tumors. Neuro Oncol. 2014, 16, 434–440. [Google Scholar] [CrossRef] [PubMed]
  21. Lapa, C.; Linsenmann, T.; Monoranu, C.M.; Samnick, S.; Buck, A.; Bluemel, C.; Czernin, J.; Kessler, A.F.; Homola, G.A.; Ernestus, R.-I.; et al. Comparison of the amino acid tracers 18F-FET and 18F-DOPA in high-grade glioma patients. J. Nucl. Med. 2014, 55, 1611–1616. [Google Scholar] [CrossRef] [PubMed]
  22. Verma, V.; Choi, J.I.; Sawant, A.; Gullapalli, R.P.; Chen, W.; Alavi, A.; Simone, C.B. Use of PET and Other Functional Imaging to Guide Target Delineation in Radiation Oncology. Semin. Radiat. Oncol. 2018, 28, 171–177. [Google Scholar] [CrossRef] [PubMed]
  23. Pafundi, D.H.; Laack, N.N.; Youland, R.S.; Parney, I.F.; Lowe, V.J.; Giannini, C.; Kemp, B.J.; Grams, M.P.; Morris, J.M.; Hoover, J.M.; et al. Biopsy validation of 18F-DOPA PET and biodistribution in gliomas for neurosurgical planning and radiotherapy target delineation: Results of a prospective pilot study. Neuro Oncol. 2013, 15, 1058–1067. [Google Scholar] [CrossRef] [PubMed]
  24. Pafundi, D.; Brinkmann, D.; Laack, N.; Sarkaria, J.; Yan, E.; Kemp, B.; Löwe, V. WE-G-214-02: Utility of 18F-FDOPA PET for Radiotherapy Target Delineation in Glioma Patients. Med. Phys. 2011, 38, 3830. [Google Scholar] [CrossRef]
  25. Kosztyla, R.; Chan, E.K.; Hsu, F.; Wilson, D.; Ma, R.; Cheung, A.; Zhang, S.; Moiseenko, V.; Bénard, F.; Nichol, A.; et al. High-grade glioma radiation therapy target volumes and patterns of failure obtained from magnetic resonance imaging and 18F-FDOPA positron emission tomography delineations from multiple observers. Int. J. Radiat. Oncol. Biol. Phys. 2013, 87, 1100–1106. [Google Scholar] [CrossRef] [PubMed]
  26. Navarria, P.; Reggiori, G.; Pessina, F.; Ascolese, A.M.; Tomatis, S.; Mancosu, P.; Lobefalo, F.; Clerici, E.; Lopci, E.; Bizzi, A.; et al. Investigation on the role of integrated PET/MRI for target volume definition and radiotherapy planning in patients with high grade glioma. Radiother. Oncol. 2014, 112, 425–429. [Google Scholar] [CrossRef] [PubMed]
  27. Palaniappan, N.; Cole, N.; Jayaprakasam, V.; Rackley, T.; Spezi, E.; Berthon, B.; Evans, M. Head and neck target delineation using a novel PET automatic segmentation algorithm. Radiother. Oncol. 2017, 122, 242–247. [Google Scholar] [CrossRef] [Green Version]
  28. Handel, S.F.; Miller, M.H.; Miller, L.S.; Goepfert, H.; Wallace, S. Angiographic changes of head and neck chemodectomas following radiotherapy. Arch. Otolaryngol. 1977, 103, 87–89. [Google Scholar] [CrossRef] [PubMed]
  29. Wang, K.; Mullins, B.T.; Falchook, A.D.; Lian, J.; He, K.; Shen, D.; Dance, M.; Lin, W.; Sills, T.M.; Das, S.K.; et al. Evaluation of PET/MRI for Tumor Volume Delineation for Head and Neck Cancer. Front. Oncol. 2017, 23, 7–8. [Google Scholar] [CrossRef] [PubMed]
  30. Ligtenberg, H.; Jager, E.A.; Caldas-Magalhaes, J.; Schakel, T.; Pameijer, F.A.; Kasperts, N.; Willems, S.M.; Terhaard, C.H.; Raaijmakers, C.P.; Philippens, M.E.; et al. Modality-specific target definition for laryngeal and hypopharyngeal cancer on FDG-PET, CT and MRI. Radiother. Oncol. 2017, 123, 63–70. [Google Scholar] [CrossRef] [PubMed]
  31. Songthong, A.P.; Kannarunimit, D.; Chakkabat, C.; Lertbutsayanukul, C. A randomized phase II/III study of adverse events between sequential (SEQ) versus simultaneous integrated boost (SIB) intensity modulated radiation therapy (IMRT) in nasopharyngeal carcinoma; preliminary result on acute adverse events. Radiat. Oncol. 2015, 10, 166. [Google Scholar] [CrossRef] [PubMed]
  32. Truc, G.; Bernier, V.; Mirjolet, C.; Dalban, C.; Mazoyer, F.; Bonnetain, F.; Blanchard, N.; Lagneau, É.; Maingon, P.; Noël, G.; et al. A phase I dose escalation study using simultaneous integrated-boost IMRT with temozolomide in patients with unifocal glioblastoma. Cancer Radiother. 2016, 20, 193–198. [Google Scholar] [CrossRef] [PubMed]
  33. Erdi, Y.E.; Mawlawi, O.; Larson, S.M.; Imbriaco, M.; Yeung, H.; Finn, R.; Humm, J.L. Segmentation of lung lesion volume by adaptive positron emission tomography image thresholding. Cancer 1997, 80, 2505–2509. [Google Scholar] [CrossRef] [Green Version]
  34. Zou, K.H.; Warfield, S.K.; Bharatha, A.; Tempany, C.M.; Kaus, M.R.; Haker, S.J.; Wells, W.M.; Jolesz, F.A.; Kikinis, R. Statistical validation of image segmentation quality based on a spatial overlap index. Acad. Radiol. 2004, 11, 178–189. [Google Scholar] [CrossRef]
  35. Otto, K. Volumetric modulated arc therapy: IMRT in a single gantry arc. Med. Phys. 2008, 35, 310–317. [Google Scholar] [CrossRef] [PubMed]
  36. Cicchetti, D.V. Guidelines, Criteria, and Rules of Thumb for Evaluating Normed and Standardized Assessment Instruments in Psychology. Psychol. Assess. 1994, 6, 284–290. [Google Scholar] [CrossRef]
Figure 1. Typical example of gross tumor volume assessed by tumor-to-brain ratio (GTVTBR) (red contour) evaluated on 18F-dihydroxyphenylalanine (18F-FDOPA) combined positron emission tomography/computed tomography (PET/CT) images (A: axial, B: sagittal, C: coronal) in a patient with a sporadic right skull base paraganglioma (SBPGL). A threshold value of 1.6 over the background uptake was used as the reference for semi-automatic definition of GTV. Note that GTVTBR largely exceeds the metabolic tumoral edges (arrows).
Cancers 11 00054 g001
Figure 2. GTV delineation and dose-volume histogram (DVH) based on MRI (Δ), 18F-FDOPA PET/CT (●), and 18F-FDOPA PET/MRI (■) for a representative case. Contrast-enhanced T1-weighted MRI (A), 18F-FDOPA PET/CT (B), and combined PET/MRI (C) axial images in a 57-year-old woman with a relapsing 23-mm right jugulotympanic SDHC PGL previously treated with surgery and peptide receptor radionuclide therapy (patient 2, Table 1). (D) GTV delineation for external radiation therapy based on MRI (blue contour), 18F-FDOPA PET/CT (green contour), and combined 18F-FDOPA PET/MRI images (orange contour). (E) Radiation treatment planning based on MRI, 18F-FDOPA PET/CT, and combined 18F-FDOPA PET and MRI data set assessed for volumetric-modulated arc therapy. Dose-volume histogram for PTV and organs at risk (OAR) are displayed. PTV: red curves; brainstem: purple curves; mandible: blue curves; parotid: orange curves. All the treatment plans were able to respect clinical objectives showing similar results concerning both target delivered dose and OAR conservancy.
Cancers 11 00054 g002
Figure 3. Volume rendering technique representations of GTV delineated on PET, MRI, and PET/MRI. Axial slice of combined 18F-FDOPA PET/MRI imaging in a 43-year-old woman (patient 5, Table 1) with a relapsing 40-mm apparently sporadic right jugulotympanic PGL previously treated with surgery (A). Volume rendering technique representation of GTV delineated on MRI (B, blue volume), 18F-FDOPA PET/CT (C, green volume), and combined 18F-FDOPA PET/MRI imaging (D, green and gray volume).
Cancers 11 00054 g003
Table 1. Patient population characteristics.
PatientAge, Sex (Man/Woman)SymptomsPGL Size (mm), Side (Left/Right)GeneticsPrimary Staging, RecurrencePrior Treatment
162, MTinnitus10, LSporadicPrimary Staging-
257, WTinnitus
Ear discharge
23, RSDHC3RecurrenceSurgery
PRRT 2
357, MTinnitus8, RSporadicRecurrenceSurgery
458, MTinnitus8, RSporadicRecurrenceSurgery
IMRT 3
543, WTinnitus
Local pain
40, RSporadicRecurrenceSurgery
684, WTinnitus31, LSporadicRecurrenceSurgery
Gamma Knife
762, WAsymptomatic22, LSDHB1RecurrenceSurgery
867, WPulsatile tinnitus8, LSporadicPrimary Staging-
966, MDizziness25, RSporadicPrimary Staging-
1070, WPulsatile tinnitus21, LSporadicRecurrencePRRT 2
1147, MPulsatile tinnitus7, LSporadicPrimary Staging-
1248, MPulsatile tinnitus13, LSporadicRecurrenceIMRT 3
1359, WAsymptomatic22, RSporadicRecurrenceSurgery
PRRT 2
1454, MTinnitus
Ear discharge
12, LSporadicPrimary Staging-
1558, MPulsatile tinnitus9, RSporadicPrimary Staging-
1637, MDizziness
Hearing loss
30, RSporadicPrimary Staging-
1SDHB: succinate dehydrogenase subunit B; 2 PRRT = peptide receptor tadionuclide therapy; 3 IMRT: intensity-modulated radiotherapy.
Table 2. Volumetric and positional analysis of GTVs assessed by magnetic resonance imaging (MRI), 18F-FDOPA PET/CT, and PET/MRI.
PatientGTV a (cm3)DSC b
MRIPET/CTPET/MRIMRI vs. PET/CTMRI vs. PET/MRI
10.330.630.870.510.65
24.012.235.170.590.95
31.250.281.600.300.99
41.350.491.850.390.82
55.953.669.950.530.43
64.934.736.840.760.89
78.581.4010.460.210.97
80.190.290.440.580.72
96.0117.1018.760.520.52
101.442.063.080.530.73
111.420.833.250.060.62
121.350.842.680.140.66
134.100.924.850.330.99
140.760.831.640.330.74
150.550.621.200.390.73
164.551.135.150.381.00
Median (range)1.4 (0.19–8.58)0.88 (0.28–17.1)3.16 (0.44–18.76)0.4 (0.06–0.76)0.7 (0.43–1.0)
Mean (SD c)2.92 (2.54)2.38 (4.12)4.86 (4.79)0.41 (0.18)0.78 (0.18)
a GTV: gross tumor volume. b DSC: Dice similarity coefficient. c SD: standard deviation.
Table 3. Comparison of dosimetric results obtained from MRI- and PET/MRI-based radiation treatment planning in three patients with apparently sporadic relapsing jugulotympanic PGLs (patients 2, 3, 5, Table 1).
PatientPGL Size (mm) 1V95% 2D98% 3D2% 4
MRIPET/MRIMRIPET/MRIMRIPET/MRI
12399.899.597.196.7101.9102.2
2899.59996.996.3102.5103.1
34099.299.196.496.3102.4102.5
1 PGL size refers to MRI investigation; 2 V95%: volume of PTV (planning target volume) receiving 95% of prescription; 3 D98%: dose received by 98% of the PTV; 4 D2%: dose received by 2% of the PTV.
Table 4. Comparison of dosimetric results on organs at risk (OAR) obtained from MRI and PET/MRI-based radiation treatment planning in 3 patients with apparently sporadic relapsing jugulotympanic PGLs (patients no. 2, 3, and 5 of Table 1).
Table 1SBPGL Size on MRI (mm) and Side (R/L 2)OAR 3Dmax 4 (Gy)Dmean 5 (Gy)V15Gy 6 (%)
MRIPET/MRIMRIPET/MRIMRIPET/MRI
Pt 1 223/RBrainstem42.945.811.712.3
R Parotid21.218.84.13.71.51
R IAC 744.845.644.344.3
Mandible45.645.33.13.3
Pt 38/RBrainstem46.947.012.613.1
R Parotid46.446.03.63.74.95.5
L IAC *2.52.82.22.7
L Cochlea *33.32.32.5
Pt 540/RBrainstem46.746.718.919.8
R Parotid46.746.914.819.335.850.9
R IAC44.844.944.444.4
Mandible4545.82.63
1 Pt: patient; 2 R: right; L: left; 3 OAR: organ at risk; 4 Dmax: dose maximum; 5 Dmean: mean dose; 6 V15Gy: the volume receiving doses above 15 Gy; 7 IAC: internal auditory canal. * R IAC and R Cochlea are included in PTV.

