
Object Detection Method for Grasping Robot Based on Improved YOLOv5

 , ,
, ,  , ,
, ,
Abstract
:1. Introduction
- (1)
- This study designs and builds a robot object detection platform, and adopts the hand-eye calibration method to improve the accuracy of robot object positioning.
- (2)
- This study proposes an improved YOLOv5 object detection algorithm. Compared with the YOLOv5 series, the proposed algorithm can effectively improve the precision and recall of robot object recognition.
- (3)
- This study adopts the network pruning method to design a lighter and more efficient YOLOv5 network model, which is suitable for object recognition of grasping robots, and has great potential to be deployed in industrial equipment.
- (4)
- In order to prove the feasibility of our method, we have carried out experimental verification of object detection by using grasping robot.
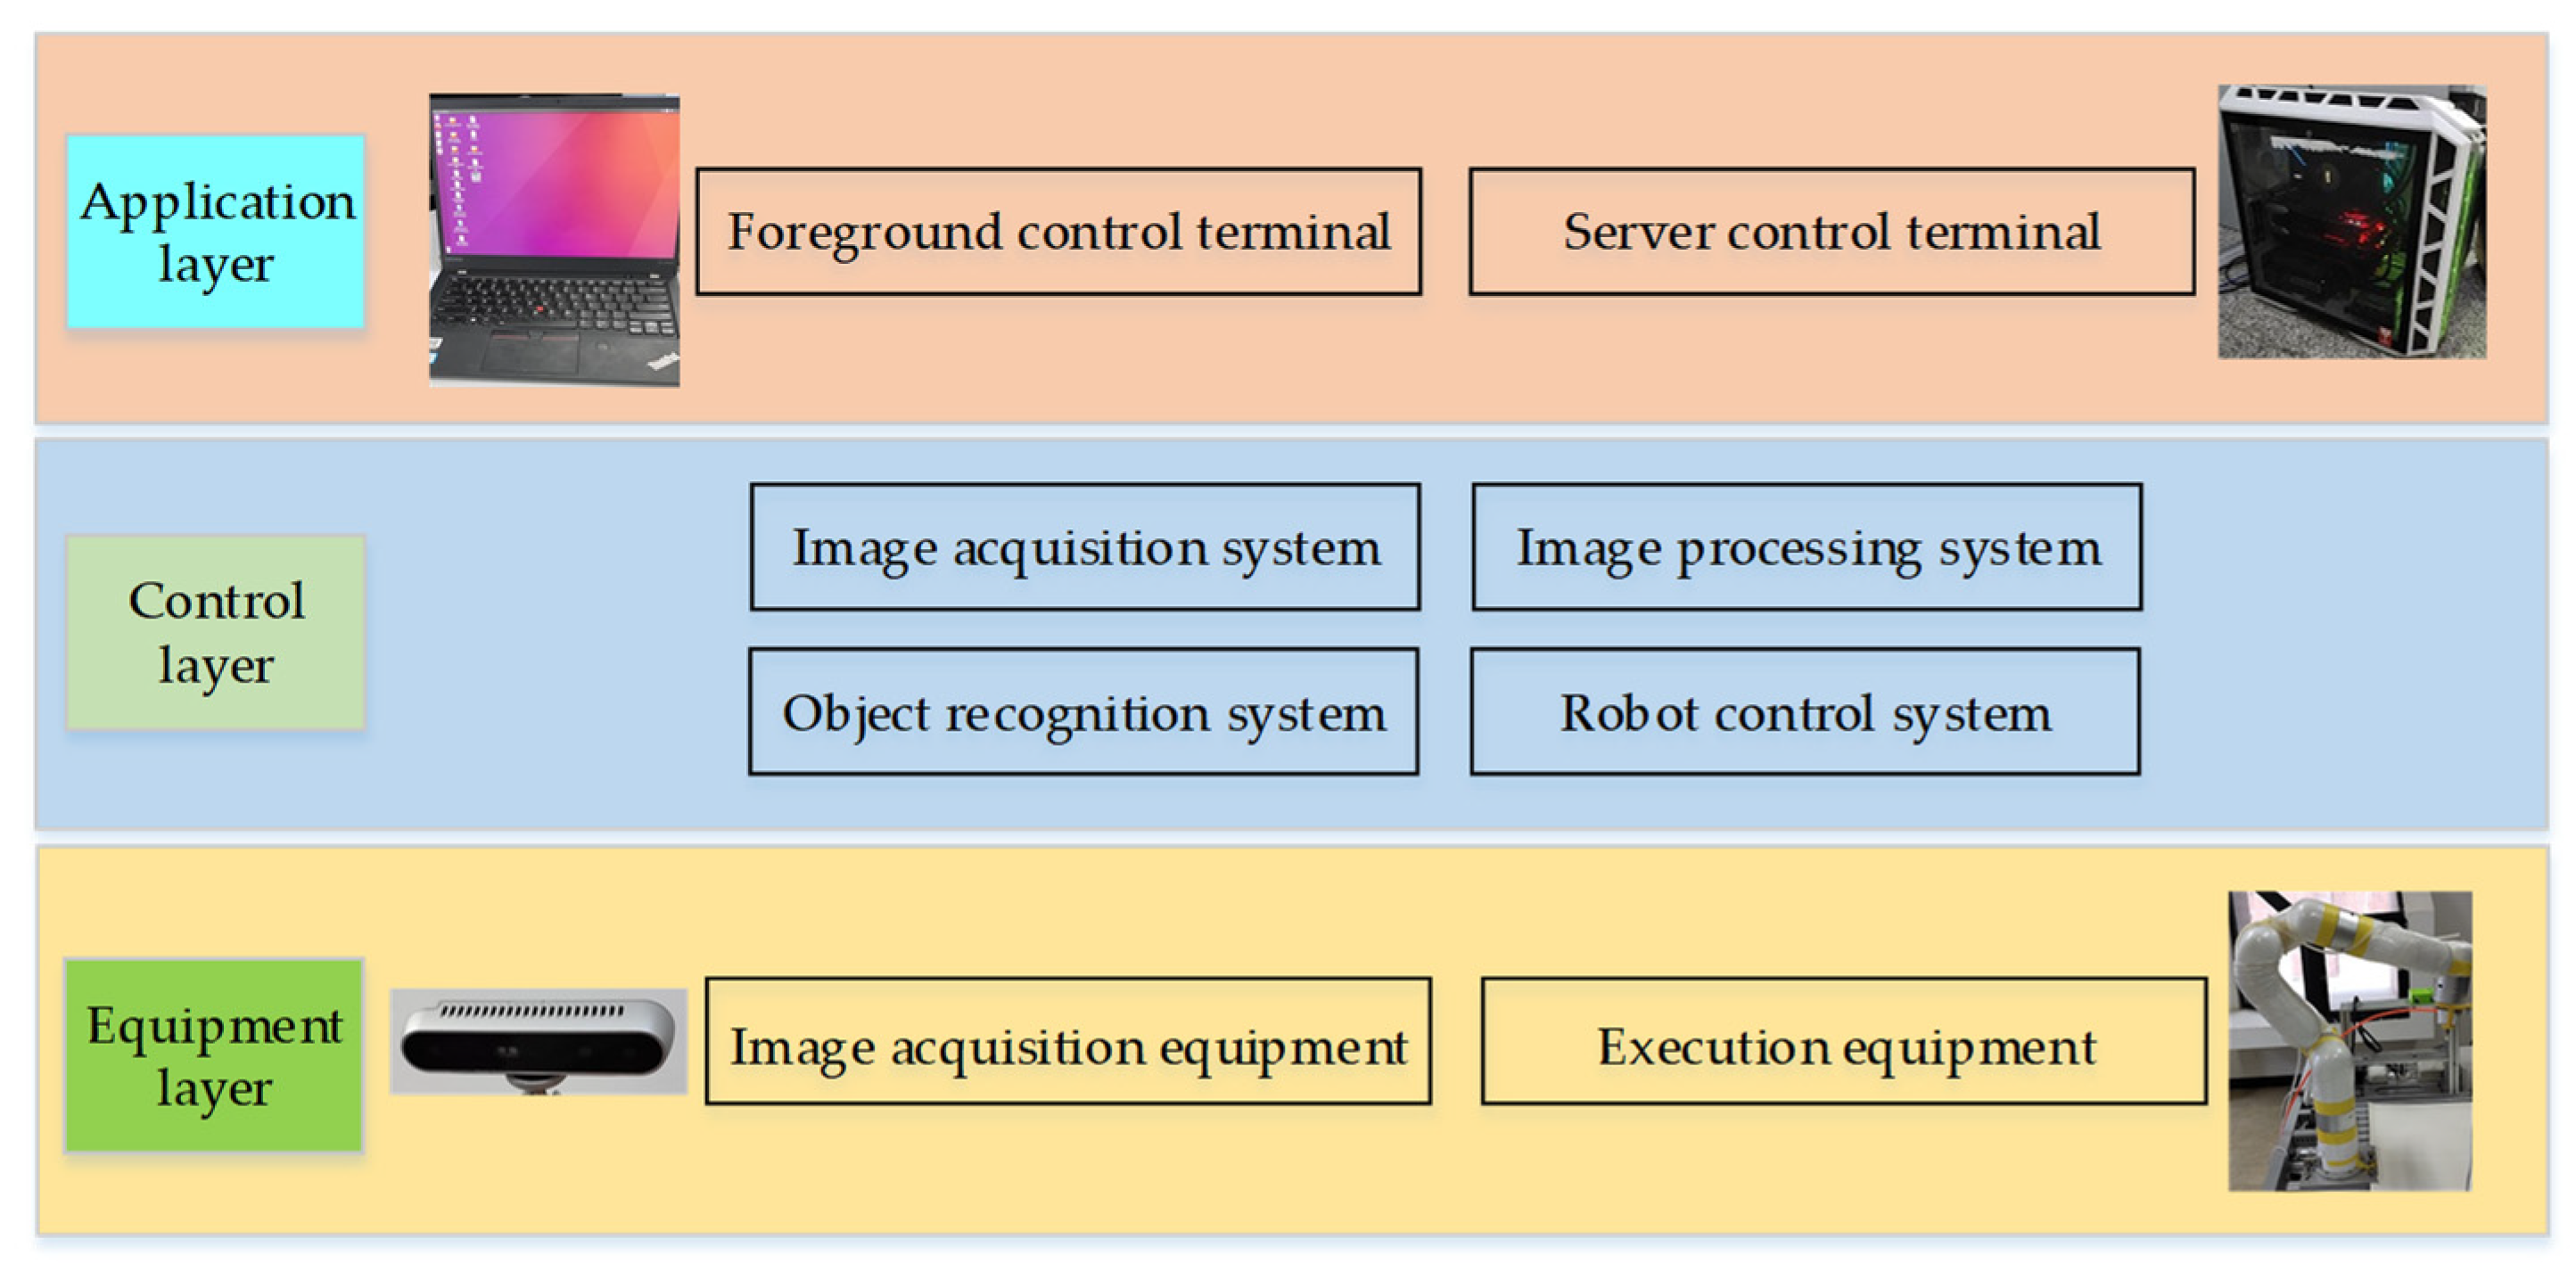
2. Experimental Device
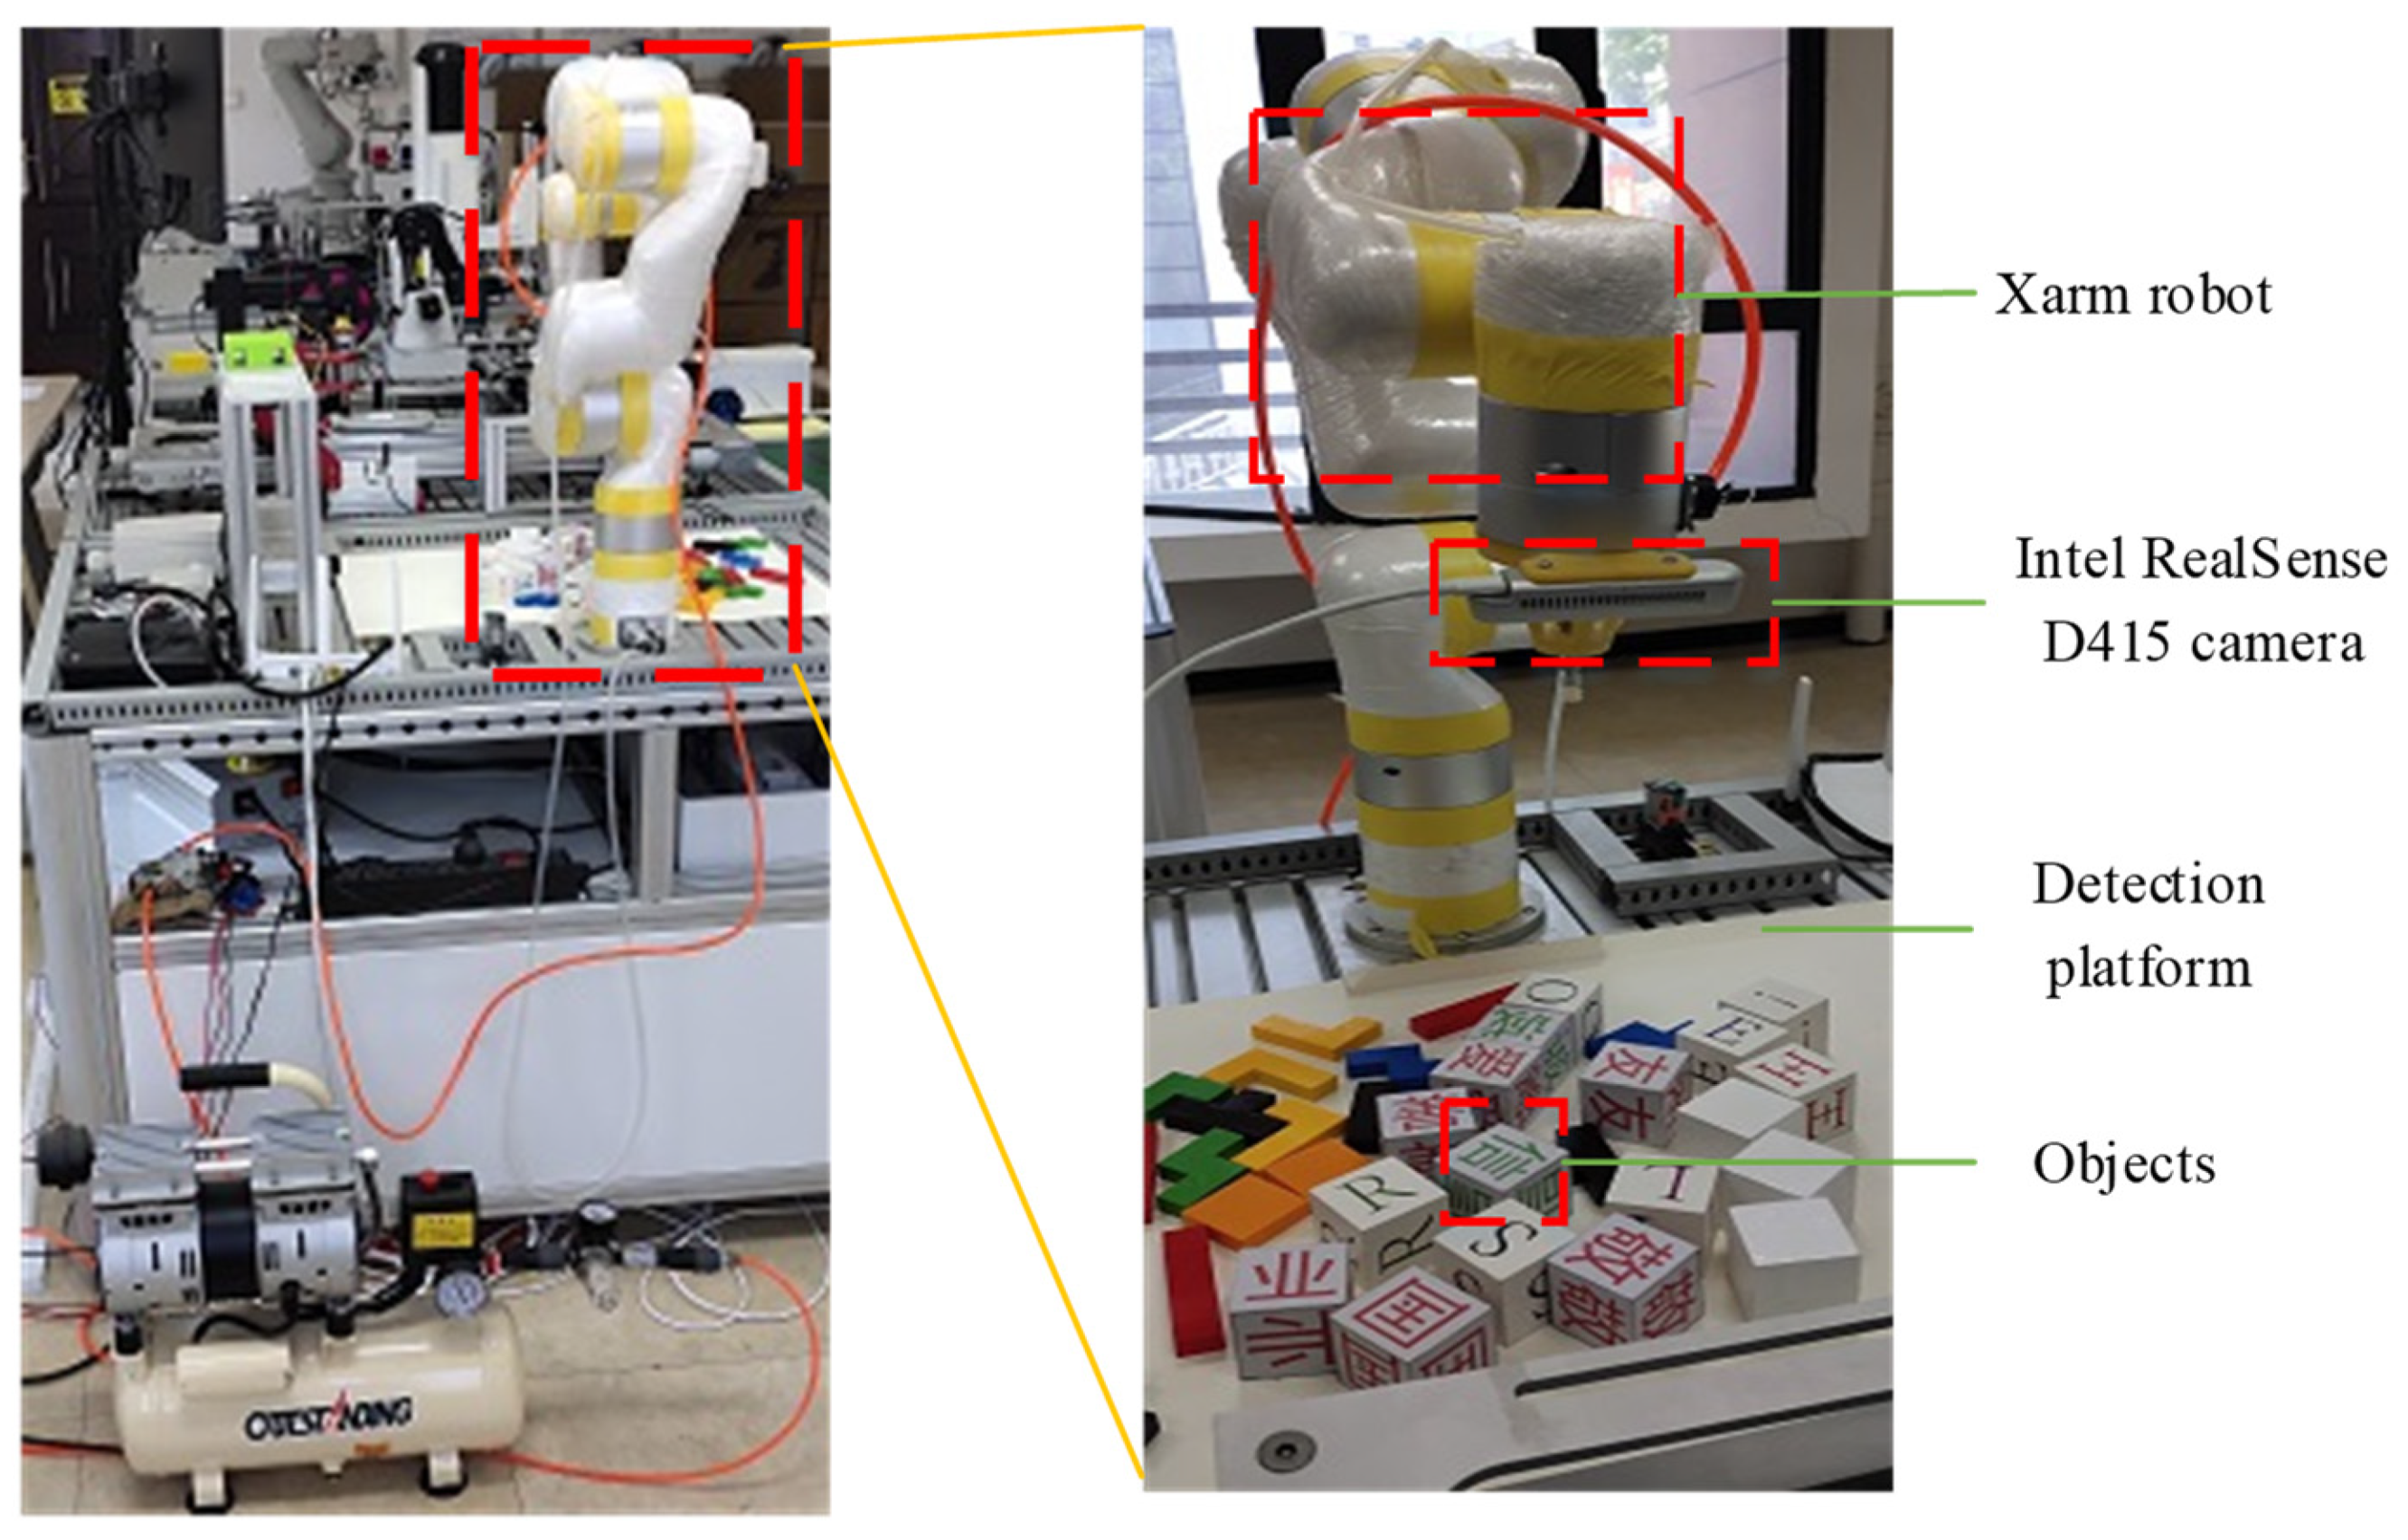
2.1. Experimental Platform
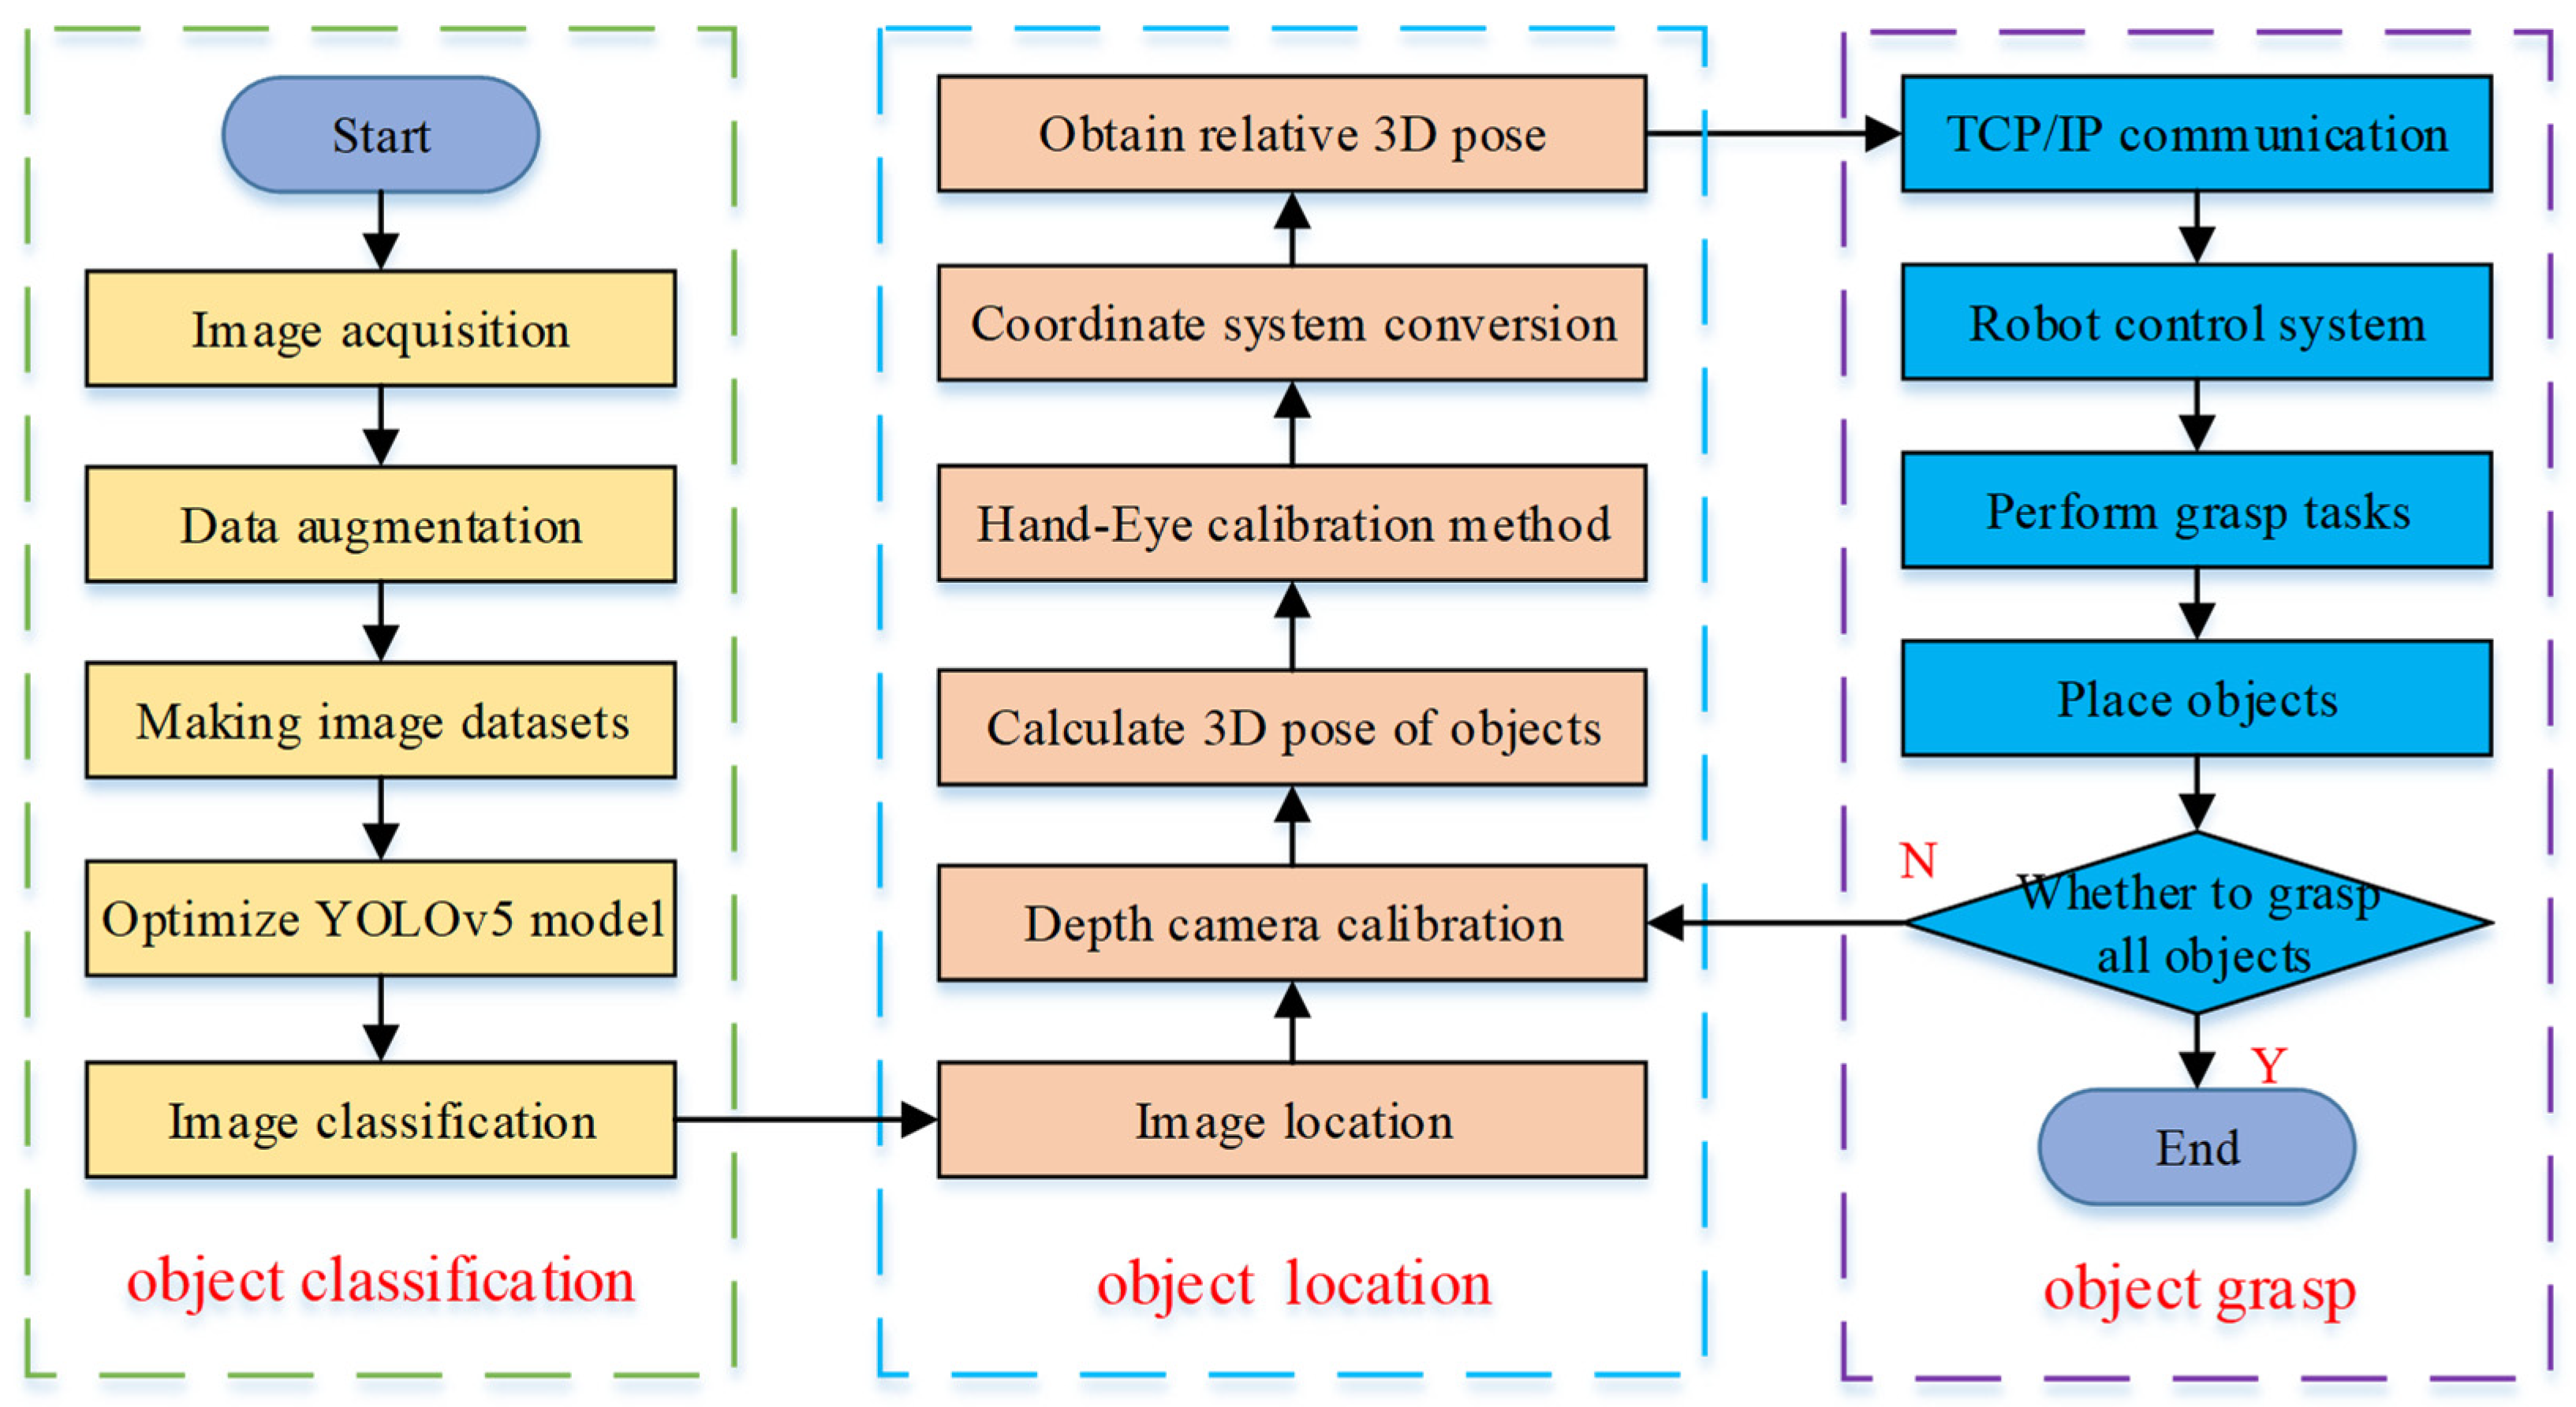
2.2. Experimental Process
3. Object Detection
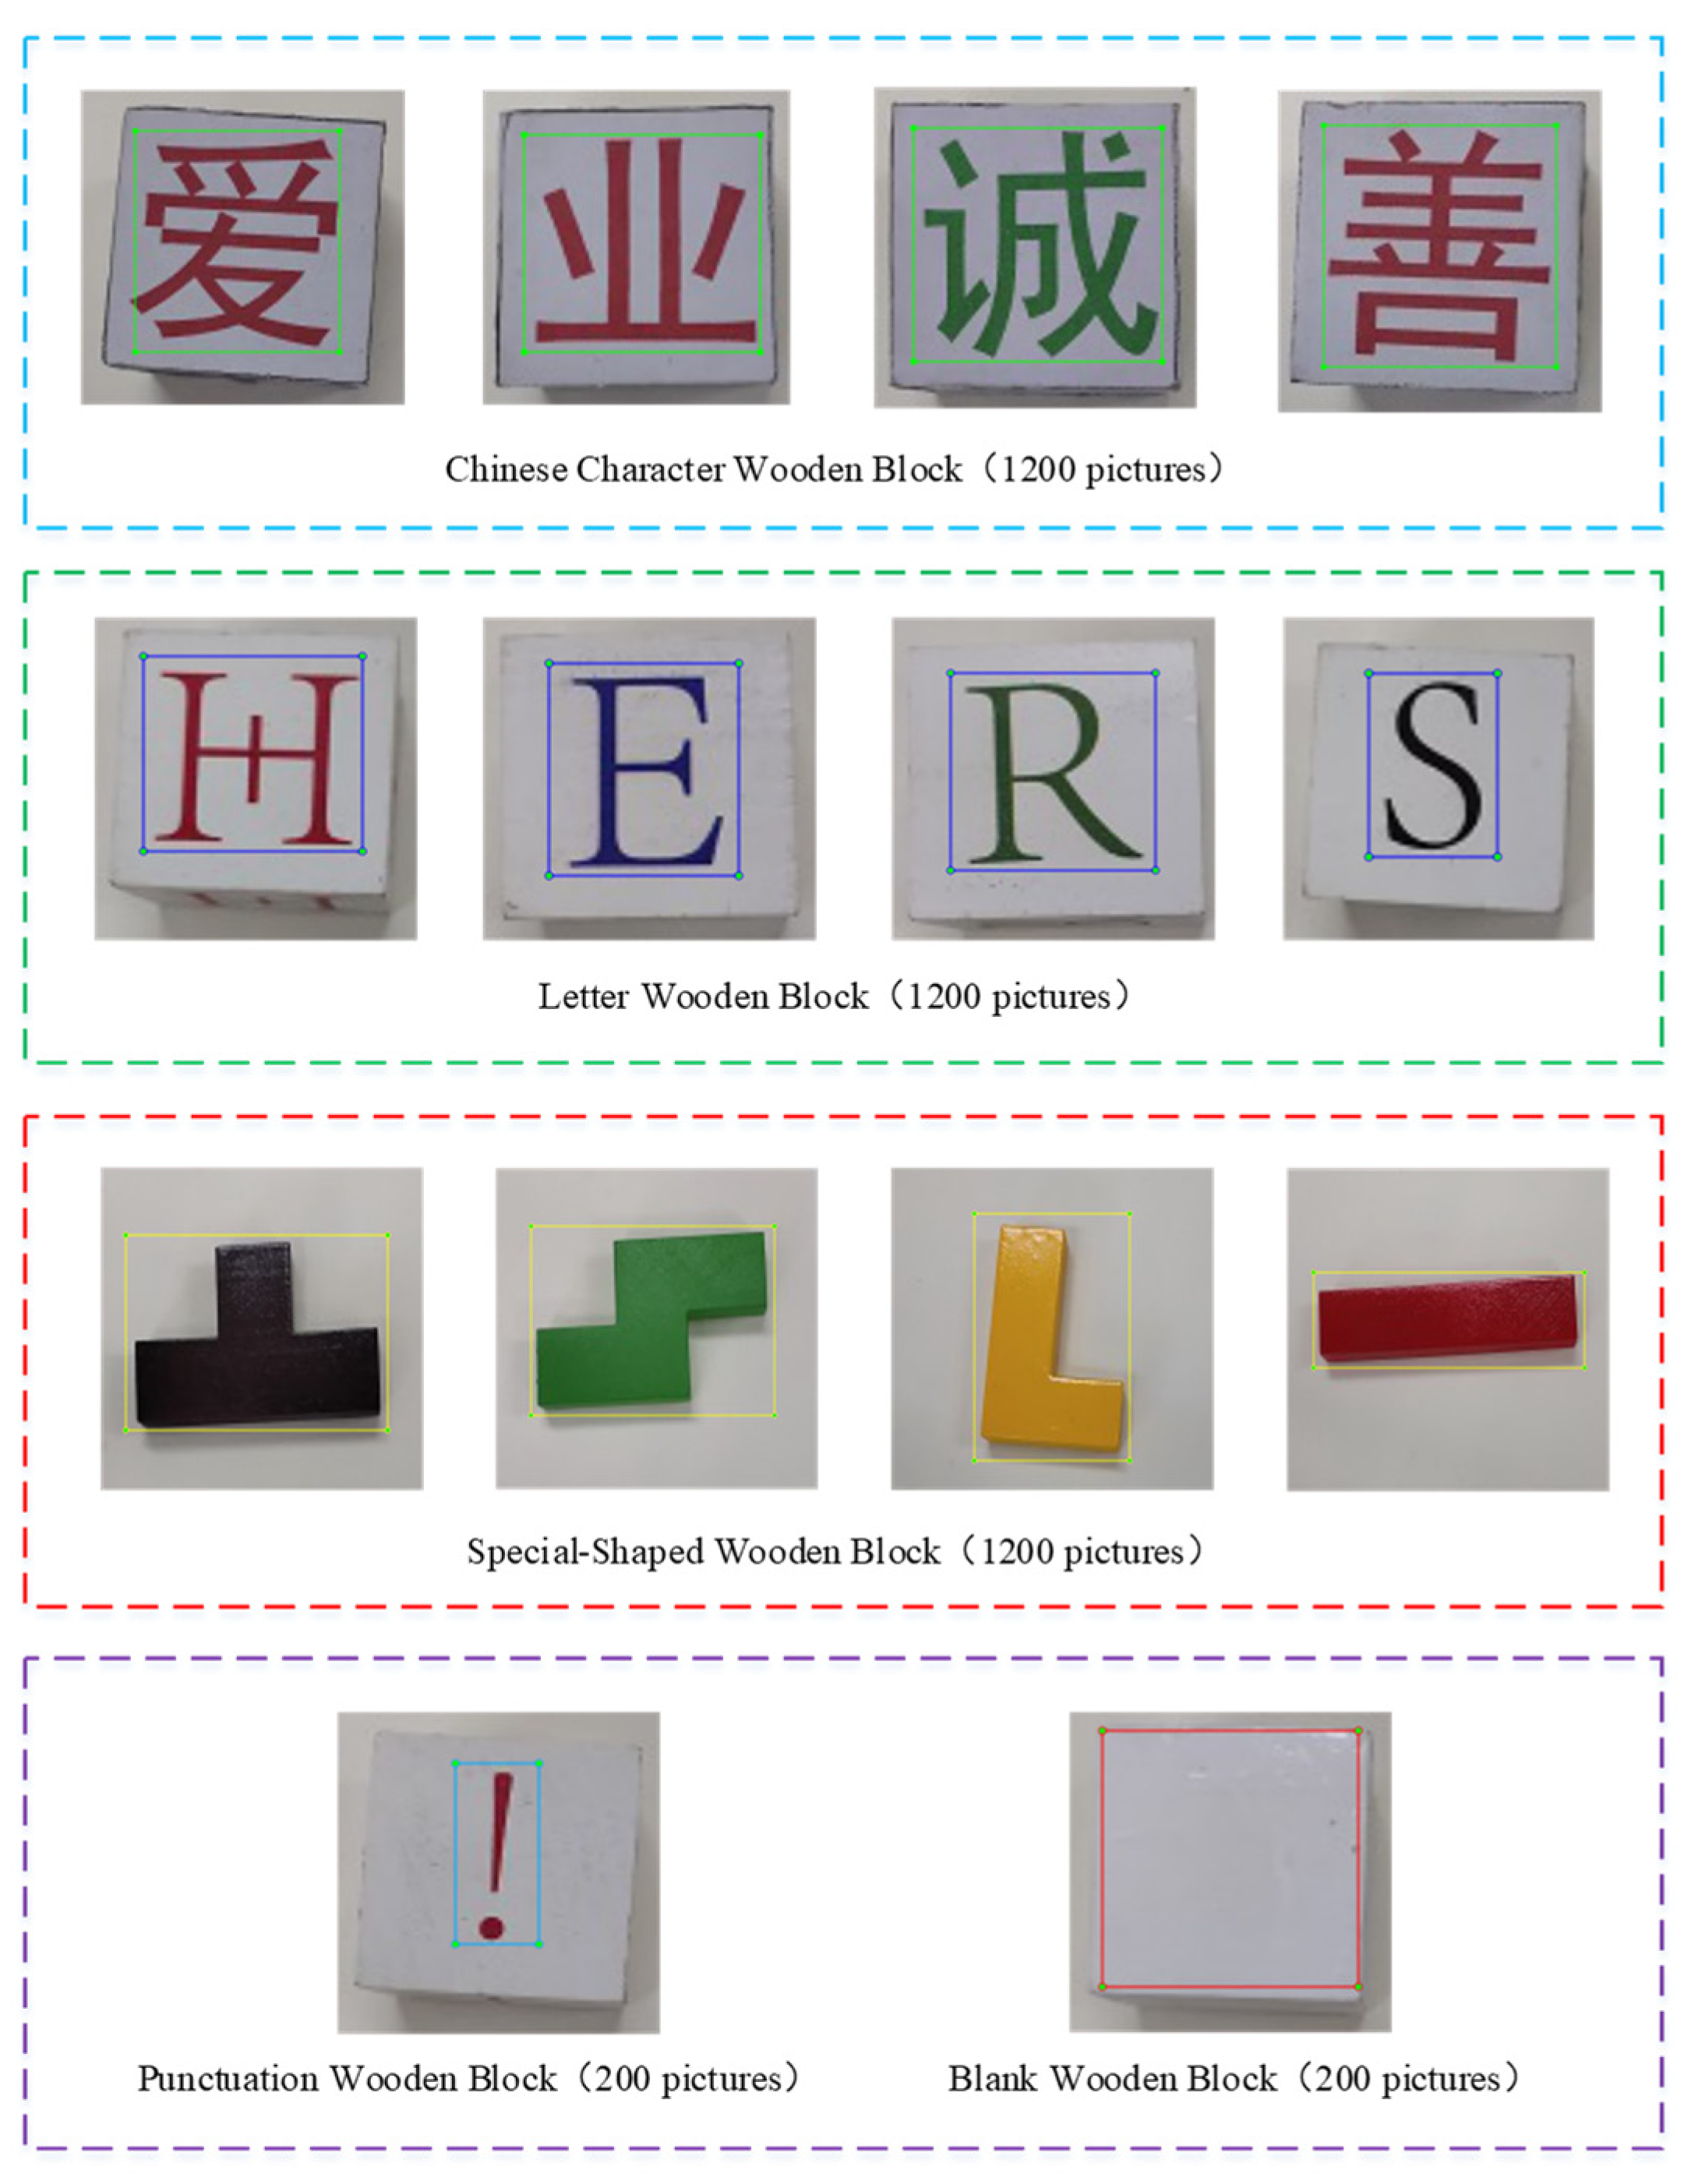
3.1. Dataset
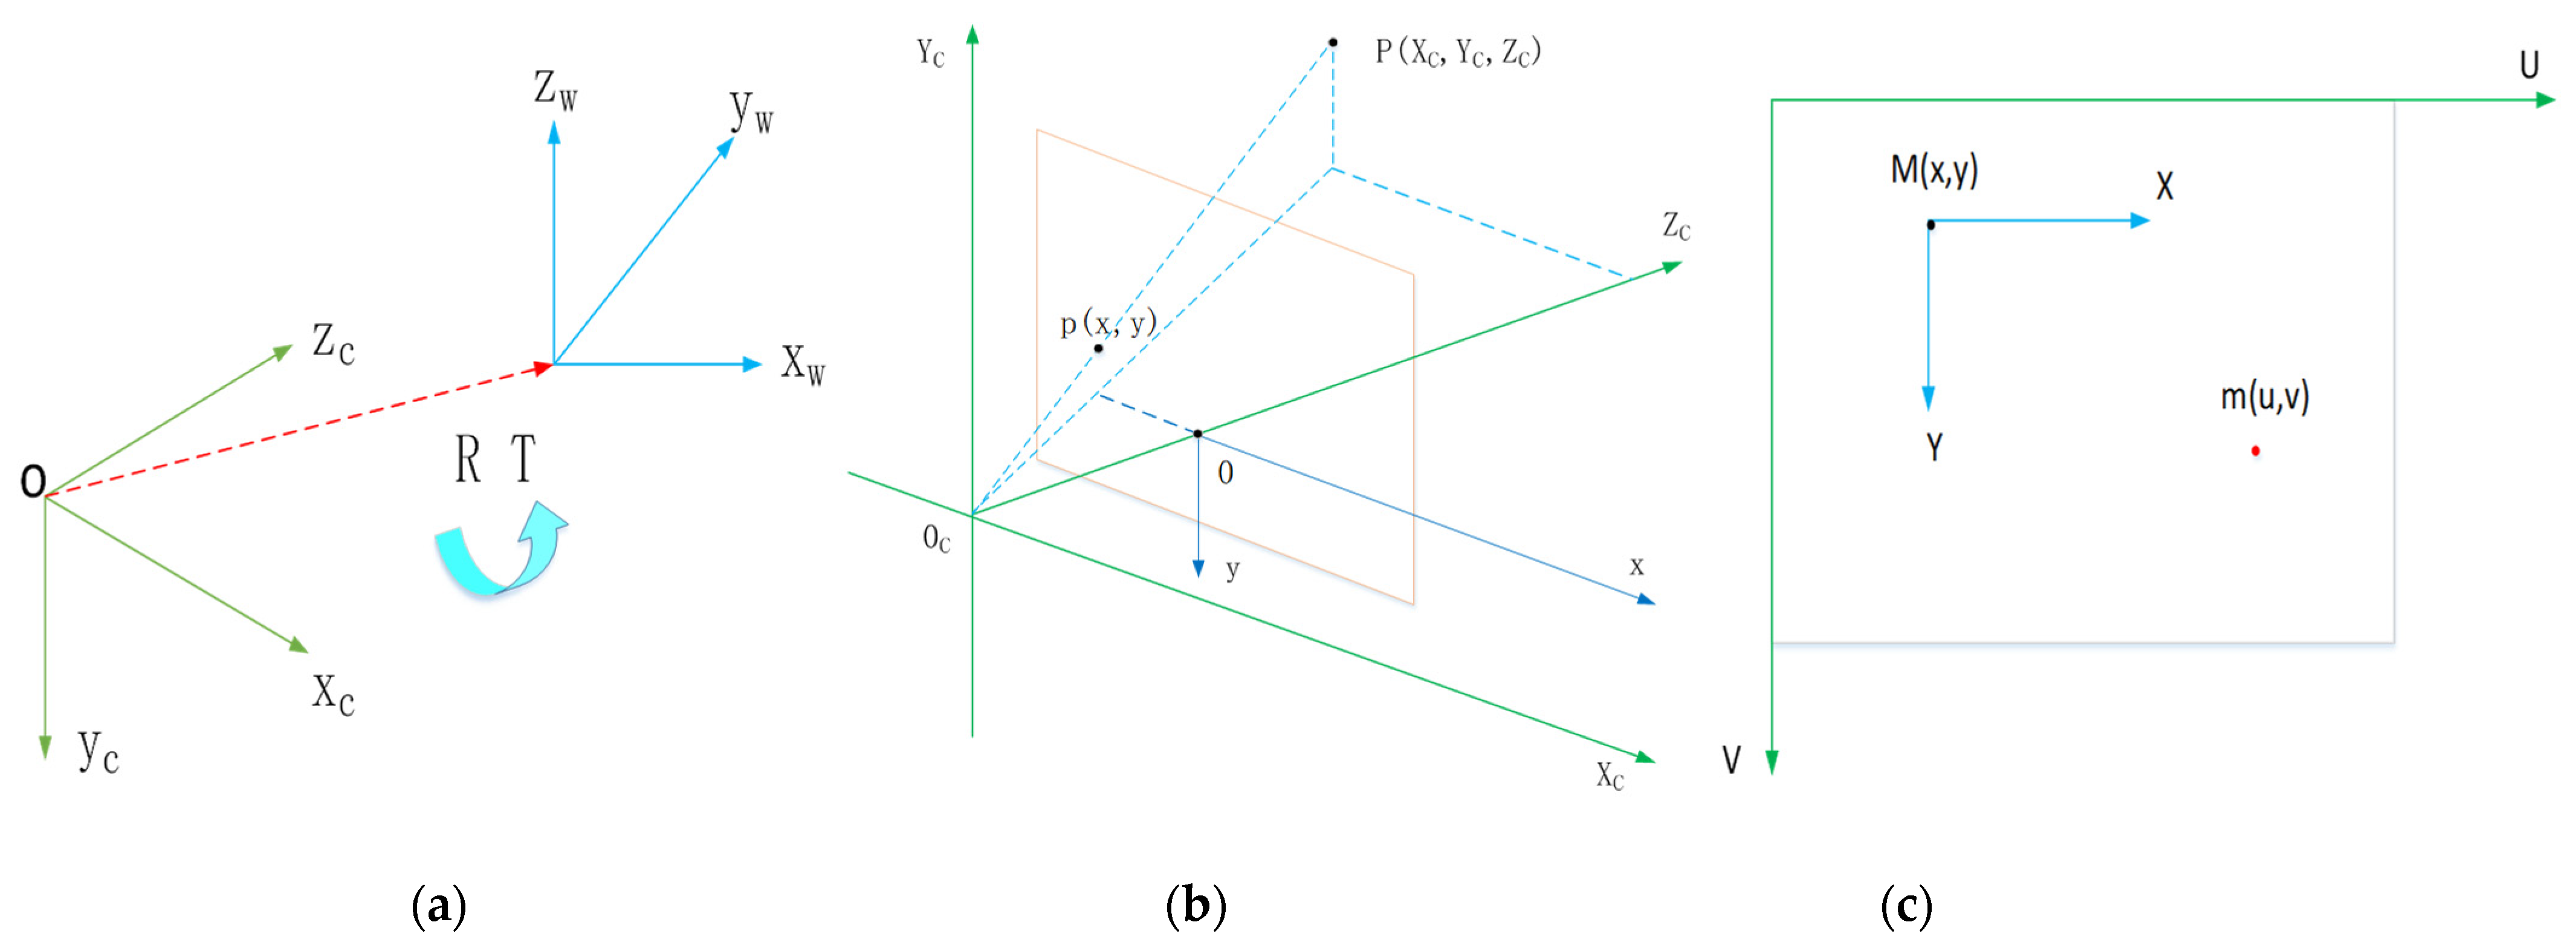
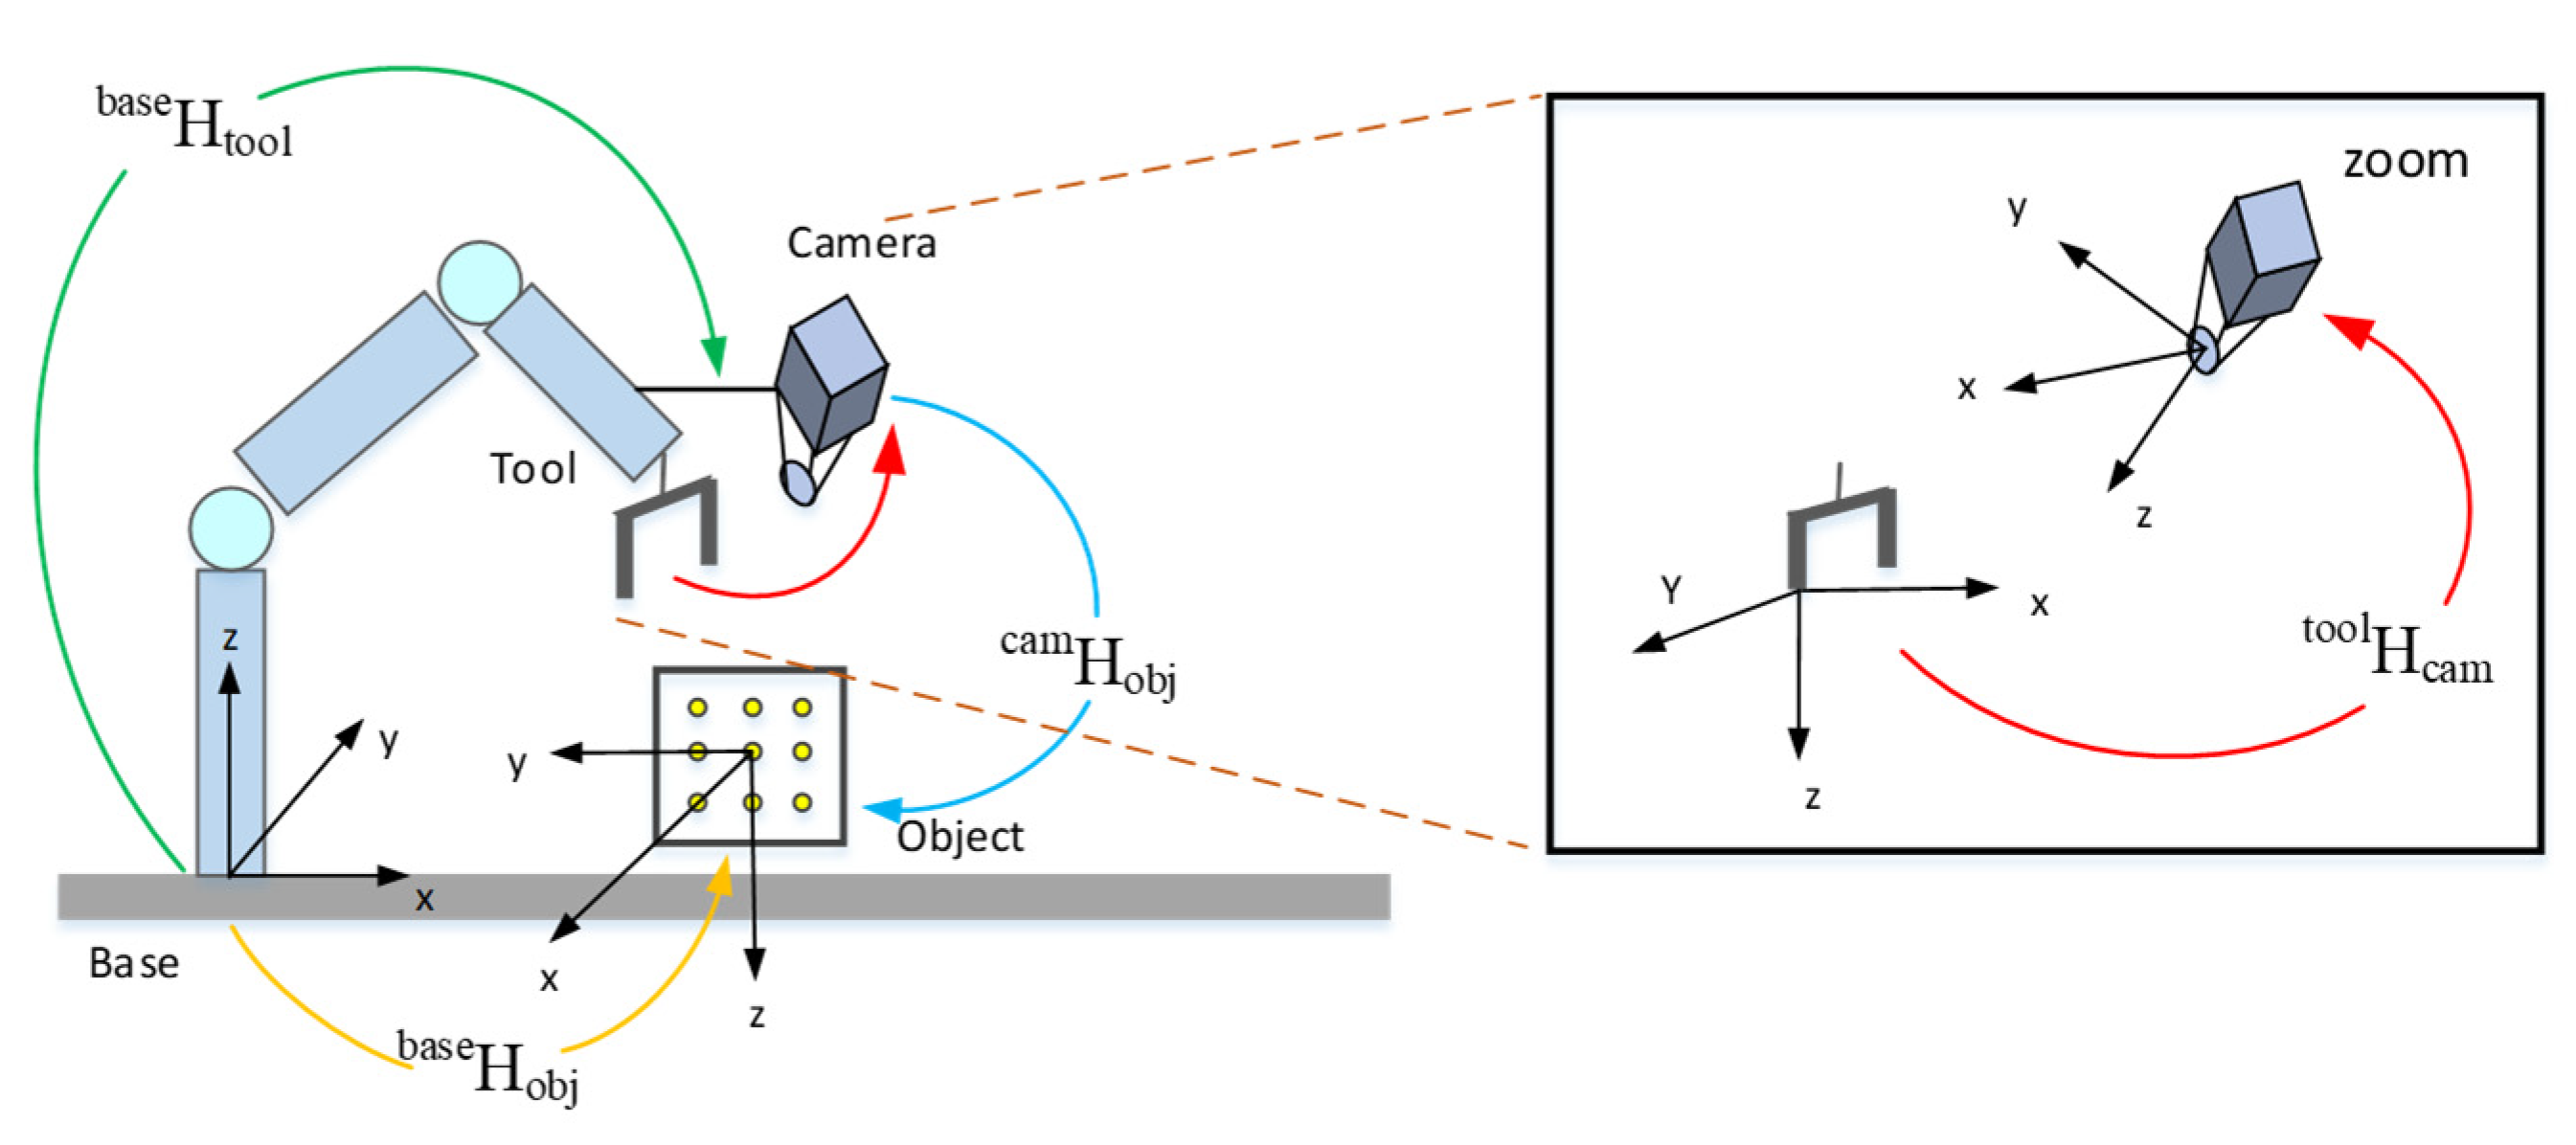
3.2. Hand-Eye Calibration Method
3.2.1. Coordinate System Conversion
3.2.2. Eye-In-Hand
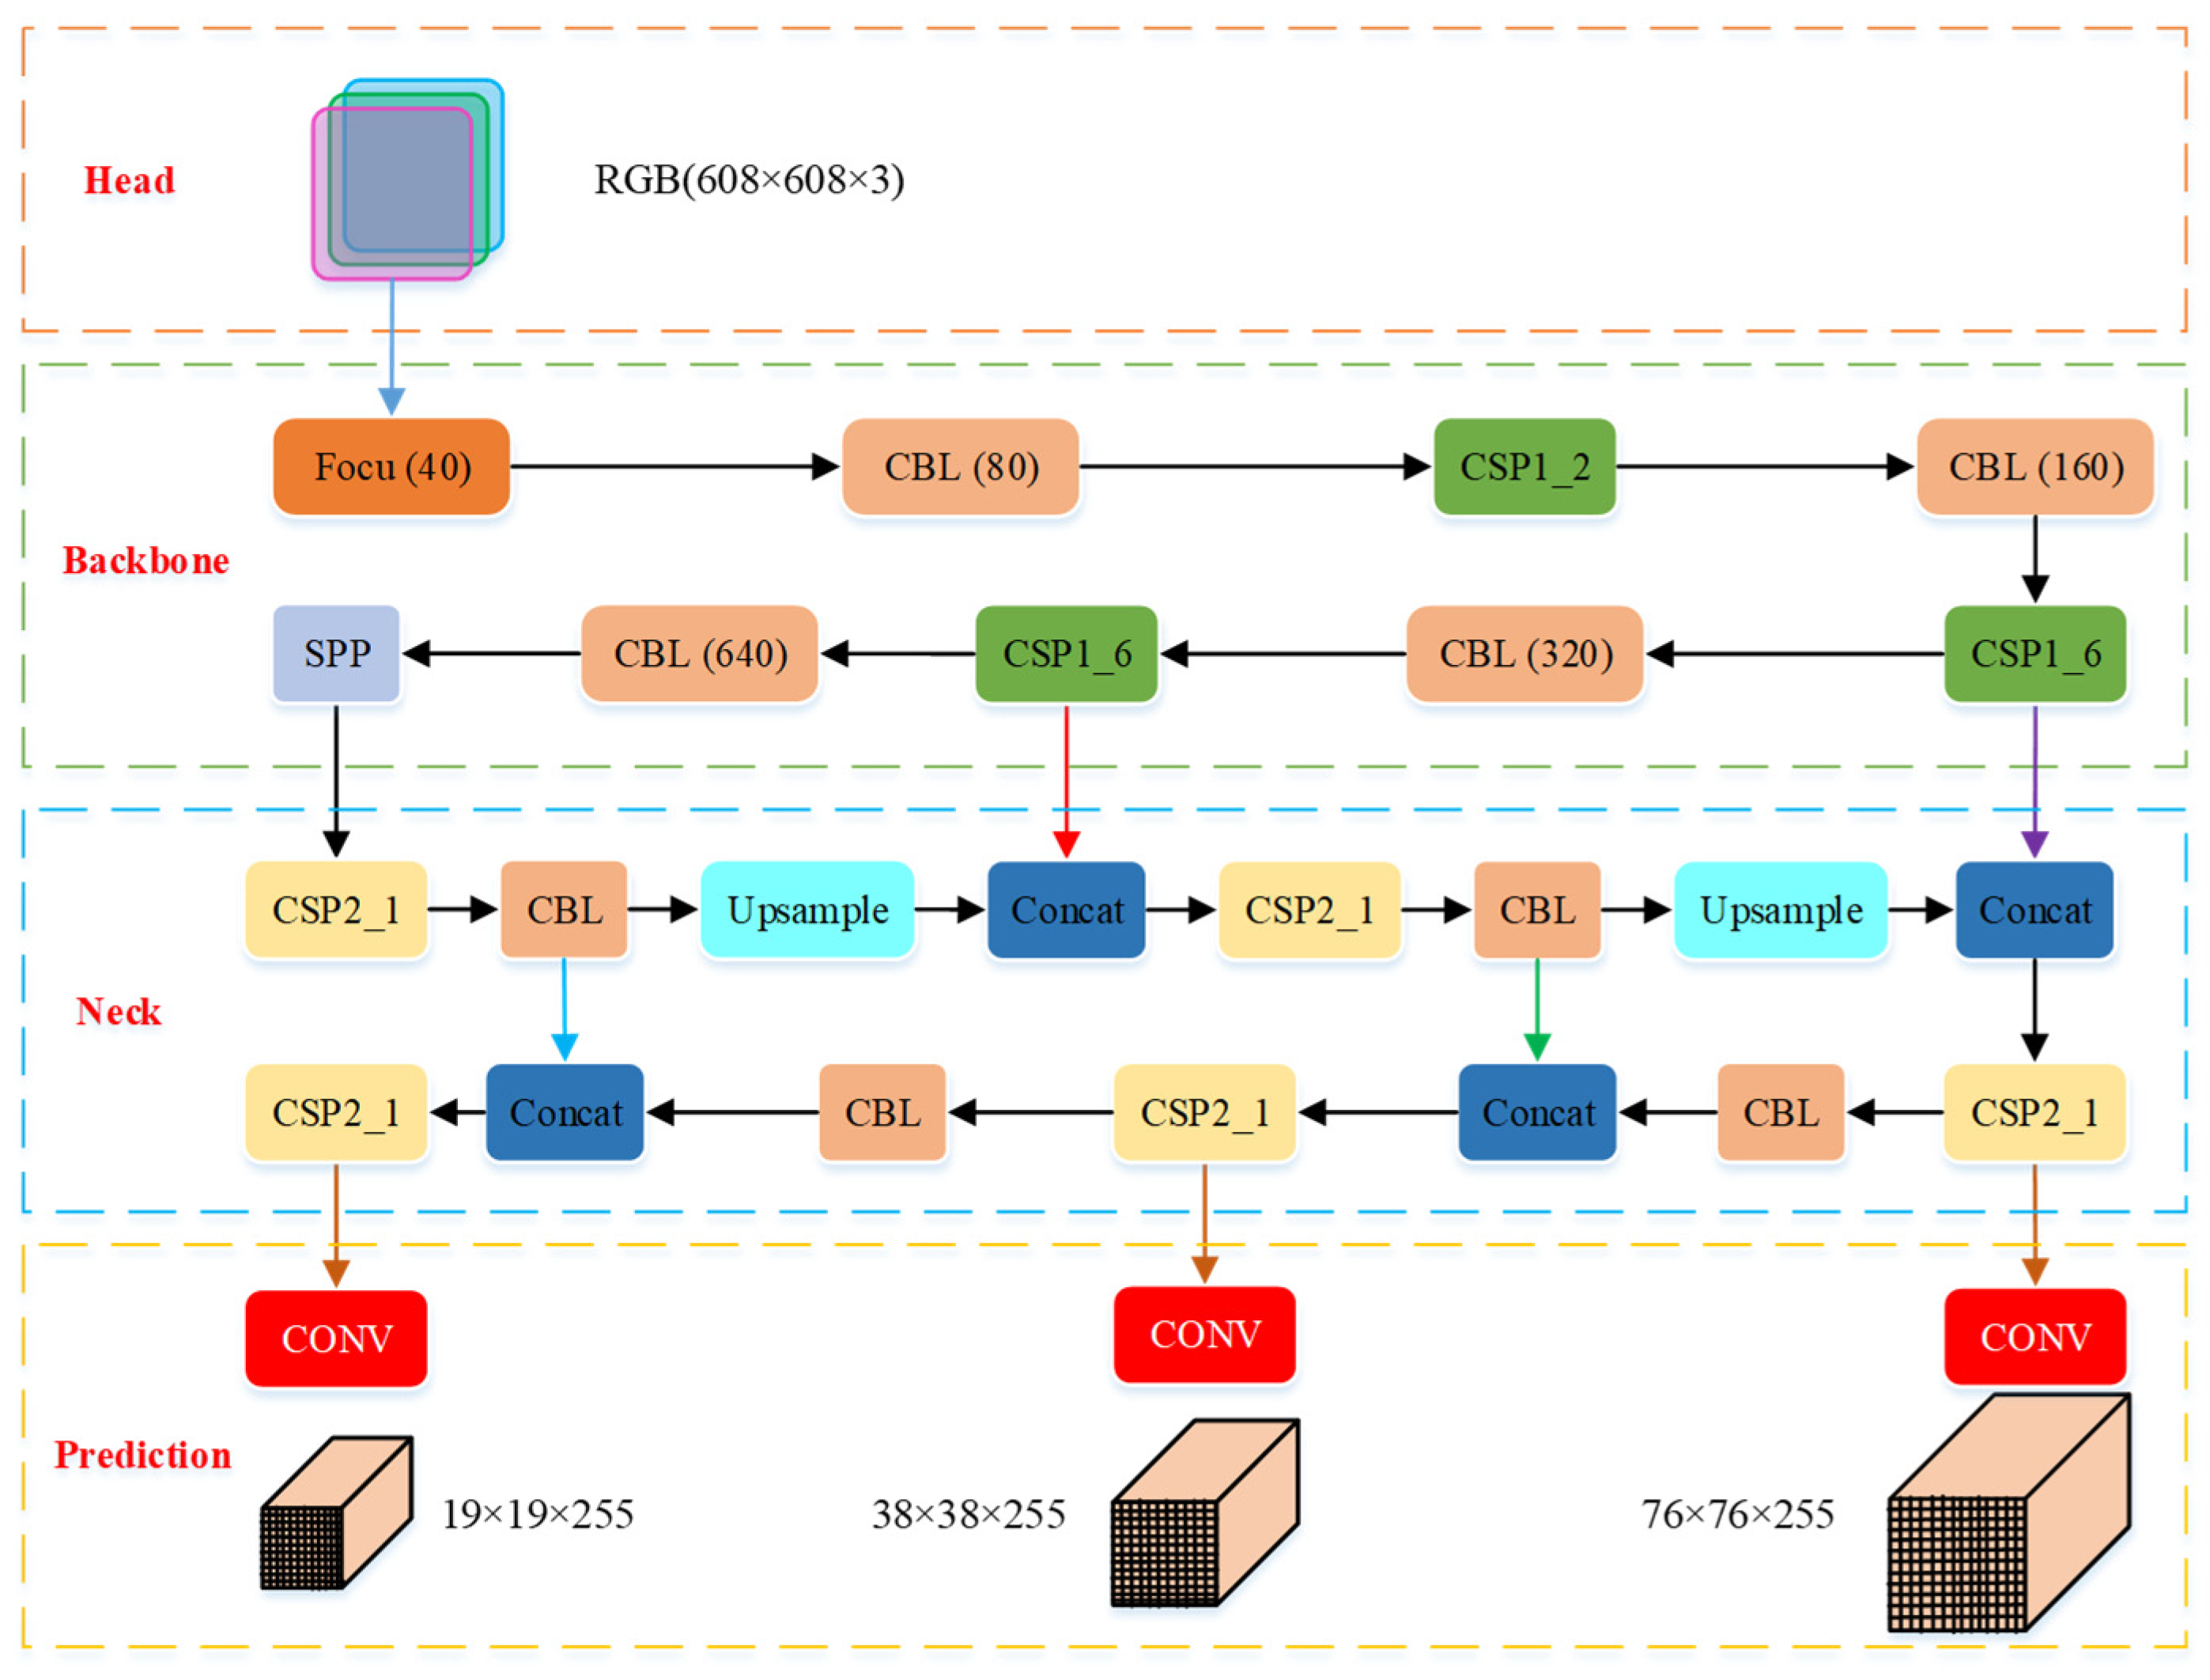
4. Improved YOLOv5 Network
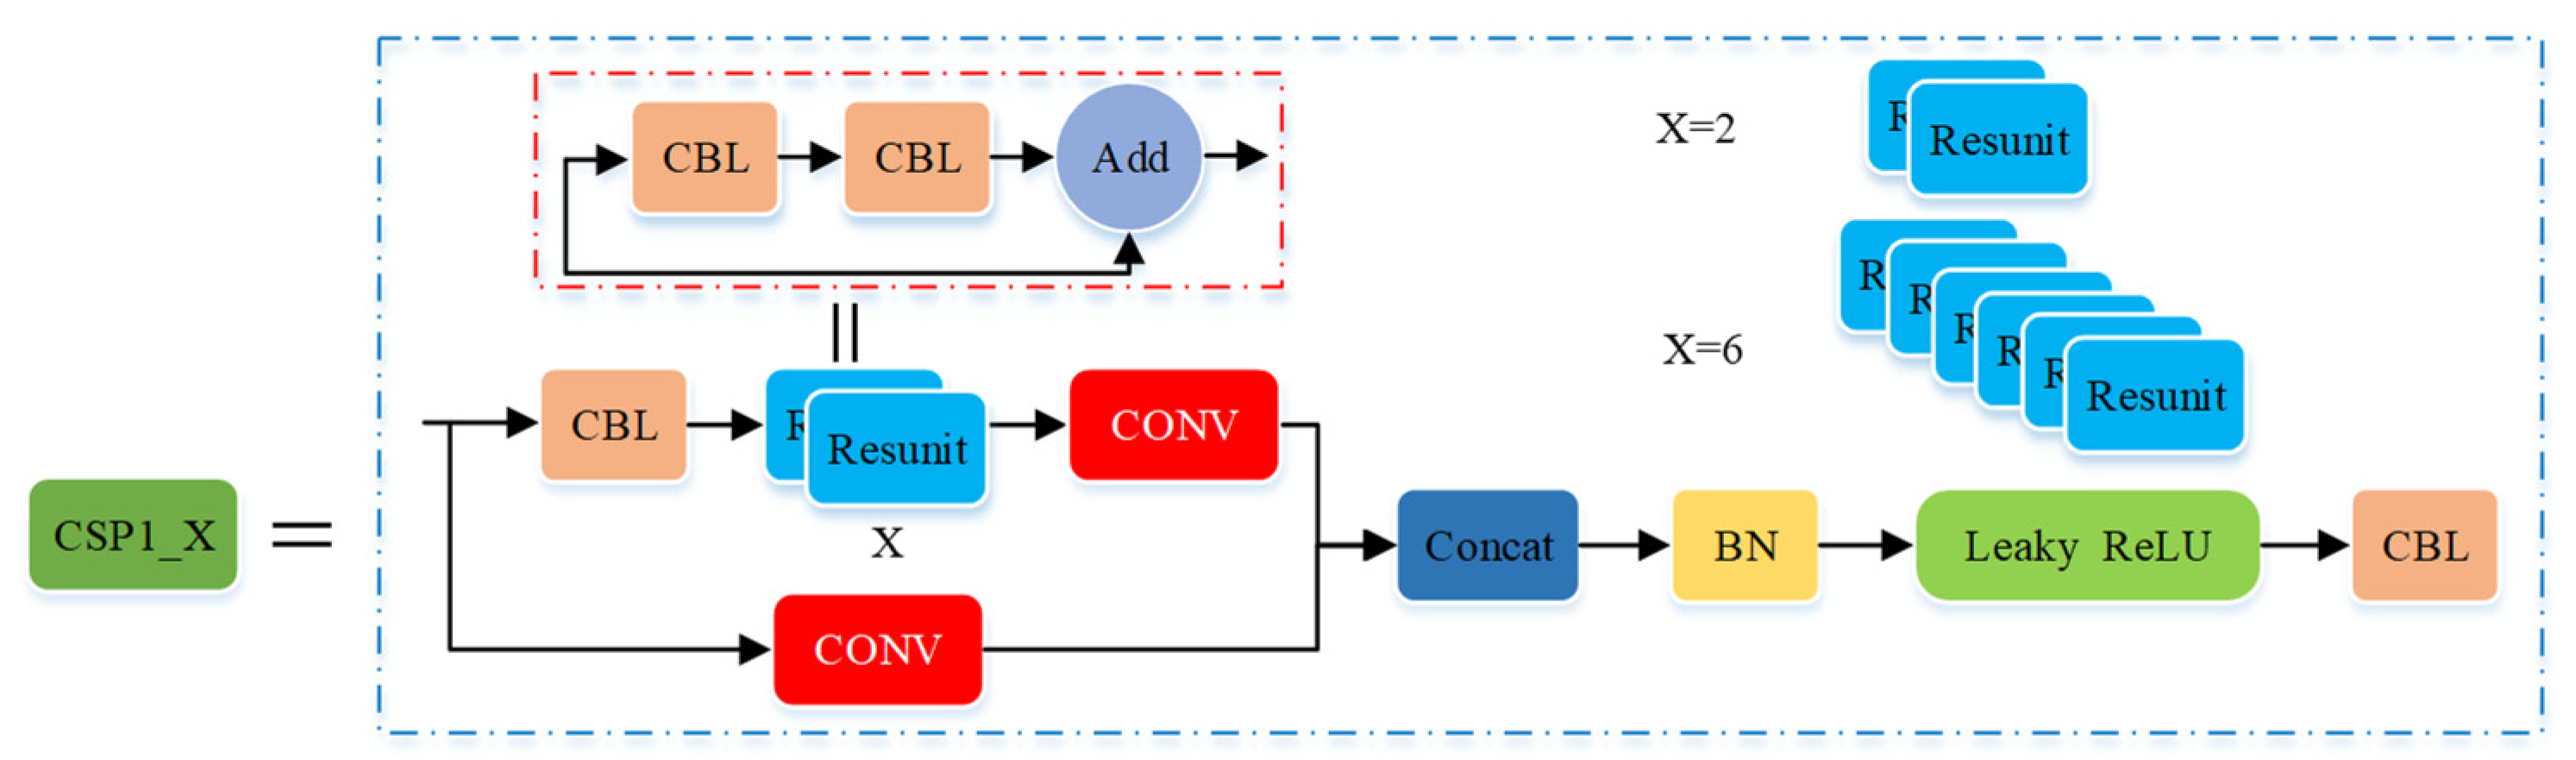
4.1. YOLOv5 Network
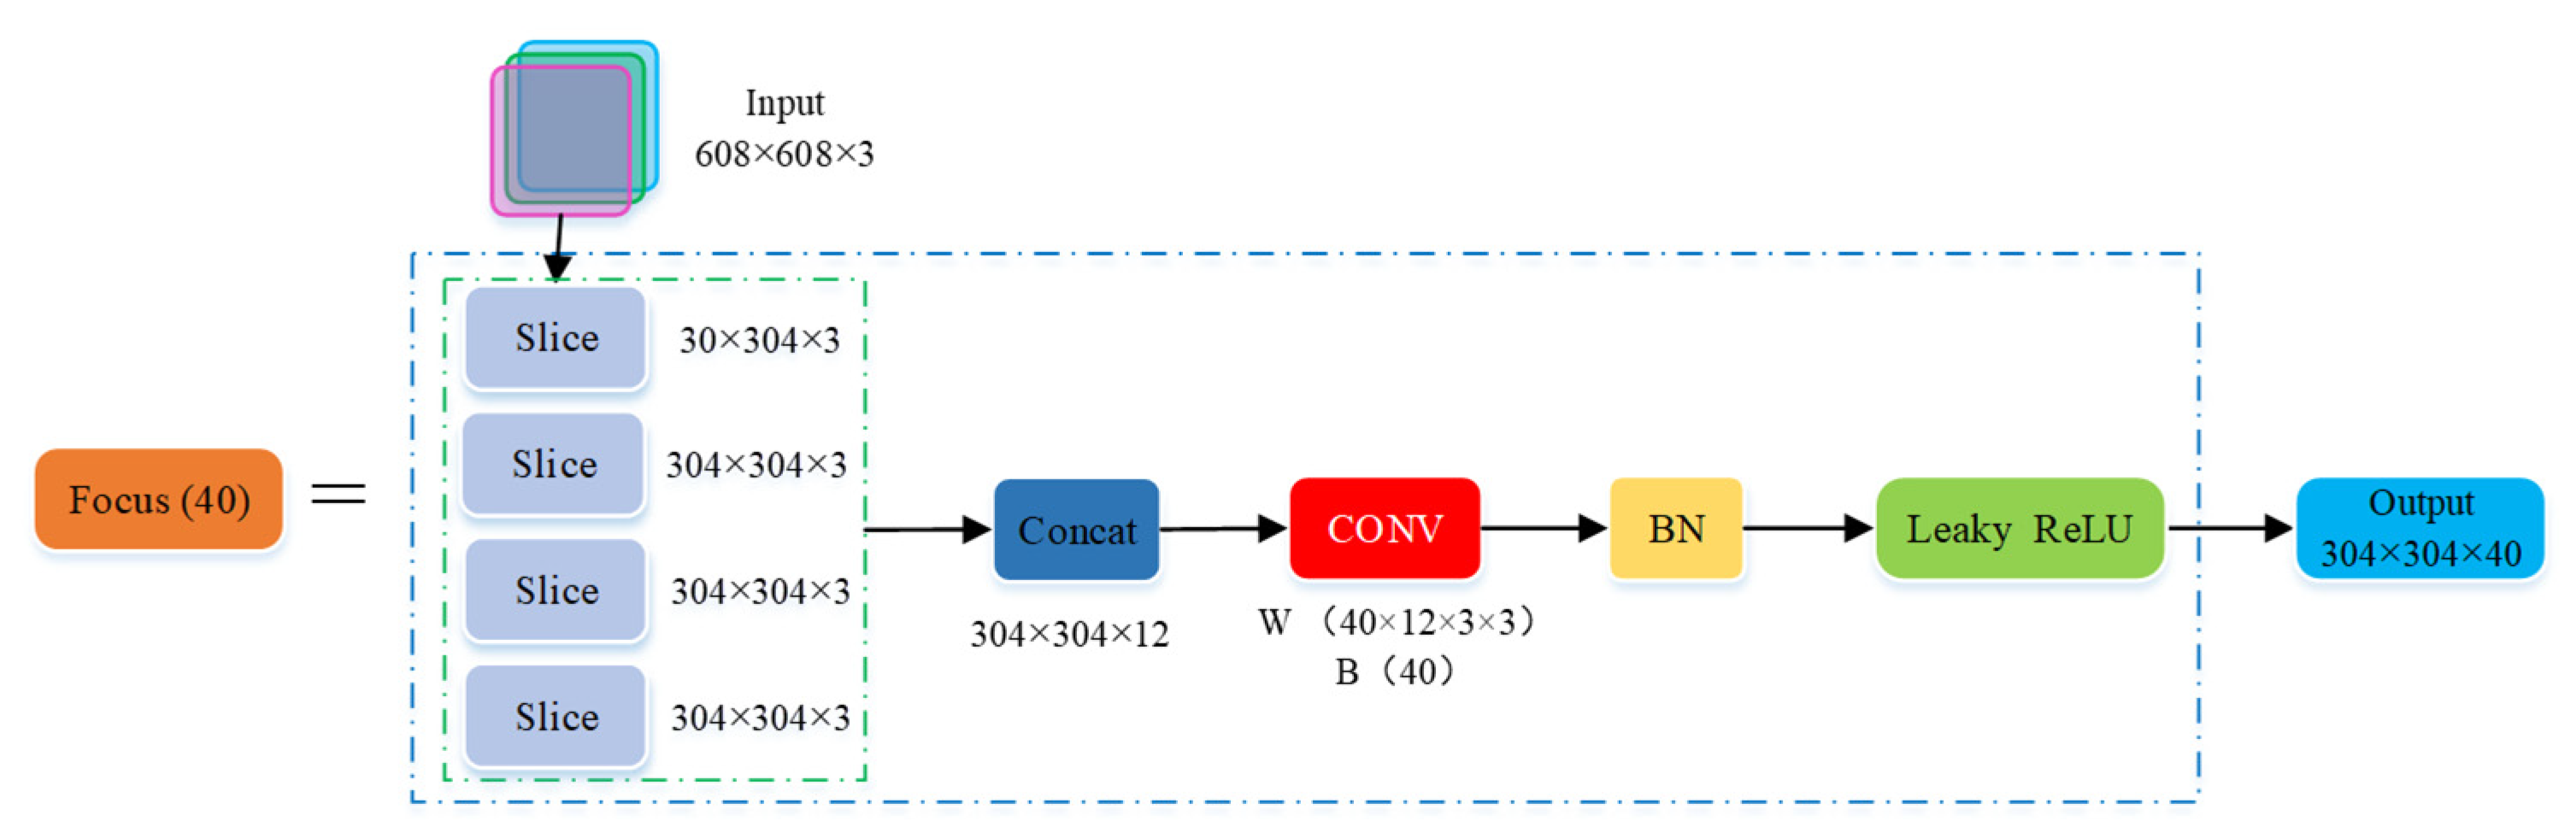
4.1.1. Characteristics of YOLOv5 Network Structure
4.1.2. Bounding-Box Regression and Loss Function
4.2. Improvement of YOLOv5 Network
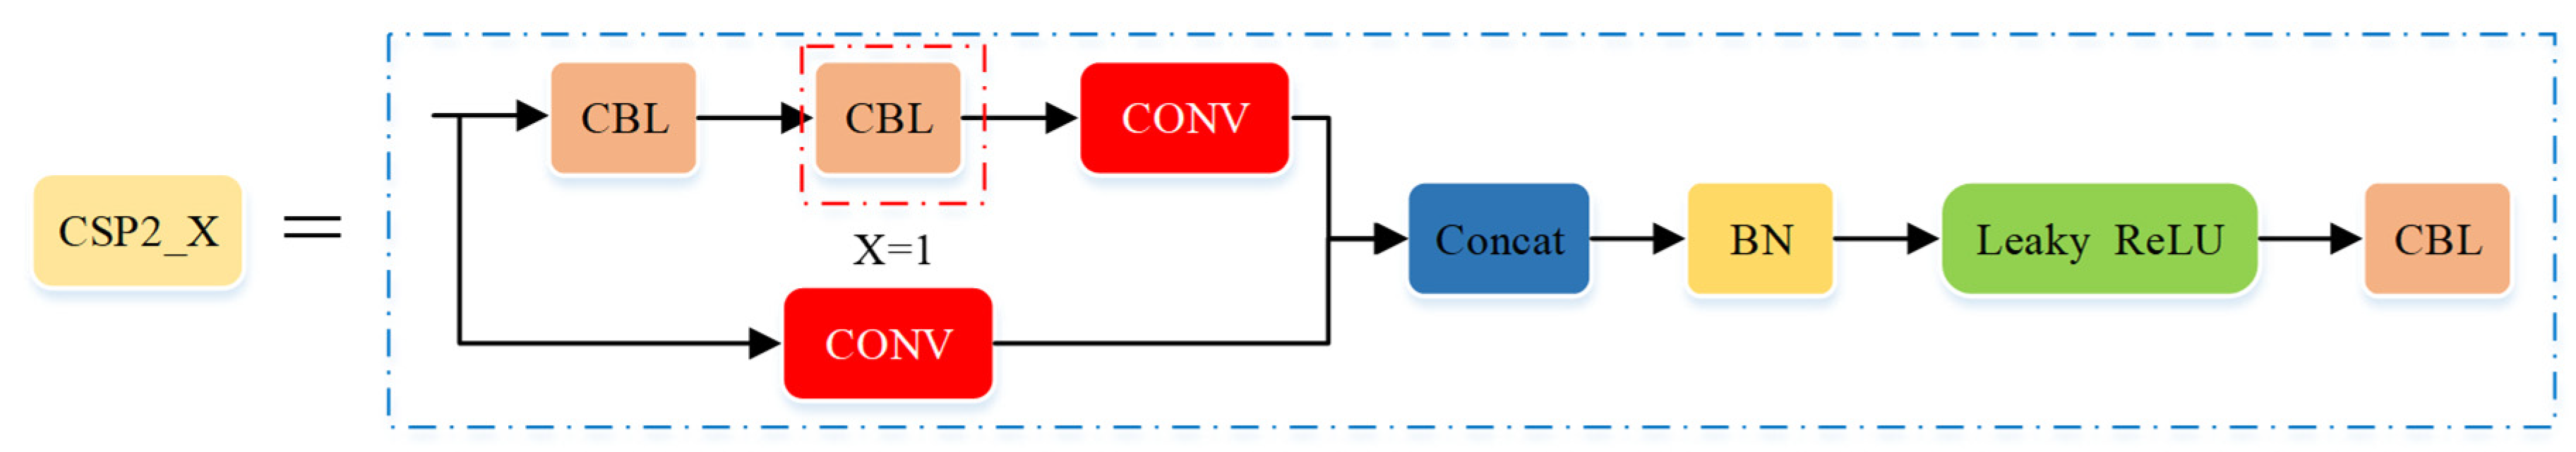
4.2.1. Improvement of YOLOv5 Network Structure
4.2.2. Improvement of YOLOv5 Network Strategy
5. Simulation and Experiment Results
5.1. Simulation
5.1.1. Training Platform
5.1.2. Model Simulations
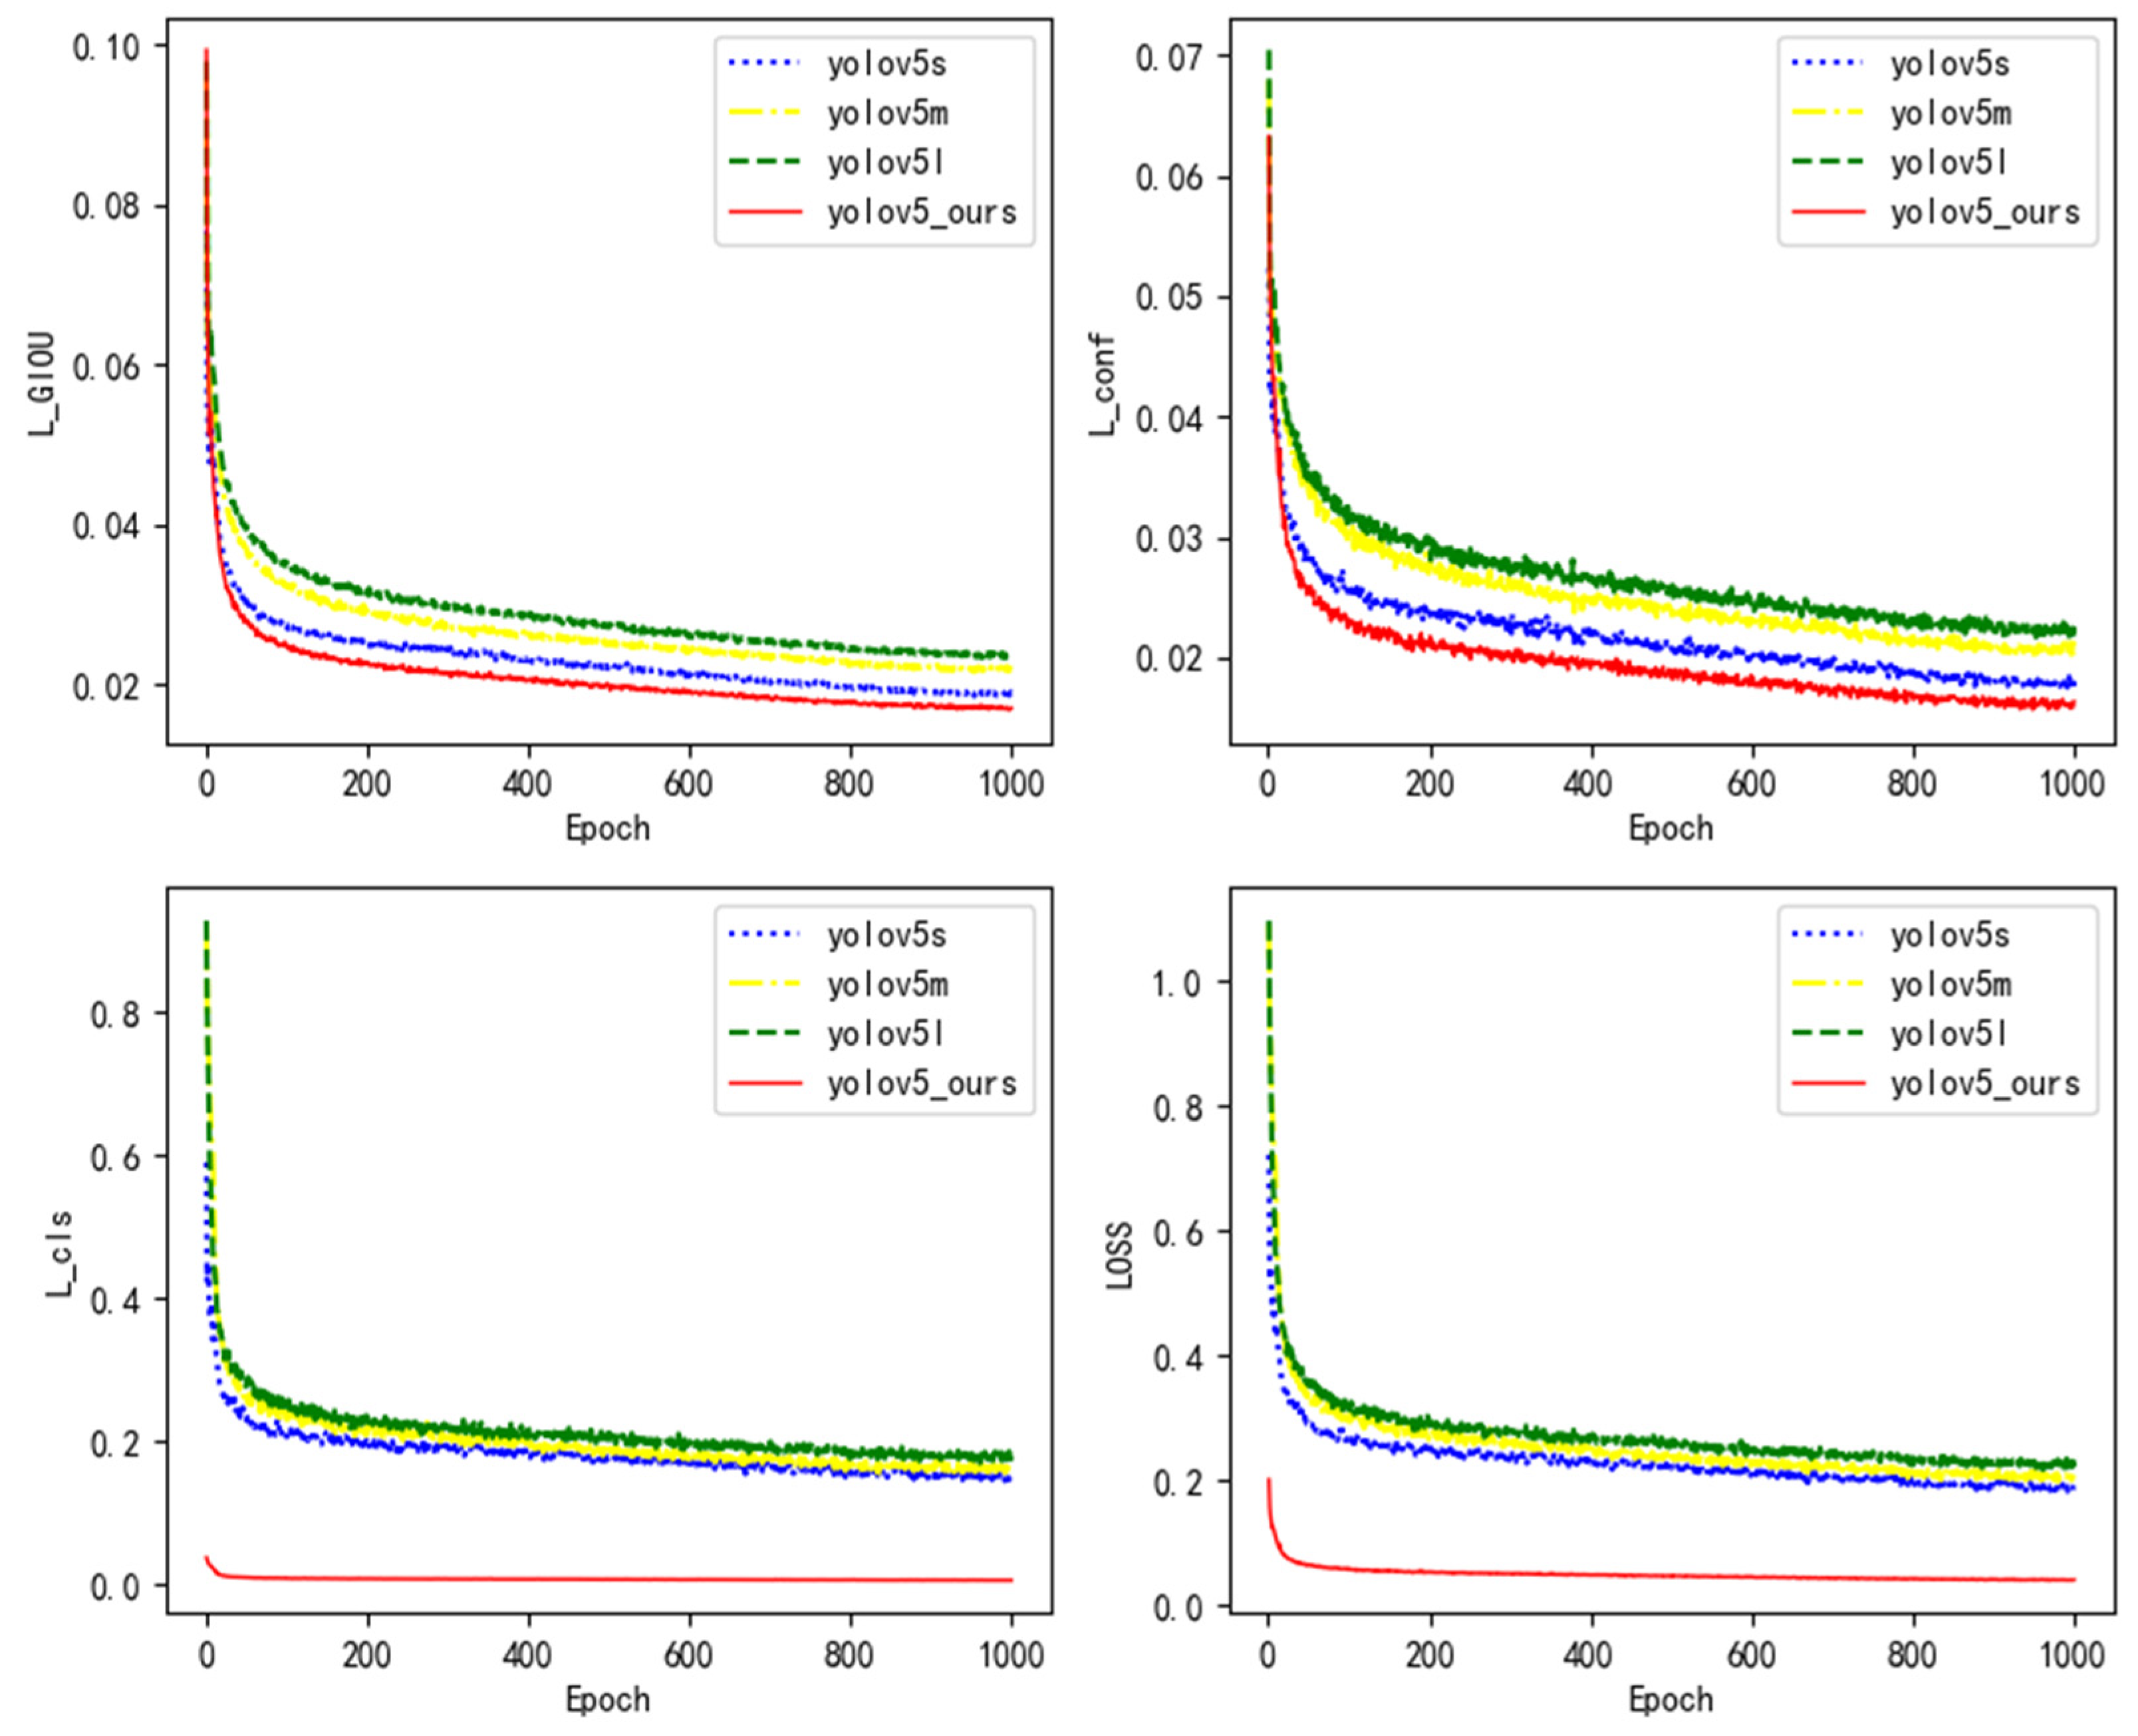
- (1)
- In Figure 14, the loss function of the YOLOv5l model converges the slowest and the loss value is the largest, followed by the YOLOv5m and YOLOv5s models, and the loss function of the YOLOv5_ours model converges the fastest and the loss value is the smallest.
- (2)
- It can be seen from Figure 14 that the YOLOV5_ours model loss function convergence curve drops the fastest, and the loss value stabilizes after 200 iterations, indicating that the improved YOLOv5 model proposed in this paper has a better object detection effect.
5.2. Simulation Analysis
- (1)
- In Table 5, the precision, recall, mAP value and F1 score of the proposed model were 99.35%, 99.38%, 99.43% and 99.41%, respectively.
- (2)
- It can be seen from Table 5 that the YOLOv5_ours model proposed in this paper has the highest precision and mAP value. The precision value was 1.11%, 1.16% and 1.24% higher than the YOLOv5s, YOLOv5m and the YOLOv5l networks, respectively, and the mAP value was 1.12%, 1.2% and 1.27% higher than YOLOv5s, YOLOv5m and the YOLOv5l network respectively, indicating that the YOLOv5_ours model has the best object detection accuracy among the four methods.
- (3)
- It can be seen from Table 5 that the YOLOv5_ours model proposed in this paper has the highest recall value and F1 score, where the recall value was 1.01%, 1.12% and 1.2% higher than the YOLOv5s, YOLOv5m and YOLOv5l networks, respectively, the F1 score was 1.13%, 1.2% and 1.28% higher than the YOLOv5s, YOLOv5m and YOLOv5l networks respectively, indicating that the YOLOv5_ours model has the best effect on object recognition among the four methods.
- (4)
- It can be seen from Table 5 that the size of the YOLOv5_ours model proposed in this paper is only 12.5 MB. Compared with the original YOLOv5s, YOLOv5m and YOLOv5l models, the scale of the model has been reduced by 10.71%, 70.93% and 86.84%, respectively, indicating that the YOLOv5_ours model can not only guarantee the recognition accuracy, but also realize the lightweight properties of the network effectively.
- (5)
- Overall, the YOLOv5_ours model proposed in this paper has the highest precision, recall, mAP value and F1 score among the four network models; additionally, it has lightweight properties and can be deployed well in embedded systems.
5.3. Experiment Results
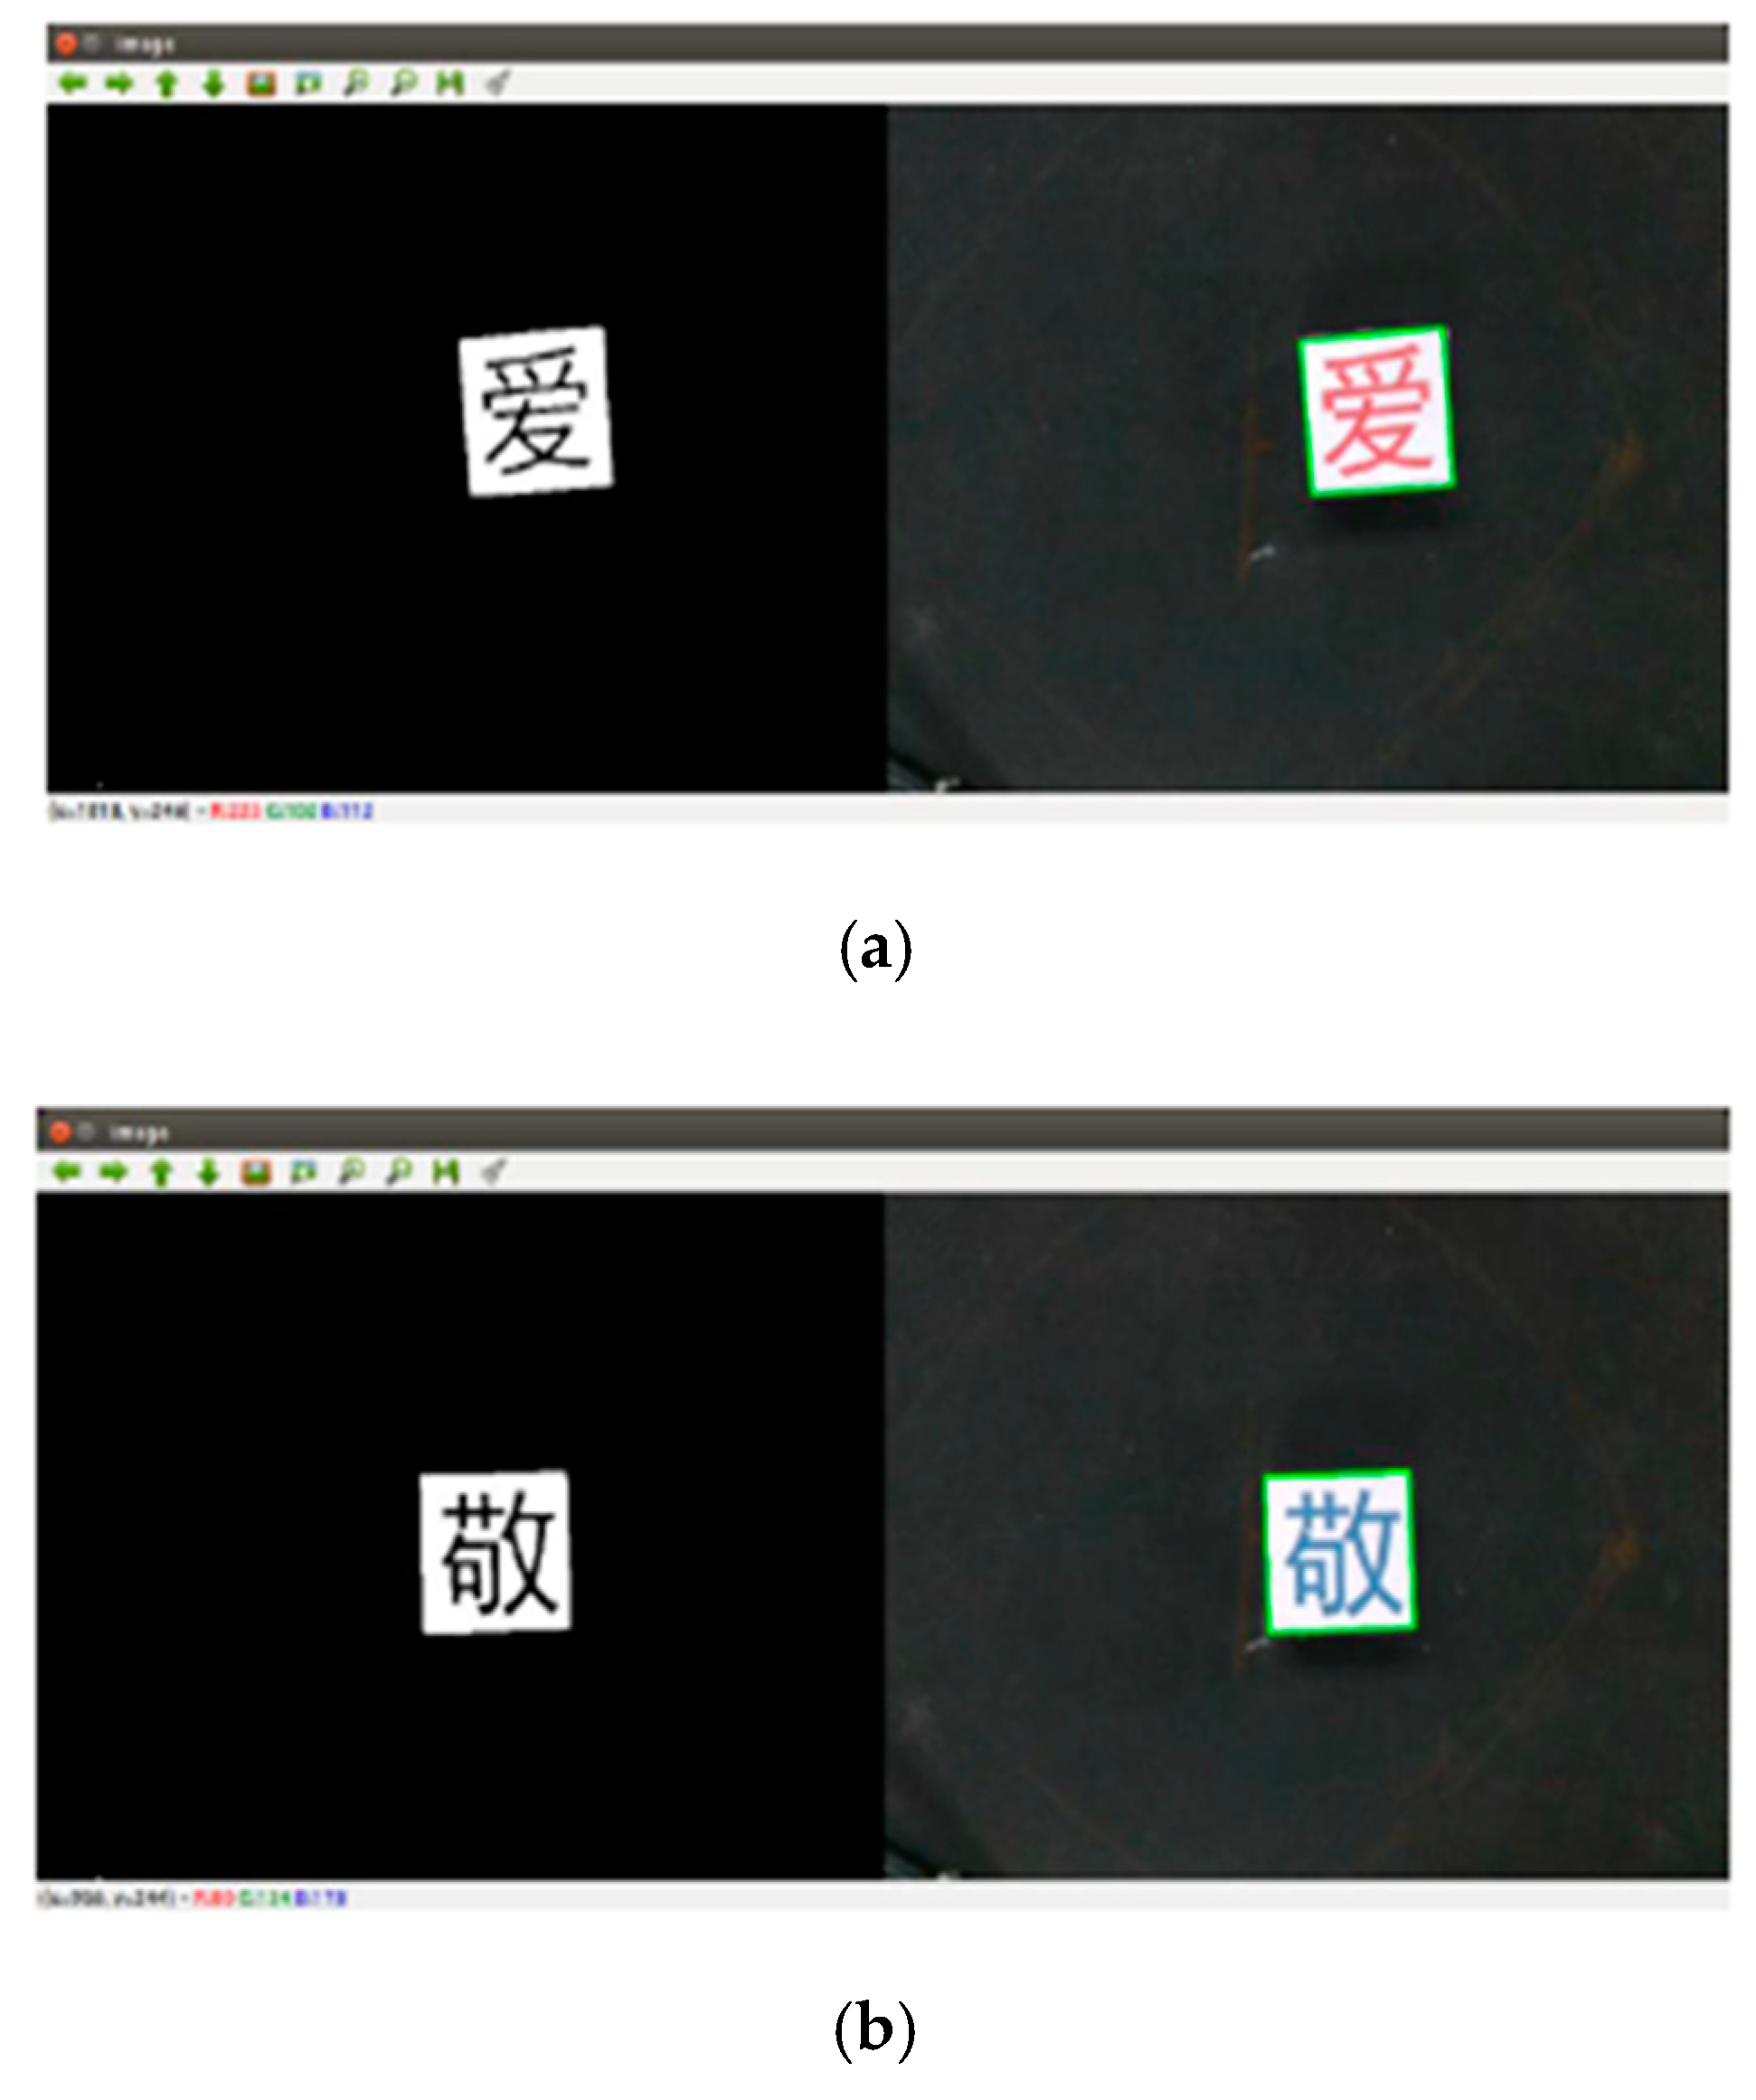
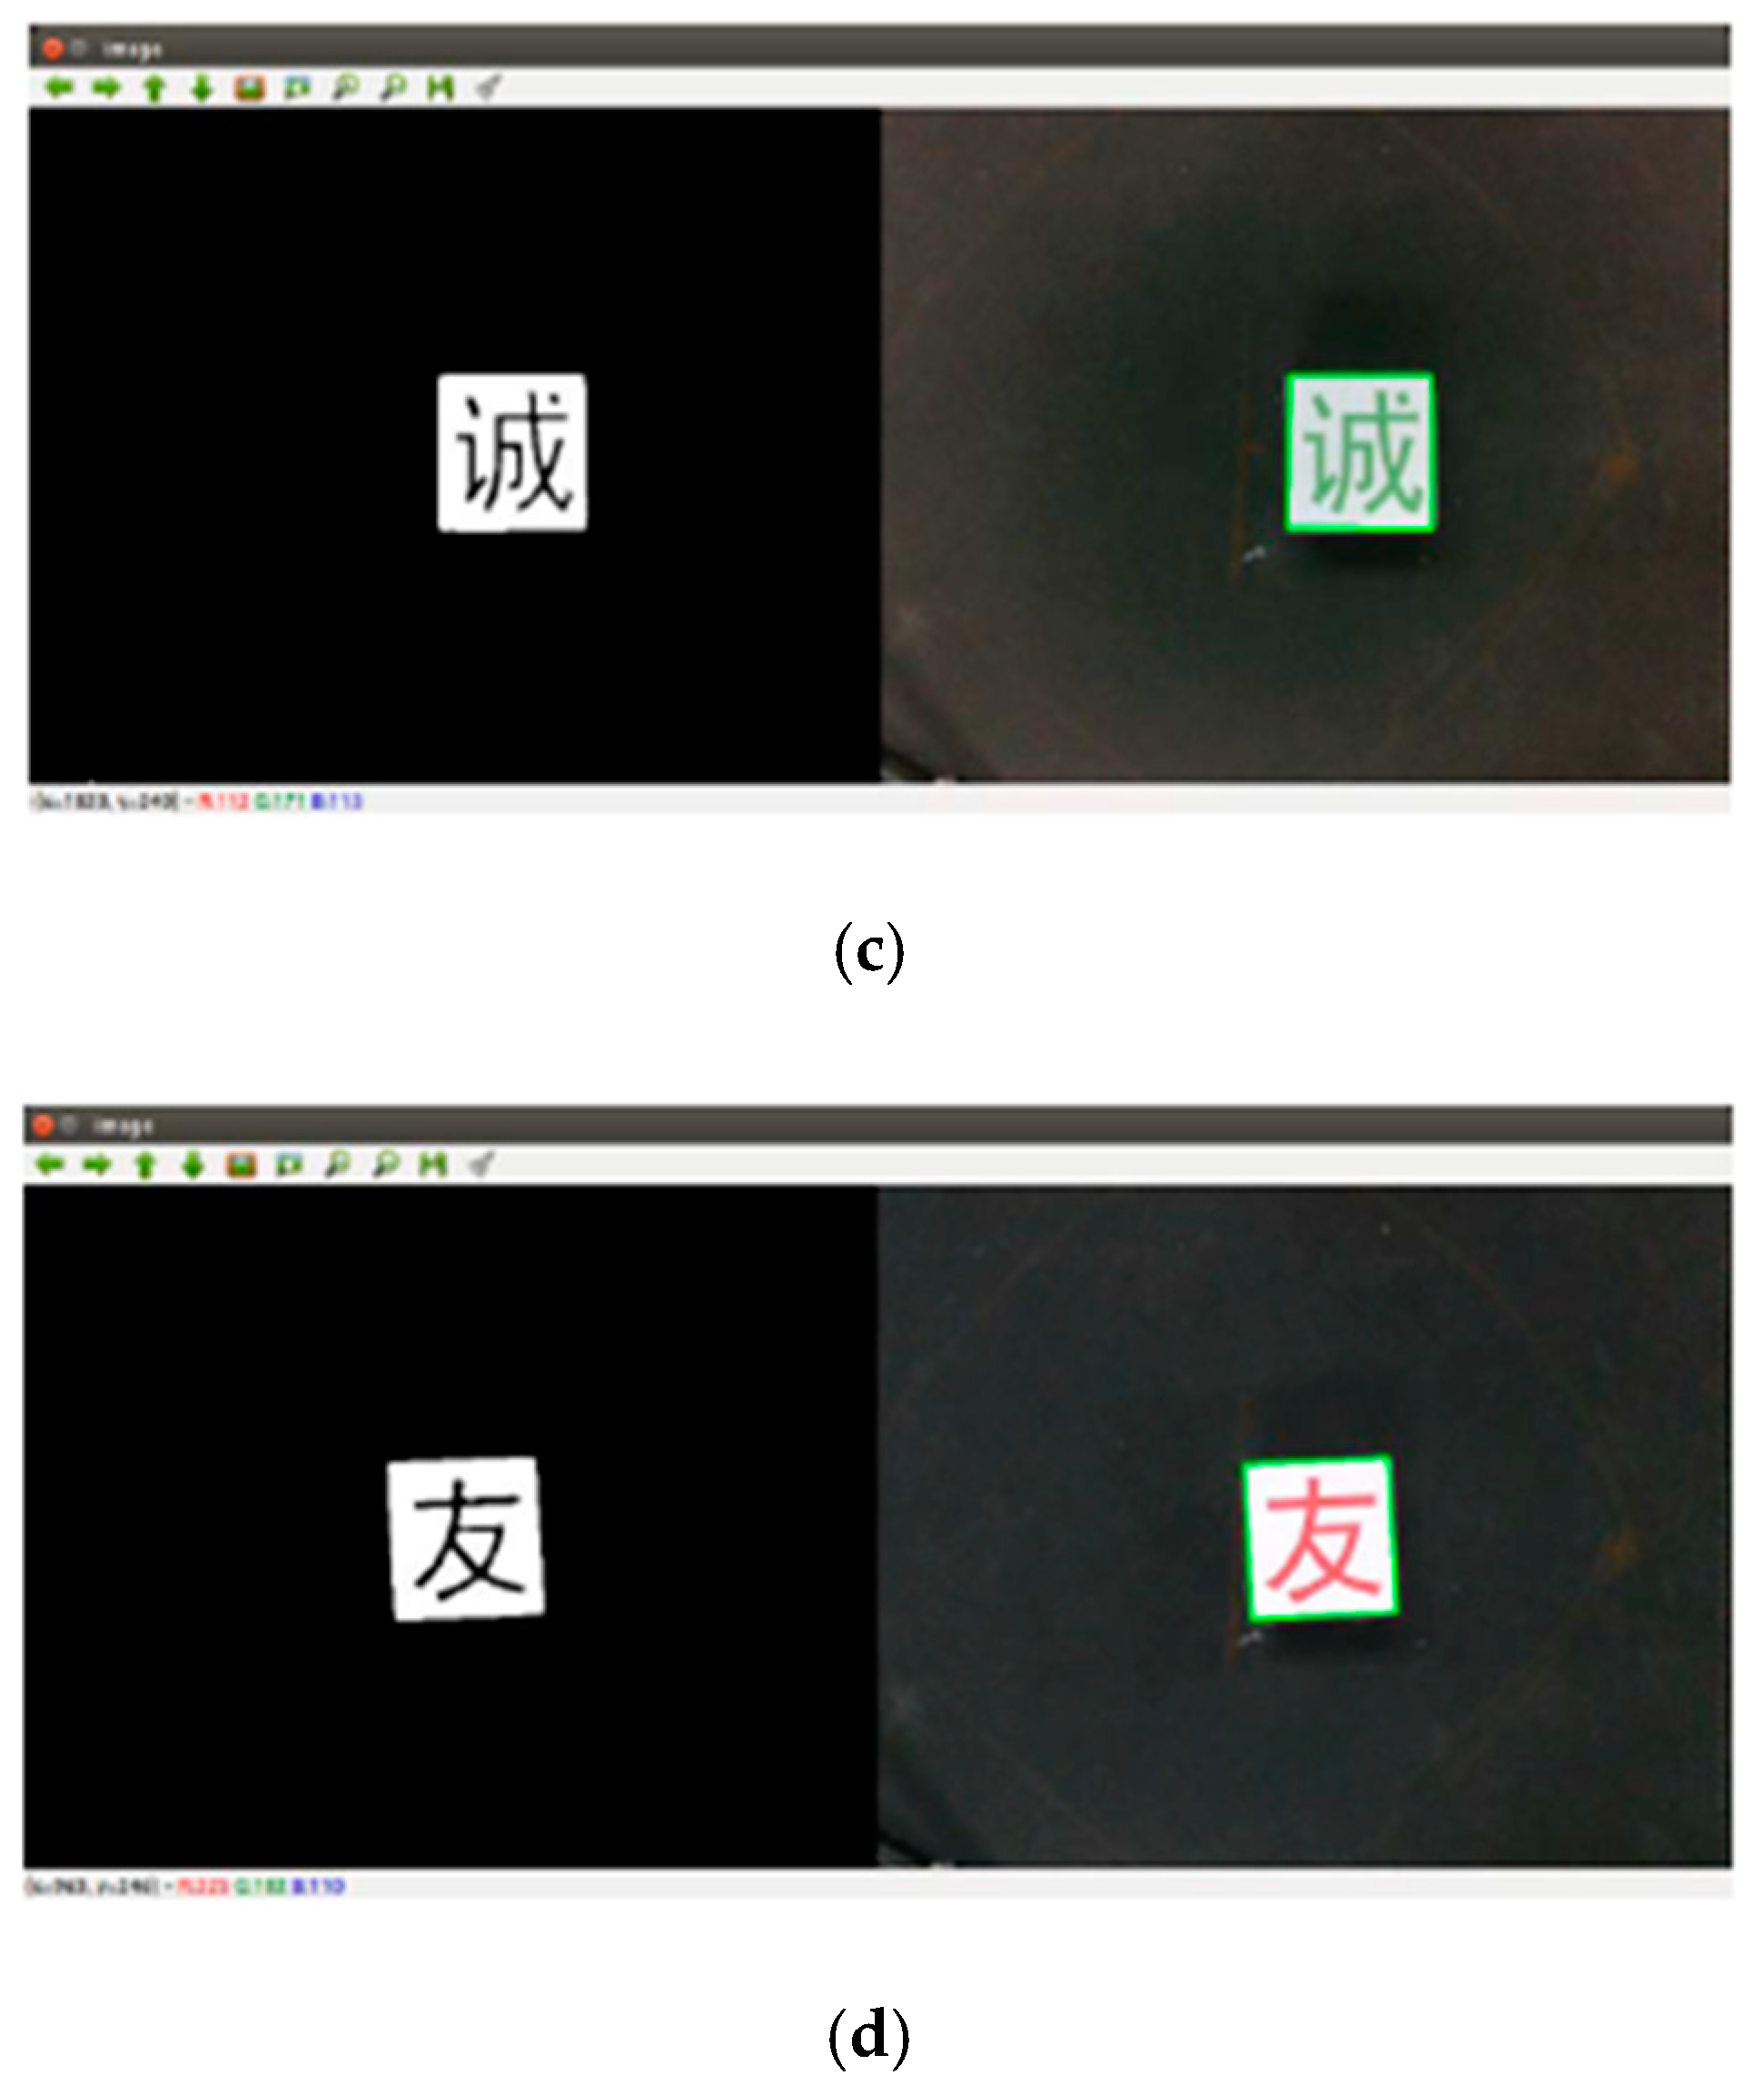
- (1)
- Figure 15 shows the recognition results of four different Chinese character wooden blocks, where the left side of the image is the actual object detected by the camera, and the right side is the recognition result of the actual object.
- (2)
- It can be seen from Figure 15 that the actual recognition result of the Xarm robot on the wooden block is very clear, and the effective recognition and calibration of the object can be achieved.
- (3)
- It can be seen from Figure 15 that the method proposed in this paper has good object detection accuracy, can be applied to the actual production operations, and has great theoretical research and application value.
6. Conclusions
Author Contributions
Funding
Data Availability Statement
Conflicts of Interest
References
- Hoeser, T.; Bachofer, F.; Kuenzer, C. Object detection and image segmentation with deep learning on earth observation data: A review-part II: Applications. Remote Sens. 2020, 12, 3053. [Google Scholar] [CrossRef]
- Yu, S.; Xiao, J.; Zhang, B. Fast pixel-matching for video object segmentation. Signal Process. Commun. 2021, 98, 116373. [Google Scholar] [CrossRef]
- Sun, C.; Li, C.; Zhang, J. Hierarchical conditional random field model for multi-object segmentation in gastric histopathology images. Electron. Lett. 2020, 56, 750–753. [Google Scholar] [CrossRef]
- Yang, R.; Yu, Y. Artificial Convolutional Neural Network in Object Detection and Semantic Segmentation for MedicalImaging Analysis. Front. Oncol. 2021, 11, 573. [Google Scholar] [CrossRef]
- Wosner, O.; Farjon, G.; Bar-Hillel, A. Object detection in agricultural contexts: A multiple resolution benchmark and comparison to human. Comput. Electron. Agric. 2021, 189, 106404. [Google Scholar] [CrossRef]
- Gengec, N.; Eker, O.; CevIkalp, H. Visual object detection for autonomous transport vehicles in smart factories. Turkish J. Electr. Eng. Comput. Sci. 2021, 29, 2101–2115. [Google Scholar] [CrossRef]
- Bai, Q.; Li, S.; Yang, J.; Song, Q.; Li, Z.; Zhang, X. Object detection recognition and robot grasping based on machine learning: A survey. IEEE Access 2020, 8, 181855–181879. [Google Scholar] [CrossRef]
- Yang, J.; Li, S.; Wang, Z.; Dong, H.; Wang, J.; Tang, S. Using deep learning to detect defects in manufacturing: A comprehensive survey and current challenges. Materials 2020, 13, 5755. [Google Scholar] [CrossRef]
- Sharma, V.; Mir, R.N. A comprehensive and systematic look up into deep learning based object detection techniques: A review. Comput. Sci. Rev. 2020, 38, 100301. [Google Scholar] [CrossRef]
- Liu, W.; Anguelov, D.; Erhan, D.; Szegedy, C.; Reed, S.; Fu, C.Y.; Berg, A.C. SSD: Single Shot MultiBox Detector. Eur. Conf. Comput. Vis. 2016, 1, 21–37. [Google Scholar] [CrossRef] [Green Version]
- Redmon, J.; Divvala, S.; Girshick, R.; Farhadi, A. You only look once: Unified, real-time object detection. In Proceedings of the IEEE Conference on Computer Vision and Pattern Recognition, Las Vegas, NV, USA, 26 June–1 July 2016; Volume 2016, pp. 779–788. [Google Scholar] [CrossRef] [Green Version]
- Redmon, J.; Farhadi, A. YOLO9000: Better, Faster, Stronger. In Proceedings of the IEEE Conference on Computer Vision and Pattern Recognition, Honolulu, HI, USA, 21–26 July 2017; pp. 6517–6525. [Google Scholar] [CrossRef] [Green Version]
- Redmon, J.; Farhadi, A. YOLOv3: An Incremental Improvement. arXiv 2018, arXiv:1804.02767. Available online: https://pjreddie.com/yolo (accessed on 1 June 2018).
- Bochkovskiy, A.; Wang, C.; Liao, H.M. YOLOv4: Optimal Speed and Accuracy of Object Detection. arXiv 2020, arXiv:2004.10934. Available online: https://github.com/AlexeyAB/darknet (accessed on 1 June 2020).
- Ultralytics YOLOv5. 2021. Available online: https://zenodo.org/record/5563715#.YW-qdBy-vIU (accessed on 1 June 2021). [CrossRef]
- Girshick, R.; Donahue, J.; Darrell, T.; Malik, J.; Berkeley, U.C. Rich feature hierarchies for accurate object detection and semantic segmentation. IEEE Comput. Soc. 2013, 10, 580–587. [Google Scholar] [CrossRef] [Green Version]
- Girshick, R. Fast R-CNN. Comput. Sci. 2015, 169, 10. [Google Scholar] [CrossRef]
- Ren, S.; He, K.; Girshick, R.; Sun, J. Faster R-CNN: Towards Real-Time Object Detection with Region Proposal Networks. IEEE Trans. Pattern Anal. Mach. Intell. 2017, 39, 1137–1149. [Google Scholar] [CrossRef] [Green Version]
- Butte, S.; Vakanski, A.; Duellman, K. Potato crop stress identification in aerial images using deep learning-based object detection. Agron. J. 2021, 1–12. [Google Scholar] [CrossRef]
- Meda, K.C.; Milla, S.S.; Rostad, B.S. Artificial intelligence research within reach: An object detection model to identify rickets on pediatric wrist radiographs. Pediatr. Radiol. 2021, 51, 782–791. [Google Scholar] [CrossRef]
- Tang, P.; Guo, Y.; Li, H. Image dataset creation and networks improvement method based on CAD model and edge operator for object detection in the manufacturing industry. Mach. Vis. Appl. 2021, 32, 1–18. [Google Scholar] [CrossRef]
- Haris, M.; Glowacz, A. Road Object Detection: A Comparative Study of Deep Learning-Based Algorithms. Electron 2021, 10, 1932. [Google Scholar] [CrossRef]
- Zhao, J.; Li, C.; Xu, Z.; Jiao, L.; Zhao, Z.; Wang, Z. Detection of passenger flow on and off buses based on video images and YOLO algorithm. Multimed. Tools Appl. 2021, 3, 1–24. [Google Scholar] [CrossRef]
- Zhou, S.; Bi, Y.; Wei, X.; Liu, J.; Ye, Z.; Li, F.; Du, Y. Automated detection and classification of spilled loads on freeways based on improved YOLO network. Mach. Vis. Appl. 2021, 32, 44. [Google Scholar] [CrossRef]
- Ahn, H.; Cho, H.J. Research of automatic recognition of car license plates based on deep learning for convergence traffic control system. Pers. Ubiquitous Comput. 2021, 2, 1–10. [Google Scholar] [CrossRef]
- Huang, L.; Fu, Q.; He, M.; Jiang, D.; Hao, Z. Detection algorithm of safety helmet wearing based on deep learning. Concurr. Comput. 2021, 33, e6234. [Google Scholar] [CrossRef]
- Wu, W.; Yin, Y.; Wang, X.; Xu, D. Face detection with different scales based on faster R-CNN. IEEE Trans. Cybern. 2019, 49, 4017–4028. [Google Scholar] [CrossRef] [PubMed]
- Hu, C.; Liu, X.; Pan, Z.; Li, P. Automatic detection of single ripe tomato on plant combining faster R-CNN and intuitionistic fuzzy set. IEEE Access 2019, 7, 154683–154696. [Google Scholar] [CrossRef]
- Wong, D.W.K.; Yow, A.P.; Tan, B.; Xinwen, Y.; Chua, J.; Schmetterer, L. Localization of Anatomical Features in Vascular-enhanced Enface OCT Images. In Proceedings of the 2020 42nd Annual International Conference of the IEEE Engineering in Medicine & Biology Society (EMBC), Montréal, QC, Canada, 20–24 July 2020; pp. 1875–1878. [Google Scholar] [CrossRef]
- Halstead, M.; McCool, C.; Denman, S.; Perez, T.; Fookes, C. Fruit Quantity and Ripeness Estimation Using a Robotic Vision System. IEEE Robot. Autom. Lett. 2018, 3, 2995–3002. [Google Scholar] [CrossRef]
- Yan, B.; Fan, P.; Lei, X.; Liu, Z.; Yang, F. A real-time apple targets detection method for picking robot based on improved YOLOv5. Remote Sens. 2021, 13, 1619. [Google Scholar] [CrossRef]
- Ruan, D.; Zhang, W.; Qian, D. Feature-based autonomous target recognition and grasping of industrial robots. Pers. Ubiquitous Comput. 2021, 7, 1–13. [Google Scholar] [CrossRef]
- Shen, K.; Li, C.; Xu, D.; Wu, W.; Wan, H. Sensor-network-based navigation of delivery robot for baggage handling in international airport. Int. J. Adv. Robot. Syst. 2020, 17, 1–10. [Google Scholar] [CrossRef]
- Geng, M.; Xu, K.; Zhou, X.; Ding, B.; Wang, H.; Zhang, L. Learning to cooperate via an attention-based communication neural network in decentralized multi-robot exploration. Entropy 2019, 21, 294. [Google Scholar] [CrossRef] [Green Version]
- Mejías, A.; Herrera, R.S.; Márquez, M.A.; Calderón, A.; González, I.; Andújar, J. Easy handling of sensors and actuators over TCP/IP networks by open source hardware/software. Sensors 2017, 17, 94. [Google Scholar] [CrossRef] [PubMed] [Green Version]
- Connor, S.; Taghi, M.K. A survey on Image Data Augmentation for Deep Learning. J. Big Data 2019, 6, 60. [Google Scholar] [CrossRef]
- Kim, Y.J.; Choi, J.; Moon, J.; Sung, K.R.; Choi, J. A Sarcopenia Detection System Using an RGB-D Camera and an Ultrasound Probe: Eye-in-Hand Approach. Biosensors 2021, 11, 243. [Google Scholar] [CrossRef] [PubMed]
- LeCun, Y.; Bottou, L.; Bengio, Y.; Haffner, P. Gradient-Based Learning Applied to Document Recognition. Proc. IEEE 1998, 86, 2278–2324. [Google Scholar] [CrossRef] [Green Version]
- Yu, J.; Wang, Z. UnitBox: An Advanced Object Detection Network. In Proceedings of the 24th ACM International Conference on Multimedia, Amsterdam, The Netherlands, 15–19 October 2016; pp. 516–520. [Google Scholar] [CrossRef] [Green Version]
- Hamid, R.; Nathan, T.; Jun, G.; Amir, S.; Ian, R.; Silvio, S. Generalized Intersection over Union: A Metric and A Loss for Bounding Box Regression. In Proceedings of the IEEE/CVF Conference on Computer Vision and Pattern Recognition, Long Beach, CA, USA, 15–20 June 2019; Volume 4, pp. 658–666. [Google Scholar]
- Hong, C.S.; Oh, T.G. TPR-TNR plot for confusion matrix. Commun. Stat. Appl. Methods 2021, 28, 161–169. [Google Scholar] [CrossRef]


| Data Category | Chinese Character | Letter | Special-Shaped | Punctuation | Blank | Total |
|---|---|---|---|---|---|---|
| Data collection | 300 | 300 | 300 | 50 | 50 | 1000 |
| Data augmentation | 900 | 900 | 900 | 150 | 150 | 3000 |
| Total | 1200 | 1200 | 1200 | 200 | 200 | 4000 |
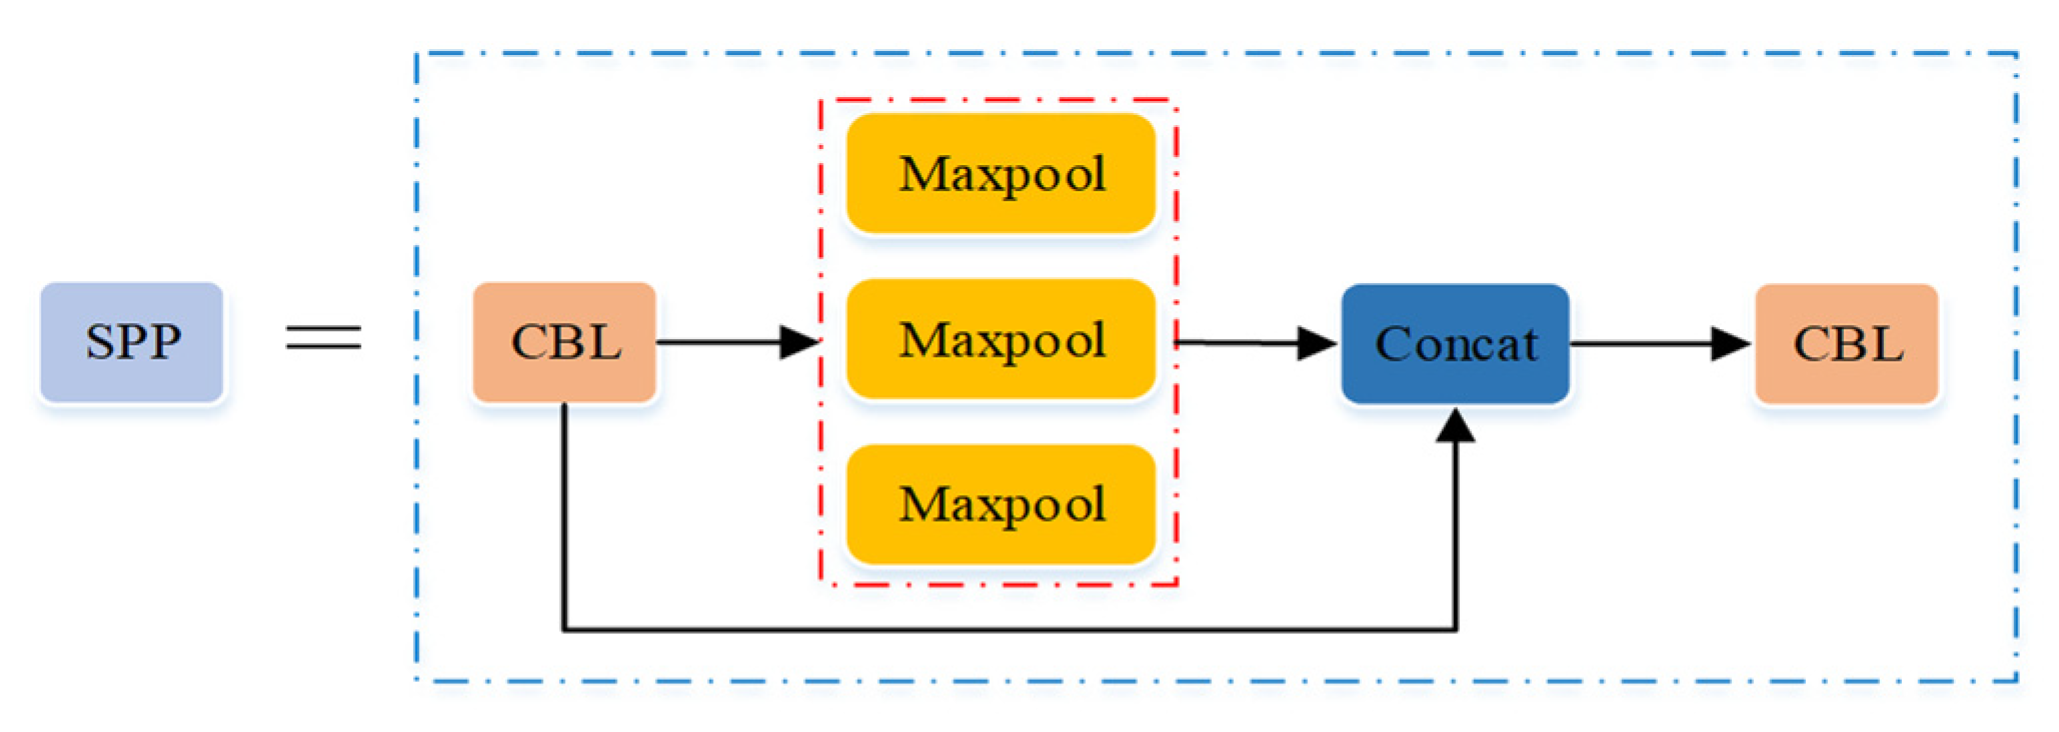
| YOLOv5 | Features |
|---|---|
| Input | Mosaic data augmentation, adaptive anchor, adaptive image scaling |
| Backbone | Focus, CBL, 3×CSP1_X, SPP |
| Neck | CBL, 5×CSP2_X, Upsample, Concat, FPN+PAN |
| Head | GIoU_Loss |
| Model | Backbone: CSP1_X | Neck: CSP2_X | ||||||
|---|---|---|---|---|---|---|---|---|
| First | Second | Third | First | Second | Third | Fourth | Fifth | |
| YOLOv5s | CSP1_1 | CSP1_3 | CSP1_3 | CSP2_1 | CSP2_1 | CSP2_1 | CSP2_1 | CSP2_1 |
| YOLOv5m | CSP1_2 | CSP1_6 | CSP1_6 | CSP2_2 | CSP2_2 | CSP2_2 | CSP2_2 | CSP2_2 |
| YOLOv5l | CSP1_3 | CSP1_9 | CSP1_9 | CSP2_3 | CSP2_3 | CSP2_3 | CSP2_3 | CSP2_3 |
| YOLOv5x | CSP1_4 | CSP1_12 | CSP1_12 | CSP2_4 | CSP2_4 | CSP2_4 | CSP2_4 | CSP2_4 |
| YOLOv5_ours | CSP1_2 | CSP1_6 | CSP1_6 | CSP2_1 | CSP2_1 | CSP2_1 | CSP2_1 | CSP2_1 |
| Model | Number of Convolution Kernels | ||||
|---|---|---|---|---|---|
| Focus | First CBL | Second CBL | Third CBL | Fourth CBL | |
| YOLOv5s | 32 | 64 | 128 | 256 | 512 |
| YOLOv5m | 48 | 96 | 192 | 384 | 768 |
| YOLOv5l | 64 | 128 | 256 | 512 | 1024 |
| YOLOv5x | 80 | 160 | 320 | 640 | 1280 |
| YOLOv5_ours | 40 | 80 | 160 | 320 | 640 |
| Models | Precision (%) | Recall (%) | mAP (%) | F1 (%) | Model Size (MB) | Train Time (h) | Inference Time (ms) |
|---|---|---|---|---|---|---|---|
| YOLOv5s | 98.24 | 98.37 | 98.31 | 98.28 | 14 | 18.532 | 35 |
| YOLOv5m | 98.19 | 98.26 | 98.23 | 98.21 | 43 | 19.118 | 56 |
| YOLOv5l | 98.11 | 98.18 | 98.16 | 98.13 | 95 | 21.834 | 77 |
| YOLOV5_ours | 99.35 | 99.38 | 99.43 | 99.41 | 12.5 | 18.184 | 32 |
Publisher’s Note: MDPI stays neutral with regard to jurisdictional claims in published maps and institutional affiliations. |
© 2021 by the authors. Licensee MDPI, Basel, Switzerland. This article is an open access article distributed under the terms and conditions of the Creative Commons Attribution (CC BY) license (https://creativecommons.org/licenses/by/4.0/).
Share and Cite
Song, Q.; Li, S.; Bai, Q.; Yang, J.; Zhang, X.; Li, Z.; Duan, Z. Object Detection Method for Grasping Robot Based on Improved YOLOv5. Micromachines 2021, 12, 1273. https://doi.org/10.3390/mi12111273
Song Q, Li S, Bai Q, Yang J, Zhang X, Li Z, Duan Z. Object Detection Method for Grasping Robot Based on Improved YOLOv5. Micromachines. 2021; 12(11):1273. https://doi.org/10.3390/mi12111273
Chicago/Turabian StyleSong, Qisong, Shaobo Li, Qiang Bai, Jing Yang, Xingxing Zhang, Zhiang Li, and Zhongjing Duan. 2021. "Object Detection Method for Grasping Robot Based on Improved YOLOv5" Micromachines 12, no. 11: 1273. https://doi.org/10.3390/mi12111273
APA StyleSong, Q., Li, S., Bai, Q., Yang, J., Zhang, X., Li, Z., & Duan, Z. (2021). Object Detection Method for Grasping Robot Based on Improved YOLOv5. Micromachines, 12(11), 1273. https://doi.org/10.3390/mi12111273