Sedentary Behavior Is Independently Related to Fat Mass among Children and Adolescents in South China

Abstract
:1. Introduction
2. Materials and Methods
2.1. Study Sample
2.2. Sedentary Behavior
2.3. Physical Activity
2.4. Anthropometric Measurements
2.5. Energy Intake
2.6. Parental Characteristics and Additional Information
2.7. Statistical Analysis
3. Results
4. Discussion
5. Conclusions
Acknowledgments
Author Contributions
Conflicts of Interest
Appendix A
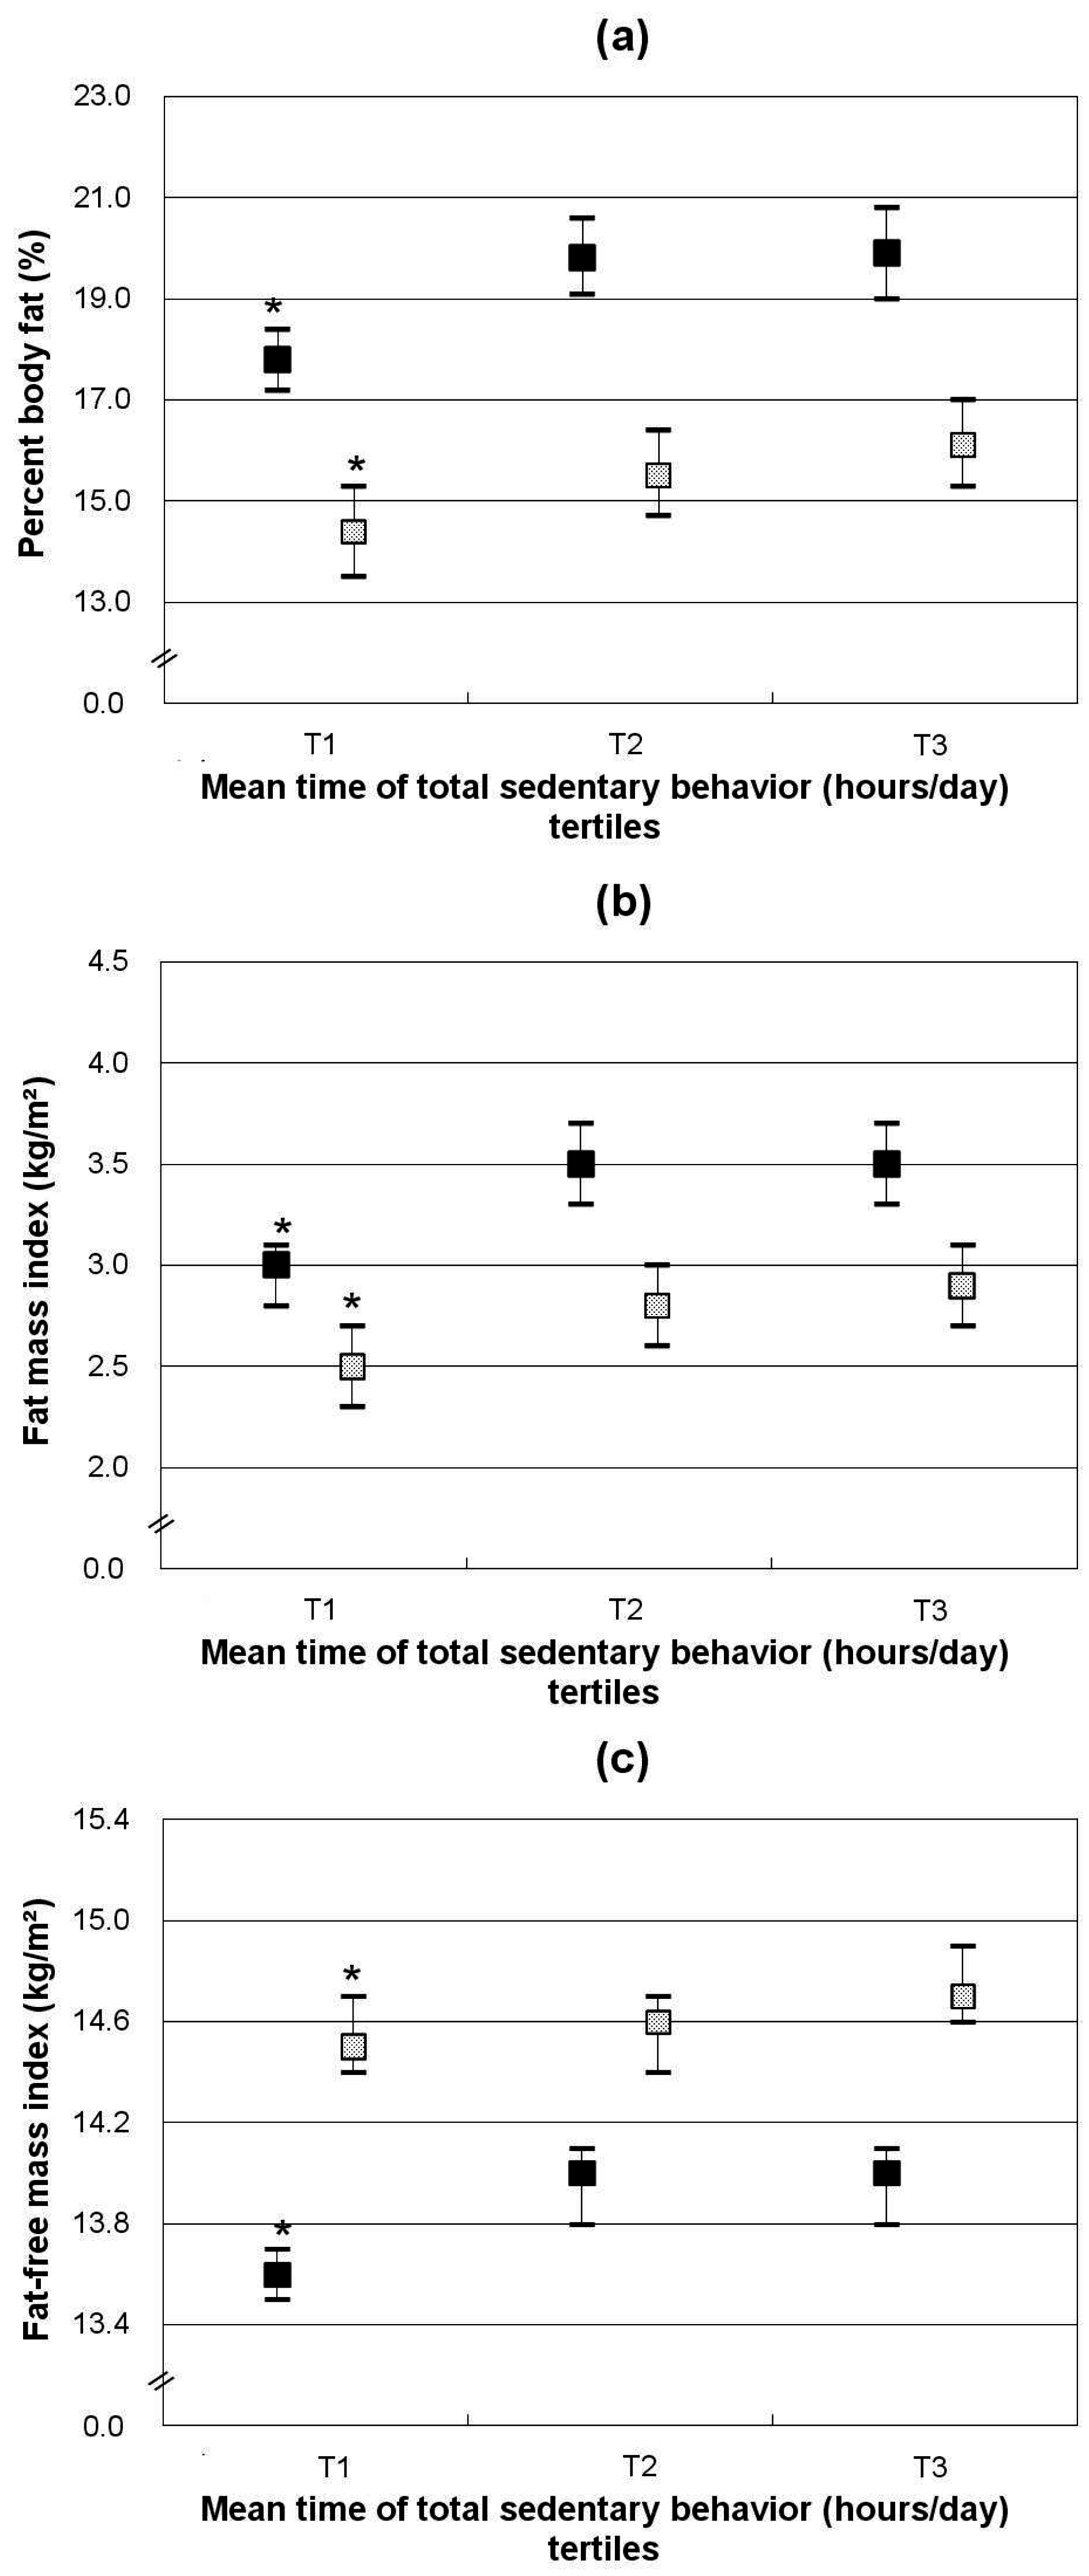
 ). Data shown are least-squares means (95% CI) adjusted for average annual income of family, maternal overweight, total energy intake (MJ/day) and MVPA energy expenditure (MJ/day)); * p for trend < 0.05. p for trend refers to p values obtained by linear regression models with total time spent on sedentary behaviors as continuous variables.
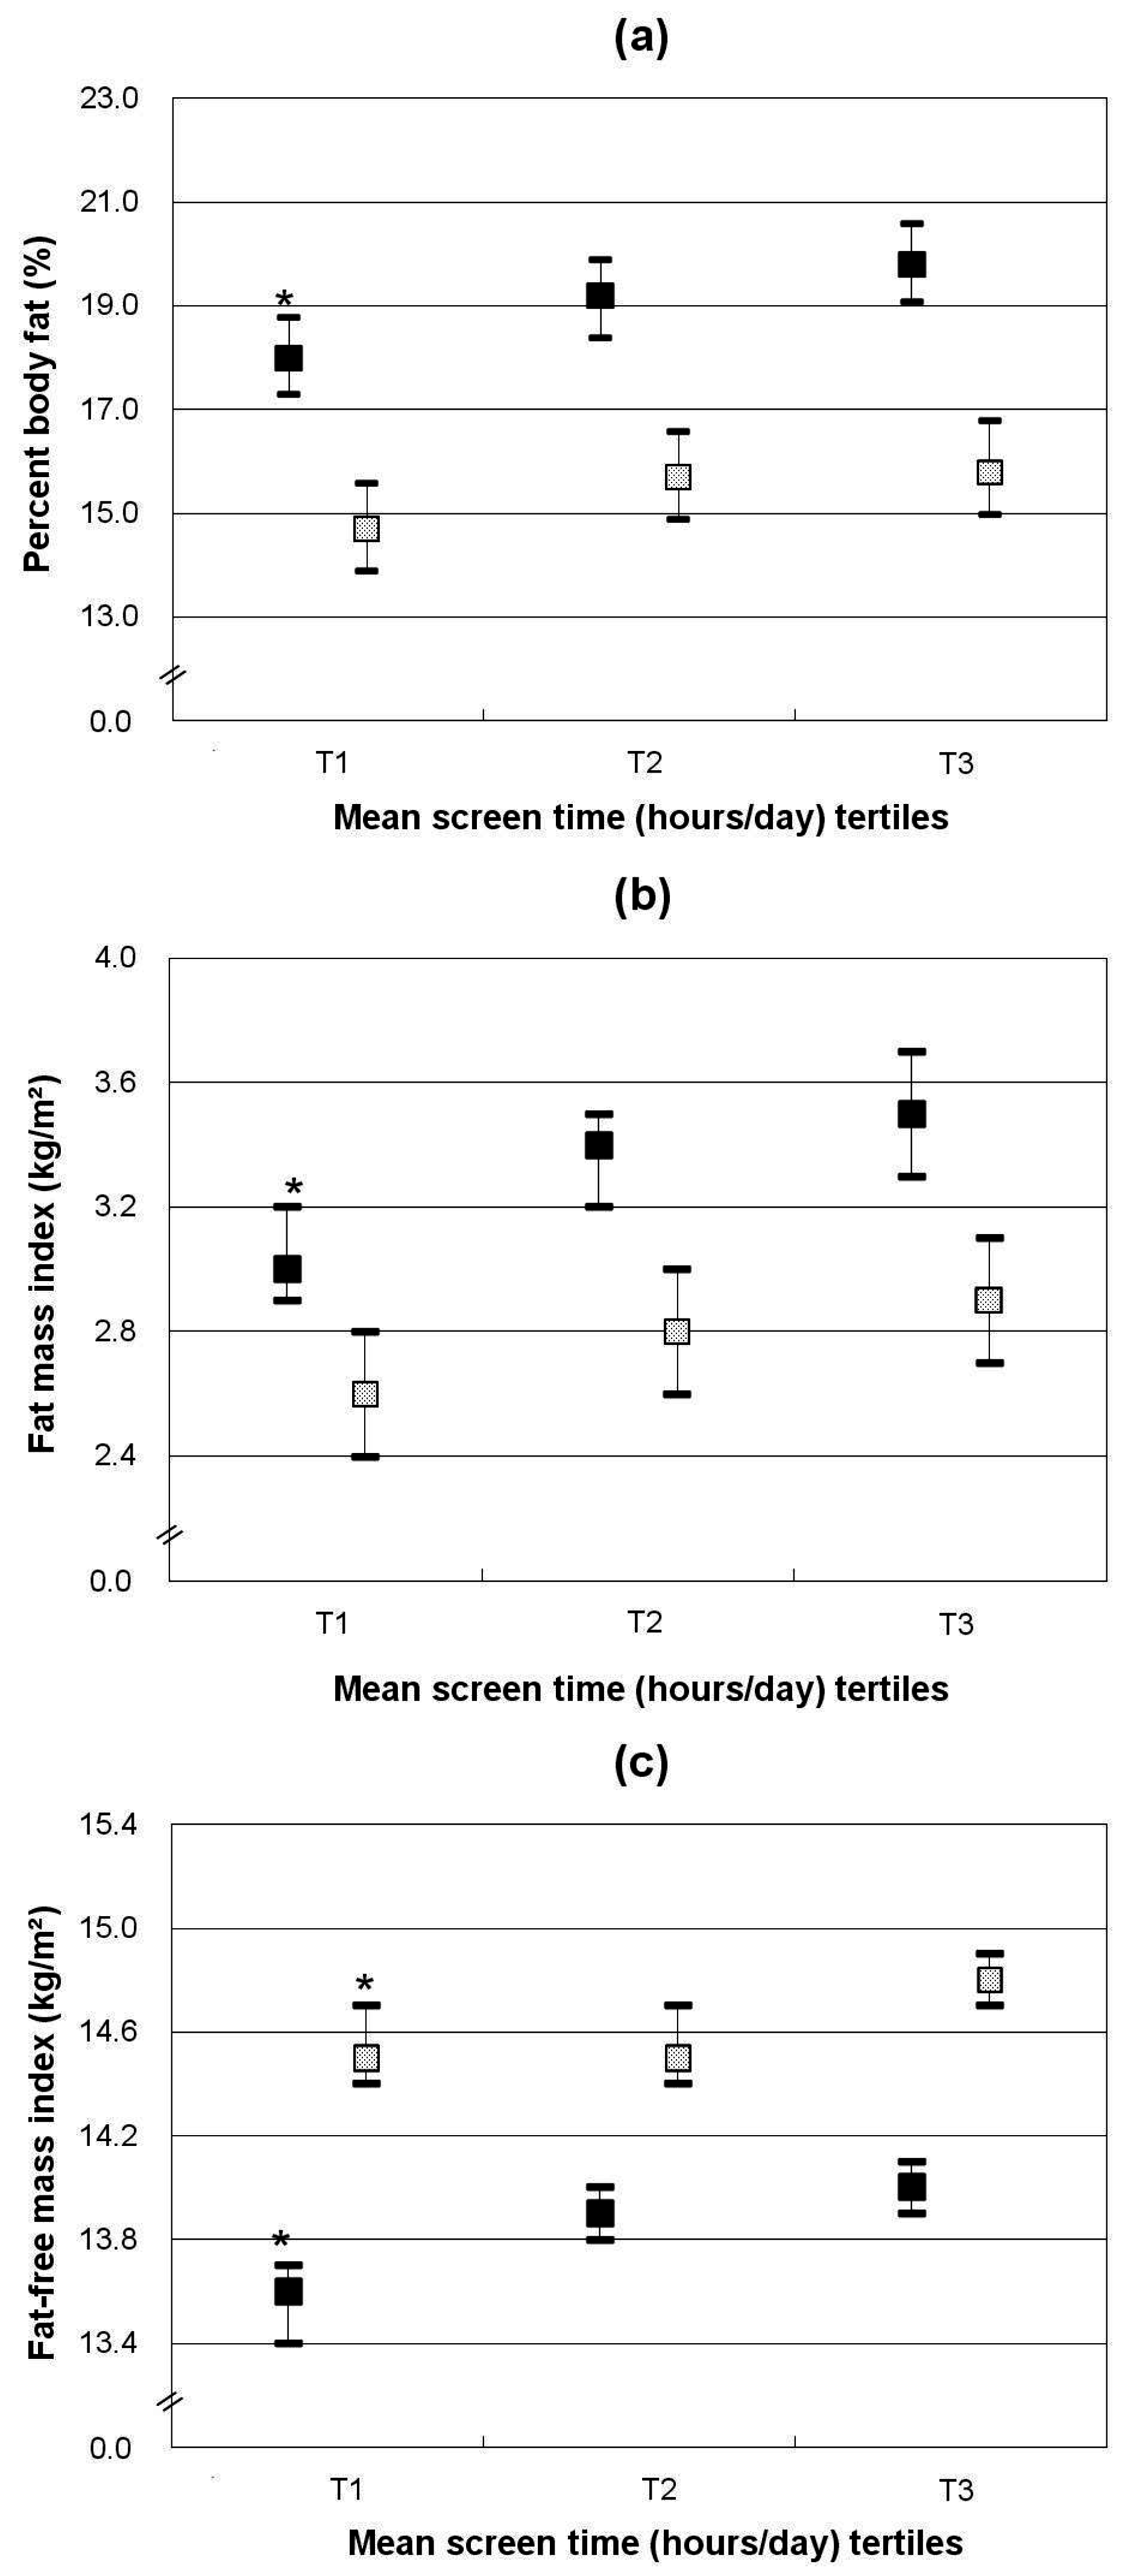
). Data shown are least-squares means (95% CI) adjusted for average annual income of family, maternal overweight, total energy intake (MJ/day) and MVPA energy expenditure (MJ/day)); * p for trend < 0.05. p for trend refers to p values obtained by linear regression models with total time spent on sedentary behaviors as continuous variables.
). Data shown are least-squares means (95% CI) adjusted for average annual income of family, maternal overweight, total energy intake (MJ/day) and MVPA energy expenditure (MJ/day)); * p for trend < 0.05. p for trend refers to p values obtained by linear regression models with total time spent on sedentary behaviors as continuous variables.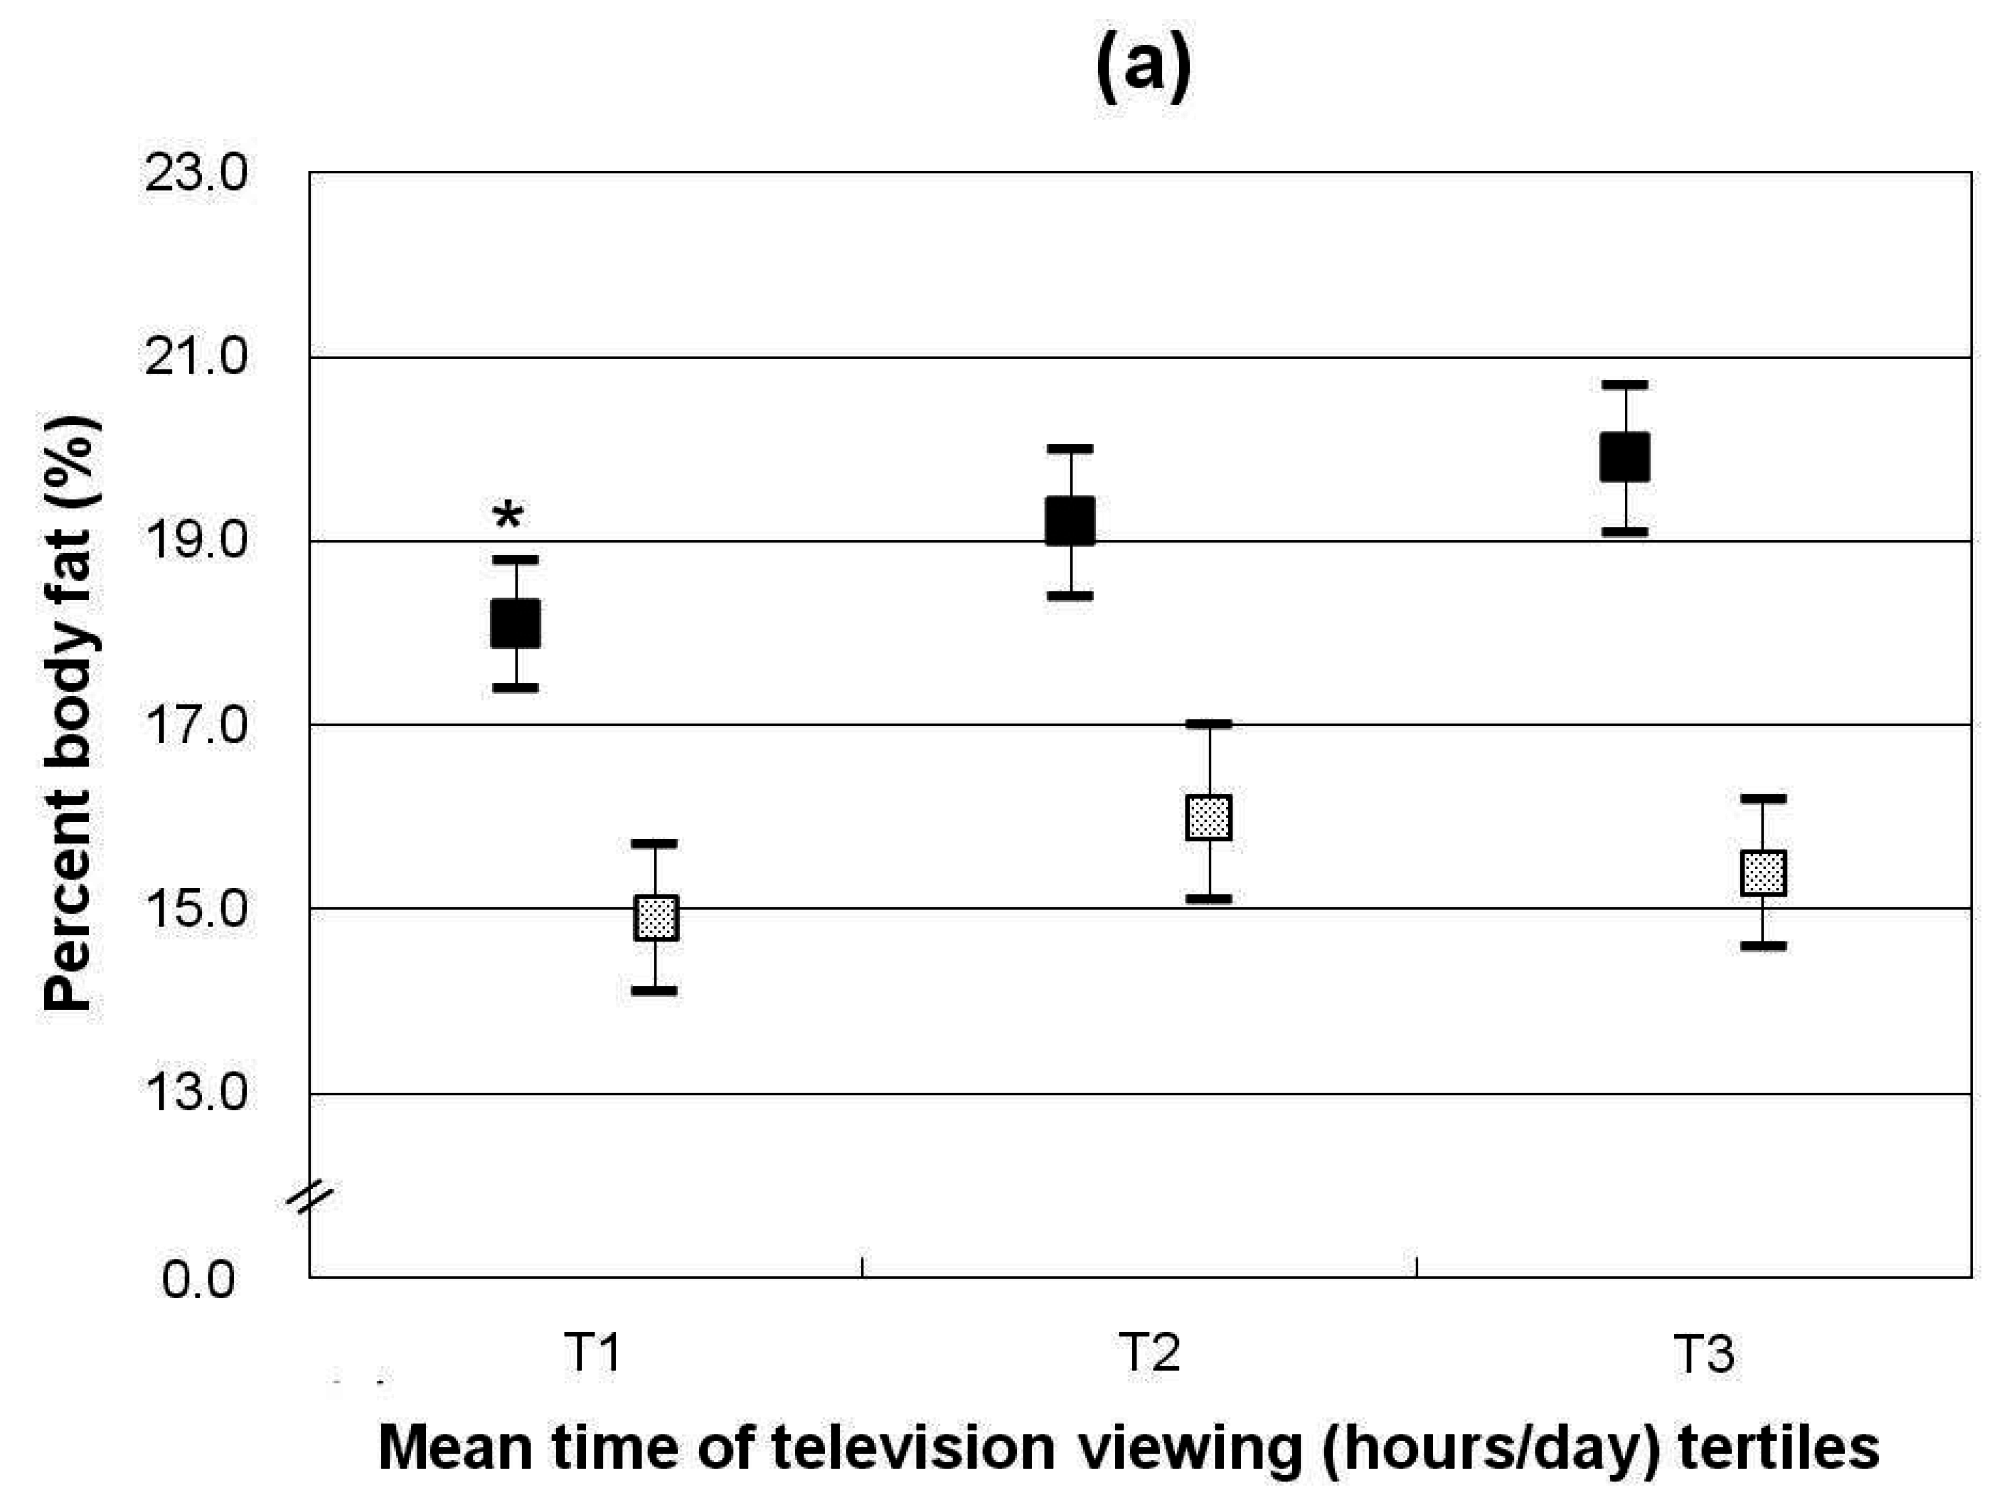
 ); Data shown are least-squares means (95% CI) adjusted for average annual income of family, maternal overweight, total energy intake (MJ/day) and MVPA energy expenditure (MJ/day)); * p for trend < 0.05. p for trend refers to p values obtained by linear regression models with total time spent on sedentary behaviors as continuous variables.
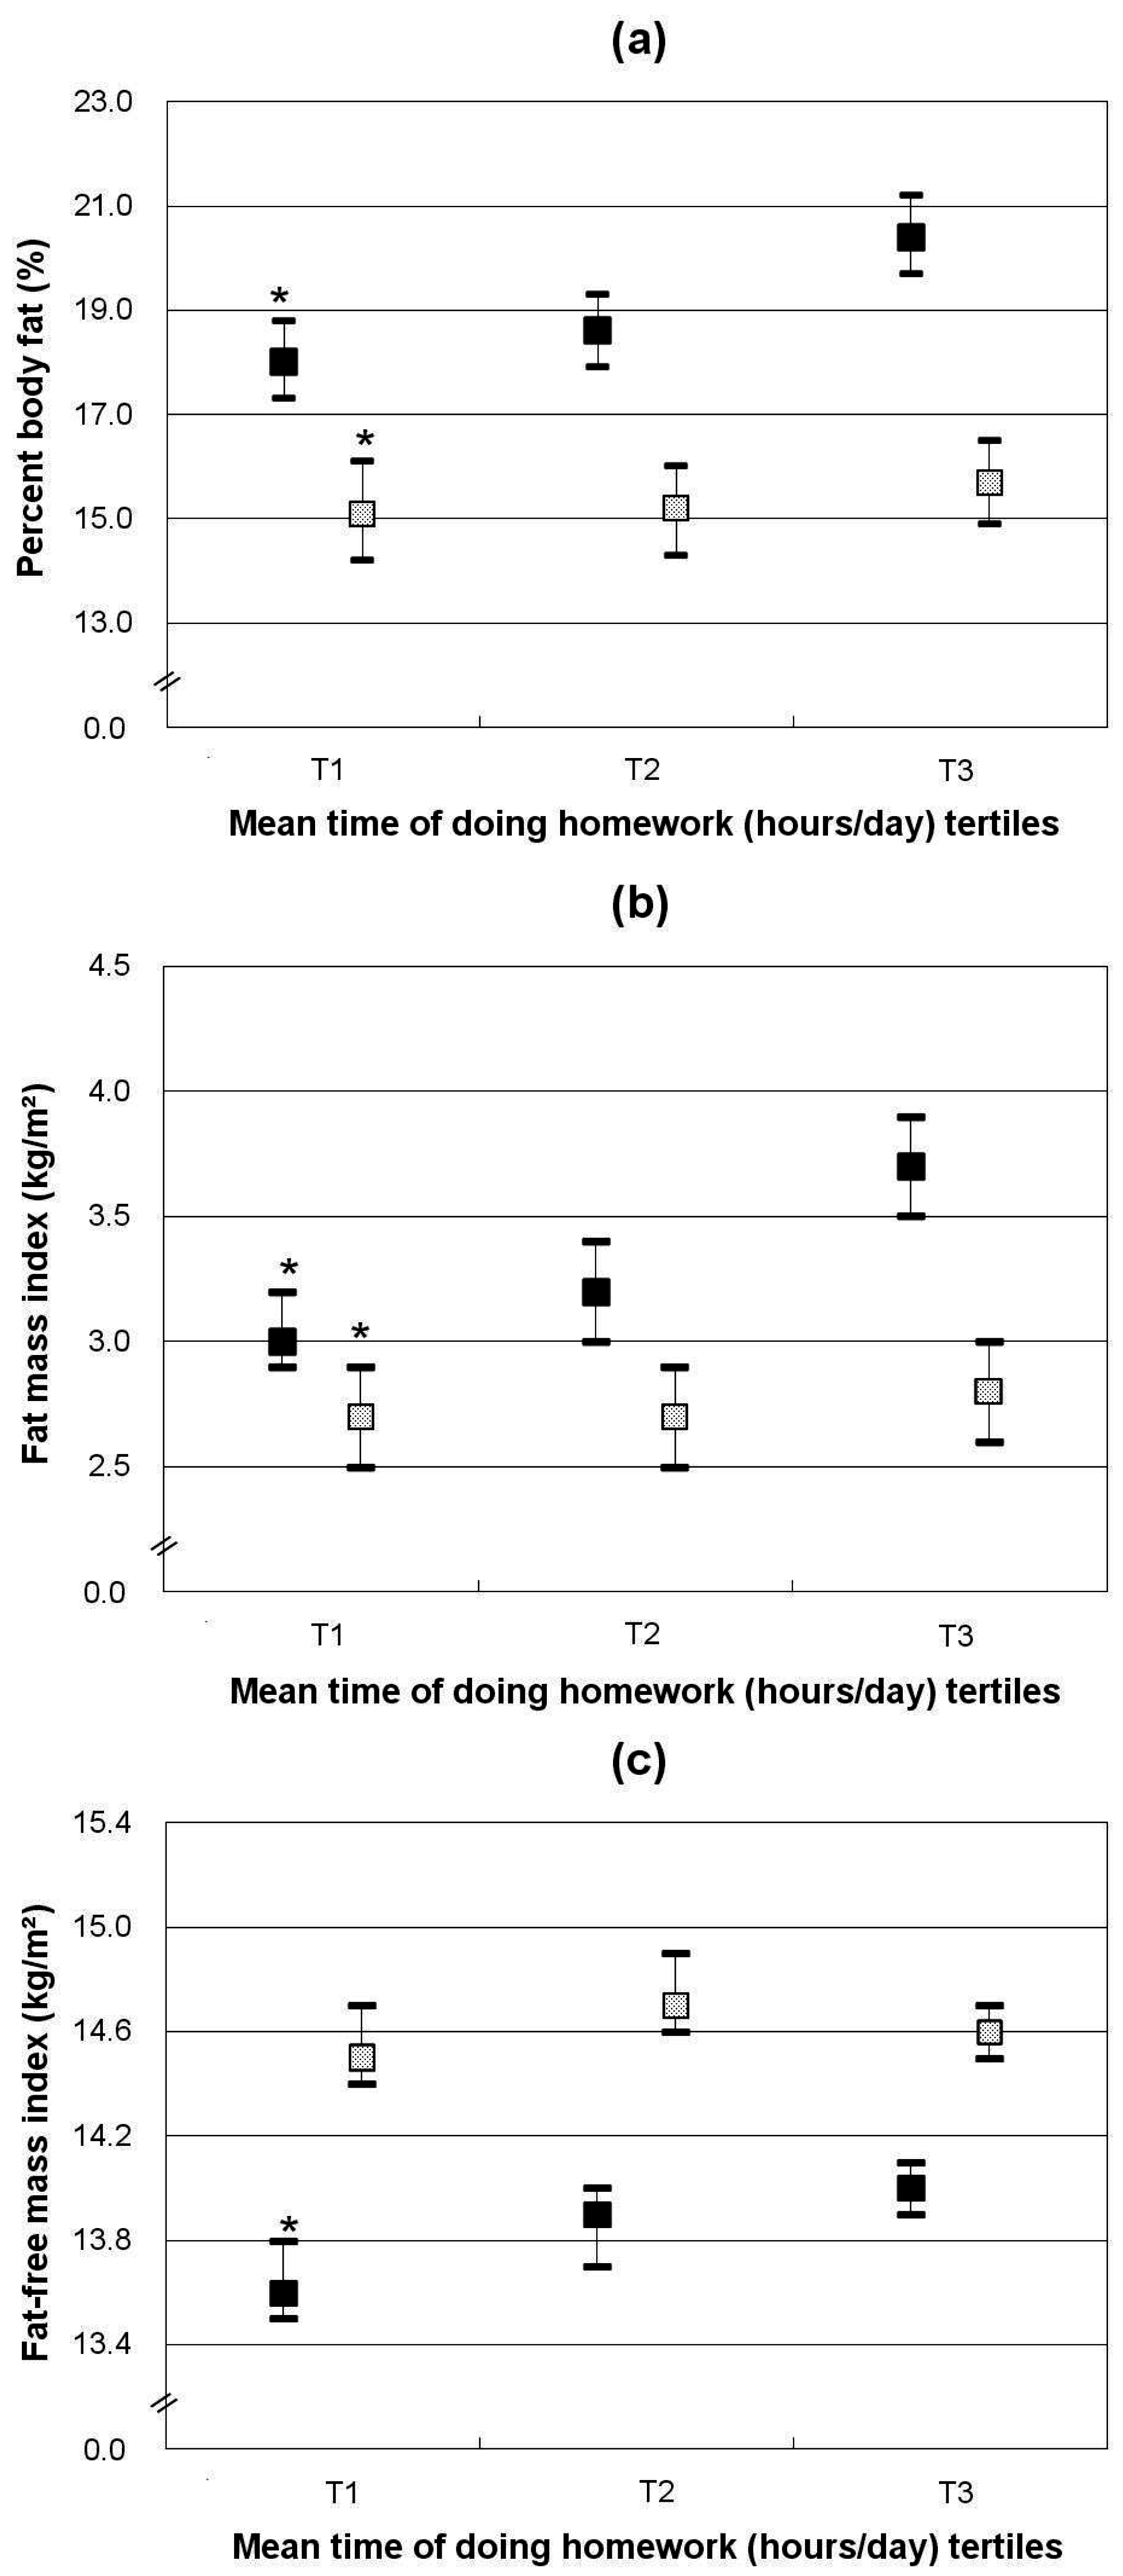
); Data shown are least-squares means (95% CI) adjusted for average annual income of family, maternal overweight, total energy intake (MJ/day) and MVPA energy expenditure (MJ/day)); * p for trend < 0.05. p for trend refers to p values obtained by linear regression models with total time spent on sedentary behaviors as continuous variables.
); Data shown are least-squares means (95% CI) adjusted for average annual income of family, maternal overweight, total energy intake (MJ/day) and MVPA energy expenditure (MJ/day)); * p for trend < 0.05. p for trend refers to p values obtained by linear regression models with total time spent on sedentary behaviors as continuous variables.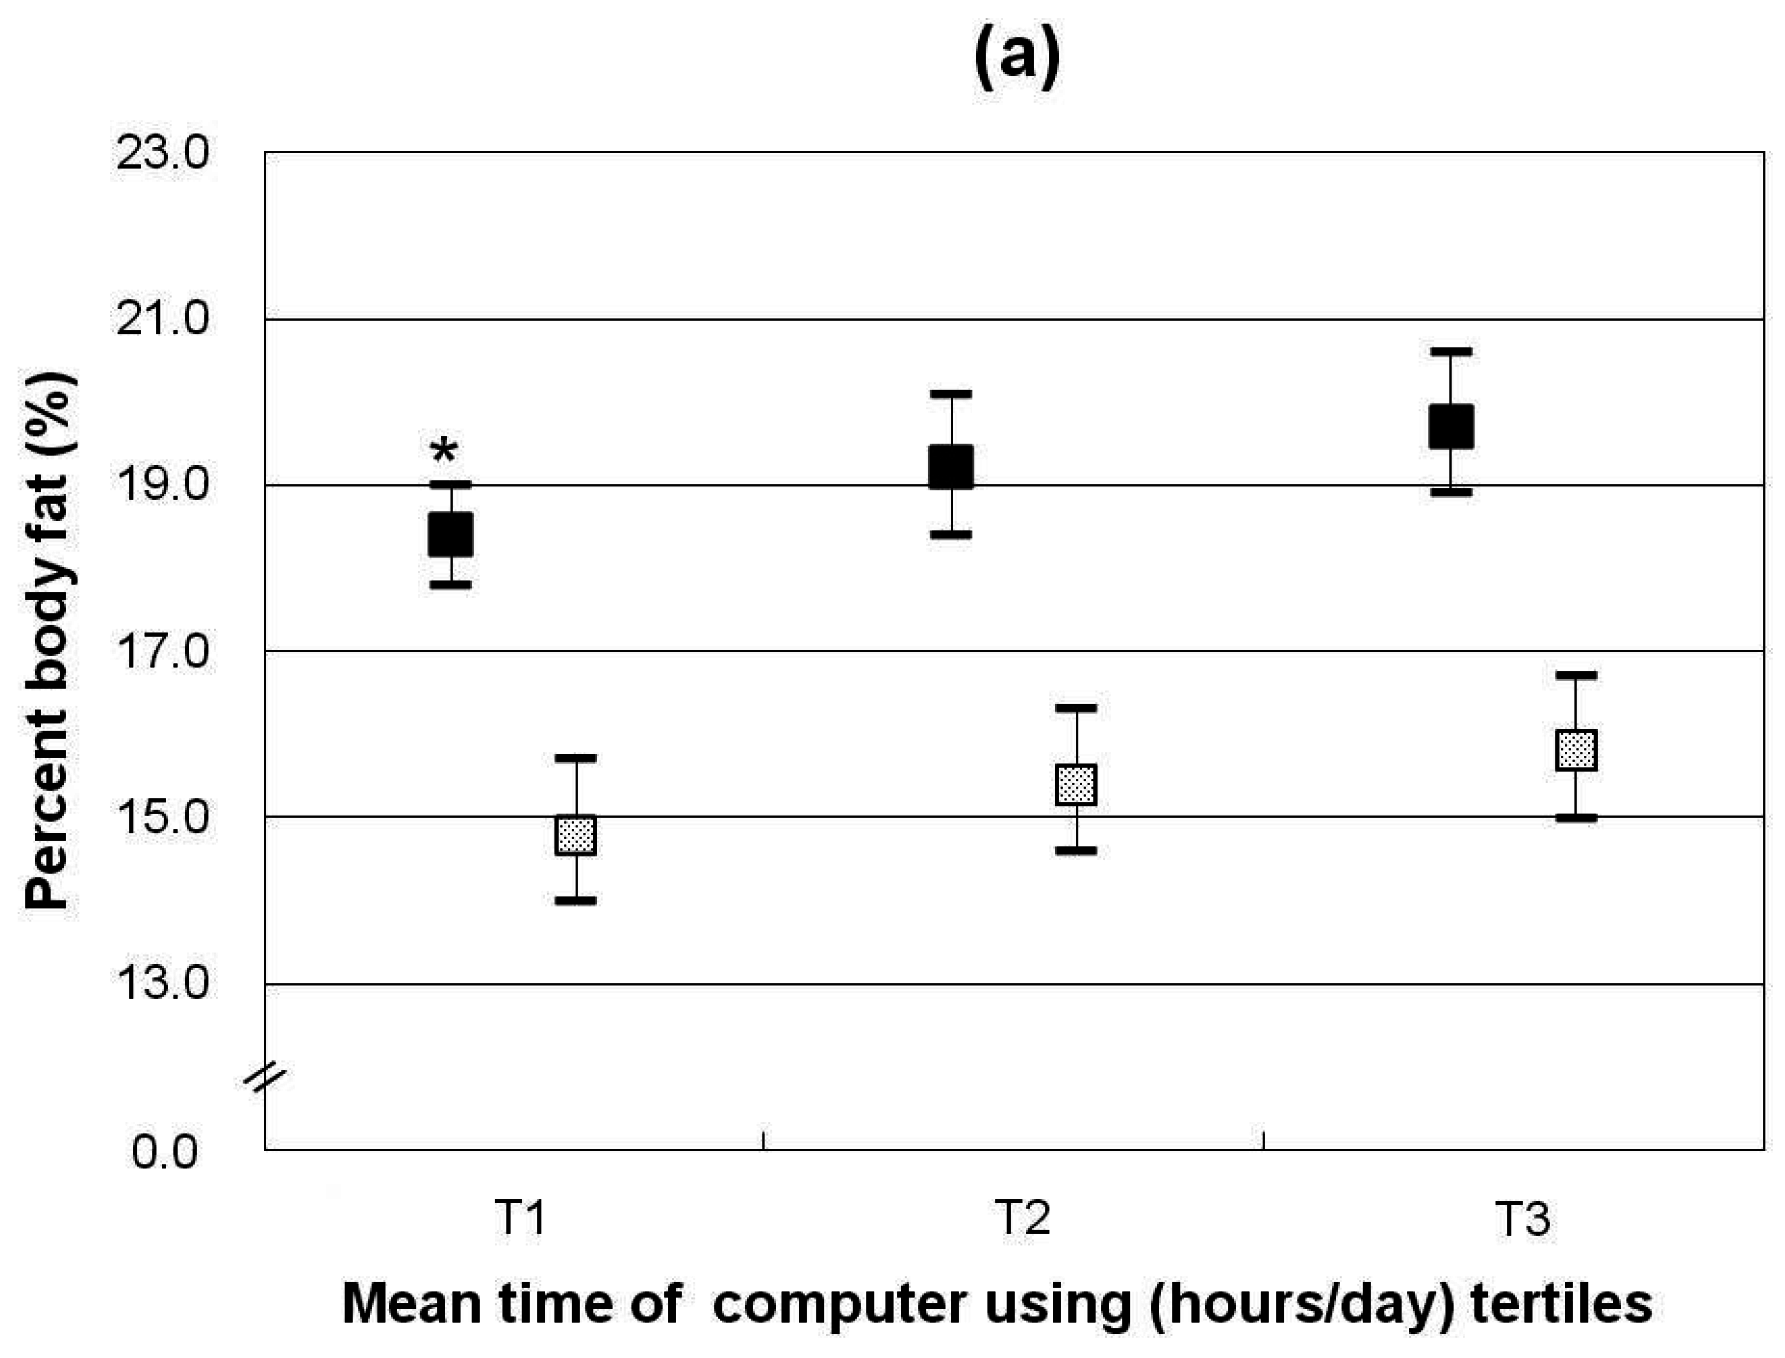


| Percentage Body Fat (%) | Fat Mass Index (kg/m2) | Fat-Free Mass Index (kg/m2) | ||||
|---|---|---|---|---|---|---|
| Estimate (SE) | p | Estimate (SE) | p | Estimate (SE) | p | |
| Girls (n = 797) | ||||||
| Unadjusted model | −0.0001 (0.0004) | 0.7 | −0.00006 (0.0005) | 0.9 | 0.00005 (0.00009) | 0.6 |
| Model A 2 | −0.0002 (0.0004) | 0.7 | −0.0001 (0.0005) | 0.8 | 0.00006 (0.00009) | 0.5 |
| Model B 3 | −0.0002 (0.0004) | 0.6 | −0.0001 (0.0005) | 0.9 | 0.00005 (0.00009) | 0.5 |
| Model C 4 | −0.0002 (0.0004) | 0.5 | −0.0002 (0.0005) | 0.7 | 0.00004 (0.00009) | 0.6 |
| Model D 5 | −0.0002 (0.0004) | 0.5 | −0.0002 (0.0005) | 0.7 | 0.00004 (0.00009) | 0.6 |
| Boys (n = 789) | ||||||
| Unadjusted model | −0.00003 (0.0003) | 0.9 | −0.00005 (0.0004) | 0.9 | −0.00003 (0.00005) | 0.6 |
| Model A 2 | −0.00003 (0.0003) | 0.9 | −0.00005 (0.0004) | 0.9 | −0.00002 (0.00005) | 0.7 |
| Model B 3 | −0.00005 (0.0003) | 0.9 | −0.00008 (0.0004) | 0.9 | −0.00003 (0.00005) | 0.6 |
| Model C 4 | −0.000008 (0.0003) | 1.0 | −0.00002 (0.0004) | 1.0 | −0.00002 (0.00005) | 0.7 |
| Model D 5 | −0.00003 (0.0003) | 0.9 | −0.00004 (0.0004) | 0.9 | −0.00002 (0.00005) | 0.7 |
References
- Ji, C.Y.; Chen, T.J.; Working Group on Obesity in China. Empirical changes in the prevalence of overweight and obesity among Chinese students from 1985 to 2010 and corresponding preventive strategies. Biomed. Environ. Sci. BES 2013, 26, 1–12. [Google Scholar] [PubMed]
- Dehghan, M.; Akhtar-Danesh, N.; Merchant, A.T. Childhood obesity, prevalence and prevention. Nutr. J. 2005, 4, 24. [Google Scholar] [CrossRef] [PubMed]
- Jackson, D.M.; Djafarian, K.; Stewart, J.; Speakman, J.R. Increased television viewing is associated with elevated body fatness but not with lower total energy expenditure in children. Am. J. Clin. Nutr. 2009, 89, 1031–1036. [Google Scholar] [CrossRef] [PubMed]
- Davison, K.K.; Marshall, S.J.; Birch, L.L. Cross-sectional and longitudinal associations between TV viewing and girls’ body mass index, overweight status, and percentage of body fat. J. Pediatr. 2006, 149, 32–37. [Google Scholar] [CrossRef] [PubMed]
- Basterfield, L.; Pearce, M.S.; Adamson, A.J.; Frary, J.K.; Parkinson, K.N.; Wright, C.M.; Reilly, J.J.; Gateshead Millennium Study Core Team. Physical activity, sedentary behavior, and adiposity in English children. Am. J. Prev. Med. 2012, 42, 445–451. [Google Scholar] [CrossRef] [PubMed]
- Steele, R.M.; van Sluijs, E.M.; Cassidy, A.; Griffin, S.J.; Ekelund, U. Targeting sedentary time or moderate- and vigorous-intensity activity: Independent relations with adiposity in a population-based sample of 10-year-old british children. Am. J. Clin. Nutr. 2009, 90, 1185–1192. [Google Scholar] [CrossRef] [PubMed]
- Ekelund, U.; Brage, S.; Froberg, K.; Harro, M.; Anderssen, S.A.; Sardinha, L.B.; Riddoch, C.; Andersen, L.B. TV viewing and physical activity are independently associated with metabolic risk in children: The european youth heart study. PLoS Med. 2006, 3, e488. [Google Scholar] [CrossRef] [PubMed]
- Hjorth, M.F.; Chaput, J.P.; Ritz, C.; Dalskov, S.M.; Andersen, R.; Astrup, A.; Tetens, I.; Michaelsen, K.F.; Sjodin, A. Fatness predicts decreased physical activity and increased sedentary time, but not vice versa: Support from a longitudinal study in 8- to 11-year-old children. Int. J. Obes. (Lond.) 2013, 38, 959–965. [Google Scholar] [CrossRef] [PubMed]
- Council on Communications and Media. Children, adolescents, obesity, and the media. Pediatrics 2011, 128, 201–208. [Google Scholar]
- Public Health Agency of Canada. Canada’s Physical Activity Guide for Children. Available online: http://www.phac-aspc.gc.ca/hp-ps/hl-mvs/pag-gap/cy-ej/index-eng.php (accessed on 24 April 2013).
- Australian Government. Australia’s Physical Activity Recommendations for 5–12 Years Old (brochure); Australian Government Department of Health and Ageing: Canberra, Australia, 2005.
- Australian Government. Australia’s Physical Activity Recommendations for 12–18 Years Old (brochure); Australian Government Department of Health and Ageing: Canberra, Australia, 2005.
- Cui, Z.; Hardy, L.L.; Dibley, M.J.; Bauman, A. Temporal trends and recent correlates in sedentary behaviours in Chinese children. Int. J. Behav. Nutr. Phys. Act. 2011, 8, 93. [Google Scholar] [CrossRef] [PubMed]
- Kelsey, M.M.; Zaepfel, A.; Bjornstad, P.; Nadeau, K.J. Age-related consequences of childhood obesity. Gerontology 2014, 60, 222–228. [Google Scholar] [CrossRef] [PubMed]
- Edwardson, C.L.; Gorely, T.; Davies, M.J.; Gray, L.J.; Khunti, K.; Wilmot, E.G.; Yates, T.; Biddle, S.J. Association of sedentary behaviour with metabolic syndrome: A meta-analysis. PLoS ONE 2012, 7, e34916. [Google Scholar] [CrossRef] [PubMed]
- Tremblay, M.S.; LeBlanc, A.G.; Kho, M.E.; Saunders, T.J.; Larouche, R.; Colley, R.C.; Goldfield, G.; Connor Gorber, S. Systematic review of sedentary behaviour and health indicators in school-aged children and youth. Int. J. Behav. Nutr. Phys. Act. 2011, 8, 98. [Google Scholar] [CrossRef] [PubMed]
- Statistical Bureau of Sichuan; NBS Survey Office in Sichuan. Sichuan Statistical Yearbook; China Statistical Press: Beijing, China, 2012.
- Cheng, G.; Duan, R.; Kranz, S.; Libuda, L.; Zhang, L. Development of a dietary index to assess overall diet quality for Chinese school-aged children: The Chinese children dietary index (CCDI). J. Acad. Nutr. Diet. 2016, 116, 608–617. [Google Scholar] [CrossRef] [PubMed]
- Schofield, W.N. Predicting basal metabolic rate, new standards and review of previous work. Hum. Nutr. Clin. Nutr. 1985, 39, 5–41. [Google Scholar] [PubMed]
- Huang, Y.J.; Wong, S.H.; Salmon, J. Reliability and validity of the modified chinese version of the children’s leisure activities study survey (class) questionnaire in assessing physical activity among Hongkong children. Pediatr. Exerc. Sci. 2009, 21, 339–353. [Google Scholar] [CrossRef] [PubMed]
- Matthews, C.E.; Shu, X.O.; Yang, G.; Jin, F.; Ainsworth, B.E.; Liu, D.; Gao, Y.T.; Zheng, W. Reproducibility and validity of the shanghai women’s health study physical activity questionnaire. Am. J. Epidemiol. 2003, 158, 1114–1122. [Google Scholar] [CrossRef] [PubMed]
- Ainsworth, B.E.; Haskell, W.L.; Leon, A.S.; Jacobs, D.R., Jr.; Montoye, H.J.; Sallis, J.F.; Paffenbarger, R.S., Jr. Compendium of physical activities: Classification of energy costs of human physical activities. Med. Sci. Sports Exerc. 1993, 25, 71–80. [Google Scholar] [CrossRef] [PubMed]
- Ridley, K.; Ainsworth, B.E.; Olds, T.S. Development of a compendium of energy expenditures for youth. Int. J. Behav. Nutr. Phys. Act. 2008, 5, 45. [Google Scholar] [CrossRef] [PubMed]
- Department of Health and Human Services: 2008 Physical Activity Guidelines for Americans. Available online: http://www.health.gov/paguidelines/pdf/paguide.pdf (accessed on 17 September 2014).
- Chinese Students Constitution and Health Research Group. Reports on the Physical Fitness and Health Research of Chinese School Students; Higher Education Press: Beijing, China, 2010. [Google Scholar]
- Slaughter, M.H.; Lohman, T.G.; Boileau, R.A.; Horswill, C.A.; Stillman, R.J.; Van Loan, M.D.; Bemben, D.A. Skinfold equations for estimation of body fatness in children and youth. Hum. Biol. 1988, 60, 709–723. [Google Scholar] [PubMed]
- VanItallie, T.B.; Yang, M.U.; Heymsfield, S.B.; Funk, R.C.; Boileau, R.A. Height-normalized indices of the body’s fat-free mass and fat mass: Potentially useful indicators of nutritional status. Am. J. Clin. Nutr. 1990, 52, 953–959. [Google Scholar] [PubMed]
- Ji, C.Y.; Working Group on Obesity in China. Report on childhood obesity in China (1)—Body mass index reference for screening overweight and obesity in Chinese school-age children. Biomed. Environ. Sci. BES 2005, 18, 390–400. [Google Scholar] [PubMed]
- Li, H.; Ji, C.Y.; Zong, X.N.; Zhang, Y.Q. Body mass index growth curves for Chinese children and adolescents aged 0 to 18 years. Zhonghua Er Ke Za Zhi Chin. J. Pediatr. 2009, 47, 493–498. [Google Scholar]
- Burrows, T.L.; Martin, R.J.; Collins, C.E. A systematic review of the validity of dietary assessment methods in children when compared with the method of doubly labeled water. J. Am. Diet. Assoc. 2010, 110, 1501–1510. [Google Scholar] [CrossRef] [PubMed]
- Yang, Y.X.; Wang, G.Y.; Pan, X.-C. China Food Composition, 2nd ed.; Peking University Medical Press: Beijing, China, 2004. [Google Scholar]
- Tanner, J.M. Normal growth and techniques of growth assessment. Clin. Endocrinol. Metab. 1986, 15, 411–451. [Google Scholar] [CrossRef]
- Chen, C.; Lu, F.C. The guidelines for prevention and control of overweight and obesity in Chinese adults. Biomed. Environ. Sci. BES 2004, 17, 1–36. [Google Scholar] [PubMed]
- Gorely, T.; Biddle, S.J.; Marshall, S.J.; Cameron, N. The prevalence of leisure time sedentary behaviour and physical activity in adolescent boys: An ecological momentary assessment approach. Int. J. Pediatr. Obes. 2009, 4, 289–298. [Google Scholar] [CrossRef] [PubMed]
- Kann, L.; Kinchen, S.; Shanklin, S.L.; Flint, K.H.; Kawkins, J.; Harris, W.A.; Lowry, R.; Olsen, E.O.; McManus, T.; Chyen, D.; et al. Youth risk behavior surveillance—United States, 2013. MMWR. Surveill. Summ. 2014, 63, 1–168. [Google Scholar]
- Scully, M.; Dixon, H.; White, V.; Beckmann, K. Dietary, physical activity and sedentary behaviour among Australian secondary students in 2005. Health Promot. Int. 2007, 22, 236–245. [Google Scholar] [CrossRef] [PubMed]
- Leatherdale, S.T.; Wong, S.L. Modifiable characteristics associated with sedentary behaviours among youth. Int. J. Pediatr. Obes. 2008, 3, 93–101. [Google Scholar] [CrossRef] [PubMed]
- Cliff, D.P.; Okely, A.D.; Burrows, T.L.; Jones, R.A.; Morgan, P.J.; Collins, C.E.; Baur, L.A. Objectively measured sedentary behavior, physical activity, and plasma lipids in overweight and obese children. Obesity 2013, 21, 382–385. [Google Scholar] [CrossRef] [PubMed]
- Brunner, E.J.; Chandola, T.; Marmot, M.G. Prospective effect of job strain on general and central obesity in the Whitehall ii study. Am. J. Epidemiol. 2007, 165, 828–837. [Google Scholar] [CrossRef] [PubMed]
- Pretorius, K.; Van Niekerk, A. Childhood psychosocial development and fatal injuries in Gauteng, South Africa. Child Care Health Dev. 2015, 41, 35–44. [Google Scholar] [CrossRef] [PubMed]
- Eisenmann, J.C.; Heelan, K.A.; Welk, G.J. Assessing body composition among 3- to 8-year-old children: Anthropometry, bia, and dxa. Obes. Res. 2004, 12, 1633–1640. [Google Scholar] [CrossRef] [PubMed]
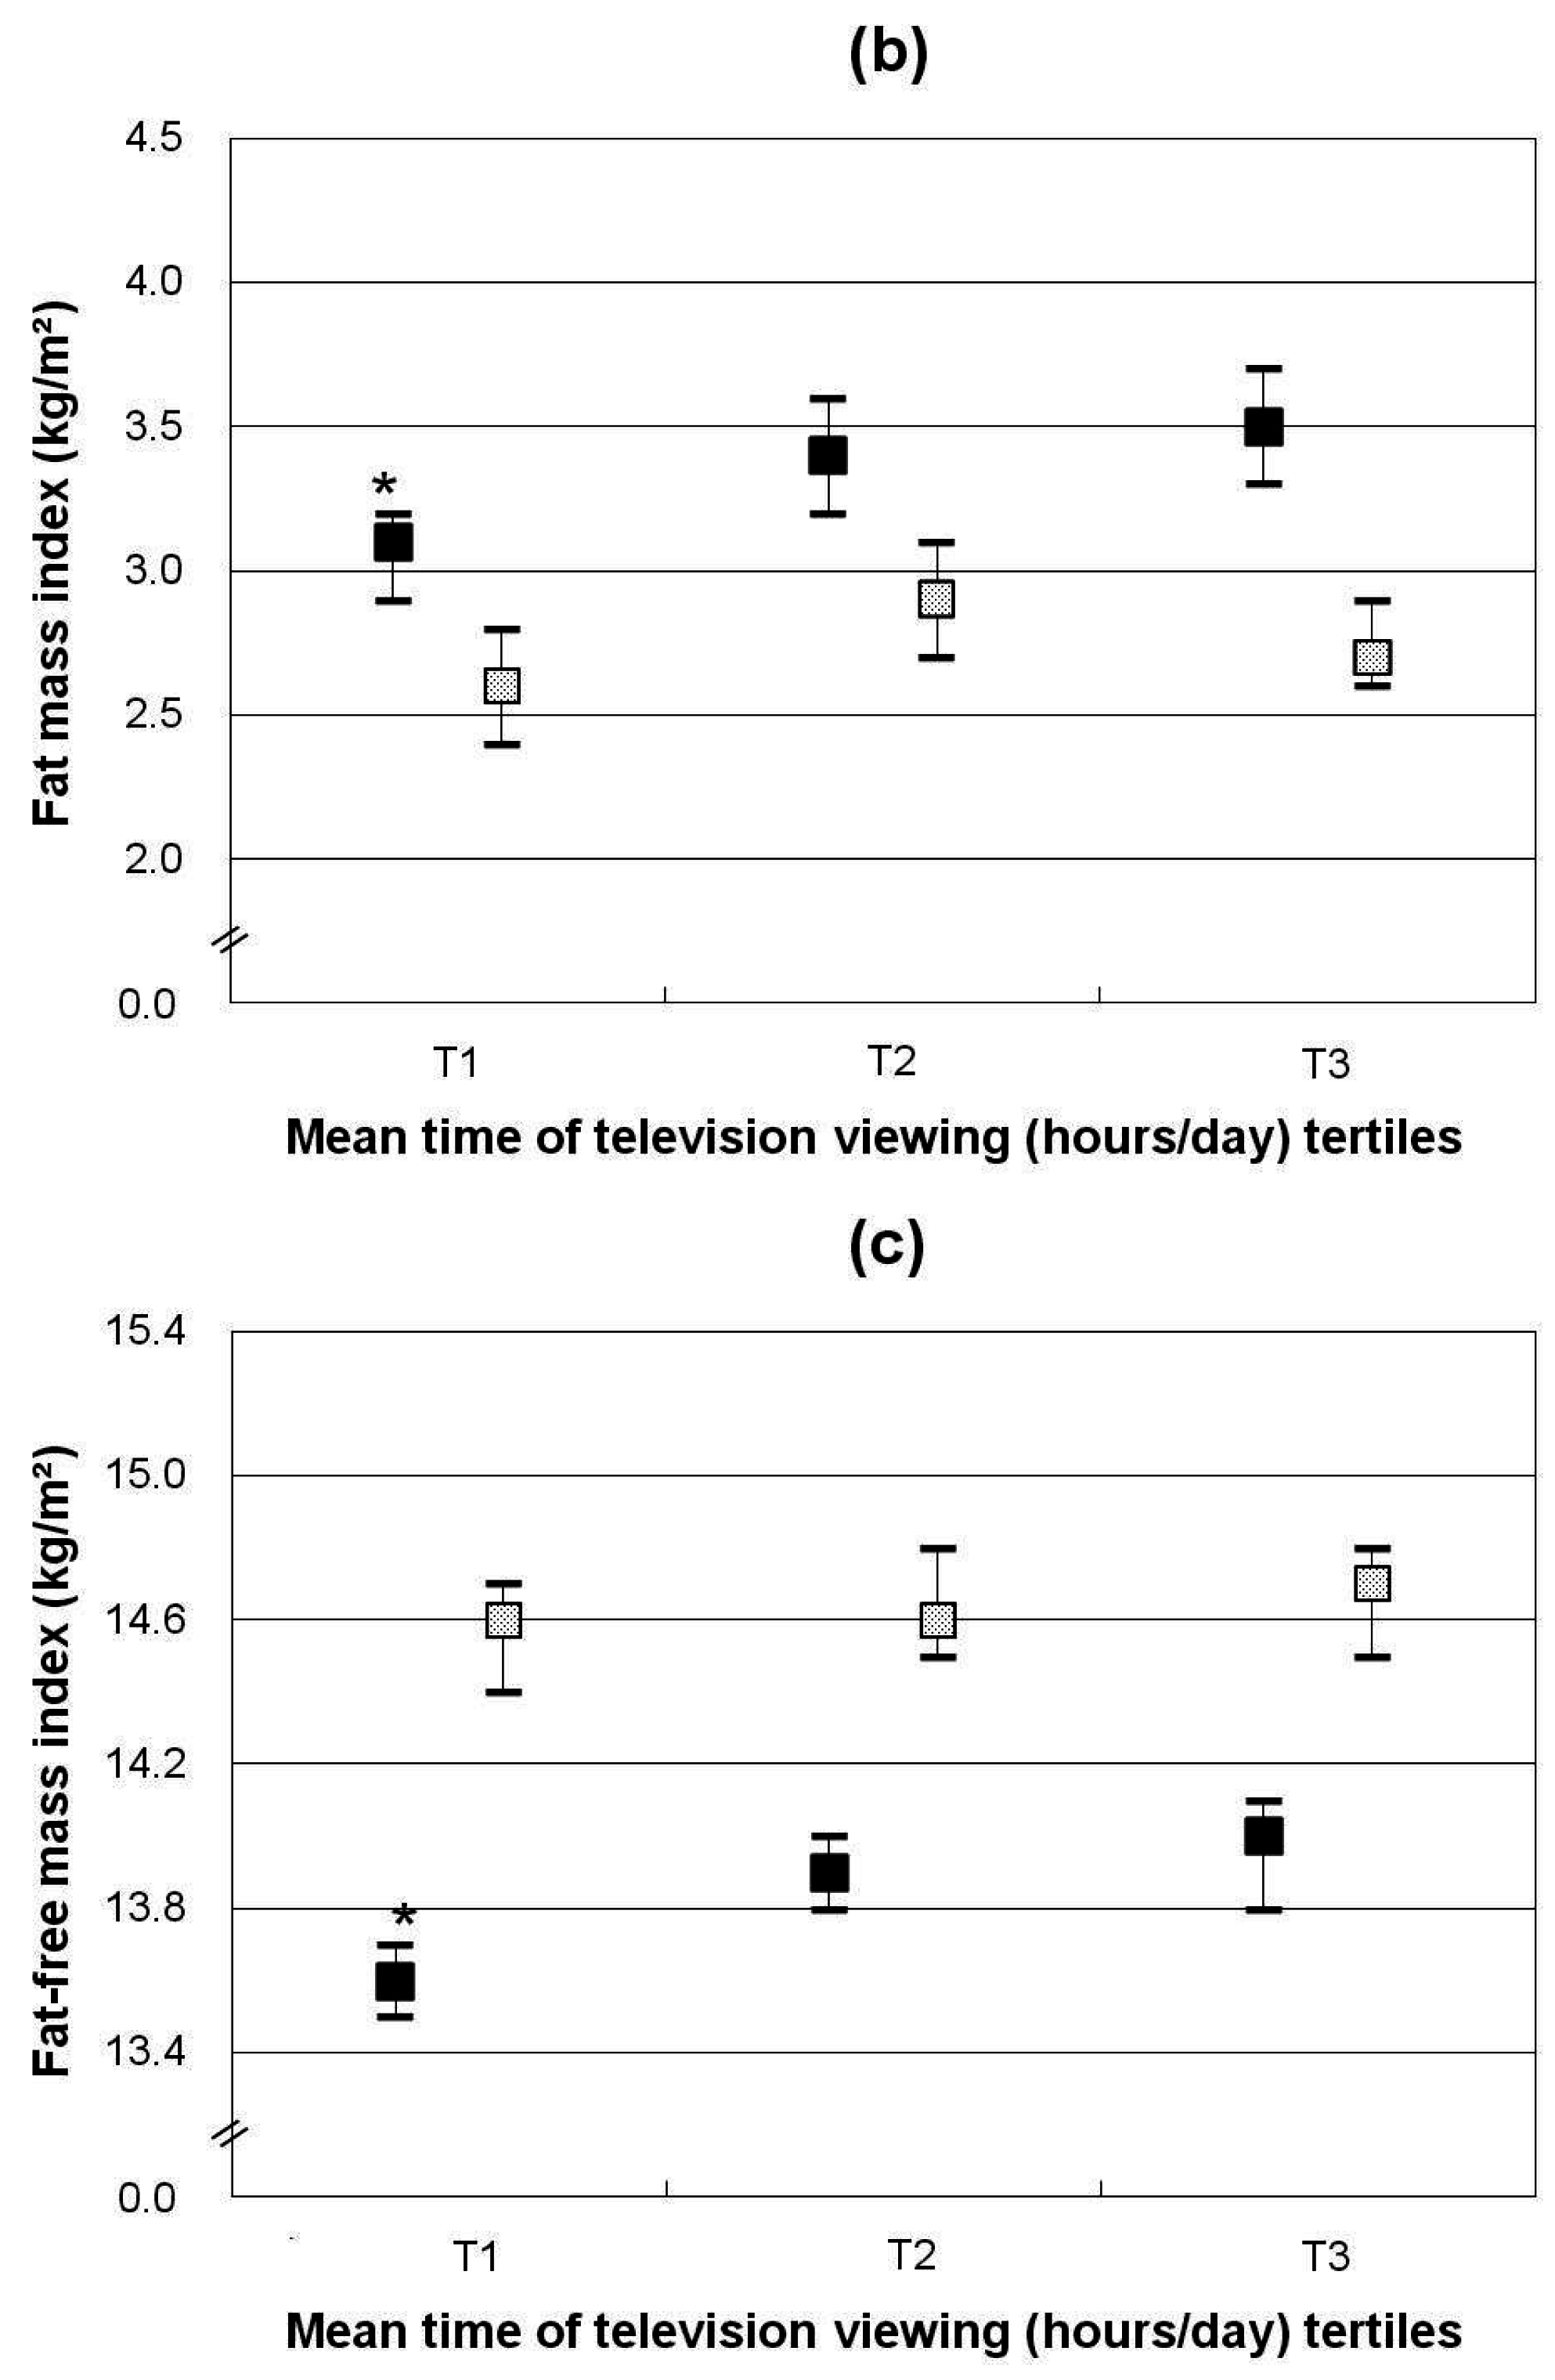
). Data shown are least-squares means (95% CI) adjusted for average annual income of family, maternal overweight, total energy intake (MJ/day) and MVPA energy expenditure (MJ/day)). * p for trend <0.05. p for trend refers to p values obtained by linear regression models with total time spent on sedentary behaviors as continuous variables.
). Data shown are least-squares means (95% CI) adjusted for average annual income of family, maternal overweight, total energy intake (MJ/day) and MVPA energy expenditure (MJ/day)). * p for trend <0.05. p for trend refers to p values obtained by linear regression models with total time spent on sedentary behaviors as continuous variables. ). Data shown are least-squares means (95% CI) adjusted for average annual income of family, maternal overweight, total energy intake (MJ/day) and MVPA energy expenditure (MJ/day)). * p for trend <0.05. p for trend refers to p values obtained by linear regression models with total time spent on sedentary behaviors as continuous variables.
). Data shown are least-squares means (95% CI) adjusted for average annual income of family, maternal overweight, total energy intake (MJ/day) and MVPA energy expenditure (MJ/day)). * p for trend <0.05. p for trend refers to p values obtained by linear regression models with total time spent on sedentary behaviors as continuous variables.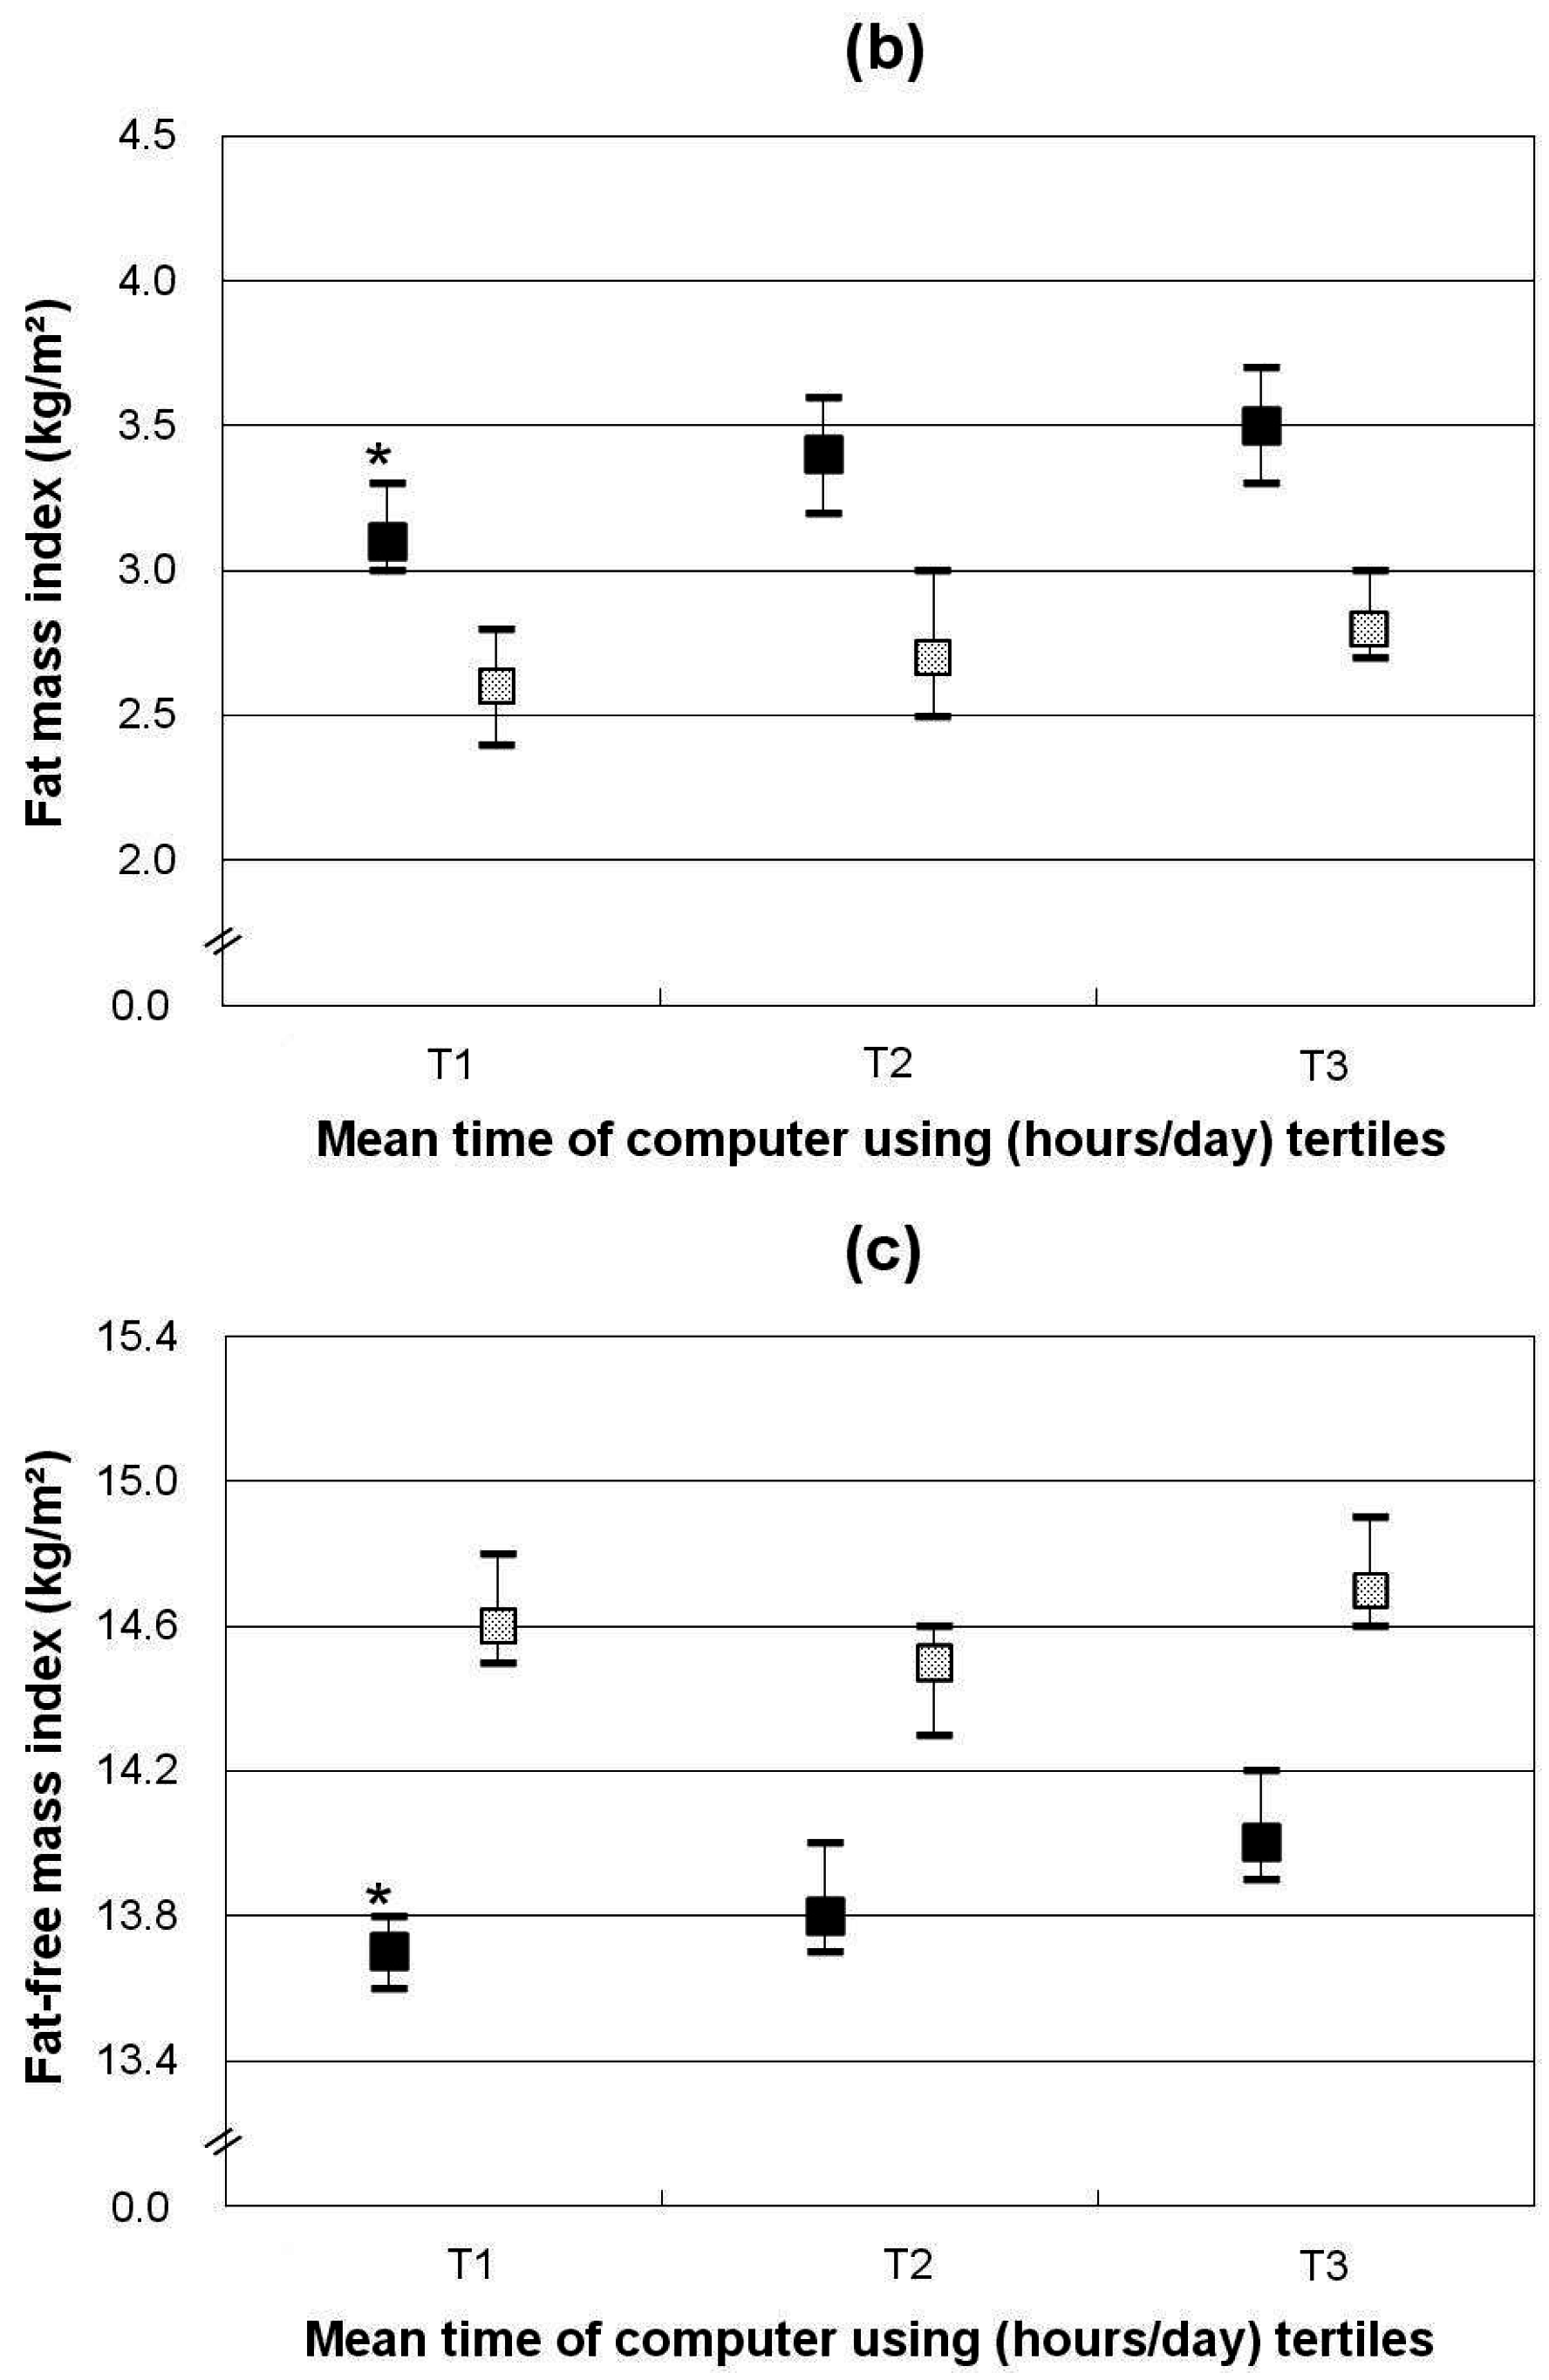
). Data shown are least-squares means (95% CI) adjusted for average annual income of family, maternal overweight, total energy intake (MJ/day) and MVPA energy expenditure (MJ/day)). * p for trend <0.05. p for trend refers to p values obtained by linear regression models with total time spent on sedentary behaviors as continuous variables.
| Girls | Boys | p | |
|---|---|---|---|
| n (%) | 798 (50.3) | 788 (49.8) | |
| Age (years) | 10.1 (8.6, 11.7) | 10.0 (8.6, 11.7) | 0.2 |
| Pubertal stage 2 (n, %) | 410 (62.1) | 346 (54.8) | 0.08 |
| Birth weight (kg) | 3.2 (2.9, 3.5) | 3.3 (3.0, 3.6) | <0.0001 |
| Family data | |||
| High income of family 3 (n, %) | 193 (24.2) | 193 (24.5) | 0.9 |
| Maternal overweight 4 (n, %) | 141 (18.4) | 143 (19.7) | 0.5 |
| Paternal overweight 4 (n, %) | 308 (40.2) | 288 (39.8) | 0.9 |
| High maternal education level 5 (n, %) | 139 (19.8) | 126 (18.1) | 0.4 |
| High paternal education level 5 (n, %) | 193 (25.0) | 179 (23.3) | 0.4 |
| Total energy intake (MJ/day) | 7.7 (6.4, 9.5) | 8.7 (7.3, 10.7) | <0.0001 |
| MVPA energy expenditure 6 (MJ/day) | 0.5 (0.3, 0.8) | 0.6 (0.3, 0.9) | 0.03 |
| Anthropometric data | |||
| BMI SDS 7 | 0.4 (−0.2, 1.0) | 0.08 (−0.5, 0.8) | <0.0001 |
| Overweight 8 (n, %) | 104 (13.0) | 143 (18.1) | 0.01 |
| Percent body fat 9 (%) | 18.5 (14.9, 24.1) | 14.4 (11.1, 20.9) | <0.0001 |
| Fat mass index (kg/m2) | 3.2 (2.4, 4.5) | 2.5 (1.8, 3.9) | <0.0001 |
| Fat-free mass index (kg/m2) | 13.8 (13.1, 14.6) | 14.6 (13.9, 15.3) | <0.0001 |
| Sedentary behaviors | |||
| Screen time 10 (h/day) | 1.4 (0.8, 2.3) | 1.7 (1.0, 2.9) | <0.0001 |
| Screen time ≥2 h/day 11 (n, %) | 263 (33.0) | 339 (43.0) | <0.0001 |
| Doing homework (h/day) | 0.8 (0.5, 1.5) | 1.1 (0.8, 1.8) | <0.0001 |
| Doing homework ≥1 h/day (n, %) | 359 (45.0) | 426 (54.0) | 0.0004 |
| Doing homework ≥2 h/day (n, %) | 114 (14.3) | 136 (17.2) | 0.1 |
| Daily Time Spent on Screen Time | p | |||
|---|---|---|---|---|
| T1 | T2 | T3 | ||
| Girls | ||||
| n | 251 | 284 | 263 | |
| Age (years) | 9.4 (8.1, 10.9) | 9.9 (8.5, 11.7) | 11.0 (9.5, 12.3) | 0.03 |
| Pubertal stage 3 (n, %) | 97 (49.7) | 147 (64.2) | 166 (70.3) | 0.06 |
| Birth weight (kg) | 3.2 (2.9, 3.5) | 3.2 (2.9, 3.5) | 3.3 (3.0, 3.5) | 0.4 |
| Family data | ||||
| High income of family 4 (n, %) | 62 (24.7) | 59 (20.8) | 72 (27.4) | 0.2 |
| Maternal overweight 5 (n, %) | 30 (12.3) | 55 (20.2) | 56 (22.2) | 0.01 |
| Paternal overweight 5 (n, %) | 95 (39.3) | 99 (36.8) | 114 (44.7) | 0.2 |
| High maternal education level 6 (n, %) | 52 (23.2) | 44 (17.7) | 43 (18.6) | 0.3 |
| High paternal education level 6 (n, %) | 72 (29.6) | 63 (23.0) | 58 (22.8) | 0.1 |
| Total energy intake (MJ/day) | 7.4 (6.3, 9.7) | 7.6 (6.3, 9.4) | 8.0 (6.6, 9.6) | 0.2 |
| MVPA energy expenditure 7 (MJ/day) | 0.4 (0.3, 0.7) | 0.4 (0.2, 0.7) | 0.5 (0.3, 0.9) | 0.1 |
| Anthropometric data | ||||
| BMI SDS 8 | 0.2 (−0.3, 0.9) | 0.5 (−0.2, 1.1) | 0.4 (−0.1, 1.0) | 0.07 |
| Overweight 9 (n, %) | 25 (10.0) | 45 (15.8) | 34 (12.9) | 0.09 |
| Percent body fat 10 (%) | 17.2 (13.9, 23.7) | 18.7 (18.9, 24.0) | 19.7 (16.0, 24.5) | 0.0007 |
| Fat mass index (kg/m2) | 2.8 (2.1, 4.3) | 3.2 (2.4, 4.4) | 3.5 (2.6, 4.7) | <0.0001 |
| Fat-free mass index (kg/m2) | 13.6 (12.9, 14.3) | 13.8 (13.1, 14.7) | 14.1 (13.3, 14.8) | <0.0001 |
| Boys | ||||
| n | 263 | 262 | 263 | |
| Age (years) | 9.6 (8.3, 11.1) | 10.5 (8.7, 12.0) | 11.0 (9.4, 12.5) | 0.04 |
| Pubertal stage 3 (n, %) | 110 (53.4) | 125 (57.6) | 111 (53.4) | 0.6 |
| Birth weight (kg) | 3.3 (3.0, 3.8) | 3.4 (3.0, 3.6) | 3.3 (3.0, 3.5) | 0.7 |
| Family data | ||||
| High income of family 4 (n, %) | 56 (21.3) | 62 (23.7) | 75 (28.5) | 0.1 |
| Maternal overweight 5 (n, %) | 46 (33.3) | 40 (33.9) | 57 (32.8) | 0.1 |
| Paternal overweight 5 (n, %) | 99 (41.6) | 96 (39.3) | 93 (38.4) | 0.8 |
| High maternal education level 6 (n, %) | 49 (20.9) | 44 (19.1) | 33 (14.2) | 0.2 |
| High paternal education level 6 (n, %) | 61 (23.7) | 74 (29.2) | 44 (17.2) | 0.007 |
| Total energy intake (MJ/day) | 8.4 (7.1, 10.3) | 8.6 (7.0, 10.6) | 9.1 (7.6, 11.2) | 0.0002 |
| MVPA energy expenditure 7 (MJ/day) | 0.5 (0.3, 0.9) | 0.4 (0.2, 0.8) | 0.5 (0.3, 0.8) | 0.2 |
| Anthropometric data | ||||
| BMI SDS 8 | 0.01 (−0.5, 0.7) | 0.1 (−0.5, 0.8) | 0.07 (−0.5, 0.8) | 1.0 |
| Overweight 9 (n, %) | 46 (17.5) | 47 (17.9) | 50 (19.0) | 0.7 |
| Percent body fat 10 (%) | 13.9 (10.7, 19.6) | 14.5 (11.1, 21.2) | 15.1 (11.8, 21.7) | 0.055 |
| Fat mass index (kg/m2) | 2.4 (1.7, 3.7) | 2.6 (1.8, 4.0) | 2.7 (1.9, 4.0) | 0.03 |
| Fat-free mass index (kg/m2) | 14.5 (13.8, 15.2) | 14.5 (13.9, 15.2) | 14.8 (14.2, 15.5) | 0.0006 |
| Tertiles of Daily Time Spent on Screen 2 | p for Trend | |||
|---|---|---|---|---|
| T1 | T2 | T3 | ||
| Girls (n = 797) | 0.6 (0.4, 0.8) 3 | 1.4 (1.1, 1.6) 3 | 2.9 (2.3, 3.9) 3 | |
| Percentage body fat (%) | ||||
| Unadjusted model | 18.0 (17.3, 18.7) | 19.1 (18.4, 19.9) | 20.1 (19.4, 20.9) | 0.0004 |
| Model A 4 | 18.0 (17.3, 18.7) | 19.1 (18.3, 19.8) | 20.0 (19.2, 20.9) | 0.0006 |
| Model B 5 | 18.0 (17.3, 18.8) | 19.2 (18.4, 20.0) | 19.8 (19.1, 20.6) | 0.03 |
| Model C 6 | 18.0 (17.3, 18.7) | 19.1 (18.3, 19.8) | 20.0 (19.2, 20.8) | 0.0007 |
| Model D 7 | 18.0 (17.3, 18.8) | 19.2 (18.4, 19.9) | 19.8 (19.1, 20.6) | 0.003 |
| Fat mass index (kg/m2) | ||||
| Unadjusted model | 3.0 (2.9, 3.2) | 3.3 (3.2, 3.5) | 3.6 (3.4, 3.8) | 0.0001 |
| Model A 4 | 3.0 (2.9, 3.2) | 3.3 (3.1, 3.5) | 3.6 (3.4, 3.8) | 0.0002 |
| Model B 5 | 3.0 (2.9, 3.2) | 3.4 (3.2, 3.5) | 3.5 (3.3, 3.7) | 0.001 |
| Model C 6 | 3.0 (2.9, 3.2) | 3.3 (3.1, 3.5) | 3.6 (3.4, 3.8) | 0.0002 |
| Model D 7 | 3.0 (2.9, 3.2) | 3.4 (3.2, 3.5) | 3.5 (3.3, 3.7) | 0.001 |
| Fat-free mass index (kg/m2) | ||||
| Unadjusted model | 13.6 (13.4, 13.7) | 13.9 (13.8, 14.0) | 14.1 (13.9, 14.2) | <0.0001 |
| Model A 4 | 13.6 (13.4, 13.7) | 13.9 (13.7, 14.0) | 14.0 (13.9, 14.2) | <0.0001 |
| Model B 5 | 13.6 (13.4, 13.7) | 13.9 (13.8, 14.0) | 14.0 (13.9, 14.1) | 0.0001 |
| Model C 6 | 13.6 (13.4, 13.7) | 13.9 (13.7, 14.0) | 14.0 (13.9, 14.2) | <0.0001 |
| Model D 7 | 13.6 (13.4, 13.7) | 13.9 (13.8, 14.0) | 14.0 (13.9, 14.1) | 0.0001 |
| Boys (n = 789) | 0.8 (0.5, 0.8) 3 | 1.4 (1.1, 1.6) 3 | 3.6 (2.9, 4.6) 3 | |
| Percentage body fat (%) | ||||
| Unadjusted model | 14.5 (13.8, 15.4) | 15.6 (14.8, 16.5) | 15.9 (15.1, 16.8) | 0.04 |
| Model A 4 | 14.6 (13.8, 15.4) | 15.7 (14.8, 16.6) | 15.9 (15.1, 16.9) | 0.058 |
| Model B 5 | 14.6 (13.8, 15.4) | 15.7 (14.8, 16.6) | 15.9 (15.1, 16.9) | 0.058 |
| Model C 6 | 14.7 (13.9, 15.6) | 15.7 (14.9, 16.6) | 15.8 (15.0, 16.8) | 0.1 |
| Model D 7 | 14.7 (13.9, 15.6) | 15.7 (14.9, 16.6) | 15.8 (15.0, 16.8) | 0.1 |
| Fat mass index (kg/m2) | ||||
| Unadjusted model | 2.5 (2.4, 2.7) | 2.8 (2.6, 3.0) | 2.9 (2.7, 3.1) | 0.03 |
| Model A 4 | 2.5 (2.4, 2.7) | 2.8 (2.6, 3.0) | 2.9 (2.7, 3.1) | 0.04 |
| Model B 5 | 2.5 (2.4, 2.7) | 2.8 (2.6, 3.0) | 2.9 (2.7, 3.1) | 0.04 |
| Model C 6 | 2.6 (2.4, 2.8) | 2.8 (2.6, 3.0) | 2.9 (2.7, 3.1) | 0.09 |
| Model D 7 | 2.6 (2.4, 2.8) | 2.8 (2.6, 3.0) | 2.9 (2.7, 3.1) | 0.09 |
| Fat-free mass index (kg/m2) | ||||
| Unadjusted model | 14.5 (14.4, 14.7) | 14.6 (14.5, 14.7) | 14.8 (14.7, 15.0) | 0.001 |
| Model A 4 | 14.5 (14.4, 14.6) | 14.5 (14.4, 14.7) | 14.8 (14.7, 14.9) | 0.001 |
| Model B 5 | 14.5 (14.4, 14.6) | 14.5 (14.4, 14.7) | 14.8 (14.7, 14.9) | 0.001 |
| Model C 6 | 14.5 (14.4, 14.6) | 14.5 (14.4, 14.7) | 14.8 (14.7, 14.9) | 0.003 |
| Model D 7 | 14.5 (14.4, 14.7) | 14.5 (14.4, 14.7) | 14.8 (14.7, 14.9) | 0.003 |
| Tertiles of Daily Time Spent on Doing Homework 2 | p for Trend | |||
|---|---|---|---|---|
| T1 | T2 | T3 | ||
| Girls (n = 797) | 0.5 (0.5, 0.5) 3 | 0.8 (0.8, 1.1) 3 | 1.8 (1.5, 2.5) 3 | |
| Percentage body fat (%) | ||||
| Unadjusted model | 17.8 (17.1, 18.5) | 18.8 (18.1, 19.6) | 20.7 (19.9, 21.5) | 0.0007 |
| Model A 4 | 17.7 (17.0, 18.5) | 18.7 (18.0, 19.5) | 20.6 (19.8, 21.4) | 0.001 |
| Model B 5 | 18.4 (17.8, 19.0) | 19.2 (18.4, 20.1) | 19.8 (18.9, 20.6) | 0.003 |
| Model C 6 | 17.7 (17.0, 18.4) | 18.7 (18.0, 19.5) | 20.6 (19.8, 21.4) | 0.0009 |
| Model D 7 | 18.0 (17.3, 18.7) | 18.6 (17.9, 19.3) | 20.4 (19.7, 21.2) | 0.003 |
| Fat mass index (kg/m2) | ||||
| Unadjusted model | 3.0 (2.8, 3.2) | 3.3 (3.1, 3.5) | 3.7 (3.5, 3.9) | 0.0005 |
| Model A 4 | 3.0 (2.8, 3.1) | 3.3 (3.1, 3.5) | 3.7 (3.5, 3.9) | 0.0007 |
| Model B 5 | 3.1 (3.0, 3.3) | 3.4 (3.2, 3.6) | 3.5 (3.3, 3.7) | 0.002 |
| Model C 6 | 3.0 (2.8, 3.1) | 3.3 (3.1, 3.4) | 3.7 (3.5, 3.9) | 0.0006 |
| Model D 7 | 3.0 (2.9, 3.2) | 3.2 (3.0, 3.4) | 3.7 (3.5, 3.9) | 0.003 |
| Fat-free mass index (kg/m2) | ||||
| Unadjusted model | 13.6 (13.5, 13.8) | 13.9 (13.8, 14.1) | 14.1 (13.9, 14.2) | 0.02 |
| Model A 4 | 13.6 (13.4, 13.7) | 13.9, 13.8. 14.0 | 14.0 (13.9, 14.2) | 0.01 |
| Model B 5 | 13.7 (13.6, 13.8) | 13.8 (13.7, 14.0) | 14.0 (13.9, 14.2) | 0.03 |
| Model C 6 | 13.6 (13.4, 13.7) | 13.9 (13.7, 14.0) | 14.0 (13.9, 14.2) | 0.01 |
| Model D 7 | 13.6 (13.5, 13.8) | 13.9 (13.7, 14.0) | 14.0 (13.9, 14.1) | 0.03 |
| Boys (n = 789) | 0.5 (0.5, 0.5) 3 | 0.8 (0.8, 1.1) 3 | 1.8 (1.5, 2.5) 3 | |
| Percentage body fat (%) | ||||
| Unadjusted model | 14.8 (13.8, 15.7) | 15.1 (14.3, 16.0) | 15.9 (15.2, 16.7) | 0.03 |
| Model A 4 | 14.8 (13.8, 15.8) | 15.1 (14.3, 16.0) | 16.0 (15.2, 16.8) | 0.03 |
| Model B 5 | 14.6 (13.7, 15.5) | 15.6 (14.7, 16.5) | 15.9 (15.1, 16.8) | 0.03 |
| Model C 6 | 14.8 (13.9, 15.8) | 15.2 (14.3, 16.1) | 15.9 (15.1, 16.7) | 0.03 |
| Model D 7 | 15.1 (14.2, 16.1) | 15.2 (14.3, 16.0) | 15.7 (14.9, 16.5) | 0.04 |
| Fat mass index (kg/m2) | ||||
| Unadjusted model | 2.6 (2.4, 2.8) | 2.7 (2.5, 2.9) | 2.8 (2.7, 3.0) | 0.03 |
| Model A 4 | 2.6 (2.4, 2.8) | 2.7 (2.5, 2.9) | 2.8 (2.7, 3.0) | 0.03 |
| Model B 5 | 2.6 (2.4, 2.8) | 2.7 (2.5, 3.0) | 2.9 (2.7, 3.1) | 0.03 |
| Model C 6 | 2.6 (2.4, 2.8) | 2.7 (2.5, 2.9) | 2.8 (2.7, 3.0) | 0.03 |
| Model D 7 | 2.7 (2.5, 2.9) | 2.7 (2.5, 2.9) | 2.8 (2.6, 3.0) | 0.03 |
| Fat-free mass index (kg/m2) | ||||
| Unadjusted model | 14.6 (14.4, 14.7) | 14.8 (14.6, 14.9) | 14.6 (14.5, 14.7) | 0.4 |
| Model A 4 | 14.5 (14.4, 14.7) | 14.7 (14.6, 14.9) | 14.6 (14.5, 14.7) | 0.5 |
| Model B 5 | 14.6 (14.4, 14.7) | 14.5 (14.3, 14.6) | 14.7 (14.6, 14.9) | 0.5 |
| Model C 6 | 14.5 (14.4, 14.7) | 14.7 (14.6, 14.9) | 14.6 (14.5, 14.7) | 0.5 |
| Model D 7 | 14.5 (14.4, 14.7) | 14.7 (14.6, 14.9) | 14.6 (14.5, 14.7) | 0.5 |
| Tertiles of Daily Time Spent on Total Sedentary Behavior 2 | p for Trend | |||
|---|---|---|---|---|
| T1 | T2 | T3 | ||
| Girls (n = 797) | 1.5 (1.2, 1.9) 3 | 2.7 (2.5, 3.1) 3 | 4.7 (4.1, 5.8) 3 | |
| Percentage body fat (%) | ||||
| Unadjusted model | 17.7 (17.1, 18.4) | 19.8 (19.0, 20.6) | 20.2 (19.4, 21.1) | <0.0001 |
| Model A 4 | 17.7 (17.1, 18.4) | 19.7 (19.0, 20.5) | 20.1 (19.2, 21.0) | <0.0001 |
| Model B 5 | 17.8 (17.2, 18.4) | 19.8 (19.1, 20.6) | 19.9 (19.0, 20.8) | 0.0002 |
| Model C 6 | 17.7 (17.1, 18.4) | 19.7 (19.0, 20.5) | 20.1 (19.2, 21.0) | <0.0001 |
| Model D 7 | 17.8 (17.2, 18.4) | 19.8 (19.1, 20.6) | 19.9 (19.0, 20.8) | 0.0002 |
| Fat mass index (kg/m2) | ||||
| Unadjusted model | 3.0 (2.8, 3.1) | 3.5 (3.3, 3.7) | 3.6 (3.4, 3.9) | <0.0001 |
| Model A 4 | 3.0 (2.8, 3.1) | 3.5 (3.3, 3.7) | 3.6 (3.4, 3.8) | <0.0001 |
| Model B 5 | 3.0 (2.8, 3.2) | 3.5 (3.3, 3.7) | 3.5 (3.3, 3.7) | <0.0001 |
| Model C 6 | 3.0 (2.8, 3.1) | 3.5 (3.3, 3.7) | 3.6 (3.4, 3.8) | <0.0001 |
| Model D 7 | 3.0 (2.8, 3.1) | 3.5 (3.3, 3.7) | 3.5 (3.3, 3.7) | <0.0001 |
| Fat-free mass index (kg/m2) | ||||
| Unadjusted model | 13.6 (13.5, 13.7) | 14.0 (13.9, 14.1) | 14.1 (13.9, 14.2) | <0.0001 |
| Model A 4 | 13.6 (13.5, 13.7) | 14.0 (13.8, 14.1) | 14.0 (13.9, 14.2) | <0.0001 |
| Model B 5 | 13.6 (13.5, 13.7) | 14.0 (13.8, 14.1) | 14.0 (13.8, 14.1) | <0.0001 |
| Model C 6 | 13.6 (13.5, 13.7) | 14.0 (13.8, 14.1) | 14.0 (13.9, 14.2) | <0.0001 |
| Model D 7 | 13.6 (13.5, 13.7) | 14.0 (13.8, 14.1) | 14.0 (13.8, 14.1) | <0.0001 |
| Boys (n = 789) | 1.6 (1.3, 1.9) 3 | 2.8 (2.5, 3.2) 3 | 5.0 (4.2, 5.9) 3 | |
| Percentage body fat (%) | ||||
| Unadjusted model | 14.2 (13.4, 15.1) | 15.5 (14.6, 16.4) | 16.2 (15.4, 17.0) | 0.008 |
| Model A 4 | 14.2 (13.4, 15.1) | 15.5 (14.7, 16.5) | 16.2 (15.3, 17.1) | 0.01 |
| Model B 5 | 14.2 (13.4, 15.1) | 15.6 (14.7, 16.5) | 16.2 (15.3, 17.1) | 0.01 |
| Model C 6 | 14.4 (13.5, 15.3) | 15.5 (14.7, 16.4) | 16.1 (15.3, 17.0) | 0.02 |
| Model D 7 | 14.4 (13.5, 15.3) | 15.5 (14.7, 16.4) | 16.1 (15.3, 17.0) | 0.02 |
| Fat mass index (kg/m2) | ||||
| Unadjusted model | 2.5 (2.3, 2.7) | 2.8 (2.6, 3.0) | 2.9 (2.7, 3.1) | 0.005 |
| Model A 4 | 2.5 (2.3, 2.7) | 2.8 (2.6, 3.0) | 2.9 (2.7, 3.1) | 0.007 |
| Model B 5 | 2.5 (2.3, 2.7) | 2.8 (2.6, 3.0) | 2.9 (2.7, 3.1) | 0.007 |
| Model C 6 | 2.5 (2.3, 2.7) | 2.8 (2.6, 3.0) | 2.9 (2.7, 3.1) | 0.02 |
| Model D 7 | 2.5 (2.3, 2.7) | 2.8 (2.6, 3.0) | 2.9 (2.7, 3.1) | 0.02 |
| Fat-free mass index (kg/m2) | ||||
| Unadjusted model | 14.5 (14.4, 14.7) | 14.6 (14.5, 14.7) | 14.8 (14.7, 14.9) | 0.001 |
| Model A 4 | 14.5 (14.4, 14.6) | 14.6 (14.4, 14.7) | 14.7 (14.6, 14.9) | 0.002 |
| Model B 5 | 14.5 (14.4, 14.6) | 14.6 (14.4, 14.7) | 14.7 (14.6, 14.9) | 0.002 |
| Model C 6 | 14.5 (14.4, 14.7) | 14.6 (14.4, 14.7) | 14.7 (14.6, 14.9) | 0.005 |
| Model D 7 | 14.5 (14.4, 14.7) | 14.6 (14.4, 14.7) | 14.7 (14.6, 14.9) | 0.005 |
© 2016 by the authors; licensee MDPI, Basel, Switzerland. This article is an open access article distributed under the terms and conditions of the Creative Commons Attribution (CC-BY) license (http://creativecommons.org/licenses/by/4.0/).
Share and Cite
Xue, H.; Tian, G.; Duan, R.; Quan, L.; Zhao, L.; Yang, M.; Libuda, L.; Muckelbauer, R.; Cheng, G. Sedentary Behavior Is Independently Related to Fat Mass among Children and Adolescents in South China. Nutrients 2016, 8, 667. https://doi.org/10.3390/nu8110667
Xue H, Tian G, Duan R, Quan L, Zhao L, Yang M, Libuda L, Muckelbauer R, Cheng G. Sedentary Behavior Is Independently Related to Fat Mass among Children and Adolescents in South China. Nutrients. 2016; 8(11):667. https://doi.org/10.3390/nu8110667
Chicago/Turabian StyleXue, Hongmei, Guo Tian, Ruonan Duan, Liming Quan, Li Zhao, Min Yang, Lars Libuda, Rebecca Muckelbauer, and Guo Cheng. 2016. "Sedentary Behavior Is Independently Related to Fat Mass among Children and Adolescents in South China" Nutrients 8, no. 11: 667. https://doi.org/10.3390/nu8110667
APA StyleXue, H., Tian, G., Duan, R., Quan, L., Zhao, L., Yang, M., Libuda, L., Muckelbauer, R., & Cheng, G. (2016). Sedentary Behavior Is Independently Related to Fat Mass among Children and Adolescents in South China. Nutrients, 8(11), 667. https://doi.org/10.3390/nu8110667