Abstract
Background: Food allergy (FA) is an emerging problem in pediatrics, with tree nuts and peanuts being frequent causes of severe reactions. Oral food challenge (OFC) remains the gold standard for diagnosing FA. However, it is a stressful treatment and not always risk-free. Objectives: To identify potential biomarkers, using component-resolved diagnosis (CRD) associated with OFC outcome in children with tree nut (hazelnut, walnut, almond, and pistachio) and peanut allergy, who live in central and southern Italy. Methods: Eighty-eight (1–18 years) children followed at the Pediatric Allergy Clinic of Policlinico Umberto I in Rome were included in this study. All patients underwent skin prick tests (SPTs), prick-by-prick (PbP) tests, and serum-specific Immunoglobulin E (sIgE) measurement to allergenic components using CRDs. Results: In hazelnut allergy (n = 60 OFCs), OFC failure occurred in 41 children. Higher sIgE levels to Cor a 8 (OR 2.04, 95% CI 1.17–3.55), Cor a 9 (OR 2.61, 95% CI 1.37–5.00), and Cor a 14 (OR 1.65, 95% CI 1.14–2.38) were all significantly associated with an increased probability of a positive OFC outcome. In peanut allergy (n = 30 OFCs), OFC failure occurred in 16 children. Ara h 9 was the only statistically significant predictor of OFC failure, showing a very wide confidence interval (OR, 95% CI: 1.116–484). For walnut, almond, and pistachio, sample sizes were insufficient to support inferential modeling. Conclusions: CRD biomarkers can stratify the likelihood of OFC reactions in pediatric FA, enhancing clinical decision-making and reducing unnecessary challenges.
1. Introduction
Food allergy (FA) is an abnormal immunological reaction that occurs following the ingestion of a specific food [1,2]. FA can be classified into IgE-mediated, non-IgE-mediated, and mixed forms. IgE-mediated FAs are also known as “immediate”, due to the rapid onset of symptoms (usually within a few minutes), which can include cutaneous, gastrointestinal, and respiratory manifestations, among others [3]. In 2023, the European Academy of Allergy and Clinical Immunology (EAACI) published the new guidelines for the diagnosis of FA [4]. The diagnosis of FA relies on a combination of clinical history and diagnostic tests. First-line investigations include skin prick tests (SPTs), prick-by-prick (PbP) tests, and serum-specific Immunoglobulin E (sIgE) measurements [5,6,7,8,9,10]. SPTs and PbP assess immediate hypersensitivity reactions to allergen extracts or fresh foods, whereas sIgE quantifies circulating IgE antibodies against specific allergens. Although these tests provide valuable information on sensitization, they cannot reliably predict the outcome of the oral food challenge (OFC), which remains the gold standard for FA diagnosis and for assessing tolerance acquisition after an elimination diet [11,12]. Several studies have attempted to correlate SPT or PbP size with OFC outcomes, but the results have been inconsistent and no standardized thresholds have been established [13,14].
Nut and peanut allergies are a major concern in pediatric populations due to their prevalence and the risk of severe reactions. In Western countries, the prevalence of nut allergy ranges from 1% to 2%, with hazelnut and peanut among the most common allergens [14,15,16,17,18,19,20]. In Italy, nut allergy is the second leading cause of food anaphylaxis, with hazelnut allergy affecting approximately 0.2% of children [21,22]. Peanut allergy is also increasingly prevalent worldwide, with estimates ranging from 0.1% to 2.2% depending on the population and diagnostic method [23,24,25]. Clinical manifestations of these allergies vary, but cutaneous reactions are the most common, followed by gastrointestinal and, more rarely, respiratory symptoms; anaphylaxis may occur in a substantial proportion of cases [26,27,28]. These allergies are often persistent and difficult to outgrow, highlighting the need for effective risk stratification.
In the precision medicine era, molecular diagnostics may represent a valuable tool for pediatric allergists to guide decisions about whether to perform an OFC; however, pediatric studies on this topic remain scarce [11]. Component-resolved diagnostics (CRD) enables the identification of specific molecular allergens and may improve risk assessment in FA management. In this study, we analyzed CRD profiles for hazelnut (Cor a 1, Cor a 8, Cor a 9, and Cor a 14), peanut (Ara h 1, Ara h 2, Ara h 3, Ara h 8, and Ara h 9), and, in some cases, walnuts, almonds, and pistachios in children who live in central and southern Italy [29,30,31,32,33,34,35,36,37,38].
Hazelnut molecular components differ in clinical relevance: Cor a 1 (Cor a 1.0401) is a labile protein (PR-10) associated with birch pollen cross-reactivity and oral allergy syndrome, whereas Cor a 8 (LTP) and the storage proteins Cor a 9 (11S globulin) and Cor a 14 (2S albumin) are heat- and digestion-stable and are associated with systemic and severe allergic reactions. Sensitization patterns vary geographically: in Northern Europe, Cor a 1 predominates due to birch exposure, while in Mediterranean populations, Cor a 8, Cor a 9, and Cor a 14 are more prevalent, especially in children [39]. Peanuts contain several allergenic components, among which Ara h 1, Ara h 2, and Ara h 3, and related storage proteins are traditionally considered the major allergens because of their resistance to heat and digestion. In contrast, Ara h 8 belongs to the Bet v 1 homologues, while Ara h 9 is a lipid transfer protein (LTP), reflecting different allergenic pathways [40].
Even in a few cases, we also tested CRD for walnuts, almonds, and pistachios. The CRD for walnuts examined in our study were Jug r 1 (2S albumin) and Jug r 3 (nsLTP) [33,34,35]. IgEs specific to Jug r 1 were detected in most walnut-allergic patients in a US-based study, while sensitization to Jug r 3 seems to be prevalent among Italian patients [36].
Regarding almond allergy, eight native almond allergens have been characterized according to their biochemical function, and Pru du 3 is the nsLTP [37]. Of the four allergens identified for pistachio, the major allergen is Pis v 1 (2S albumin) [38].
This study aimed to identify biomarkers associated with a higher risk of OFC failure in children with tree nut and peanut allergies followed at our center in Rome and living in central and southern Italy. We hypothesized that specific molecular sensitization profiles, as assessed by CRD, could predict OFC outcomes and guide clinical decision-making, thereby reducing the need for unnecessary and stressful challenges.
2. Materials and Methods
2.1. Study Design
A prospective observational study was conducted in 2024 at the Pediatric Allergy and Immunology Clinic of Policlinico Umberto I in Rome. The study aimed to identify molecular biomarkers predictive of OFC outcomes. Assessments included clinical history, SPTs, and PbP testing CRD and OFC. OFC was conducted in accordance with the recommendations of the European Academy of Allergy and Clinical Immunology (EAACI) [41] and the PRACTALL consensus on food challenge tests [42]. The study design and procedures have been approved by the Ethics Committee of Policlinico Umberto I in Rome. Informed consent was obtained from parents/legal guardians.
2.2. Participants
Eighty-eight children (1–18 years) with IgE-mediated FA to hazelnut, peanut, walnut, almond, or pistachio were included in the study. Inclusion criteria were: age 0–18 years, diagnosis confirmed by SPT, PbP, and CRD, and willingness to undergo OFC. Exclusion criteria were: active infection, chronic disease, or recent use of antibiotics, antihistamines, or corticosteroids (within the previous 15 days).
2.3. Component Resolved Diagnosis (CRD)
All the patients underwent a blood sample to detect sIgE related to the allergenic molecules listed below:
- Hazelnut: Specific CRDs are Cor a 1 (PR-10), Cor a 8 (nsLTP), Cor a 9 (11S globulin), and Cor a 14 (2S albumin) [43]; Bet v 1 (PR-10) and Bet v 2 (PR-10) [44].
- Peanut: Specific CRDs are Ara h 1 (7S protein), Ara h 2 (2S albumin), Ara h 3 (11S globulin), Ara h 8 (PR-10), and Ara h 9 (nsLTP) [31,32].
- Walnut: Specific CRDs are Jug r 1 (2S albumin) and Jug r 3 (nsLTP) [33,34,35].
All measurements were performed using a fluorescence enzyme immunoassay (FEIA) on a Phadia™ 250 laboratory system platform with capsulated cellulose polymer solid-phase ImmunoCAP® allergens (Thermo Fisher Scientific, Phadia AB, Uppsala, Sweden), with the exception of almond and pistachio, for which sIgE tests were requested.
Specific IgE values were analyzed on their original scale. Results were expressed in kUA/L, and a cutoff of 0.1 kUA/L was used to define positivity.
2.4. Total IgE
Total IgE was measured using a standardized fluoroenzyme immunoassay (FEIA) on the ImmunoCAP system (Thermo Fisher Scientific). The assay relies on a solid-phase immunoassay in which serum IgE binds to immobilized anti-IgE antibodies, and fluorescence intensity, measured after enzyme labeling, is proportional to IgE concentration.
2.5. Oral Hazelnut Challenges
All patients underwent one or more OFC on non-consecutive days. Expert pediatric allergologists and trained nurses conducted all the OFCs [45]. The test was considered negative if the patient consumed all the prescribed doses of the offending food without experiencing any reaction. It was considered positive if, during the test, objective clinical signs and subjective, moderate-to-severe symptoms of increasing severity appeared, preventing the patient from consuming all prescribed doses of the culprit food.
For hazelnut, the cumulative dose of protein progressively and incrementally given every 15–20 min was as follows: 0.15 mg, 0.75 mg, 1.5 mg, 7.5 mg, 15 mg, 75 mg, 150 mg, and 300 mg [46].
For peanut, the cumulative dose of protein given progressively was 1.3 mg, 2.6 mg, 6.5 mg, 13 mg, 39 mg, 78 mg, 156 mg, and 312 mg [47].
For walnuts, the cumulative dose of protein progressively and incrementally given was 0.75 mg, 1.5 mg, 3.75 mg, 7.5 mg, 15 mg, 22.5 mg, 45 mg, 90 mg, 180 mg, and 300 mg [48].
For almonds, the cumulative dose of protein given progressively was 1.05 mg, 2.1 mg, 5.25 mg, 10.5 mg, 21 mg, 31.5 mg, 63 mg, 126 mg, 252 mg, 420 mg, and 840 mg [48].
For pistachio, the cumulative dose of protein progressively and incrementally given was 1 mg, 2 mg, 5 mg, 10 mg, 20 mg, 30 mg, 60 mg, 120 mg, 240 mg, 400 mg, and 800 mg [48].
The OFC was considered positive and therefore classified as a failure if clinical symptoms appeared during the administration of incremental doses of the test food, according to the EAACI recommendation [41] and the PRACTALL consensus on food challenge tests [42].
2.6. Statistical Analysis
Data were collected using Microsoft Excel and analyzed using the R software package version 4.4.3. The analysis was conducted in two phases. In the first phase, descriptive statistics were used to summarize and visualize the experimental results. Two summary tables were generated: one describing the sample’s demographic characteristics, and the other reporting the empirical frequencies of observed symptoms.
Since each child underwent at least one OFC, the total number of tests exceeded the number of children. For each allergen tested, the subgroup of children exposed to that allergen was analyzed, and a boxplot was used to compare wheal diameters between those who passed and those who failed the OFC. A boxplot displays a dataset’s distribution through five summary statistics (minimum, Q1, median, Q3, and maximum). The box represents the interquartile range (IQR), with the median marked inside; whiskers extend to 1.5× IQR, and outliers are shown as separate points. When one group has a single observation, the boxplot reduces to a horizontal line at the median.
In the second phase, the analysis aimed to evaluate whether molecular IgE profiles could predict OFC outcomes. The analysis focused on allergens with sufficient data, namely hazelnut and peanut. For each allergen, the OFC outcome was modeled using logistic regression, with the binary response variable indicating challenge failure (1) or tolerance (0) and allergen-specific IgE components as predictors. The objective was to identify IgE components associated with the probability of a positive OFC and to quantify their effects.
Overall, 117 OFCs were performed; 17 children underwent two challenges and 6 underwent three (Table 1). Allergen-specific logistic regression models were fitted separately, as the number and type of available IgE components differed across foods. The IgE components considered were Cor a 1, Cor a 8, Cor a 9, Cor a 14, Bet v 1, and Bet v 2 for hazelnut; Ara h 1, Ara h 2, Ara h 3, Ara h 8, and Ara h 9 for peanut; Jug r 1 and Jug r 3 for walnut; Pru du 3 for almond; and Pis v 1 for pistachio.

Table 1.
Demographic details of the study population in terms of frequency and percentage.
Due to limited OFC sample sizes—60 for hazelnut, 30 for peanut, 15 for walnut, 8 for almond, and 4 for pistachio reliable regression models could be fitted only for hazelnut and peanut. Given the relatively small number of observations compared with the number of predictors (6 for hazelnut and 5 for peanut), Firth’s bias-reduced logistic regression was used instead of standard logistic regression to obtain more reliable coefficient estimates, confidence intervals, and p-values, and to reduce small-sample bias.
3. Results
In the first phase of descriptive analysis, the demographic characteristics of the sample are summarized in Table 1. Table 1 also reports the number of tests performed per child and the total number of OFCs conducted for each of the five allergens considered: hazelnut, peanut, walnut, almond, and pistachio. Descriptive statistics for binary variables indicating the presence or absence of specific symptoms are presented in Table 2.
Table 2.
Frequencies of symptoms among the enrolled patients.
For each allergen, the subgroup of children who underwent the corresponding OFC was identified and divided into two groups: those who passed the test (OFC = 0) and those who failed (OFC = 1). Figure 1, Figure 2, Figure 3, Figure 4 and Figure 5 present boxplots of the wheal diameters for each allergen, comparing the two groups across both the SPTs and the PbP tests.
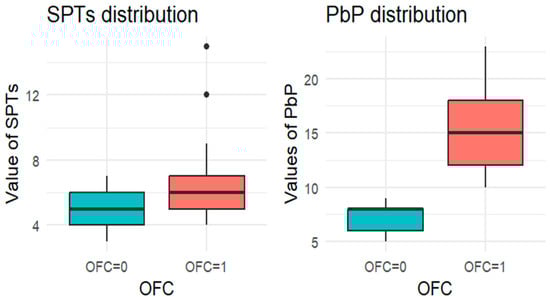
Figure 1.
BOXPLOT of the skin prick test (SPT) and prick-by-prick (PbP) test distribution in hazelnut. SPT: skin prick tests; PbP: prick by prick; OFC = 1 failure of tolerance; OFC= 0 acquisition of tolerance.
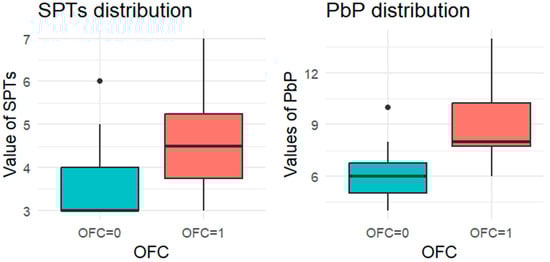
Figure 2.
BOXPLOT of the skin prick test (SPT) and prick-by-prick (PbP) test distribution in peanut. SPT: skin prick tests; PbP: prick by prick; OFC = 1 failure of tolerance; OFC= 0 acquisition of tolerance.
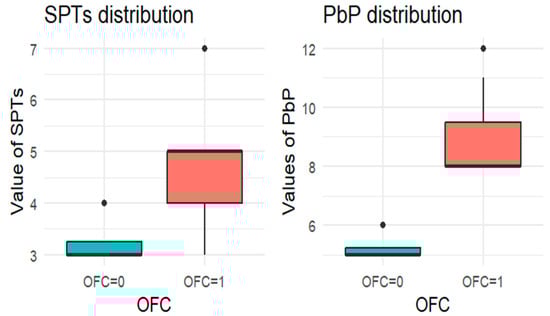
Figure 3.
BOXPLOT of the skin prick test (SPT) and prick-by-prick (PbP) test distribution in walnut. SPT: skin prick tests; PbP: prick by prick; OFC = 1 failure of tolerance; OFC= 0 acquisition of tolerance.
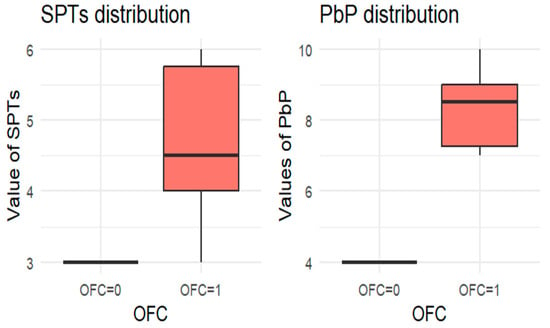
Figure 4.
BOXPLOT of the skin prick test (SPT) and prick-by-prick (PbP) test distribution in almond. SPT: skin prick tests; PbP: prick by prick; OFC = 1 failure of tolerance; OFC= 0 acquisition of tolerance.
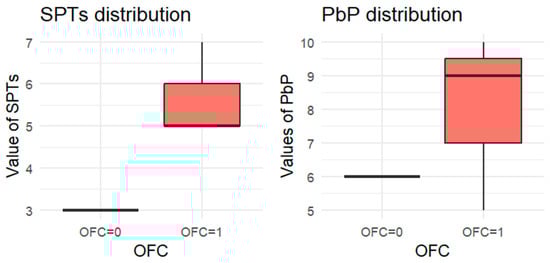
Figure 5.
BOXPLOT of the skin prick test (SPT) and prick-by-prick (PbP) test distribution in pistachio. SPT: skin prick tests; PbP: prick by prick; OFC = 1 failure of tolerance; OFC= 0 acquisition of tolerance.
The two groups were not compared using an unpaired Student’s t-test for three main reasons: (1) the differences between groups are visually evident from the boxplots (Figure 1, Figure 2, Figure 3, Figure 4 and Figure 5); (2) the relationship between wheal size (from SPT and PbP) and OFC outcome is already well established and not the focus of this study; and (3) for almond, walnut, and pistachio, the sample size was too small to justify a hypothesis test.
In the following, we report the results of the second, inferential phase of the analysis, which are summarized in Table 3 and Table 4.
Table 3.
Logostic regression for hazelnut.
Table 4.
Logistic regression for peanut.
Table 3 summarizes the results of the bias-reduced logistic regression for hazelnut, reporting the estimated coefficients, standard errors, odds ratios (ORs), 95% confidence intervals, and p-values for the six predictors (Cor a 1, Cor a 8, Cor a 9, Cor a 14, Bet v 1, and Bet v 2). Of the 60 subjects who underwent the hazelnut OFC, one had missing values and was excluded from the regression analysis; therefore, 59 subjects were included, of whom 26 (44.1%) experienced OFC failure (OFC = 1) and 33 (55.9%) successfully completed the OFC (OFC = 0). Cor a 9 and Cor a 14 emerged as the most relevant predictors (both p < 0.01), with positive regression coefficients indicating that higher sIgE levels are associated with an increased probability of OFC failure. Cor a 8 was also significantly associated with the outcome (p < 0.05), whereas Bet v 2 showed a borderline association and may contribute to risk stratification despite not reaching conventional statistical significance. The ROC curve shown in Figure 6 yielded an AUC of 0.949, indicating a high discriminative ability of the model in this dataset. However, given the limited sample size relative to the number of predictors, these results should be interpreted with caution, as model performance may be overestimated and requires validation in independent cohorts.
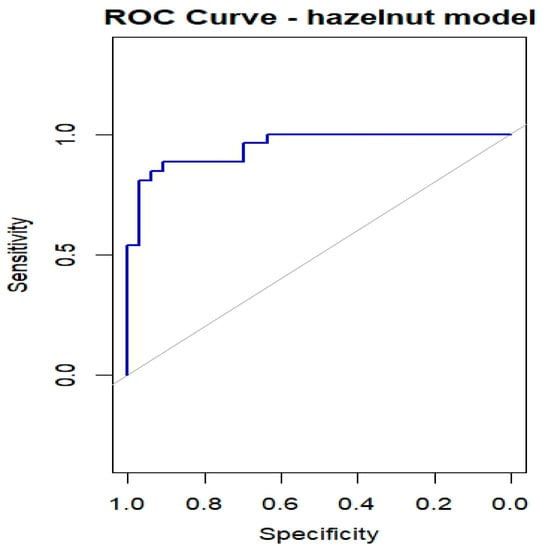
Figure 6.
ROC curves for OFC outcome in children with Hazelnut allergy.
Table 4 summarizes the results of the bias-reduced logistic regression for peanut, reporting the estimated coefficients, standard errors, odds ratios (ORs), 95% confidence intervals, and p-values for the five predictors (Ara h 1, Ara h 2, Ara h 3, Ara h 8, and Ara h 9). Among the 30 patients who underwent a peanut OFC, 16 (53%) experienced OFC failure (OFC = 1) and 14 (47%) successfully tolerated the challenge (OFC = 0). Ara h 9 emerged as the only statistically significant predictor, with a positive coefficient indicating that higher sIgE levels are associated with an increased likelihood of OFC failure. In this small dataset, the near-complete separation induced by Ara h 9 resulted in an apparent perfect in-sample discrimination (AUC = 1), with the ROC curve lying entirely at the upper boundary. This reflects the strong discriminatory ability of Ara h 9 in this cohort but also highlights the impact of the limited sample size and potential overfitting; therefore, these results should be interpreted with caution and validated in independent populations.
4. Discussion
Precision medicine is increasingly important in diagnosing and managing FA. CRD complement clinical assessment by identifying co- or cross-sensitizations, improving diagnostic accuracy, and informing patient management, particularly for predicting severe reactions during OFCs [49].
Although OFC remains the gold standard for FA diagnosis [11], it is time-consuming, costly, and carries a risk of severe reactions. Identifying CRD biomarkers predictive of OFC outcomes is therefore crucial. In this study, we identified specific biomarkers for hazelnut and peanut allergies that were associated with increased OFC failure. In contrast, small sample sizes for walnuts, almonds, and pistachios limited the identification of reliable biomarkers for these nuts.
4.1. Hazelnut
Our study confirms, in agreement with the existing literature, that Cor a 9 and Cor a 14 are the strongest predictors of a positive OFC outcome in children with hazelnut allergy, with Cor a 8 also emerging as a significant predictor. Children sensitized to these components are unlikely to pass the OFC. Among cross-reactive molecules, Bet v 2 showed a trend toward statistical significance and may support clinical decision-making when considered in combination with other relevant hazelnut proteins [40].
To date, only a limited number of pediatric studies have investigated the molecular profiles of children who fail OFCs to hazelnut. Overall, the available evidence consistently highlights the central role of storage proteins, particularly Cor a 14 and Cor a 9, in predicting clinically relevant hazelnut allergy in children.
The multicenter European study conducted by Datema et al. has shown that sensitization to Cor a 9 and Cor a 14 is positively associated with severe allergic reactions during double-blind, placebo-controlled food challenges, whereas Cor a 1 is generally linked to milder or absent reactions. Diagnostic models combining CRD with clinical symptoms outperform CRD alone, particularly in identifying children at low risk of severe reactions [50].
Other pediatric cohorts have confirmed Cor a 14 as the most reliable diagnostic marker, with defined IgE cutoff values accurately identifying the majority of hazelnut-allergic children and helping to predict OFC outcomes. Cor a 9 also contributes significantly, particularly in children who fail OFCs, whereas Cor a 1 and Cor a 8 show little discriminatory value. The relevance of Cor a 14 remains consistent even in the presence of a coexisting peanut allergy or sensitization to cross-reactive pollens, without interfering with challenge results [51].
Smaller studies have additionally suggested a potential role for Cor a 11 in determining reaction severity, although its relevance appears to be cohort-specific [46].
Moreover, geographical differences have emerged, with studies in Japanese children emphasizing the predictive value of high Cor a 9 and low Cor a 1 levels [52], whereas research from the Eastern Mediterranean region reinforces Cor a 14 as the key biomarker distinguishing reactive from tolerant children [53].
Cutoff values for Cor a 9 and Cor a 14 have demonstrated high specificity for severe hazelnut allergy, particularly in pediatric populations [54].
Systematic review encompassing multiple pediatric studies have confirmed that low levels of Cor a 14 and/or Cor a 9 are associated with tolerance, whereas high levels indicate a persistent and potentially severe allergy. Overall, Cor a 14 stands out as the most sensitive and specific biomarker for pediatric hazelnut allergy, clearly outperforming other hazelnut components and cross-reactive allergens in diagnostic accuracy [55].
4.2. Peanut
In our study, sensitization to Ara h 9 was directly associated with increasing blood sIgE levels and a higher probability of failing a peanut OFC.
Several large pediatric studies in the literature have emphasized the predominant role of Ara h 2 and Ara h 6 in predicting peanut OFC failure and reaction severity. These studies consistently identify Ara h 2, often in combination with Ara h 6, as the most accurate biomarker for peanut allergy and for reducing the need for OFCs. In these cohorts, Ara h 9 has generally shown limited predictive value for OFC outcomes, despite being present in a substantial proportion of allergic children [56]. Additional investigations have demonstrated that Ara h 2 levels correlate with OFC positivity but not necessarily with reaction severity, reinforcing the continued usefulness of OFCs in assessing tolerance [57]. Advanced diagnostic approaches, including basophil activation tests (BAT) combined with CRD, have further improved predictive accuracy, particularly when evaluating reactivity to Ara h 2 and Ara h 6 [58]. However, sensitization patterns vary significantly across populations and geographic regions. Several Italian studies have shown that Ara h 9 is the dominant peanut allergen in Italy, particularly in central and southern regions, and that its prevalence increases with age. In contrast, storage proteins such as Ara h 2 are more commonly detected in younger children and in northern Italy. Because our study population was recruited in Rome, largely representing central and southern Italy, the prominent role of Ara h 9 observed in our cohort is consistent with these regional sensitization patterns [25]. Therefore, in our pediatric cohort of children living in central and southern Italy, the prevalence of Ara h 9 is higher than that of Ara h 2.
The Italian study conducted by Calamelli et al. also supports these findings. In a sample of 48 children and adolescents with peanut-specific IgE, 58% were sensitized to Ara h 9, while 27% were sensitized to Ara h 2. Among younger children (2–5 years), seed storage proteins (such as Ara h 2) were more prevalent; however, with increasing age, Ara h 9 became dominant [59]. In conclusion, while Ara h 2 remains a key peanut allergen and a robust predictor of OFC failure in many international pediatric cohorts, it is not necessarily the most prevalent sensitizing component in the Italian population. In this context, Ara h 9 appears to play a pivotal role, particularly among adolescents and adults and in central and southern Italy, underscoring the importance of considering geographic and population-specific differences when interpreting component-resolved diagnostics.
4.3. Hazelnut and Peanut
Finally, few studies, including ours, have focused on children allergic to both peanuts and hazelnuts and who underwent OFC.
Among these studies, one was a prospective multicenter investigation conducted by Bayer et al. The authors performed oral challenges with hazelnut 143 children, as well as 210 with peanut. The values of Cor a 14 and Ara h 2, with an area under the curve of 0.89 and 0.92, respectively, discriminated allergic children from tolerant ones, more accurately than sIgE. Therefore, Cor a 14 and Ara h 2 appear to be useful biomarkers in clinical practice for estimating the probability of a positive OFC and for reducing unnecessary OFC [60].
Another multicenter study conducted by Grabenhenrich L. et al. among children with peanut or hazelnut allergy undergoing OFC evaluated whether the ratio of component-specific IgE to total IgE improved the prediction of challenge outcome. Specific IgE levels for peanuts, hazelnuts, and their components (Ara h 1, Ara h 2, Ara h 3, Ara h 8, Cor a 1, Cor a 8, Cor a 9, and Cor a 14) as well as total IgE were measured using ImmunoCAP. Specific IgE-to-total IgE ratios were compared with individual sIgE levels for discrimination and prediction of OFC.
The authors concluded that the ratios (component-specific IgE/total IgE) were no better than single-component specific IgE measures, and that the most useful sIgEs remained Ara h 2 and Cor a 14 [61].
4.4. Strengths and Weaknesses
To the best of our knowledge, this study is the first in Italy to analyze pediatric populations allergic to both hazelnuts and peanuts for molecular biomarkers predictive of OFC outcomes. While CRD shows promising predictive performance, it cannot fully replace OFCs, which remain essential. Limitations of this study include geographic variability, cross-reactivity (e.g., Bet v 1 with Cor a 1), and a lack of universally applicable cut-off values. These factors highlight the need for individualized interpretation of CRD in the context of clinical history and skin test results. Lastly, another limitation of the study is the small sample size. Therefore, larger studies are needed for external validation in independent cohorts and to confirm and extend our findings, particularly for pistachios, almonds, and walnuts.
5. Conclusions
Notably, in our cohort of Italian patients allergic to both hazelnuts and peanuts, we observed a predominant pattern of sensitization to storage proteins. Although this is the only study of this kind in Italy, it remains among the very few conducted in Europe on a pediatric population allergic to both hazelnuts and peanuts to identify a biomarker that could predict the outcome of an OFC. For hazelnut, we found a statistically significant association between high values of storage proteins Cor a 9, Cor a 14, and Cor a 8 and OFC failure. For peanuts, high Ara h 9 values were associated with a higher likelihood of failure to achieve tolerance. No conclusions could be drawn for walnut, pistachio, and almond, given the small number of patients involved.
Although several studies support the use of molecular components (such as Ara h 9, Ara h 2 and Cor a 14, Cor a 9, or Cor a 8) as useful predictors of OFC outcomes in children, it is essential to underline that these markers can help stratify risk, guide decisions about whether or not to perform an OFC, and potentially reduce the number of challenges required, but they do not entirely replace the need of OFC in all cases, particularly when confirmation of allergy or assessment of its severity is needed.
The future of pediatric allergy research should focus on longitudinal biomarker studies that integrate CRD into guidelines alongside OFC, which remains the gold standard. In the near future, testing multicomponent diagnostic algorithms in larger pediatric populations will be essential to improve risk stratification and clinical decision-making.
Author Contributions
Conceptualization, G.B. and C.A.; methodology, G.B., A.G. (Alessandro Gravina), F.M., F.O., L.C. and A.S. (Antonio Semeraro); software, D.D.C.; validation, C.A. and A.M.Z.; formal analysis, D.D.C.; investigation, M.M.; data curation, C.A.; writing—original draft preparation, G.B.; writing—review and editing, G.B., C.A., A.G. (Alessandro Gravina), F.M., A.G. (Alessandra Gori), D.D.C., L.C. and A.S. (Antonio Semeraro); visualization, A.S. (Alberto Spalice), M.G.P. and A.M.Z.; and supervision, C.A. All authors have read and agreed to the published version of the manuscript.
Funding
This research received no external funding.
Institutional Review Board Statement
The study was conducted in accordance with the Declaration of Helsinki, and approved by the Ethics Committee of POLICLINICO UMBERTO PRIMO, ROMA protocol code 0439/2023 on 19 April 2023.
Informed Consent Statement
Informed consent was obtained from all subjects involved in the study.
Data Availability Statement
The raw data supporting the conclusions of this article will be made available by the authors on request.
Conflicts of Interest
The authors declare no conflicts of interest.
References
- Sampson, H.A.; Aceves, S.; Bock, S.A.; James, J.; Jones, S.; Lang, D.; Nadeau, K.; Nowak-Wegrzyn, A.; Oppenheimer, J.; Perry, T.T.; et al. Food Allergy: A Practice Parameter Update—2014. J. Allergy Clin. Immunol. 2014, 134, 1016–1025.e43. [Google Scholar] [CrossRef]
- NIAID-Sponsored Expert Panel; Boyce, J.A.; Assa’ad, A.; Burks, A.W.; Jones, S.M.; Sampson, H.A.; Wood, R.A.; Plaut, M.; Cooper, S.F.; Fenton, M.J.; et al. Guidelines for the Diagnosis and Management of Food Allergy in the United States: Report of the NIAID-Sponsored Expert Panel. J. Allergy Clin. Immunol. 2010, 126, S1–S58. [Google Scholar] [CrossRef]
- Falus, A.; Merétey, K. Histamine: An Early Messenger in Inflammatory and Immune Reactions. Immunol. Today 1992, 13, 154–156. [Google Scholar] [CrossRef] [PubMed]
- Meyer, R.; Vandenplas, Y.; Lozinsky, A.C.; Vieira, M.C.; Canani, R.B.; Dupont, C.; Uysal, P.; Cavkaytar, O.; Knibb, R.; Fleischer, D.M.; et al. Diagnosis and Management of Food Allergy-Associated Gastroesophageal Reflux Disease in Young Children-EAACI Position Paper. Pediatr. Allergy Immunol. 2022, 33, e13856. [Google Scholar] [CrossRef] [PubMed]
- Santos, A.F.; Riggioni, C.; Agache, I.; Akdis, C.A.; Akdis, M.; Alvarez-Perea, A.; Alvaro-Lozano, M.; Ballmer-Weber, B.; Barni, S.; Beyer, K.; et al. EAACI Guidelines on the Diagnosis of IgE-Mediated Food Allergy. Allergy 2023, 78, 3057–3076. [Google Scholar] [CrossRef] [PubMed]
- Anvari, S.; Miller, J.; Yeh, C.-Y.; Davis, C.M. IgE-Mediated Food Allergy. Clin. Rev. Allergy Immunol. 2019, 57, 244–260. [Google Scholar] [CrossRef]
- Uriarte, S.A.; Sastre, J. Subcutaneous Immunotherapy with High-Dose Cat and Dog Extracts: A Real-Life Study. J. Investig. Allergol. Clin. Immunol. 2020, 30, 169–174. [Google Scholar] [CrossRef]
- Heinzerling, L.; Mari, A.; Bergmann, K.-C.; Bresciani, M.; Burbach, G.; Darsow, U.; Durham, S.; Fokkens, W.; Gjomarkaj, M.; Haahtela, T.; et al. The Skin Prick Test—European Standards. Clin. Transl. Allergy 2013, 3, 3. [Google Scholar] [CrossRef]
- Foong, R.-X.; Santos, A.F. Biomarkers of Diagnosis and Resolution of Food Allergy. Pediatr. Allergy Immunol. 2021, 32, 223–233. [Google Scholar] [CrossRef]
- Hamilton, R.G.; Williams, P.B. Specific IgE Testing Task Force of the American Academy of Allergy; Asthma & Immunology; American College of Allergy, Asthma and Immunology. Human IgE Antibody Serology: A Primer for the Practicing North American Allergist/Immunologist. J. Allergy Clin. Immunol. 2010, 126, 33–38. [Google Scholar] [CrossRef]
- Cela, L.; Gravina, A.; Semeraro, A.; Pastore, F.; Morelli, R.; Marchetti, L.; Brindisi, G.; Olivero, F.; Piccioni, M.G.; Zicari, A.M.; et al. Oral Food Challenge in Children with Tree Nut and Peanut Allergy: The Predictive Value of Diagnostic Tests. Diagnostics 2024, 14, 2069. [Google Scholar] [CrossRef] [PubMed]
- Calvani, M.; Bianchi, A.; Reginelli, C.; Peresso, M.; Testa, A. Oral Food Challenge. Medicina 2019, 55, 651. [Google Scholar] [CrossRef] [PubMed]
- Foong, R.-X.; Dantzer, J.A.; Wood, R.A.; Santos, A.F. Improving Diagnostic Accuracy in Food Allergy. J. Allergy Clin. Immunol. Pract. 2021, 9, 71–80. [Google Scholar] [CrossRef] [PubMed]
- Celik-Bilgili, S.; Mehl, A.; Verstege, A.; Staden, U.; Nocon, M.; Beyer, K.; Niggemann, B. The Predictive Value of Specific Immunoglobulin E Levels in Serum for the Outcome of Oral Food Challenges. Clin. Exp. Allergy 2005, 35, 268–273. [Google Scholar] [CrossRef]
- Sicherer, S.H.; Muñoz-Furlong, A.; Sampson, H.A. Prevalence of Peanut and Tree Nut Allergy in the United States Determined by Means of a Random Digit Dial Telephone Survey: A 5-Year Follow-up Study. J. Allergy Clin. Immunol. 2003, 112, 1203–1207. [Google Scholar] [CrossRef]
- Kagan, R.S.; Joseph, L.; Dufresne, C.; Gray-Donald, K.; Turnbull, E.; Pierre, Y.S.; Clarke, A.E. Prevalence of Peanut Allergy in Primary-School Children in Montreal, Canada. J. Allergy Clin. Immunol. 2003, 112, 1223–1228. [Google Scholar] [CrossRef]
- Grundy, J.; Matthews, S.; Bateman, B.; Dean, T.; Arshad, S.H. Rising Prevalence of Allergy to Peanut in Children: Data from 2 Sequential Cohorts. J. Allergy Clin. Immunol. 2002, 110, 784–789. [Google Scholar] [CrossRef]
- Kljakovic, M.; Gatenby, P.; Hawkins, C.; Attewell, R.G.; Ciszek, K.; Kratochvil, G.; Moreira, A.; Ponsonby, A.-L. The Parent-Reported Prevalence and Management of Peanut and Nut Allergy in School Children in the Australian Capital Territory. J. Paediatr. Child. Health 2009, 45, 98–103. [Google Scholar] [CrossRef]
- Sicherer, S.H.; Muñoz-Furlong, A.; Godbold, J.H.; Sampson, H.A. US Prevalence of Self-Reported Peanut, Tree Nut, and Sesame Allergy: 11-Year Follow-Up. J. Allergy Clin. Immunol. 2010, 125, 1322–1326. [Google Scholar] [CrossRef]
- Cela, L.; Brindisi, G.; Gravina, A.; Pastore, F.; Semeraro, A.; Bringheli, I.; Marchetti, L.; Morelli, R.; Cinicola, B.; Capponi, M.; et al. Molecular Mechanism and Clinical Effects of Probiotics in the Management of Cow’s Milk Protein Allergy. Int. J. Mol. Sci. 2023, 24, 9781. [Google Scholar] [CrossRef]
- Camus-Ela, M.; Wang, Y.; Rennie, G.H.; Raghavan, V.; Wang, J. Update on Hazelnut Allergy: Allergen Characterization, Epidemiology, Food Processing Technique and Detecting Strategy. Compr. Rev. Food Sci. Food Saf. 2025, 24, e70098. [Google Scholar] [CrossRef]
- McWilliam, V.; Koplin, J.; Lodge, C.; Tang, M.; Dharmage, S.; Allen, K. The Prevalence of Tree Nut Allergy: A Systematic Review. Curr. Allergy Asthma Rep. 2015, 15, 54. [Google Scholar] [CrossRef] [PubMed]
- Spolidoro, G.C.I.; Ali, M.M.; Amera, Y.T.; Nyassi, S.; Lisik, D.; Ioannidou, A.; Rovner, G.; Khaleva, E.; Venter, C.; van Ree, R.; et al. Prevalence Estimates of Eight Big Food Allergies in Europe: Updated Systematic Review and Meta-Analysis. Allergy 2023, 78, 2361–2417. [Google Scholar] [CrossRef] [PubMed]
- Nwaru, B.I.; Hickstein, L.; Panesar, S.S.; Roberts, G.; Muraro, A.; Sheikh, A. EAACI Food Allergy and Anaphylaxis Guidelines Group. Prevalence of Common Food Allergies in Europe: A Systematic Review and Meta-Analysis. Allergy 2014, 69, 992–1007. [Google Scholar] [CrossRef] [PubMed]
- Asero, R.; Nucera, E.; Rizzi, A.; Aruanno, A.; Uasuf, C.G.; Manzotti, G.; Villalta, D.; Conte, M.; Pastorello, E.A.; Losappio, L.; et al. Peanut Allergy in Italy: A Unique Italian Perspective. J. Allergy Clin. Immunol. Glob. 2022, 1, 61–66. [Google Scholar] [CrossRef]
- Tagliati, S.; Barni, S.; Giovannini, M.; Liccioli, G.; Sarti, L.; Alicandro, T.; Paladini, E.; Perferi, G.; Azzari, C.; Novembre, E.; et al. Nut Allergy: Clinical and Allergological Features in Italian Children. Nutrients 2021, 13, 4076. [Google Scholar] [CrossRef]
- McWilliam, V.L.; Perrett, K.P.; Dang, T.; Peters, R.L. Prevalence and Natural History of Tree Nut Allergy. Ann. Allergy Asthma Immunol. 2020, 124, 466–472. [Google Scholar] [CrossRef]
- Fleischer, D.M.; Conover-Walker, M.K.; Matsui, E.C.; Wood, R.A. The Natural History of Tree Nut Allergy. J. Allergy Clin. Immunol. 2005, 116, 1087–1093. [Google Scholar] [CrossRef]
- Lyons, S.A.; Welsing, P.M.J.; Hakobyan, M.; Kansen, H.M.; Knol, E.F.; Otten, H.G.; van Ree, R.; Knulst, A.C.; Le, T.-M. Measurement of IgE to Hazelnut Allergen Components Cannot Replace Hazelnut Challenge in Dutch Adults. Allergy 2022, 77, 1559–1569. [Google Scholar] [CrossRef]
- Nilsson, C.; Berthold, M.; Mascialino, B.; Orme, M.; Sjölander, S.; Hamilton, R. Allergen Components in Diagnosing Childhood Hazelnut Allergy: Systematic Literature Review and Meta-Analysis. Pediatr. Allergy Immunol. 2020, 31, 186–196. [Google Scholar] [CrossRef]
- van Erp, F.C.; Klemans, R.J.B.; Meijer, Y.; van der Ent, C.K.; Knulst, A.C. Using Component-Resolved Diagnostics in the Management of Peanut-Allergic Patients. Curr. Treat. Options Allergy 2016, 3, 169–180. [Google Scholar] [CrossRef] [PubMed]
- Mondoulet, L.; Paty, E.; Drumare, M.F.; Ah-Leung, S.; Scheinmann, P.; Willemot, R.M.; Wal, J.M.; Bernard, H. Influence of Thermal Processing on the Allergenicity of Peanut Proteins. J. Agric. Food Chem. 2005, 53, 4547–4553. [Google Scholar] [CrossRef] [PubMed]
- Lee, J.; Jeong, K.; Jeon, S.-A.; Lee, S. Component Resolved Diagnosis of Walnut Allergy in Young Children: Jug r 1 as a Major Walnut Allergen. Asian Pac. J. Allergy Immunol. 2021, 39, 190–196. [Google Scholar] [CrossRef] [PubMed]
- Mew, R.; Borres, M.; Sjölander, S.; du Toit, G. A Retrospect Study into the Utility of Allergen Components in Walnut Allergy. Pediatr. Allergy Immunol. 2016, 27, 750–752. [Google Scholar] [CrossRef] [PubMed]
- Ciprandi, G.; Pistorio, A.; Silvestri, M.; Rossi, G.A.; Tosca, M.A. Walnut Anaphylaxis: The Usefulness of Molecular-Based Allergy Diagnostics. Immunol. Lett. 2014, 161, 138–139. [Google Scholar] [CrossRef]
- Costa, J.; Carrapatoso, I.; Oliveira, M.B.P.P.; Mafra, I. Walnut Allergens: Molecular Characterization, Detection and Clinical Relevance. Clin. Exp. Allergy 2014, 44, 319–341. [Google Scholar] [CrossRef]
- Zhang, Y.; Jin, T. Almond Allergens: Update and Perspective on Identification and Characterization. J. Sci. Food Agric. 2020, 100, 4657–4663. [Google Scholar] [CrossRef]
- Ahn, K.; Bardina, L.; Grishina, G.; Beyer, K.; Sampson, H.A. Identification of Two Pistachio Allergens, Pis v 1 and Pis v 2, Belonging to the 2S Albumin and 11S Globulin Family. Clin. Exp. Allergy 2009, 39, 926–934. [Google Scholar] [CrossRef]
- Datema, M.R.; Zuidmeer-Jongejan, L.; Asero, R.; Barreales, L.; Belohlavkova, S.; de Blay, F.; Bures, P.; Clausen, M.; Dubakiene, R.; Gislason, D.; et al. Hazelnut Allergy across Europe Dissected Molecularly: A EuroPrevall Outpatient Clinic Survey. J. Allergy Clin. Immunol. 2015, 136, 382–391. [Google Scholar] [CrossRef]
- Tuano, K.S.; Davis, C.M. Utility of Component-Resolved Diagnostics in Food Allergy. Curr. Allergy Asthma Rep. 2015, 15, 32. [Google Scholar] [CrossRef]
- Muraro, A.; Werfel, T.; Hoffmann-Sommergruber, K.; Roberts, G.; Beyer, K.; Bindslev-Jensen, C.; Cardona, V.; Dubois, A.; duToit, G.; Eigenmann, P.; et al. EAACI Food Allergy and Anaphylaxis Guidelines: Diagnosis and Management of Food Allergy. Allergy 2014, 69, 1008–1025. [Google Scholar] [CrossRef] [PubMed]
- Sampson, H.A.; Arasi, S.; Bahnson, H.T.; Ballmer-Weber, B.; Beyer, K.; Bindslev-Jensen, C.; Bird, J.A.; Blumchen, K.; Davis, C.; Ebisawa, M.; et al. AAAAI-EAACI PRACTALL: Standardizing Oral Food Challenges—2024 Update. Pediatr. Allergy Immunol. 2024, 35, e14276. [Google Scholar] [CrossRef] [PubMed]
- Pastorello, E.A.; Scibilia, J.; Rossi, C.M.; Toscano, A.; Losappio, L.M.; Nichelatti, M.; Aversano, M.G.; Farioli, L. The Severity and Frequency of Systemic Reactions to Hazelnut Are Significantly Higher in Hazelnut Allergic Patients Monosensitized to Cor a 8 than in Patients Polysensitized to Cor a 1, Cor a 8, and Cor a 9. Int. Arch. Allergy Immunol. 2024, 185, 237–246. [Google Scholar] [CrossRef] [PubMed]
- Sekerková, A.; Poláčková, M. Detection of Bet v1, Bet v2 and Bet v4 Specific IgE Antibodies in the Sera of Children and Adult Patients Allergic to Birch Pollen: Evaluation of Different IgE Reactivity Profiles Depending on Age and Local Sensitization. Int. Arch. Allergy Immunol. 2011, 154, 278–285. [Google Scholar] [CrossRef]
- Ballmer-Weber, B.K.; Beyer, K. Food Challenges. J. Allergy Clin. Immunol. 2018, 141, 69–71.e2. [Google Scholar] [CrossRef]
- Valbuena, T.; Reche, M.; Marco, G.; Toboso, I.; Ringauf, A.; Thuissard-Vasallo, I.J.; Lozano-Ojalvo, D.; Martínez-Blanco, M.; Molina, E. Storage Proteins Are Driving Pediatric Hazelnut Allergy in a Lipid Transfer Protein-Rich Area. Foods 2021, 10, 2463. [Google Scholar] [CrossRef]
- Bird, J.A.; Leonard, S.; Groetch, M.; Assa’ad, A.; Cianferoni, A.; Clark, A.; Crain, M.; Fausnight, T.; Fleischer, D.; Green, T.; et al. Conducting an Oral Food Challenge: An Update to the 2009 Adverse Reactions to Foods Committee Work Group Report. J. Allergy Clin. Immunol. Pract. 2020, 8, 75–90.e17. [Google Scholar] [CrossRef]
- Valero, C.B.; Monzón, Á.C.; Menchón, N.M.; Martorell, A.; Aragonés, L.; Magán, C.G.; Fernández, S.P.; Fernández, C.P.; Gibert, M.P.; Del Prado, A.P.; et al. Practical Protocol of the Food Allergy Committee of the Seicap on Open Oral Food Challenges to Nuts. Allergol. Immunopathol. 2021, 49, 56–59. [Google Scholar] [CrossRef]
- Sato, S.; Ebisawa, M. Precision Allergy Molecular Diagnosis Applications in Food Allergy. Curr. Opin. Allergy Clin. Immunol. 2024, 24, 129–137. [Google Scholar] [CrossRef]
- Datema, M.R.; van Ree, R.; Asero, R.; Barreales, L.; Belohlavkova, S.; de Blay, F.; Clausen, M.; Dubakiene, R.; Fernández-Perez, C.; Fritsche, P.; et al. Component-Resolved Diagnosis and beyond: Multivariable Regression Models to Predict Severity of Hazelnut Allergy. Allergy 2018, 73, 549–559. [Google Scholar] [CrossRef]
- Eller, E.; Mortz, C.G.; Bindslev-Jensen, C. Cor a 14 Is the Superior Serological Marker for Hazelnut Allergy in Children, Independent of Concomitant Peanut Allergy. Allergy 2016, 71, 556–562. [Google Scholar] [CrossRef] [PubMed]
- Inoue, Y.; Sato, S.; Takahashi, K.; Yanagida, N.; Yamamoto, H.; Shimizu, N.; Ebisawa, M. Component-Resolved Diagnostics Can Be Useful for Identifying Hazelnut Allergy in Japanese Children. Allergol. Int. 2020, 69, 239–245. [Google Scholar] [CrossRef] [PubMed]
- Buyuktiryaki, B.; Cavkaytar, O.; Sahiner, U.M.; Yilmaz, E.A.; Yavuz, S.T.; Soyer, O.; Sekerel, B.E.; Tuncer, A.; Sackesen, C. Cor a 14, Hazelnut-Specific IgE, and SPT as a Reliable Tool in Hazelnut Allergy Diagnosis in Eastern Mediterranean Children. J. Allergy Clin. Immunol. Pract. 2016, 4, 265–272.e3. [Google Scholar] [CrossRef] [PubMed]
- Masthoff, L.J.N.; Mattsson, L.; Zuidmeer-Jongejan, L.; Lidholm, J.; Andersson, K.; Akkerdaas, J.H.; Versteeg, S.A.; Garino, C.; Meijer, Y.; Kentie, P.; et al. Sensitization to Cor a 9 and Cor a 14 Is Highly Specific for a Hazelnut Allergy with Objective Symptoms in Dutch Children and Adults. J. Allergy Clin. Immunol. 2013, 132, 393–399. [Google Scholar] [CrossRef] [PubMed]
- Caffarelli, C.; Mastrorilli, C.; Santoro, A.; Criscione, M.; Procaccianti, M. Component-Resolved Diagnosis of Hazelnut Allergy in Children. Nutrients 2021, 13, 640. [Google Scholar] [CrossRef] [PubMed]
- Agabriel, C.; Ghazouani, O.; Birnbaum, J.; Liabeuf, V.; Porri, F.; Gouitaa, M.; Cleach, I.; Grob, J.-J.; Bongrand, P.; Sarles, J.; et al. Ara h 2 and Ara h 6 Sensitization Predicts Peanut Allergy in Mediterranean Pediatric Patients. Pediatr. Allergy Immunol. 2014, 25, 662–667. [Google Scholar] [CrossRef]
- Kaur, N.; Mehr, S.; Katelaris, C.; Wainstein, B.; Altavilla, B.; Saad, R.; Valerio, C.; Codarini, M.; Burton, P.; Perram, F.; et al. Added Diagnostic Value of Peanut Component Testing: A Cross-Sectional Study in Australian Children. J. Allergy Clin. Immunol. Pract. 2021, 9, 245–253.e4. [Google Scholar] [CrossRef]
- Ruinemans-Koerts, J.; Brouwer, M.L.; Schmidt-Hieltjes, Y.; Stevens, P.; Merkus, P.J.F.M.; Doggen, C.M.J.; Savelkoul, H.F.J.; van Setten, P.A. The Indirect Basophil Activation Test Is a Safe, Reliable, and Accessible Tool to Diagnose a Peanut Allergy in Children. J. Allergy Clin. Immunol. Pract. 2022, 10, 1305–1311.e3. [Google Scholar] [CrossRef]
- Calamelli, E.; Caffarelli, C.; Ricci, G. Peanut Sensitization Profiles in Italian Children and Adolescents with Specific IgE to Peanuts. BioMed Res. Int. 2013, 2013, 170452. [Google Scholar] [CrossRef]
- Beyer, K.; Grabenhenrich, L.; Härtl, M.; Beder, A.; Kalb, B.; Ziegert, M.; Finger, A.; Harandi, N.; Schlags, R.; Gappa, M.; et al. Predictive Values of Component-Specific IgE for the Outcome of Peanut and Hazelnut Food Challenges in Children. Allergy 2015, 70, 90–98. [Google Scholar] [CrossRef]
- Grabenhenrich, L.; Lange, L.; Härtl, M.; Kalb, B.; Ziegert, M.; Finger, A.; Harandi, N.; Schlags, R.; Gappa, M.; Puzzo, L.; et al. The Component-Specific to Total IgE Ratios Do Not Improve Peanut and Hazelnut Allergy Diagnoses. J. Allergy Clin. Immunol. 2016, 137, 1751–1760.e8. [Google Scholar] [CrossRef]


Disclaimer/Publisher’s Note: The statements, opinions and data contained in all publications are solely those of the individual author(s) and contributor(s) and not of MDPI and/or the editor(s). MDPI and/or the editor(s) disclaim responsibility for any injury to people or property resulting from any ideas, methods, instructions or products referred to in the content. |
© 2026 by the authors. Licensee MDPI, Basel, Switzerland. This article is an open access article distributed under the terms and conditions of the Creative Commons Attribution (CC BY) license.