Refining MASLD Phenotypes: Clinical, Metabolic, and Elastographic Differences Between Adipose Tissue Dysfunction and Obesity-Driven Disease
 , , , , , and
Abstract
1. Introduction
2. Materials and Methods
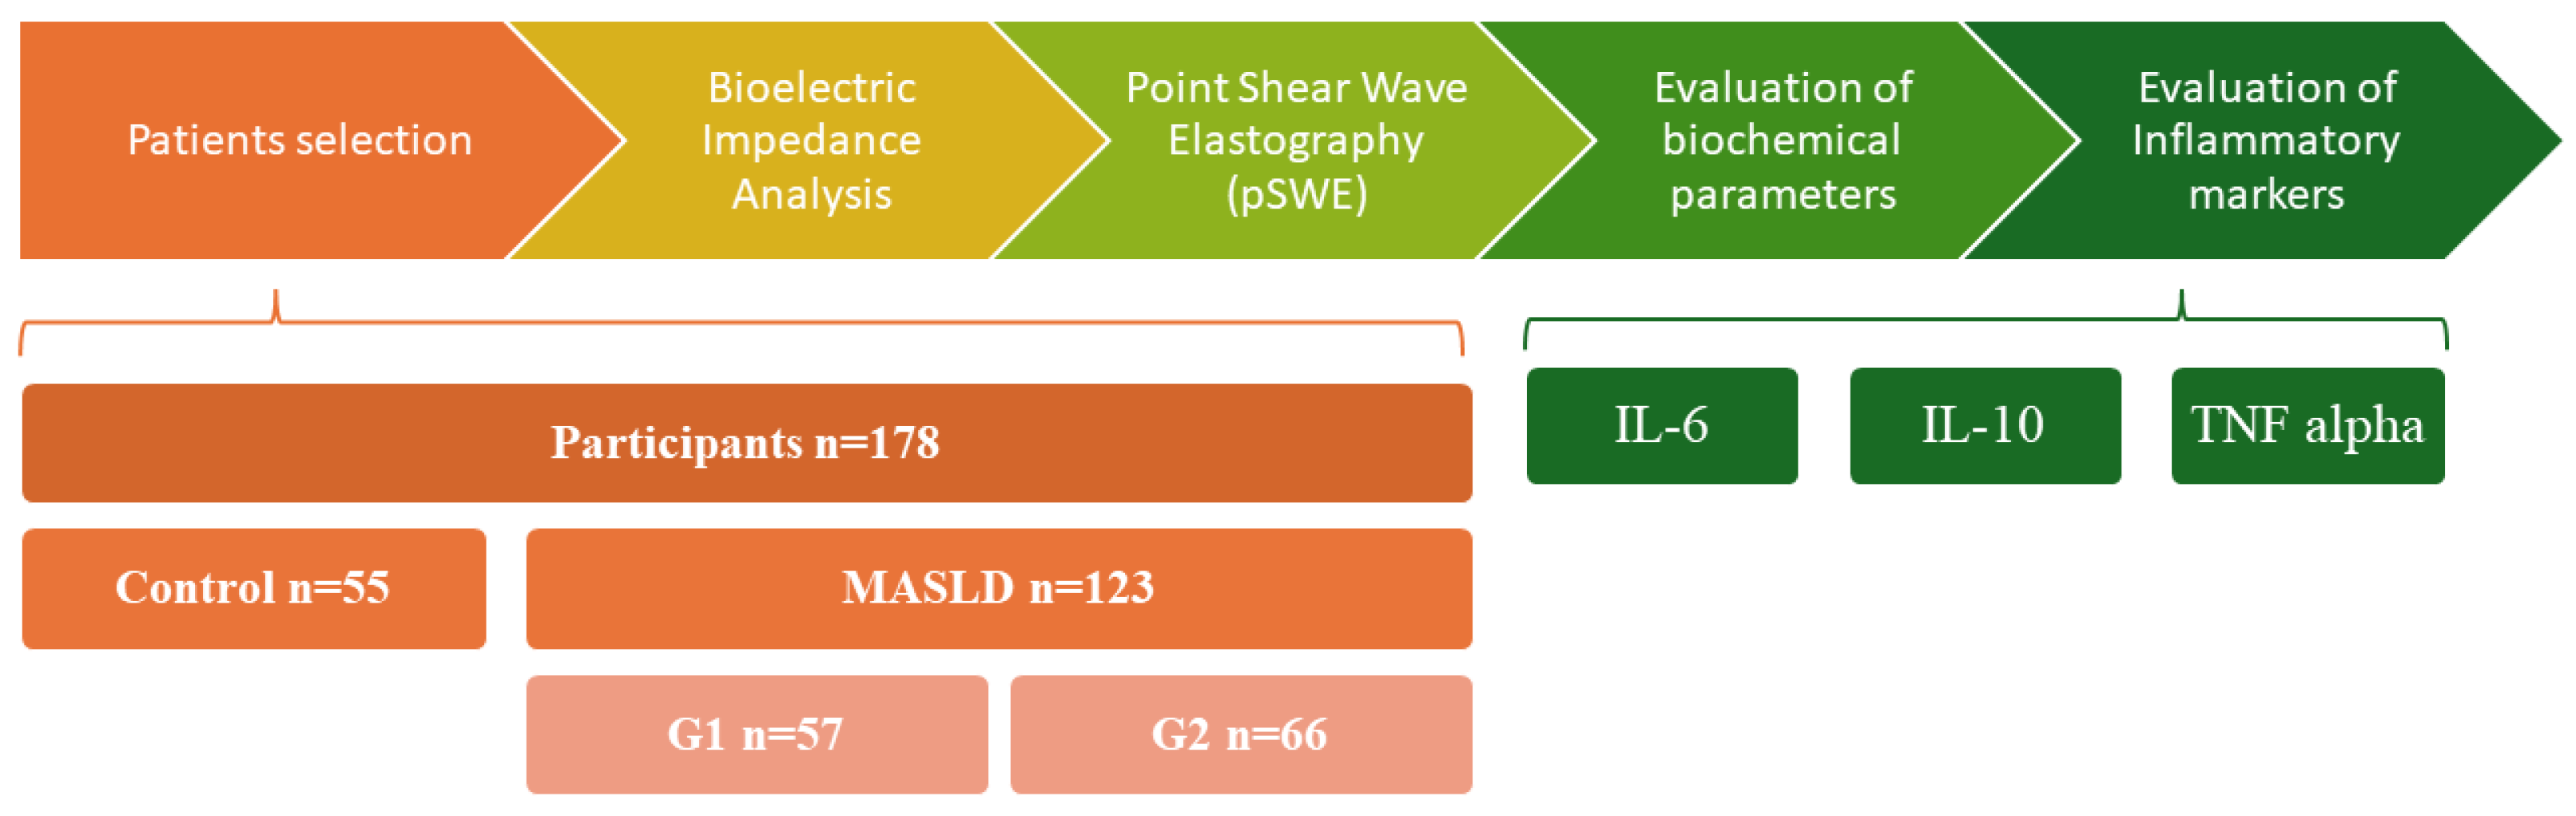
2.1. Study Design and Patient Inclusion Criteria
2.2. Clinical and Laboratory Assessment
2.3. Body Composition Analysis
2.4. Ultrasound and Liver Stiffness Assessment
2.5. Patient Stratification

| ATD Absent | Mild ATD | Moderate ATD | Severe ATD | |
|---|---|---|---|---|
| Age < 30 years | ≤2.52 | 2.53–2.58 | 2.59–2.73 | >2.73 |
| ≥30 < 42 years | ≤2.23 | 2.24–2.53 | 2.54–3.12 | >3.12 |
| ≥42 < 52 years | ≤1.92 | 1.93–2.16 | 2.17–2.77 | >2.77 |
| ≥52 < 66 years | ≤1.93 | 1.94–2.32 | 2.32–3.25 | >3.25 |
| ≥66 years | ≤2 | 2.01–2.41 | 2.42–3.17 | >3.17 |
2.6. Statistical Analysis
3. Results
3.1. MASLD vs. Non-MASLD: Clinical and Biochemical Profile
3.2. Comparison of MASLD Phenotypes
4. Discussion
5. Study Limitations and Future Perspectives
6. Conclusions
Author Contributions
Funding
Institutional Review Board Statement
Informed Consent Statement
Data Availability Statement
Conflicts of Interest
Abbreviations
| MASLD | Metabolic dysfunction-associated steatotic liver disease |
| ATD | Adipose Tissue Dysfunction |
| IL-6 | Interleukin 6 |
| IL-10 | Interleukin 10 |
| TNF-α | Tumor Necrosis Factor alpha |
| NAFLD | Non-Alcoholic Fatty Liver Disease |
| T2DM | Type 2 Diabetes Mellitus |
| MASH | Metabolic Dysfunction-Associated Steatohepatitis |
| MHO. | Metabolically Healthy Obesity |
| IL-1β | Interleukin 1-beta |
| HSC. | Hepatic Stellate Cell |
| sIL-6R | Soluble Interleukin-6 Receptor |
| sgp130 | Soluble glycoprotein 130 |
| SWE | Shear Wave Elastography |
| MRE | Magnetic Resonance Elastography |
| BMI | Body Mass Index |
| HbA1c | Glycated Hemoglobin |
| ELISA | Enzyme-linked immunosorbent assay |
| Cys-C | Cystatin C |
| EASL | European Association fot the Study of the Liver |
| IQR | Interquartile range |
| SBP | Systolic Blood Pressure |
| MPV | Mean Platelet Volume |
| NLR | Neutrophil-to-Lymphocyte Ratio |
| PLR | Platelet-to-Lymphocyte Ratio |
| HDL | High-Density Lipoprotein |
| LDL | Low-Density Lipoprotein |
| AST | Aspartate aminotransferase |
| ALT | Alanine aminotransferase |
| ALP | Alkaline Phosphatase |
| GGT | Gamma-glutamyl transferase |
| FIB-4 | Fibrosis 4 |
| APRI | Aspartate Aminotransferase to Platelet Ratio Index |
| FLI | Fatty Liver Index |
| HSI | Hepatic Steatosis Index |
| VAI | Visceral Adiposity Index |
| SNPs | Single-nucleotide polymorphisms |
| MRI | Magnetic Resonance Imaging |
| BARD | Body mass index, AST/ALT ratio, and Diabetes |
References
- Younossi, Z.M.; Zelber-Sagi, S.; Lazarus, J.V.; Wong, V.W.-S.; Yilmaz, Y.; Duseja, A.; Eguchi, Y.; Castera, L.; Pessoa, M.G.; Oliveira, C.P.; et al. Global Consensus Recommendations for Metabolic Dysfunction-Associated Steatotic Liver Disease and Steatohepatitis. Gastroenterology 2025, 169, 1017–1032.e2. [Google Scholar] [CrossRef]
- Reframing obesity and MASLD. Nat. Rev. Gastroenterol. Hepatol. 2025, 22, 147. [CrossRef]
- Ciardullo, S.; Vergani, M.; Perseghin, G. Nonalcoholic Fatty Liver Disease in Patients with Type 2 Diabetes: Screening, Diagnosis, and Treatment. J. Clin. Med. 2023, 12, 5597. [Google Scholar] [CrossRef]
- Michalopoulou, E.; Thymis, J.; Lampsas, S.; Pavlidis, G.; Katogiannis, K.; Vlachomitros, D.; Katsanaki, E.; Kostelli, G.; Pililis, S.; Pliouta, L.; et al. The Triad of Risk: Linking MASLD, Cardiovascular Disease and Type 2 Diabetes; From Pathophysiology to Treatment. J. Clin. Med. 2025, 14, 428. [Google Scholar] [CrossRef]
- Pais, R.; Maurel, T. Natural History of NAFLD. J. Clin. Med. 2021, 10, 1161. [Google Scholar] [CrossRef]
- Shi, G.-X.; Qian, Y.-S.; Jiang, C.-M.; Liu, Z.-Z.; Yang, X.; Xu, Y.-W.; Jin, S.-S.; Chu, J.-G.; Qian, G.-Q.; Yang, N.-B. Prevalence of steatotic liver disease (MASLD, MetALD, ALD) and clinically significant fibrosis in US adolescents. Sci. Rep. 2024, 14, 25724. [Google Scholar] [CrossRef] [PubMed]
- Buzzetti, E.; Pinzani, M.; Tsochatzis, E.A. The multiple-hit pathogenesis of non-alcoholic fatty liver disease (NAFLD). Metabolism 2016, 65, 1038–1048. [Google Scholar] [CrossRef]
- Younossi, Z.M.; Henry, L. Understanding the Burden of Nonalcoholic Fatty Liver Disease: Time for Action. Diabetes Spectr. 2024, 37, 9–19. [Google Scholar] [CrossRef] [PubMed]
- Koliaki, C.; Dalamaga, M.; Kakounis, K.; Liatis, S. Metabolically Healthy Obesity and Metabolic Dysfunction-Associated Steatotic Liver Disease (MASLD): Navigating the Controversies in Disease Development and Progression. Curr. Obes. Rep. 2025, 14, 46. [Google Scholar] [CrossRef] [PubMed]
- Brown, R.J.; Meehan, C.A.; Cochran, E.; Rother, K.I.; Kleiner, D.E.; Walter, M.; Gorden, P. Effects of Metreleptin in Pediatric Patients with Lipodystrophy. J. Clin. Endocrinol. Metab. 2017, 102, 1511–1519. [Google Scholar] [CrossRef]
- Iacobini, C.; Pugliese, G.; Blasetti Fantauzzi, C.; Federici, M.; Menini, S. Metabolically healthy versus metabolically unhealthy obesity. Metabolism 2019, 92, 51–60. [Google Scholar] [CrossRef] [PubMed]
- Syed-Abdul, M.M. Lipid Metabolism in Metabolic-Associated Steatotic Liver Disease (MASLD. Metabolites 2023, 14, 12. [Google Scholar] [CrossRef] [PubMed]
- Vorona, E.; Sorkina, E.; Trebicka, J. Progressive Metabolic Dysfunction-Associated Steatotic Liver Disease (MASLD) from a Young Age Due to a Rare Genetic Disorder, Familial Partial Lipodystrophy: A Case Report and Review of the Literature. Livers 2024, 4, 688–695. [Google Scholar] [CrossRef]
- Zhang, Z.; Wang, J.; Li, H.; Niu, Q.; Tao, Y.; Zhao, X.; Zeng, Z.; Dong, H. The role of the interleukin family in liver fibrosis. Front. Immunol. 2025, 16, 1497095. [Google Scholar] [CrossRef]
- Astarini, F.D.; Ratnasari, N.; Wasityastuti, W. Update on Non-Alcoholic Fatty Liver Disease-Associated Single Nucleotide Polymorphisms and Their Involvement in Liver Steatosis, Inflammation, and Fibrosis. Iran. Biomed. J. 2022, 26, 252–268. [Google Scholar] [CrossRef]
- Wang, M.-J.; Zhang, H.-L.; Chen, F.; Guo, X.-J.; Liu, Q.-G.; Hou, J. The double-edged effects of IL-6 in liver regeneration, aging, inflammation, and diseases. Exp. Hematol. Oncol. 2024, 13, 62. [Google Scholar] [CrossRef]
- Hou, X.; Yin, S.; Ren, R.; Liu, S.; Yong, L.; Liu, Y.; Li, Y.; Zheng, M.H.; Kunos, G.; Gao, B.; et al. Myeloid-Cell-Specific IL-6 Signaling Promotes MicroRNA-223-Enriched Exosome Production to Attenuate NAFLD-Associated Fibrosis. Hepatology 2021, 74, 116–132. [Google Scholar] [CrossRef]
- Duan, Y.; Pan, X.; Luo, J.; Xiao, X.; Li, J.; Bestman, P.L.; Luo, M. Association of Inflammatory Cytokines with Non-Alcoholic Fatty Liver Disease. Front. Immunol. 2022, 13, 880298. [Google Scholar] [CrossRef]
- Chhabra, S.; Singh, S.P.; Singh, A.; Mehta, V.; Kaur, A.; Bansal, N.; Sood, A. Diabetes Mellitus Increases the Risk of Significant Hepatic Fibrosis in Patients with Non-alcoholic Fatty Liver Disease. J. Clin. Exp. Hepatol. 2022, 12, 409–416. [Google Scholar] [CrossRef]
- Hernández, M.A.G.; Verschuren, L.; Caspers, M.P.; Morrison, M.C.; Venhorst, J.; Berg, J.T.v.D.; Coornaert, B.; Hanemaaijer, R.; van Westen, G.J.P. Identifying patient subgroups in MASLD and MASH-associated fibrosis: Molecular profiles and implications for drug development. Sci. Rep. 2024, 14, 23362. [Google Scholar] [CrossRef]
- Verschuren, L.; Mak, A.L.; van Koppen, A.; Özsezen, S.; Difrancesco, S.; Caspers, M.P.M.; Snabel, J.; van der Meer, D.; van Dijk, A.-M.; Rashu, E.B.; et al. Development of a novel non-invasive biomarker panel for hepatic fibrosis in MASLD. Nat. Commun. 2024, 15, 4564. [Google Scholar] [CrossRef]
- Amato, M.C.; Giordano, C.; Galia, M.; Criscimanna, A.; Vitabile, S.; Midiri, M.; Galluzzo, A.; AlkaMeSy Study Group. Visceral Adiposity Index: A reliable indicator of visceral fat function associated with cardiometabolic risk. Diabetes Care 2010, 33, 920–922. [Google Scholar] [CrossRef]
- Amato, M.C.; Giordano, C. Visceral adiposity index: An indicator of adipose tissue dysfunction. Int. J. Endocrinol. 2014, 2014, 730827. [Google Scholar] [CrossRef]
- Blüher, M. Metabolically Healthy Obesity. Endocr. Rev. 2020, 41, bnaa004. [Google Scholar] [CrossRef]
- Chen, Y.; Huang, Y.; Huang, R.; Chen, Z.; Wang, X.; Chen, F.; Huang, Y. Interleukin-10 gene intervention ameliorates liver fibrosis by enhancing the immune function of natural killer cells in liver tissue. Int. Immunopharmacol. 2023, 127, 111341. [Google Scholar] [CrossRef]
- Kroy, D.C.; Beraza, N.; Tschaharganeh, D.F.; Sander, L.E.; Erschfeld, S.; Giebeler, A.; Liedtke, C.; Wasmuth, H.E.; Trautwein, C.; Streetz, K.L. Lack of interleukin-6/glycoprotein 130/signal transducers and activators of transcription-3 signaling in hepatocytes predisposes to liver steatosis and injury in mice. Hepatology 2010, 51, 463–473. [Google Scholar] [CrossRef]
- de Abreu, J.D.M.F.; Azulay, R.S.; Rodrigues, V.; de Abreu, S.L.L.; Tavares, M.d.G.; Pinheiro, F.C.M.; Neto, C.P.d.O.; Andrade, C.; Facundo, A.; Sá, A.G.; et al. Predictors of Hepatic Fibrosis in Type 2 Diabetes Patients with Metabolic-Dysfunction-Associated Steatotic Liver Disease. Biomedicines 2024, 12, 2542. [Google Scholar] [CrossRef]
- Crişan, D.; Avram, L.; Morariu-Barb, A.; Grapa, C.; Hirişcau, I.; Crăciun, R.; Donca, V.; Nemeş, A. Sarcopenia in MASLD-Eat to Beat Steatosis, Move to Prove Strength. Nutrients 2025, 17, 178. [Google Scholar] [CrossRef] [PubMed]
- Zhang, F.; Liu, L.; Li, W. Correlation of sarcopenia with progression of liver fibrosis in patients with metabolic dysfunction-associated steatotic liver disease: A study from two cohorts in China and the United States. Nutr. J. 2025, 24, 6. [Google Scholar] [CrossRef] [PubMed]
- Wei, X.; Liu, X.; Zhao, J.; Zhang, Y.; Qiu, L.; Zhang, J. Association of sarcopenia and physical activity on the severity of metabolic dysfunction-associated steatotic liver disease among United States adults: NHANES 2017–2018. Front. Aging 2025, 6, 1573170. [Google Scholar] [CrossRef] [PubMed]
- Chen, M.; Cao, Y.; Ji, G.; Zhang, L. Lean nonalcoholic fatty liver disease and sarcopenia. Front. Endocrinol. 2023, 14, 1217249. [Google Scholar] [CrossRef]
- Zhang, X.; Zheng, M.H.; Liu, D.; Lin, Y.; Song, S.J.; Chu, E.S.; Liu, D.; Singh, S.; Berman, M.; Lau, H.C.; et al. A blood-based biomarker panel for non-invasive diagnosis of metabolic dysfunction-associated steatohepatitis. Cell Metab. 2025, 37, 59–68.e3. [Google Scholar] [CrossRef] [PubMed]
- Long, L.; Wu, Y.; Tang, H.; Xiao, Y.; Wang, M.; Shen, L.; Shi, Y.; Feng, S.; Li, C.; Lin, J.; et al. Development and validation of a scoring system to predict MASLD patients with significant hepatic fibrosis. Sci. Rep. 2025, 15, 9639. [Google Scholar] [CrossRef]
- Longo, M.; Meroni, M.; Paolini, E.; Erconi, V.; Carli, F.; Fortunato, F.; Ronchi, D.; Piciotti, R.; Sabatini, S.; Macchi, C.; et al. TM6SF2/PNPLA3/MBOAT7 Loss-of-Function Genetic Variants Impact on NAFLD Development and Progression Both in Patients and in In Vitro Models. Cell. Mol. Gastroenterol. Hepatol. 2022, 13, 759–788. [Google Scholar] [CrossRef] [PubMed]
- Widjaja, A.A.; Chothani, S.P.; Cook, S.A. Different roles of interleukin 6 and interleukin 11 in the liver: Implications for therapy. Hum. Vaccines Immunother. 2020, 16, 2357–2362. [Google Scholar] [CrossRef] [PubMed]

| Non-MASLD n = 55 | MASLD n = 123 | ||||
|---|---|---|---|---|---|
| Parameter | Median | IQR | Median | IQR | p Value |
| Age (years) | 40 | 26 | 61 | 17 | <0.001 * |
| BMI (kg/m2) | 23.45 | 4.63 | 31.27 | 5.92 | <0.001 * |
| Waist circumference (cm) | 79 | 17 | 106 | 14 | <0.001 * |
| SBP (mmHg) | 120 | 10 | 131 | 20 | <0.001 * |
| Total adipose tissue (%) | 29.60 | 9.30 | 30.10 | 9.10 | 0.755 |
| Muscle mass (%) | 27.20 | 8.40 | 29.30 | 7.40 | 0.840 |
| Platelets | 259 | 82 | 248 | 79 | 0.207 |
| MPV | 10.10 | 1.30 | 10.60 | 1.40 | 0.011 * |
| Neutrophils | 3.78 | 1.31 | 4.13 | 1.80 | 0.003 * |
| Lymphocytes | 1.85 | 0.71 | 2.04 | 0.88 | 0.019 * |
| NLR | 1.87 | 0.92 | 1.98 | 0.91 | 0.303 |
| PLR | 84.55 | 126.30 | 118.75 | 57.17 | <0.001 * |
| Total cholesterol (mg/dL) | 183.00 | 41 | 202 | 66 | 0.003 * |
| HDL (mg/dL) | 48 | 19 | 45 | 10 | 0.009 * |
| LDL (mg/dL) | 109.20 | 46.20 | 127.20 | 62.60 | 0.017 * |
| Triglycerides (mg/dL) | 88 | 47 | 143 | 103 | <0.001 * |
| Serum albumin (g/dL) | 4.40 | 0.90 | 4.60 | 0.90 | 0.551 |
| AST (UI/L) | 21 | 9 | 22 | 15 | 0.055 |
| ALT (UI/L) | 26 | 22 | 25 | 18 | 0.121 |
| ALP (UI/L) | 71 | 28 | 75 | 27 | 0.232 |
| GGT (UI/L) | 22 | 16 | 38 | 30 | <0.001 * |
| Total bilirubin (mg/dL) | 0.60 | 0.30 | 0.60 | 0.50 | 0.130 |
| Creatinine (mg/dL) | 0.73 | 0.30 | 0.84 | 0.26 | 0.029 * |
| Left liver lobe (mm) | 75 | 20 | 85 | 18 | 0.003 * |
| Right liver lobe (mm) | 130 | 25 | 153 | 23 | <0.001 * |
| E (kPa) | 4.56 | 1.79 | 6.29 | 3.21 | <0.001 * |
| FIB-4 | 0.67 | 0.66 | 1.08 | 0.71 | <0.001 * |
| APRI | 0.22 | 0.10 | 0.27 | 0.18 | 0.060 |
| BARD | 2 | 1 | 2 | 1 | <0.001 * |
| FLI | 16 | 19.08 | 85.25 | 23.58 | <0.001 * |
| HSI | 23.27 | 16.09 | 34.89 | 7.18 | <0.001 * |
| Triglyceride/Glucose index | 3.62 | 0.30 | 3.93 | 0.35 | <0.001 * |
| VAI | 1.15 | 0.88 | 2.08 | 1.97 | <0.001 * |
| IL-6 (pg/mL) | 30.3 | 31.86 | 47.69 | 67.64 | <0.001 * |
| IL-10 (pg/mL) | 1.96 | 2.04 | 3.48 | 2.52 | <0.001 * |
| TNF alpha (pg/mL) | 5.25 | 0.54 | 5.20 | 0.64 | 0.290 |
| CYS-C (ng/mL) | 8.20 | 7.90 | 7.50 | 6.20 | 0.235 |
| n | % | n | % | ||
| Women | 42 | 76.4 | 63 | 51.2 | |
| Men | 13 | 23.6 | 60 | 48.8 | |
| Control (n = 55) Non-MASLD | G1 (n = 57) MASLD with Adipose Tissue Dysfunction | G2 (n = 66) MASLD with Obesity | ||||||||
|---|---|---|---|---|---|---|---|---|---|---|
| Parameter | Median | IQR | Median | IQR | Median | IQR | p Value | |||
| ANOVA All Groups | Post Hoc | |||||||||
| C–G1 | G1–G2 | C–G2 | ||||||||
| Age (years) | 40 | 26 | 60 | 17 | 61.50 | 17 | <0.001 * | <0.001 * | 0.999 | <0.001 * |
| BMI (kg/m2) | 23.45 | 4.63 | 31.14 | 7.58 | 32.04 | 5.50 | <0.001 * | <0.001 * | 0.500 | <0.001 * |
| Waist circumference (cm) | 79 | 17 | 108 | 14.50 | 106 | 13 | <0.001 * | <0.001 * | 0.717 | <0.001 * |
| SBP (mmHg) | 120 | 10 | 130 | 20 | 135 | 26 | <0.001 * | <0.001 * | 0.090 | <0.001 * |
| Total adipose tissue (%) | 29.60 | 9.30 | 29.35 | 8.90 | 30.90 | 9.20 | 0.723 | 0.835 | 0.504 | 0.724 |
| Muscle mass (%) | 27.20 | 8.40 | 29.60 | 6.80 | 28.95 | 8.40 | 0.699 | 0.972 | 0.829 | 0.695 |
| Platelets | 259 | 82 | 252 | 93 | 243 | 73 | 0.320 | 1.000 | 0.402 | 0.400 |
| MPV | 10.10 | 1.30 | 10.50 | 1.40 | 10.60 | 1.05 | 0.017 * | 0.088 | 0.819 | 0.016 * |
| Neutrophils | 3.78 | 1.31 | 4.61 | 2.26 | 3.86 | 1.65 | <0.001 | <0.001 * | 0.002 * | 0.290 |
| Lymphocytes | 1.85 | 0.71 | 2.05 | 1.06 | 2.03 | 0.71 | 0.022 * | 0.016 | 0.445 | 0.216 |
| NLR | 1.87 | 0.92 | 2.02 | 0.96 | 1.93 | 0.87 | 0.373 | 0.536 | 0.376 | 0.973 |
| PLR | 84.55 | 126.30 | 118.67 | 59.11 | 119.99 | 51.90 | 0.001 * | 0.004 * | 1.000 | 0.003 * |
| Total cholesterol (mg/dL) | 183.00 | 41 | 211 | 75 | 198.5 | 70 | <0.001 * | <0.001 * | 0.174 | 0.041 * |
| HDL (mg/dL) | 48 | 19 | 42 | 12 | 47.50 | 11 | <0.001 * | <0.001 * | <0.001 * | 0.852 |
| LDL (mg/dL) | 109.20 | 46.20 | 114.40 | 71 | 128.50 | 57.95 | 0.036 * | 0.081 | 0.990 | 0.049 * |
| Triglycerides (mg/dL) | 88 | 47 | 203 | 56 | 106.5 | 42 | <0.001 * | <0.001 * | <0.001 * | 0.345 |
| Serum albumin (g/dL) | 4.40 | 0.90 | 4.60 | 0.95 | 4.60 | 0.93 | 0.517 | 0.511 | 0.951 | 0.674 |
| AST (UI/L) | 21 | 9 | 22 | 15 | 22.50 | 13 | 0.150 | 0.270 | 0.972 | 0.162 |
| ALT (UI/L) | 26 | 22 | 27 | 19 | 24.50 | 19 | 0.159 | 0.198 | 0.987 | 0.233 |
| ALP (UI/L) | 71 | 28 | 72 | 25 | 77.50 | 28 | 0.191 | 0.914 | 0.386 | 0.198 |
| GGT (UI/L) | 22 | 16 | 43 | 23 | 35.50 | 42 | 0.014 * | 0.546 | 0.160 | 0.011 * |
| Total bilirubin (mg/dL) | 0.60 | 0.30 | 0.60 | 0.50 | 0.60 | 0.42 | 0.080 | 0.406 | 0.616 | 0.064 |
| Creatinine (mg/dL) | 0.73 | 0.30 | 0.85 | 0.25 | 0.79 | 0.23 | 0.016 * | 0.026 * | 0.040 * | 0.959 |
| Left liver lobe (mm) | 75 | 20 | 85 | 17 | 83 | 20 | 0.010 * | 0.008 | 0.524 | 0.101 |
| Right liver lobe (mm) | 130 | 25 | 160 | 20 | 147 | 24 | <0.001 * | <0.001 * | <0.001 * | <0.001 * |
| E (kPa) | 4.56 | 1.79 | 5.55 | 2.64 | 6.74 | 3.43 | <0.001 * | 0.122 | 0.019 * | <0.001 * |
| FIB-4 | 0.67 | 0.66 | 1.04 | 0.73 | 1.14 | 0.72 | 0.001 * | 0.031 | 0.546 | <0.001 * |
| APRI | 0.22 | 0.10 | 0.24 | 0.19 | 0.29 | 0.19 | 0.147 | 0.586 | 0.605 | 0.123 |
| BARD | 2 | 1 | 2 | 1 | 2.50 | 1 | <0.001 * | <0.001 * | 0.936 | <0.001 * |
| FLI | 16 | 19.08 | 86.01 | 17.75 | 81.11 | 27.70 | <0.001 * | <0.001 * | 0.263 | <0.001 * |
| HSI | 23.27 | 16.09 | 34.50 | 8.37 | 35.43 | 5.99 | <0.001 * | <0.001 * | 0.676 | <0.001 * |
| Triglyceride/glucose index | 3.62 | 0.30 | 4.10 | 0.27 | 3.78 | 0.26 | <0.001 * | <0.001 * | <0.001 * | <0.001 * |
| VAI | 1.15 | 0.88 | 3.63 | 1.96 | 1.59 | 0.71 | <0.001 * | <0.001 * | <0.001 * | 0.850 |
| IL-6 (pg/mL) | 3 | 31.86 | 51.89 | 86.14 | 41.69 | 60.29 | <0.001 * | <0.001 * | 0.046 * | 0.027 |
| IL-10 (pg/mL) | 1.96 | 2.04 | 3.72 | 2.46 | 2.48 | 2.68 | <0.001 * | <0.001 * | 0.157 | 0.083 |
| TNF alpha (pg/mL) | 5.25 | 0.54 | 5.31 | 0.62 | 5.14 | 0.67 | 0.109 | 0.340 | 0.096 | 0.816 |
| CYS-C (ng/mL) | 8.20 | 7.90 | 8.10 | 6.60 | 7.05 | 6.67 | 0.418 | 0.758 | 0.823 | 0.383 |
| n | % | n | % | n | % | |||||
| Women | 42 | 76.4 | 28 | 49.1 | 35 | 53 | ||||
| Men | 13 | 23.6 | 29 | 50.9 | 31 | 47 | ||||
Disclaimer/Publisher’s Note: The statements, opinions and data contained in all publications are solely those of the individual author(s) and contributor(s) and not of MDPI and/or the editor(s). MDPI and/or the editor(s) disclaim responsibility for any injury to people or property resulting from any ideas, methods, instructions or products referred to in the content. |
© 2025 by the authors. Licensee MDPI, Basel, Switzerland. This article is an open access article distributed under the terms and conditions of the Creative Commons Attribution (CC BY) license (https://creativecommons.org/licenses/by/4.0/).
Share and Cite
Cosma, T.; Avram, L.; Donca, V.; Grosu, A.; Stoicescu, L.; Buzdugan, E.; Nemes, A.; Balan, A.-M.; Crisan, D. Refining MASLD Phenotypes: Clinical, Metabolic, and Elastographic Differences Between Adipose Tissue Dysfunction and Obesity-Driven Disease. Nutrients 2025, 17, 3940. https://doi.org/10.3390/nu17243940
Cosma T, Avram L, Donca V, Grosu A, Stoicescu L, Buzdugan E, Nemes A, Balan A-M, Crisan D. Refining MASLD Phenotypes: Clinical, Metabolic, and Elastographic Differences Between Adipose Tissue Dysfunction and Obesity-Driven Disease. Nutrients. 2025; 17(24):3940. https://doi.org/10.3390/nu17243940
Chicago/Turabian StyleCosma, Tudor, Lucretia Avram, Valer Donca, Alin Grosu, Laurentiu Stoicescu, Elena Buzdugan, Andrada Nemes, Andrei-Mihai Balan, and Dana Crisan. 2025. "Refining MASLD Phenotypes: Clinical, Metabolic, and Elastographic Differences Between Adipose Tissue Dysfunction and Obesity-Driven Disease" Nutrients 17, no. 24: 3940. https://doi.org/10.3390/nu17243940
APA StyleCosma, T., Avram, L., Donca, V., Grosu, A., Stoicescu, L., Buzdugan, E., Nemes, A., Balan, A.-M., & Crisan, D. (2025). Refining MASLD Phenotypes: Clinical, Metabolic, and Elastographic Differences Between Adipose Tissue Dysfunction and Obesity-Driven Disease. Nutrients, 17(24), 3940. https://doi.org/10.3390/nu17243940