
Exploring the Potential of Epigallocatechin Gallate in Combating Insulin Resistance and Diabetes


Highlights
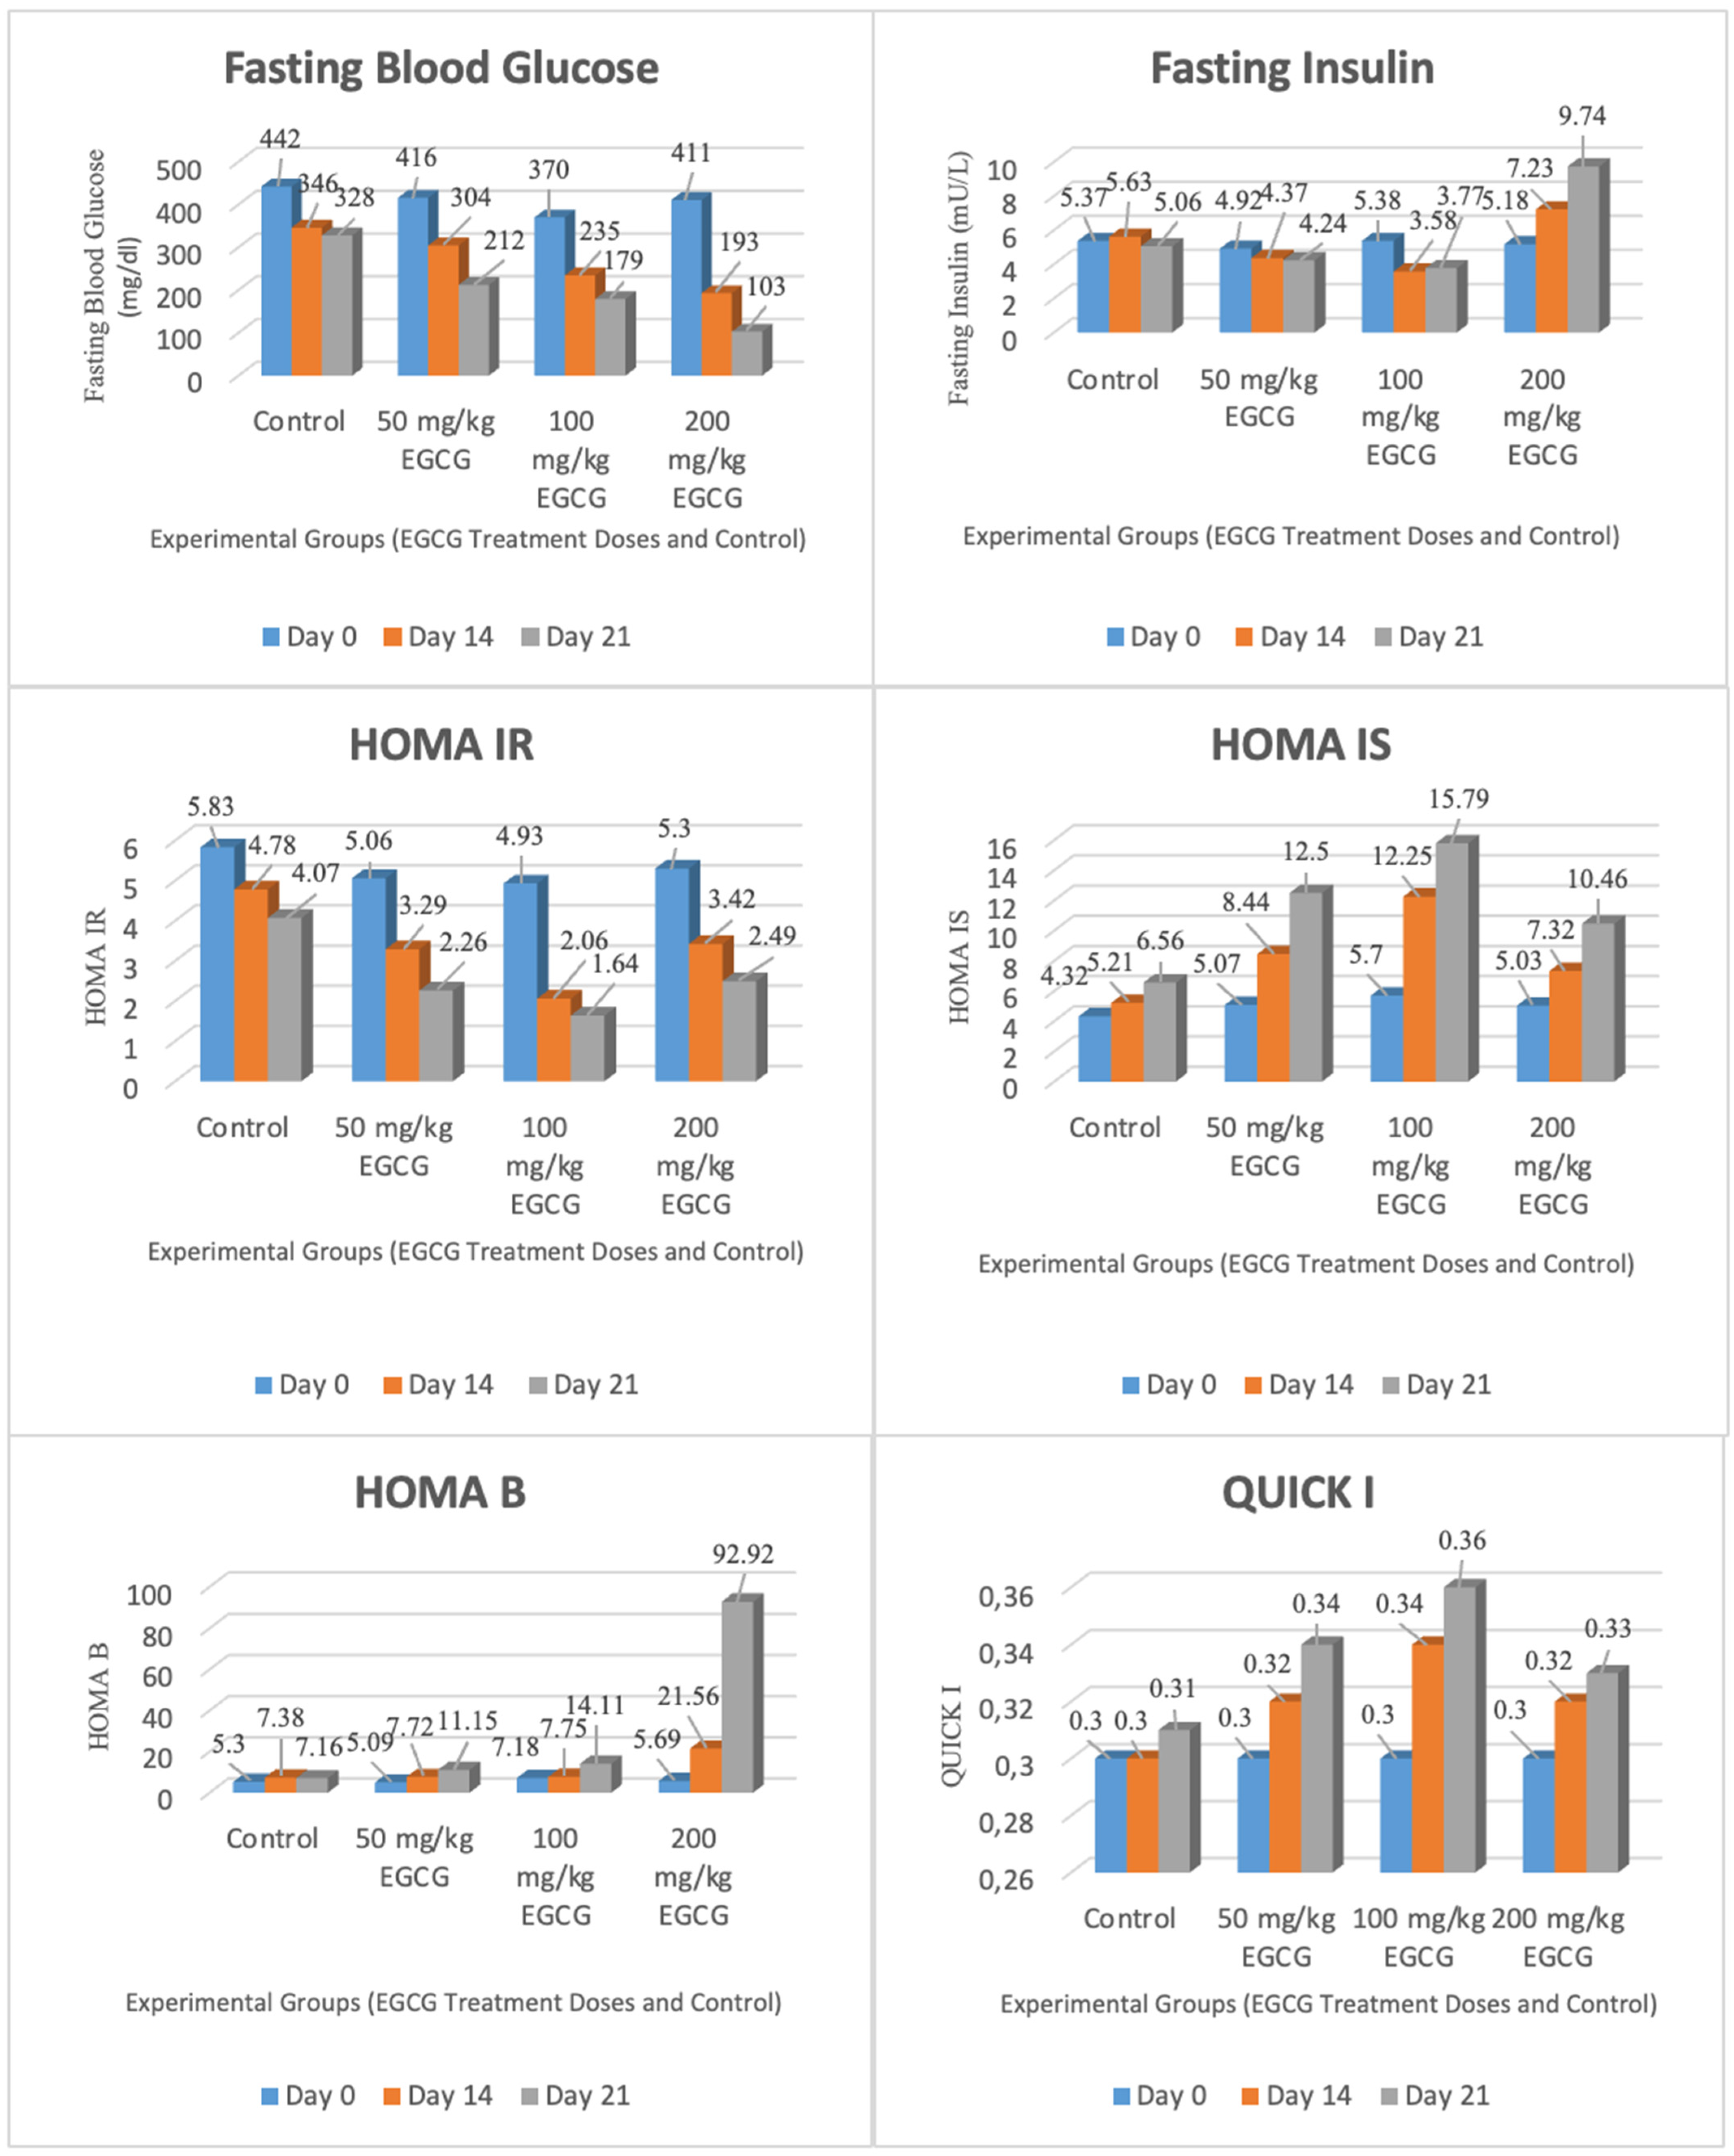
- Epigallocatechin Gallate (EGCG) lowered fasting blood glucose levels, especially at a dose of 200 mg/kg.
- EGCG at 100 mg/kg and 200 mg/kg was the most effective dose in improving insulin secretion, beta-cell function, and reducing insulin resistance in STZ-induced diabetic rats.
- These findings suggest that EGCG may be an effective therapeutic agent in STZ-diabetic rats.
- This intervention in rats should be tested in diabetic humans to evaluate its potential therapeutic effects.
- Since this study was conducted on STZ diabetic rats, clinical studies should be conducted to generalize these results to diabetic individuals, especially type 2 diabetes patients.
Abstract
1. Introduction
2. Materials and Methods
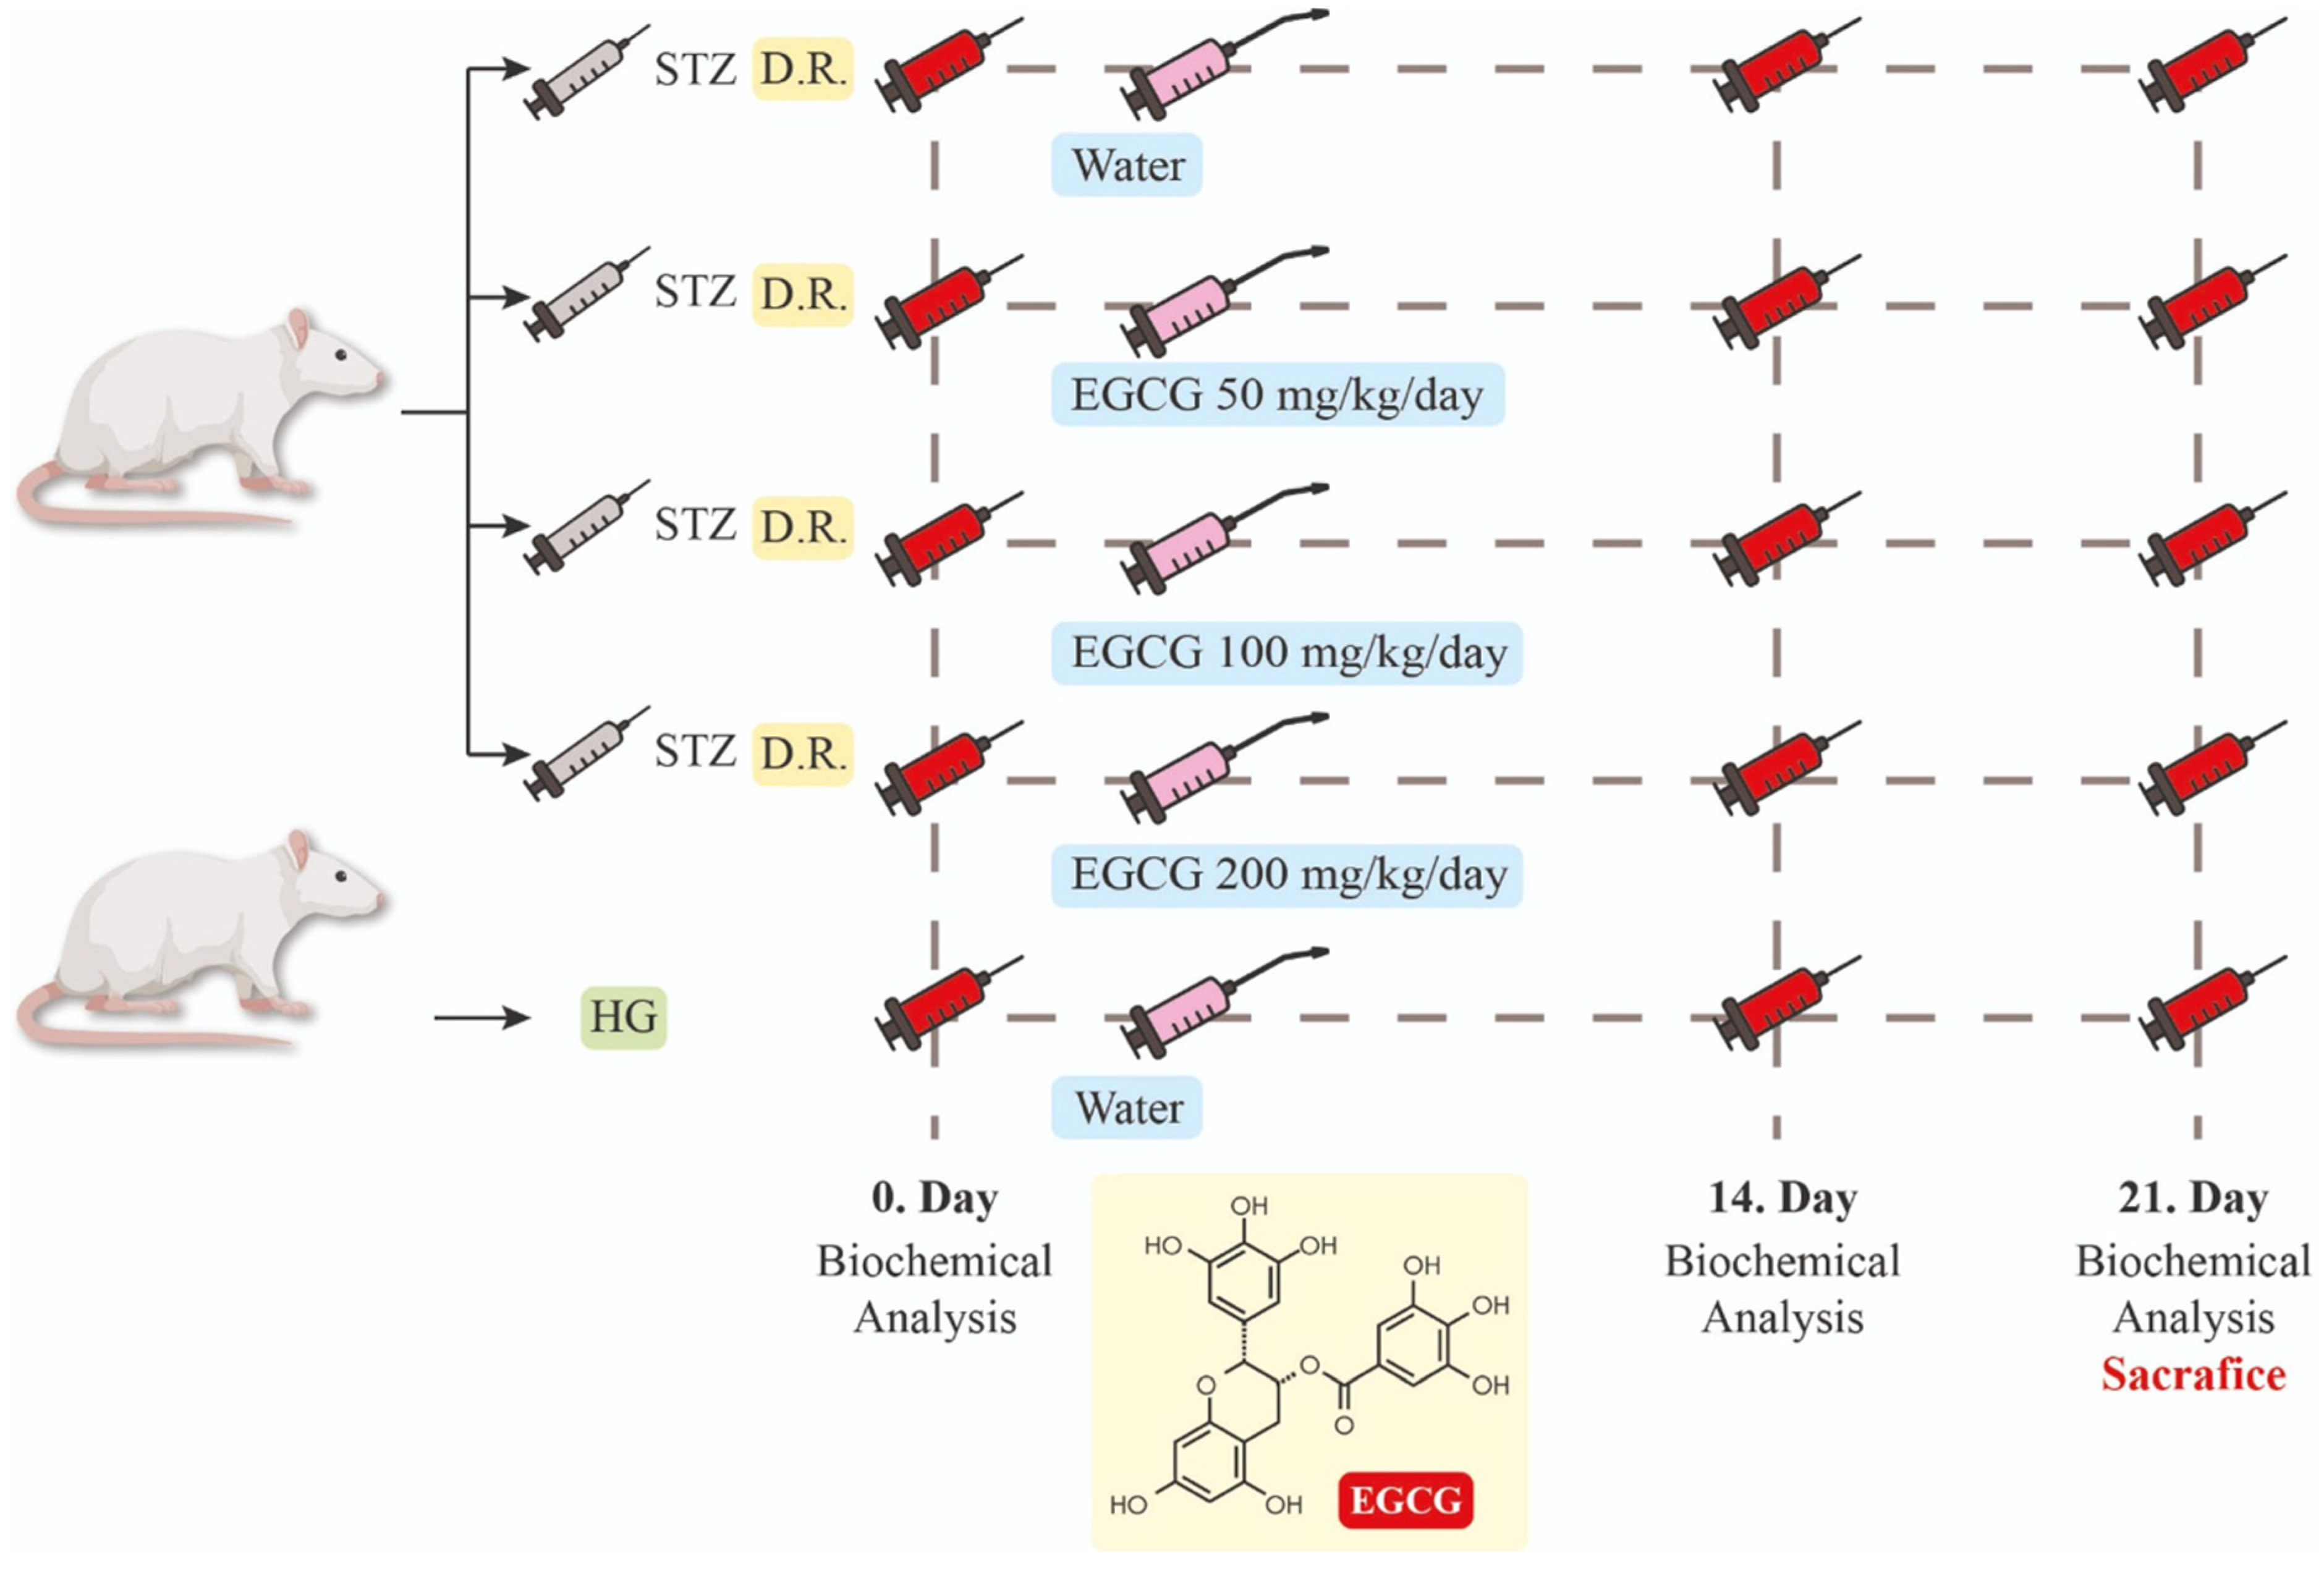
2.1. Animal Model and DM Induction
2.2. Experimental Design
2.3. Chemicals and Materials
2.4. Statistical Evaluations—Data Analysis
3. Results
4. Discussion
5. Conclusions
Author Contributions
Funding
Institutional Review Board Statement
Informed Consent Statement
Data Availability Statement
Acknowledgments
Conflicts of Interest
References
- Heald, A.H.; Stedman, M.; Davies, M.; Livingston, M.; Alshames, R.; Lunt, M.; Rayman, G.; Gadsby, R. Estimating life years lost to diabetes: Outcomes from analysis of National Diabetes Audit and Office of National Statistics data. Cardiovasc. Endocrinol. Metab. 2020, 9, 183–185. [Google Scholar] [CrossRef] [PubMed]
- World Health Organization. Diabetes. World Health Organization. 2023. Available online: https://www.who.int/news-room/fact-sheets/detail/diabetes (accessed on 10 October 2024).
- Woo, H.W.; Hoang, M.T.; Shin, M.-H.; Koh, S.B.; Kim, H.C.; Kim, Y.-M.; Kim, M.K. Diet-Wide Association Study for the Incidence of Type 2 Diabetes in Three Population-Based Cohorts. Nutrients 2024, 16, 3798. [Google Scholar] [CrossRef] [PubMed]
- Serina, J.J.C.; Castilho, P.C.M.F. Using polyphenols as a relevant therapy to diabetes and its complications, a review. Crit. Rev. Food Sci. Nutr. 2022, 62, 8355–8387. [Google Scholar] [CrossRef] [PubMed]
- Plows, J.F.; Stanley, J.L.; Baker, P.N.; Reynolds, C.M.; Vickers, M.H. The Pathophysiology of Gestational Diabetes Mellitus. Int. J. Mol. Sci. 2018, 19, 3342. [Google Scholar] [CrossRef] [PubMed]
- Magliano, D.J.; Islam, R.M.; Barr, E.L.M.; Gregg, E.W.; Pavkov, M.E.; Harding, J.L.; Tabesh, M.; Koye, D.N.; Shaw, J.E. Trends in incidence of total or type 2 diabetes: Systematic review. BMJ 2019, 366, 15003. [Google Scholar] [CrossRef]
- Chan, J.C.N.; Lim, L.L.; Wareham, N.J.; Shaw, J.E.; Orchard, T.J.; Zhang, P.; Lau, E.S.; Eliasson, B.; Kong, A.P.; Ezzati, M.; et al. The Lancet Commission on diabetes: Using data to transform diabetes care and patient lives. Lancet 2019, 396, 2082. [Google Scholar] [CrossRef] [PubMed]
- Saeedi, P.; Petersohn, I.; Salpea, P.; Malanda, B.; Karuranga, S.; Unwin, N.; Colagiuri, S.; Guariguata, L.; Motala, A.A.; Ogurtsova, K.; et al. IDF Diabetes Atlas Committee. Global and regional diabetes prevalence estimates for 2019 and projections for 2030 and 2045: Results from the International Diabetes Federation Diabetes Atlas, 9th edition. Diabetes Res. Clin. Pract. 2019, 157, 107843. [Google Scholar] [CrossRef]
- Centers for Disease Control and Prevention. Data & Research on Diabetes. Available online: https://www.cdc.gov/diabetes/php/data-research/index.html (accessed on 10 October 2024).
- Sun, H.; Saeedi, P.; Karuranga, S.; Pinkepank, M.; Ogurtsova, K.; Duncan, B.B.; Stein, C.; Basit, A.; Chan, J.C.N.; Mbanya, J.C.; et al. IDF Diabetes Atlas: Global, regional and country-level diabetes prevalence estimates for 2021 and projections for 2045. Diabetes Res. Clin. Pract. 2022, 183, 109119. [Google Scholar] [CrossRef] [PubMed]
- Rooney, M.R.; Fang, M.; Ogurtsova, K.; Ozkan, B.; Echouffo-Tcheugui, J.B.; Boyko, E.J.; Magliano, D.J.; Selvin, E. Global prevalence of prediabetes. Diabetes Care 2023, 46, 1388–1394. [Google Scholar] [CrossRef] [PubMed]
- Kosmas, C.E.; Bousvarou, M.D.; Kostara, C.E.; Papakonstantinou, E.J.; Salamou, E.; Guzman, E. Insulin resistance and cardiovascular disease. J. Int. Med. Res. 2023, 51, 3000605231164548. [Google Scholar] [CrossRef] [PubMed]
- Himsworth, H.P. Diabetes mellitus: Its differentiation into insulin-sensitive and insulin-insensitive types. Int. J. Epidemiol. 2013, 42, 1594–1598. [Google Scholar] [CrossRef] [PubMed]
- Odegaard, J.I.; Chawla, A. Pleiotropic actions of insulin resistance and inflammation in metabolic homeostasis. Science 2013, 339, 172–177. [Google Scholar] [CrossRef] [PubMed]
- Chandrasekaran, P.; Weiskirchen, R. Cellular and molecular mechanisms of insulin resistance. Curr. Tissue Microenviron. Rep. 2024, 5, 79–90. [Google Scholar] [CrossRef]
- Stein, S.A.; Lamos, E.M.; Davis, S.N. A review of the efficacy and safety of oral antidiabetic drugs. Expert Opin. Drug Saf. 2013, 12, 153–175. [Google Scholar] [CrossRef]
- Márquez Campos, E.; Jakobs, L.; Simon, M.C. Antidiabetic effects of flavan-3-ols and their microbial metabolites. Nutrients 2020, 12, 1592. [Google Scholar] [CrossRef] [PubMed]
- Nagle, D.G.; Ferreira, D.; Zhou, Y.D. Epigallocatechin-3-gallate (EGCG): Chemical and biomedical perspectives. Phytochemistry 2006, 67, 1849–1855. [Google Scholar] [CrossRef]
- Menegazzi, M.; Campagnari, R.; Bertoldi, M.; Crupi, R.; Di Paola, R.; Cuzzocrea, S. Protective Effect of Epigallocatechin-3-Gallate (EGCG) in Diseases with Uncontrolled Immune Activation: Could Such a Scenario Be Helpful to Counteract COVID-19? Int. J. Mol. Sci. 2020, 21, 5171. [Google Scholar] [CrossRef] [PubMed]
- Xing, L.; Zhang, H.; Qi, R.; Tsao, R.; Mine, Y. Recent advances in the understanding of the health benefits and molecular mechanisms associated with green tea polyphenols. J. Agric. Food Chem. 2019, 67, 1029–1043. [Google Scholar] [CrossRef]
- Im, H.; Lee, J.; Kim, K.; Son, Y.; Lee, Y.H. Anti-obesity effects of heat-transformed green tea extract through the activation of adipose tissue thermogenesis. Nutr. Metab. 2022, 19, 14. [Google Scholar] [CrossRef]
- Jakab, J.; Miškić, B.; Mikšić, Š.; Juranić, B.; Ćosić, V.; Schwarz, D.; Včev, A. Adipogenesis as a potential anti- obesity target: A review of pharmacological treatment and natural products. Diabetes Metab. Syndr. Obes. Targets Ther. 2021, 14, 67–83. [Google Scholar] [CrossRef] [PubMed]
- Hridayanka, K.S.N.; Duttaroy, A.K.; Basak, S. Bioactive Compounds and Their Chondroprotective Effects for Osteoarthritis Amelioration: A Focus on Nanotherapeutic Strategies, Epigenetic Modifications, and Gut Microbiota. Nutrients 2024, 16, 3587. [Google Scholar] [CrossRef] [PubMed]
- Kottaisamy, C.P.D.; Raj, D.S.; Prasanth Kumar, V.; Sankaran, U. Experimental animal models for diabetes and its related complications—A review. Lab. Anim. Res. 2021, 37, 23. [Google Scholar] [CrossRef]
- Tancrède, G.; Rousseau-Migneron, S.; Nadeau, A. Long-term changes in the diabetic state induced by different doses of streptozotocin in rats. Br. J. Exp. Pathol. 1983, 64, 117–123. [Google Scholar] [PubMed]
- Omolaoye, T.S.; Skosana, B.T.; du Plessis, S.S. Diabetes mellitus induction: Effect of different streptozotocin doses on male reproductive parameters. Acta Histochem. 2018, 120, 103–109. [Google Scholar] [CrossRef]
- Legeay, S.; Rodier, M.; Fillon, L.; Faure, S.; Clere, N. Epigallocatechin gallate: A review of its beneficial properties to prevent metabolic syndrome. Nutrients 2015, 7, 5443–5468. [Google Scholar] [CrossRef]
- Wolfram, S. Effects of green tea and EGCG on cardiovascular and metabolic health. J. Am. Coll. Nutr. 2007, 26, 373S–388S. [Google Scholar] [CrossRef]
- Haidari, F.; Shahi, M.M.; Zarei, M.; Rafiei, H.; Omidian, K. Effect of green tea extract on body weight, serum glucose and lipid profile in streptozotocin-induced diabetic rats: A dose response study. Saudi Med. J. 2012, 33, 128–133. [Google Scholar]
- Fu, J.; Liu, S.; Li, M.; Guo, F.; Wu, X.; Hu, J.; Wen, L.; Wang, J.; Li, X. Optimal Fasting Duration for Mice as Assessed by Metabolic Status. Sci. Rep. 2024, 14, 21509. [Google Scholar] [CrossRef] [PubMed]
- Khalili, D.; Khayamzadeh, M.; Kohansal, K.; Ahanchi, N.S.; Hasheminia, M.; Hadaegh, F.; Tohidi, M.; Azizi, F.; Habibi-Moeini, A.S. Are HOMA-IR and HOMA-B good predictors for diabetes and pre-diabetes subtypes? BMC Endocr. Disord. 2023, 23, 39. [Google Scholar] [CrossRef]
- Sarafidis, P.; Lasaridis, A.; Nilsson, P.; Pikilidou, M.I.; Stafilas, P.C.; Kanaki, A.; Kazakos, K.; Yovos, J.; Bakris, G.L. Validity and reproducibility of HOMA-IR, 1/HOMA-IR, QUICKI and McAuley’s indices in patients with hypertension and type II diabetes. J. Hum. Hypertens. 2007, 21, 709–716. [Google Scholar] [CrossRef] [PubMed]
- Kukla, M.; Zwirska-Korczala, K.; Hartleb, M.; Waluga, M.; Chwist, A.; Kajor, M.; Ciupinska-Kajor, M.; Berdowska, A.; Wozniak-Grygiel, E.; Buldak, R. Serum chemerin and vaspin in non-alcoholic fatty liver disease. Scand. J. Gastroenterol. 2010, 45, 235–242. [Google Scholar] [CrossRef] [PubMed]
- Wallace, T.M.; Levy, J.C.; Matthews, D.R. Use and abuse of HOMA modeling. Diabetes Care 2004, 27, 1487–1495. [Google Scholar] [CrossRef] [PubMed]
- Rajasekhar, C.; Nagendranayak, I.M. Preventive effects of Enicostemma littorale Blume extract against dexamethasone induced insulin resistance in Wistar rats. J. Krishna Inst. Med. Sci. Univ. 2020, 8, 27–37. [Google Scholar]
- Bowe, J.E.; Franklin, Z.J.; Hauge-Evans, A.C.; King, A.J.; Persaud, S.J.; Jones, P.M. Metabolic phenotyping guidelines: Assessing glucose homeostasis in rodent models. J. Endocrinol. 2014, 222, G13–G25. [Google Scholar] [CrossRef]
- Hu, H.; Nakagawa, T.; Honda, T.; Yamamoto, S.; Mizoue, T. Should insulin resistance (HOMA-IR), insulin secretion (HOMA-β), and visceral fat area be considered for improving the performance of diabetes risk prediction models? BMJ Open Diabetes Res. Care 2024, 12, e003680. [Google Scholar] [CrossRef]
- Park, S.Y.; Gautier, J.F.; Chon, S. Assessment of insulin secretion and insulin resistance in humans. Diabetes Metab. J. 2021, 45, 641–654. [Google Scholar] [CrossRef]
- Katz, A.; Nambi, S.S.; Mather, K.; Baron, A.D.; Follmann, D.A.; Sullivan, G.; Quon, M.J. Quantitative insulin sensitivity check index: A simple, accurate method for assessing insulin sensitivity in humans. J. Clin. Endocrinol. Metab. 2000, 85, 2402–2410. [Google Scholar] [CrossRef] [PubMed]
- Chandrasekaran, P.; Weiskirchen, R. The role of obesity in type 2 diabetes mellitus—An overview. Int. J. Mol. Sci. 2024, 25, 1882. [Google Scholar] [CrossRef] [PubMed]
- Suryasa, I.W.; Rodríguez-Gámez, M.; Koldoris, T. Health and treatment of diabetes mellitus. Int. J. Health Sci. 2021, 5, i–v. [Google Scholar] [CrossRef]
- Wu, Z.; Huang, S.; Li, T.; Li, N.; Han, D.; Zhang, B.; Xu, Z.Z.; Zhang, S.; Pang, J.; Wang, S.; et al. Gut microbiota from green tea polyphenol-dosed mice improves intestinal epithelial homeostasis and ameliorates experimental colitis. Microbiome 2021, 9, 184. [Google Scholar] [CrossRef] [PubMed]
- Suzuki, T.; Pervin, M.; Goto, S.; Isemura, M.; Nakamura, Y. Beneficial effects of tea and the green tea catechin epigallocatechin-3-gallate on obesity. Molecules 2016, 21, 1305. [Google Scholar] [CrossRef] [PubMed]
- Dai, W.; Ruan, C.; Zhang, Y.; Wang, J.; Han, J.; Shao, Z.; Sun, Y.; Liang, J. Bioavailability enhancement of EGCG by structural modification and nano-delivery: A review. J. Funct. Foods 2020, 65, 103732. [Google Scholar] [CrossRef]
- Furman, B.L. Streptozotocin-induced diabetic models in mice and rats. Curr. Protoc. Pharmacol. 2015, 70, 5.47.1–5.47.20. [Google Scholar] [CrossRef] [PubMed]
- Song, E.K.; Hur, H.; Han, M.K. Epigallocatechin gallate prevents autoimmune diabetes induced by multiple low doses of streptozotocin in mice. Arch. Pharm. Res. 2003, 26, 559–563. [Google Scholar] [CrossRef] [PubMed]
- Kao, Y.H.; Hiipakka, R.A.; Liao, S. Modulation of endocrine systems and food intake by green tea epigallocatechin gallate. Endocrinology 2000, 141, 980–987. [Google Scholar] [CrossRef]
- Zhang, C.; Li, X.; Hu, X.; Xu, Q.; Zhang, Y.; Liu, H.; Diao, Y.; Zhang, X.; Li, L.; Yu, J.; et al. Epigallocatechin-3-gallate prevents inflammation and diabetes-induced glucose tolerance through inhibition of NLRP3 inflammasome activation. Int. Immunopharmacol. 2021, 93, 107412. [Google Scholar] [CrossRef]
- Wolfram, S.; Raederstorff, D.; Preller, M.; Wang, Y.; Teixeira, S.R.; Riegger, C.; Weber, P. Epigallocatechin gallate supplementation alleviates diabetes in rodents. J. Nutr. 2006, 136, 2512–2518. [Google Scholar] [CrossRef]
- Stensel, D.J. How can physical activity facilitate a sustainable future? Reducing obesity and chronic disease. Proc. Nutr. Soc. 2023, 82, 286–297. [Google Scholar] [CrossRef]
- Mi, Y.; Liu, X.; Tian, H.; Liu, H.; Li, J.; Qi, G.; Liu, X. EGCG stimulates the recruitment of brite adipocytes, suppresses adipogenesis and counteracts TNF-α-triggered insulin resistance in adipocytes. Food Funct. 2018, 9, 3374–3386. [Google Scholar] [CrossRef]
- Kim, S.N.; Kwon, H.J.; Akindehin, S.; Jeong, H.W.; Lee, Y.H. Effects of epigallocatechin-3-gallate on autophagic lipolysis in adipocytes. Nutrients 2017, 9, 680. [Google Scholar] [CrossRef]
- Huang, J.; Feng, S.; Liu, A.; Dai, Z.; Wang, H.; Reuhl, K.; Lu, W.; Yang, C.S. Green tea polyphenol EGCG alleviates metabolic abnormality and fatty liver by decreasing bile acid and lipid absorption in mice. Mol. Nutr. Food Res. 2018, 62, 1700696. [Google Scholar] [CrossRef]
- Zhu, T.; Li, M.; Zhu, M.; Liu, X.; Huang, K.; Li, W.; Wang, S.X.; Yin, Y.; Li, P. Epigallocatechin-3-gallate alleviates type 2 diabetes mellitus via β-cell function improvement and insulin resistance reduction. Iran. J. Basic Med. Sci. 2022, 25, 483–488. [Google Scholar] [CrossRef] [PubMed]
- Williamson, G.; Sheedy, K. Effects of Polyphenols on Insulin Resistance. Nutrients 2020, 12, 3135. [Google Scholar] [CrossRef]
- Babu, P.V.; Liu, D.; Gilbert, E.R. Recent advances in understanding the anti-diabetic actions of dietary flavonoids. J. Nutr. Biochem. 2013, 24, 1777–1789. [Google Scholar] [CrossRef] [PubMed]
- Lee, S.H.; Park, S.Y.; Choi, C.S. Insulin resistance: From mechanisms to therapeutic strategies. Diabetes Metab. J. 2022, 46, 15–37. [Google Scholar] [CrossRef]
- Salgado, A.L.; Carvalho, L.D.; Oliveira, A.C.; Santos, V.N.; Vieira, J.G.; Parise, E.R. Insulin resistance index (HOMA-IR) in the differentiation of patients with non-alcoholic fatty liver disease and healthy individuals. Arq. Gastroenterol. 2010, 47, 165–169. [Google Scholar] [CrossRef]
- Liu, H.; Guan, H.; Tan, X.; Jiang, Y.; Li, F.; Sun-Waterhouse, D.; Li, D. Enhanced alleviation of insulin resistance via the IRS-1/Akt/FOXO1 pathway by combining quercetin and EGCG and involving miR-27a-3p and miR-96-5p. Free Radic. Biol. Med. 2022, 181, 105–117. [Google Scholar] [CrossRef] [PubMed]
- Shahwan, M.; Alhumaydhi, F.; Ashraf, G.M.; Hasan, P.M.Z.; Shamsi, A. Role of polyphenols in combating type 2 diabetes and insulin resistance. Int. J. Biol. Macromol. 2022, 206, 567–579. [Google Scholar] [CrossRef] [PubMed]
- Reagan-Shaw, S.; Nihal, M.; Ahmad, N. Dose Translation from Animal to Human Studies Revisited. FASEB J. 2008, 22, 659–661. [Google Scholar] [CrossRef] [PubMed]

| Variable | First Day (Mean ± SE) | Day 14 (Mean ± SE) | Day 21 (Mean ± SE) | |||||||||
|---|---|---|---|---|---|---|---|---|---|---|---|---|
| Control | 50 mg/kg | 100 mg/kg | 200 mg/kg | Control | 50 mg/kg | 100 mg/kg | 200 mg/kg | Control | 50 mg/kg | 100 mg/kg | 200 mg/kg | |
| Fasting blood glucose (mg/dL) | 442 ± 28 | 416 ± 20 | 370 ± 43 | 411 ± 35 | 346 ± 17 | 304 ± 41 | 235 ± 11 | 193 ± 12 | 328 ± 20 | 212 ± 19 | 179 ± 20 | 103 ± 5 |
| Post Hoc Dunnett | None | A with C (p = 0.007); A with D (p = 0.000) | A and B (p = 0.000); A and C (p = 0.000); A and D (p = 0.001) | |||||||||
| Body weight (G) | 290 ± 8 | 276 ± 9 | 267 ± 8 | 279 ± 8 | 303 ± 8 | 291 ± 11 | 286 ± 16 | 258 ± 5 | 317 ± 7 | 306 ± 12 | 298 ± 15 | 245 ± 3 |
| Post Hoc Dunnett | None | None | A with D (p = 0.000) | |||||||||
| Fasting insulin (mU/L) | 5.37 ± 0.22 | 4.92 ± 0.26 | 5.38 ± 0.36 | 5.18 ± 0.24 | 5.63 ± 0.20 | 4.37 ± 0.32 | 3.58 ± 0.19 | 7.23 ± 0.18 | 5.06 ± 0.49 | 4.24 ± 0.30 | 3.77 ± 0.21 | 9.74 ± 0.70 |
| Post Hoc Dunnett | None | A and B (p = 0.002); A and C (p = 0.000); A and D (p = 0.000) | A with D (p = 0.000) | |||||||||
| HOMA-IR | 5.83 ± 0.36 | 5.06 ± 0.41 | 4.93 ± 0.65 | 5.30 ± 0.61 | 4.78 ± 0.17 | 3.29 ± 0.56 | 2.06 ± 0.12 | 3.42 ± 0.16 | 4.07 ± 0.40 | 2.26 ± 0.29 | 1.64 ± 0.16 | 2.49 ± 0.25 |
| Post Hoc Dunnett | None | A and B (p = 0.007); A and C (p = 0.000); A and D (p = 0.014) | A and B (p = 0.001); A and C (p = 0.000); A and D (p = 0.002) | |||||||||
| HOMA-IS | 4.32 ± 0.25 | 5.07 ± 0.40 | 5.70 ± 0.91 | 5.03 ± 0.56 | 5.21 ± 0.19 | 8.44 ± 0.94 | 12.25 ± 0.87 | 7.32 ± 0.37 | 6.56 ± 0.82 | 12.50 ± 2.23 | 15.79 ± 1.25 | 10.46 ± 0.94 |
| Post Hoc Dunnett | None | A and B (p = 0.007); A and C (p = 0.000) | A with B (p = 0.018); A with C (p = 0.000) | |||||||||
| HOMA-B Cell | 5.30 ± 0.49 | 5.09 ± 0.35 | 7.18 ± 1.32 | 5.69 ± 0.63 | 7.38 ± 0.66 | 7.72 ± 1.42 | 7.75 ± 0.73 | 21.56 ± 3.00 | 7.16 ± 0.94 | 11.15 ± 1.30 | 14.11 ± 2.53 | 92.92 ± 8.64 |
| Post Hoc Dunnett | None | A with D (p = 0.000) | A with D (p = 0.000) | |||||||||
| QUICKI | 0.30 ± 0.00 | 0.30 ± 0.00 | 0.30 ± 0.01 | 0.30 ± 0.00 | 0.30 ± 0.00 | 0.32 ± 0.01 | 0.34 ± 0.00 | 0.32 ± 0.00 | 0.31 ± 0.01 | 0.34 ± 0.01 | 0.36 ± 0.00 | 0.33 ± 0.00 |
| Post Hoc Dunnett | None | A and B (p = 0.005); A and C (p = 0.000) | A and B (p = 0.003); A and C (p = 0.000); A and D (p = 0.022) | |||||||||
| Variable | Control (Mean ± SE) | 50 mg/kg (Mean ± SE) | 100 mg/kg (Mean ± SE) | 200 mg/kg (Mean ± SE) | ||||||||
|---|---|---|---|---|---|---|---|---|---|---|---|---|
| İlk Gün | 14. Gün | 21. Gün | İlk Gün | 14. Gün | 21. Gün | İlk Gün | 14. Gün | 21. Gün | İlk Gün | 14. Gün | 21. Gün | |
| Fasting Blood Glucose (mg/dL) | 442 ± 28 | 346 ± 17 | 328 ± 20 | 416 ± 20 | 304 ± 41 | 212 ± 19 | 370 ± 43 | 235 ± 11 | 179 ± 20 | 411 ± 35 | 193 ± 12 | 103 ± 5 |
| Post Hoc Bonferroni | A with B (p = 0.022) | A with B (p = 0.030); A with C (p = 0.001) | A ile B (p = 0.038); A ile C (p = 0.003); B ile C (p = 0.026) | A with B (p = 0.002); A with C (p = 0.000); B with C (p = 0.000) | ||||||||
| Body Weight (G) | 290 ± 8 | 302 ± 8 | 317 ± 7 | 276 ± 9 | 291 ± 10 | 306 ± 12 | 267 ± 8 | 286 ± 16 | 298 ± 15 | 279 ± 8 | 258 ± 5 | 245 ± 3 |
| Post Hoc Bonferroni | A with B (p = 0.000); A with C (p = 0.001); B with C (p = 0.005) | A with C (p = 0.017); B with C (p = 0.044) | None | A with B (p = 0.000); A with C (p = 0.001); B with C (p = 0.002) | ||||||||
| Fasting Insulin (mU/L) | 5.37 ± 0.22 | 5.63 ± 0.20 | 5.06 ± 0.49 | 4.92 ± 0.26 | 4.37 ± 0.32 | 4.24 ± 0.30 | 5.38 ± 0.36 | 3.58 ± 0.19 | 3.77 ± 0.21 | 5.18 ± 0.24 | 7.23 ± 0.18 | 9.74 ± 0.70 |
| Post Hoc Bonferroni | None | A with C (p = 0.010) | A with B (p = 0.003); A with C (p = 0.003) | A with B (p = 0.003); A with C (p = 0.002); B with C (p = 0.040) | ||||||||
| HOMA-IR | 5.83 ± 0.36 | 4.78 ± 0.17 | 4.07 ± 0.40 | 5.06 ± 0.41 | 3.29 ± 0.56 | 2.26 ± 0.29 | 4.93 ± 0.65 | 2.06 ± 0.12 | 1.64 ± 0.16 | 5.30 ± 0.61 | 3.42 ± 0.16 | 2.49 ± 0.25 |
| Post Hoc Bonferroni | A with B (p = 0.040) | A with B (p = 0.033); A with C (p = 0.001) | A and B (p = 0.011); A and C (p = 0.003) | A with B (p = 0.034); A with C (p = 0.003); B with C (p = 0.004) | ||||||||
| HOMA-IS | 4.32 ± 0.25 | 5.21 ± 0.19 | 6.56 ± 0.82 | 5.07 ± 0.40 | 8.44 ± 0.94 | 12.50 ± 2.23 | 5.70 ± 0.91 | 12.25 ± 0.87 | 15.79 ± 1.25 | 5.03 ± 0.56 | 7.32 ± 0.37 | 10.46 ± 0.94 |
| Post Hoc Bonferroni | None | A and B (p = 0.019); A and C (p = 0.036) | A with B (p = 0.004); A with C (p = 0.001) | A with B (p = 0.008); A with C (p = 0.000); B with C (p = 0.016) | ||||||||
| HOMA-B | 5.30 ± 0.49 | 7.38 ± 0.66 | 7.16 ± 0.94 | 5.09 ± 0.35 | 7.72 ± 1.42 | 11.15 ± 1.30 | 7.18 ± 1.32 | 7.75 ± 0.73 | 14.11 ± 2.53 | 5.69 ± 0.63 | 21.56 ± 3.00 | 92.92 ± 8.64 |
| Post Hoc Bonferroni | A with B (p = 0.020) | A with C (p = 0.013) | A with C (p = 0.048) | A with B (p = 0.007); A with C (p = 0.000); B with C (p = 0.000) | ||||||||
| QUICKI | 0.30 ± 0.00 | 0.30 ± 0.00 | 0.31 ± 0.01 | 0.30 ± 0.00 | 0.32 ± 0.01 | 0.34 ± 0.01 | 0.30 ± 0.01 | 0.34 ± 0.00 | 0.36 ± 0.00 | 0.30 ± 0.00 | 0.32 ± 0.00 | 0.33 ± 0.00 |
| Post Hoc Bonferroni | None | A and B (p = 0.020); A and C (p = 0.003) | A and B (p = 0.003); A and C (p = 0.000) | A with C (p = 0.005) | ||||||||
Disclaimer/Publisher’s Note: The statements, opinions and data contained in all publications are solely those of the individual author(s) and contributor(s) and not of MDPI and/or the editor(s). MDPI and/or the editor(s) disclaim responsibility for any injury to people or property resulting from any ideas, methods, instructions or products referred to in the content. |
© 2024 by the authors. Licensee MDPI, Basel, Switzerland. This article is an open access article distributed under the terms and conditions of the Creative Commons Attribution (CC BY) license (https://creativecommons.org/licenses/by/4.0/).
Share and Cite
Yurtseven, K.; Yücecan, S. Exploring the Potential of Epigallocatechin Gallate in Combating Insulin Resistance and Diabetes. Nutrients 2024, 16, 4360. https://doi.org/10.3390/nu16244360
Yurtseven K, Yücecan S. Exploring the Potential of Epigallocatechin Gallate in Combating Insulin Resistance and Diabetes. Nutrients. 2024; 16(24):4360. https://doi.org/10.3390/nu16244360
Chicago/Turabian StyleYurtseven, Kübra, and Sevinç Yücecan. 2024. "Exploring the Potential of Epigallocatechin Gallate in Combating Insulin Resistance and Diabetes" Nutrients 16, no. 24: 4360. https://doi.org/10.3390/nu16244360
APA StyleYurtseven, K., & Yücecan, S. (2024). Exploring the Potential of Epigallocatechin Gallate in Combating Insulin Resistance and Diabetes. Nutrients, 16(24), 4360. https://doi.org/10.3390/nu16244360