
Overnutrition during Pregnancy and Lactation Induces Gender-Dependent Dysmetabolism in the Offspring Accompanied by Heightened Stress and Anxiety

 ,
,  ,
,  ,
,  and
and 
Abstract
1. Introduction
2. Materials and Methods
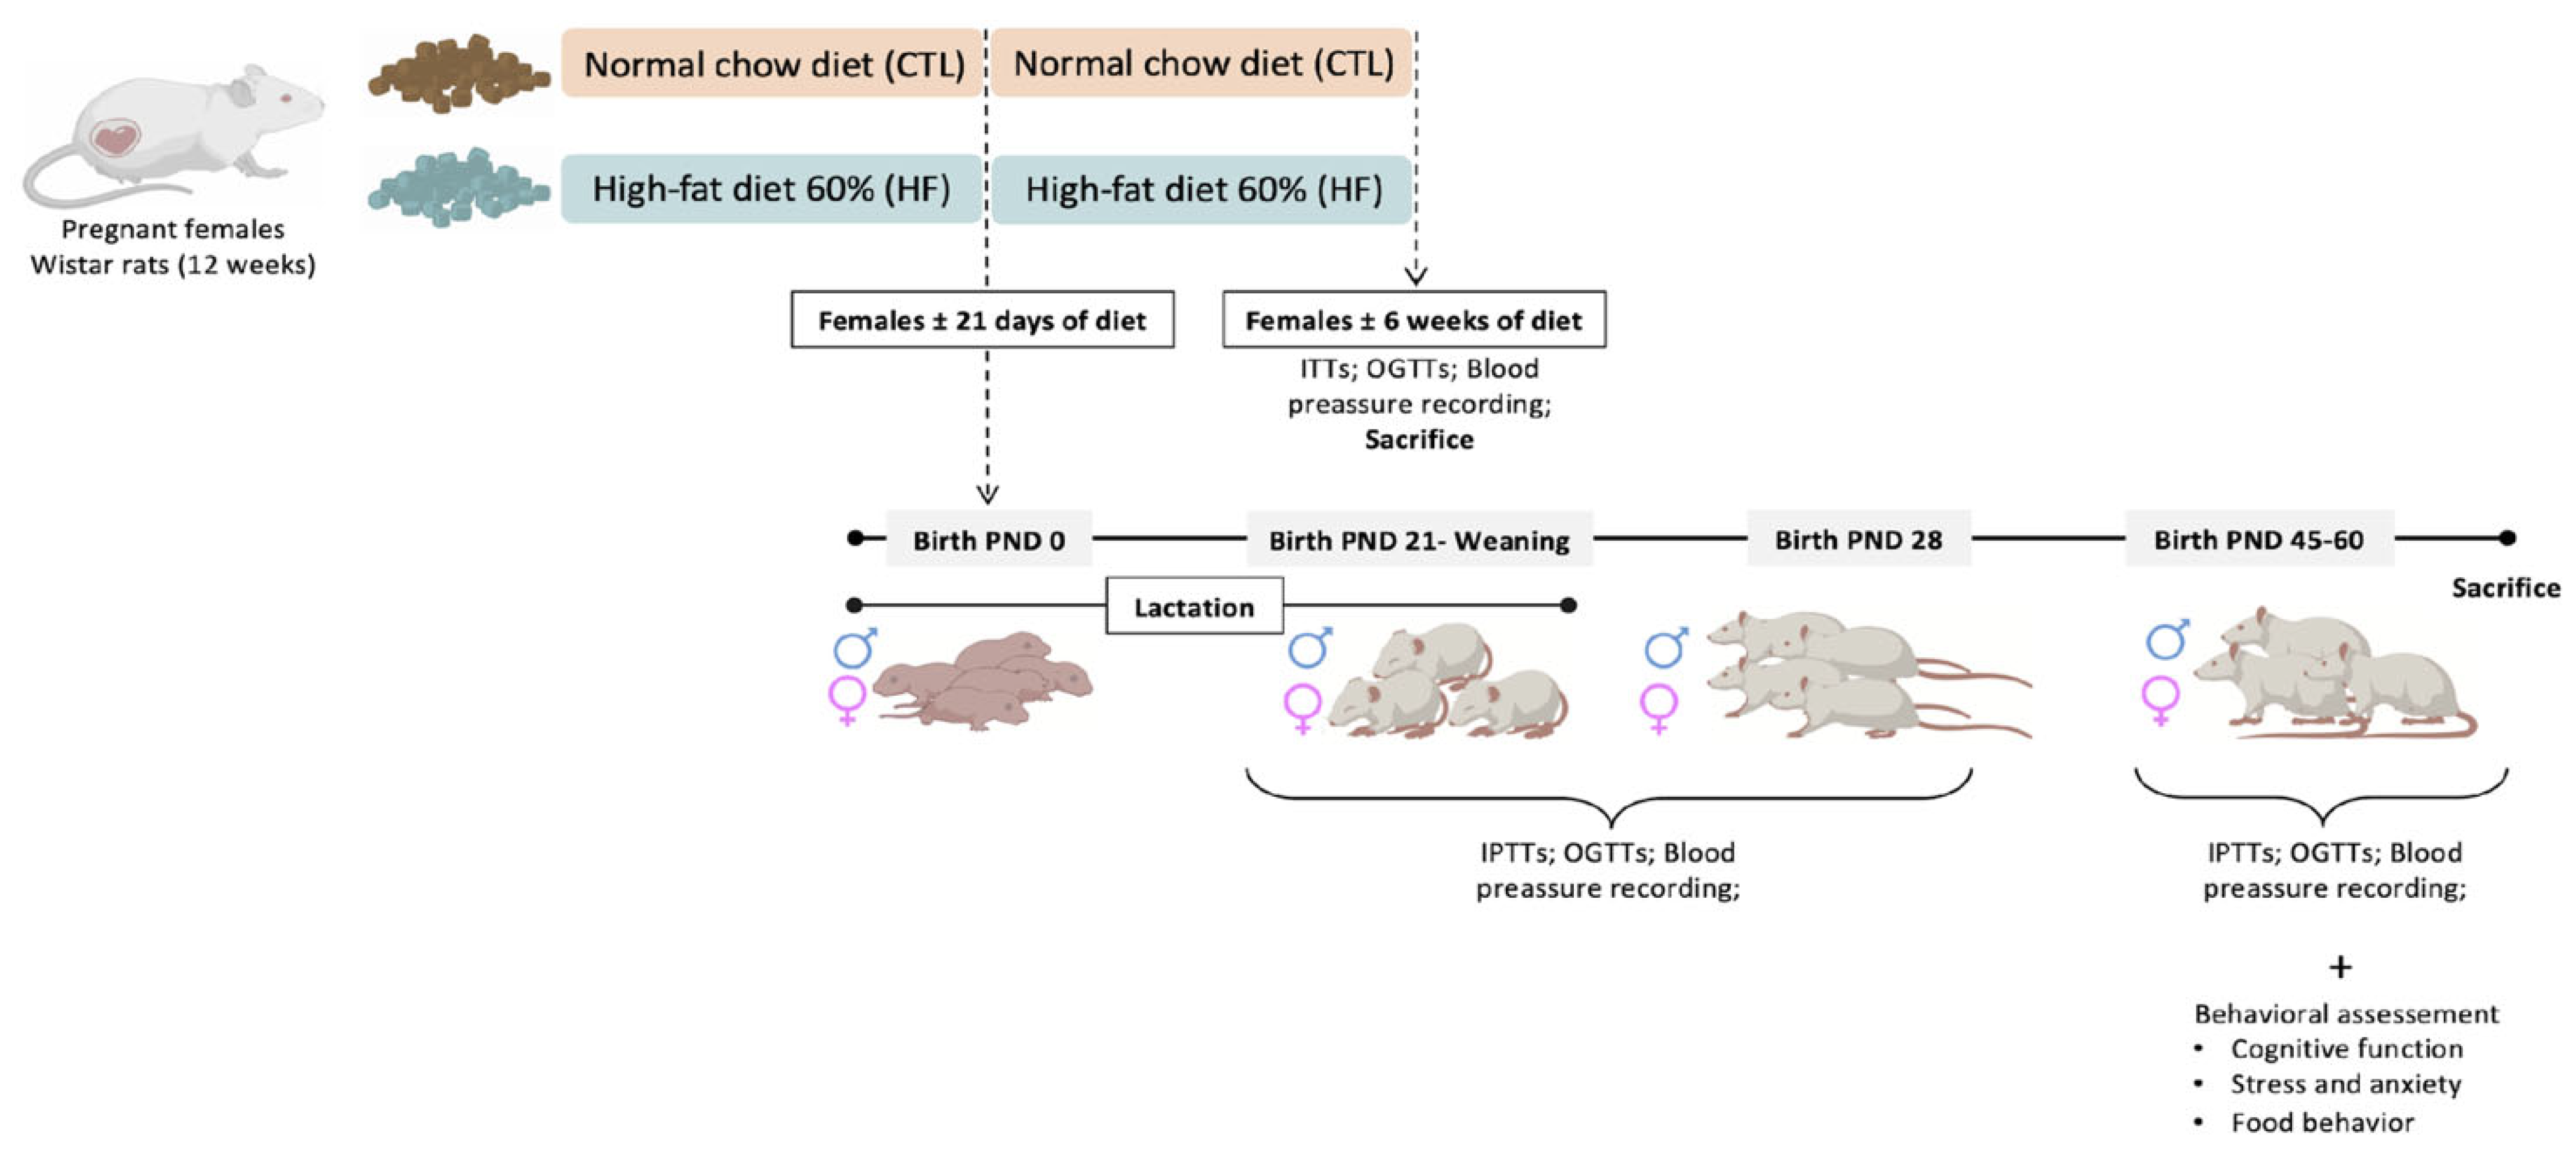
2.1. Animals
2.2. Metabolic Evaluation
2.2.1. Intravenous Insulin Tolerance Test (ITT)
2.2.2. Intraperitoneal Insulin Tolerance Test (ipITT)
2.2.3. Oral Glucose Tolerance Test (OGTT)
2.3. Behavioral Assessment
2.3.1. Open Field (OF)
2.3.2. Y Maze
2.3.3. Elevated Plus Maze (EPM)
2.3.4. Light Dark Box (LDB)
2.3.5. Novel Object Recognition (NOR)
2.3.6. Block Test
2.3.7. Food Competition
2.3.8. Water/Sucrose Competition
2.4. Ex Vivo Analysis
2.4.1. Tissue Lysate Preparation and Western Blot Analysis
2.5. Data Analysis
3. Results
3.1. Effect of Overnutrition during Pregnancy and Lactation on Metabolic Parameters in the Mothers
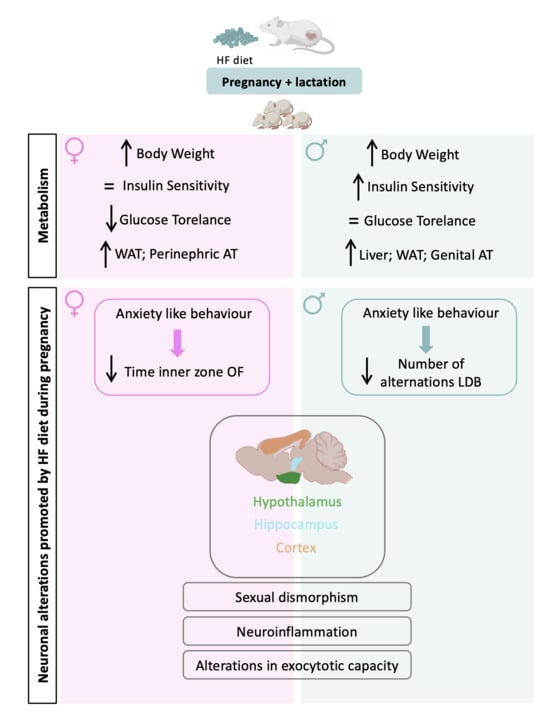
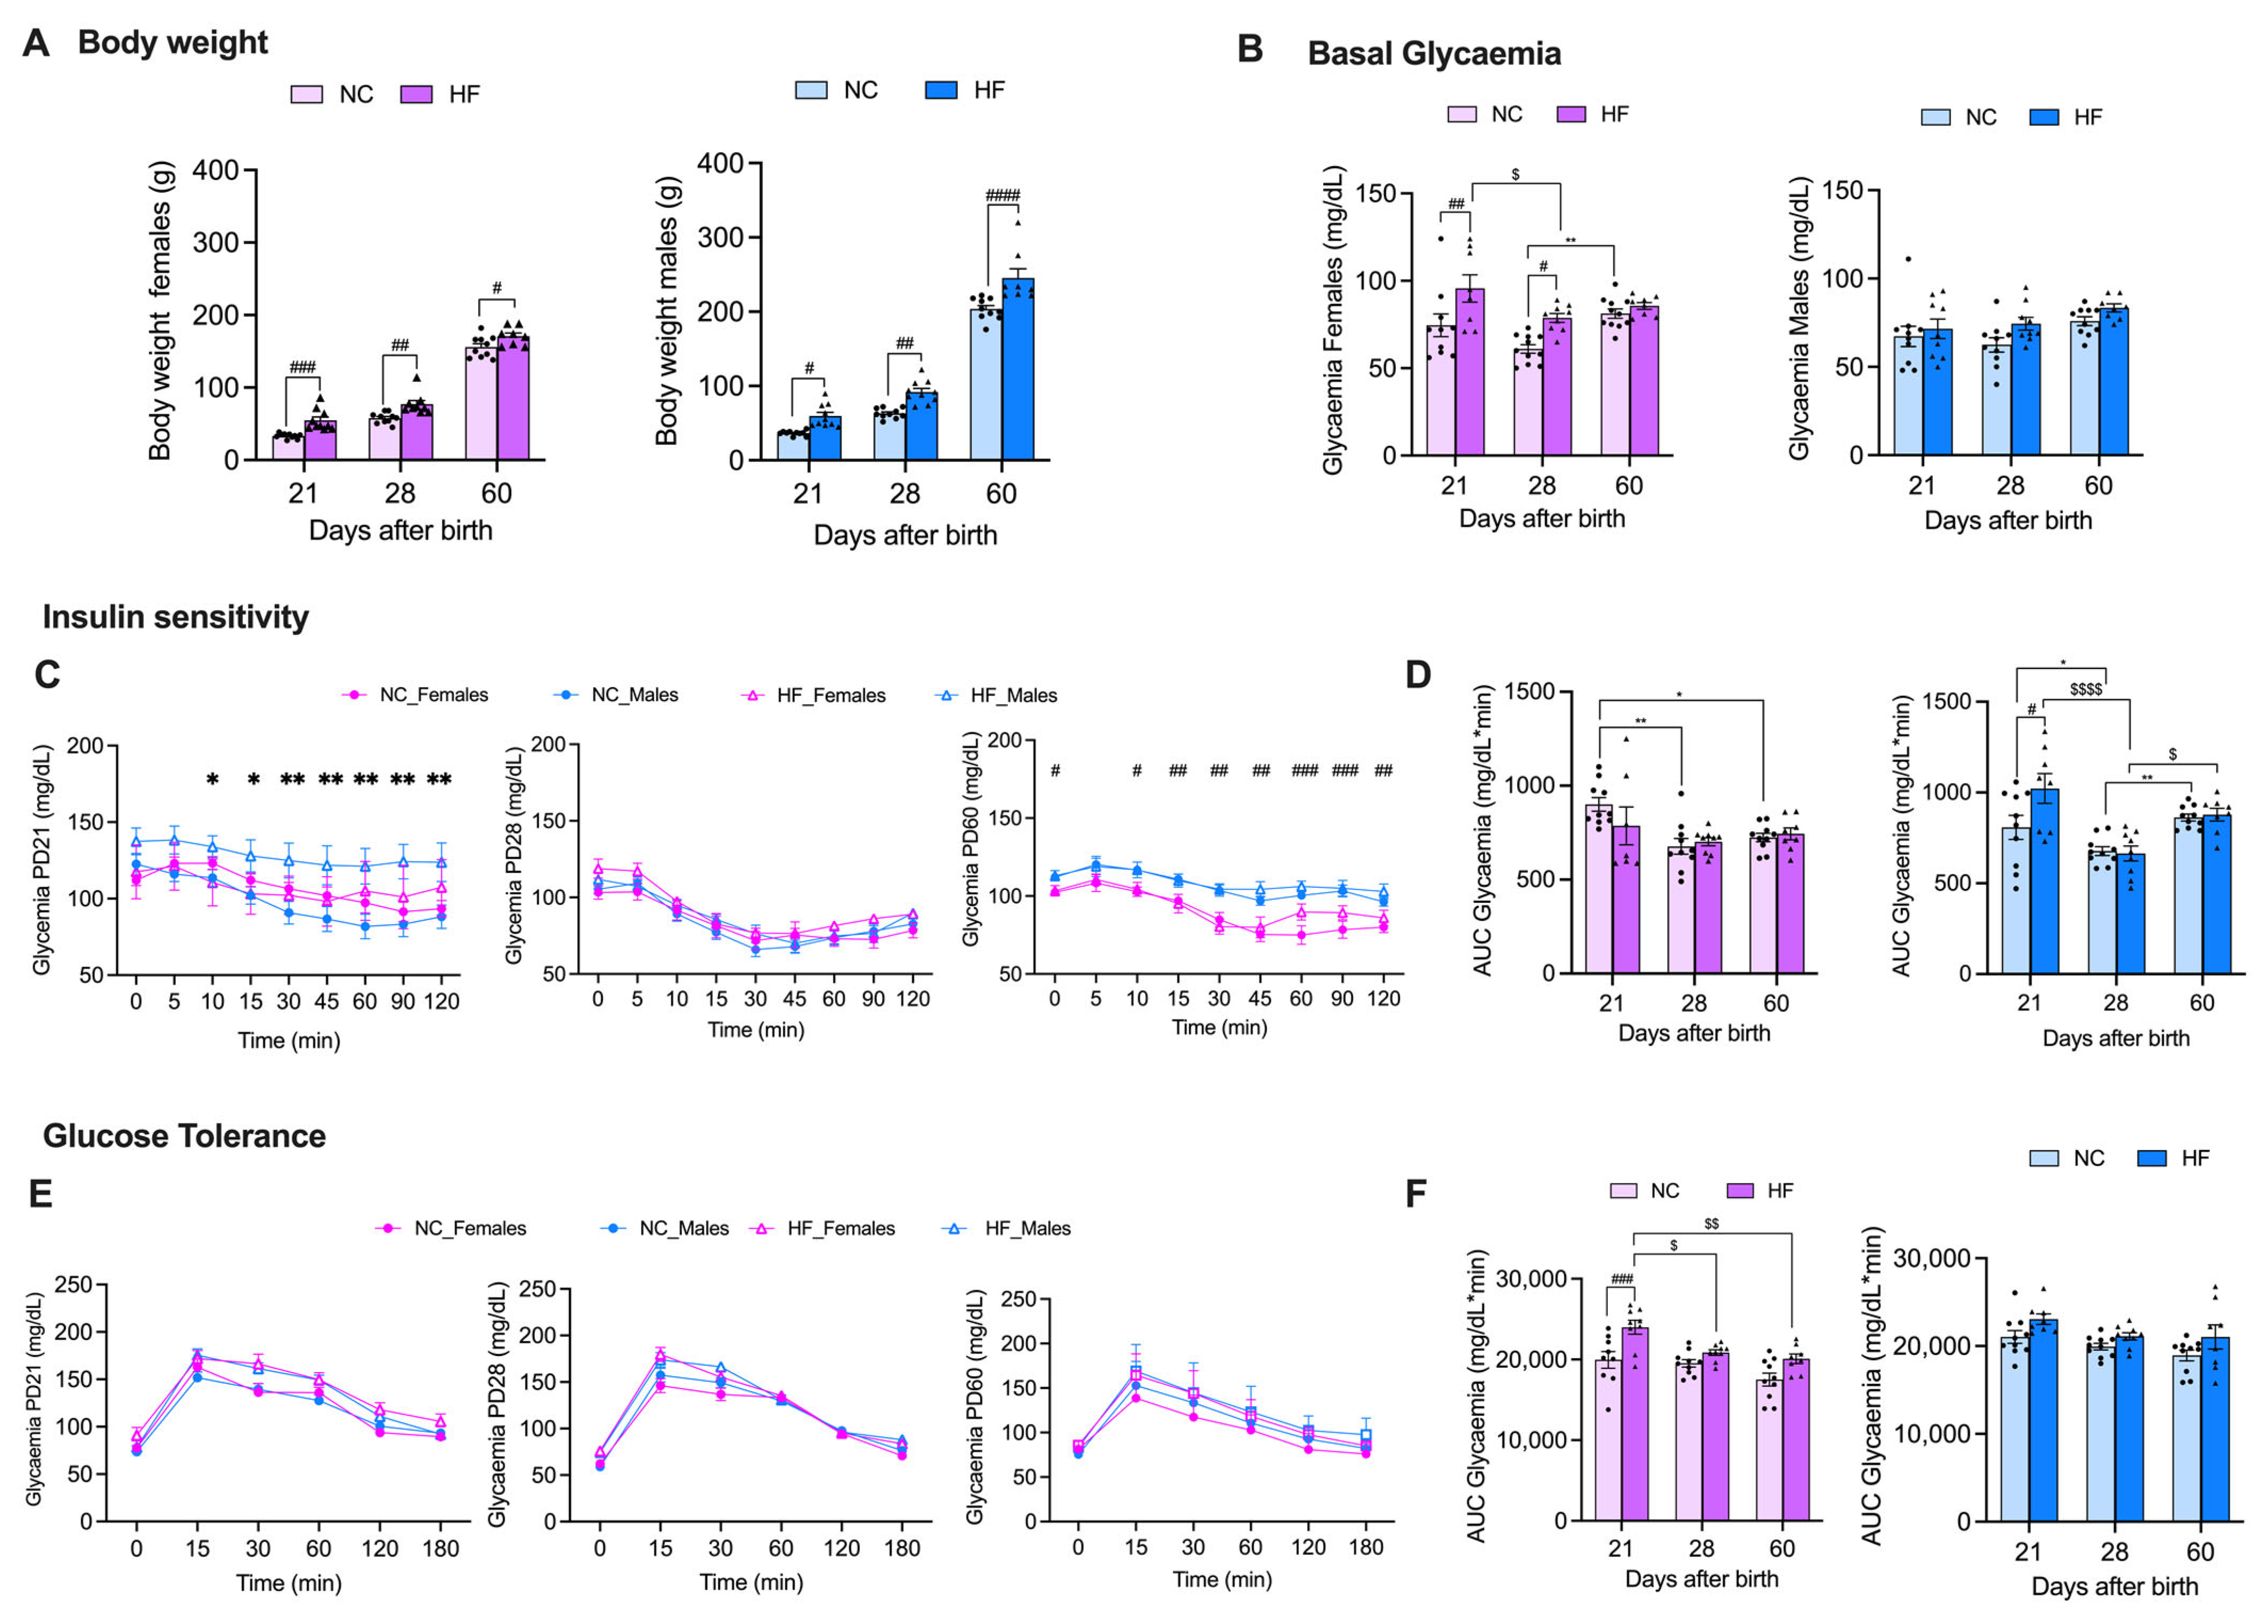
3.2. Effect of Overnutrition during Pregnancy and Lactation on Metabolic Function in the Offspring
3.2.1. Insulin Action and Glucose Homeostasis
3.2.2. Liver and Adipose Tissue Depots’ Weights
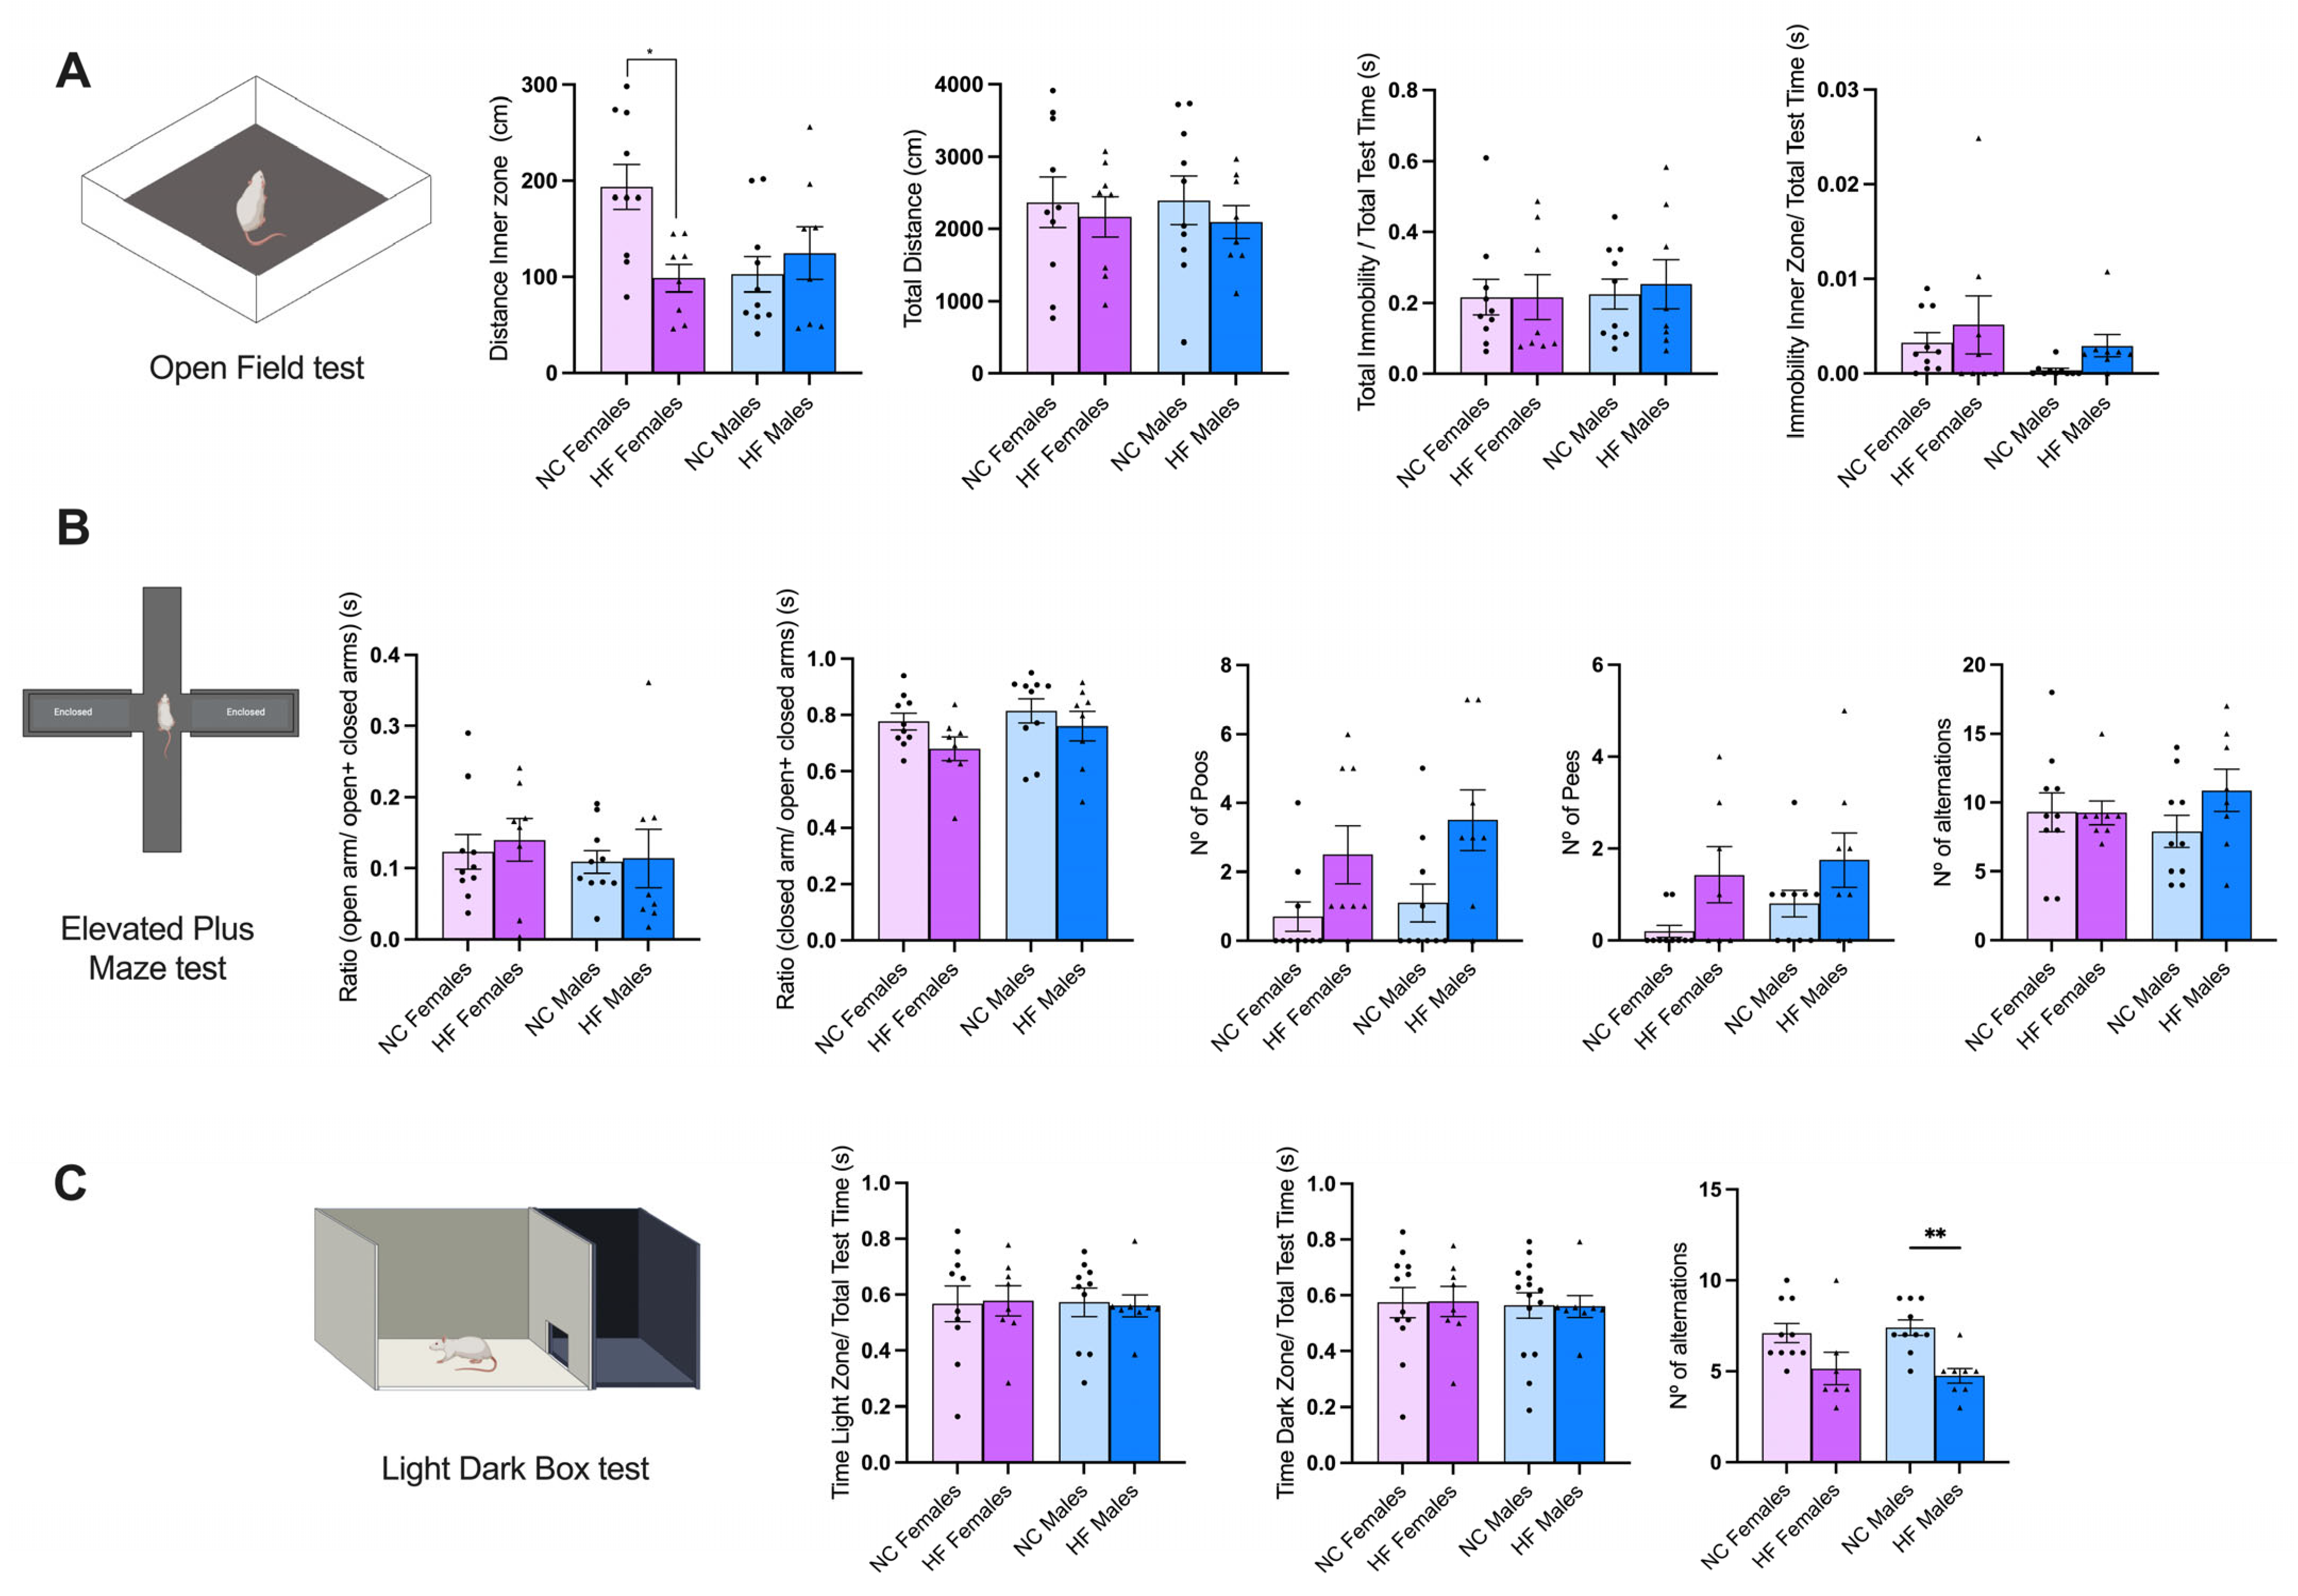
3.3. Effect of Overnutrition during Pregnancy and Lactation on Behavior Phenotype in the Offspring
3.3.1. Anxiety and Stress
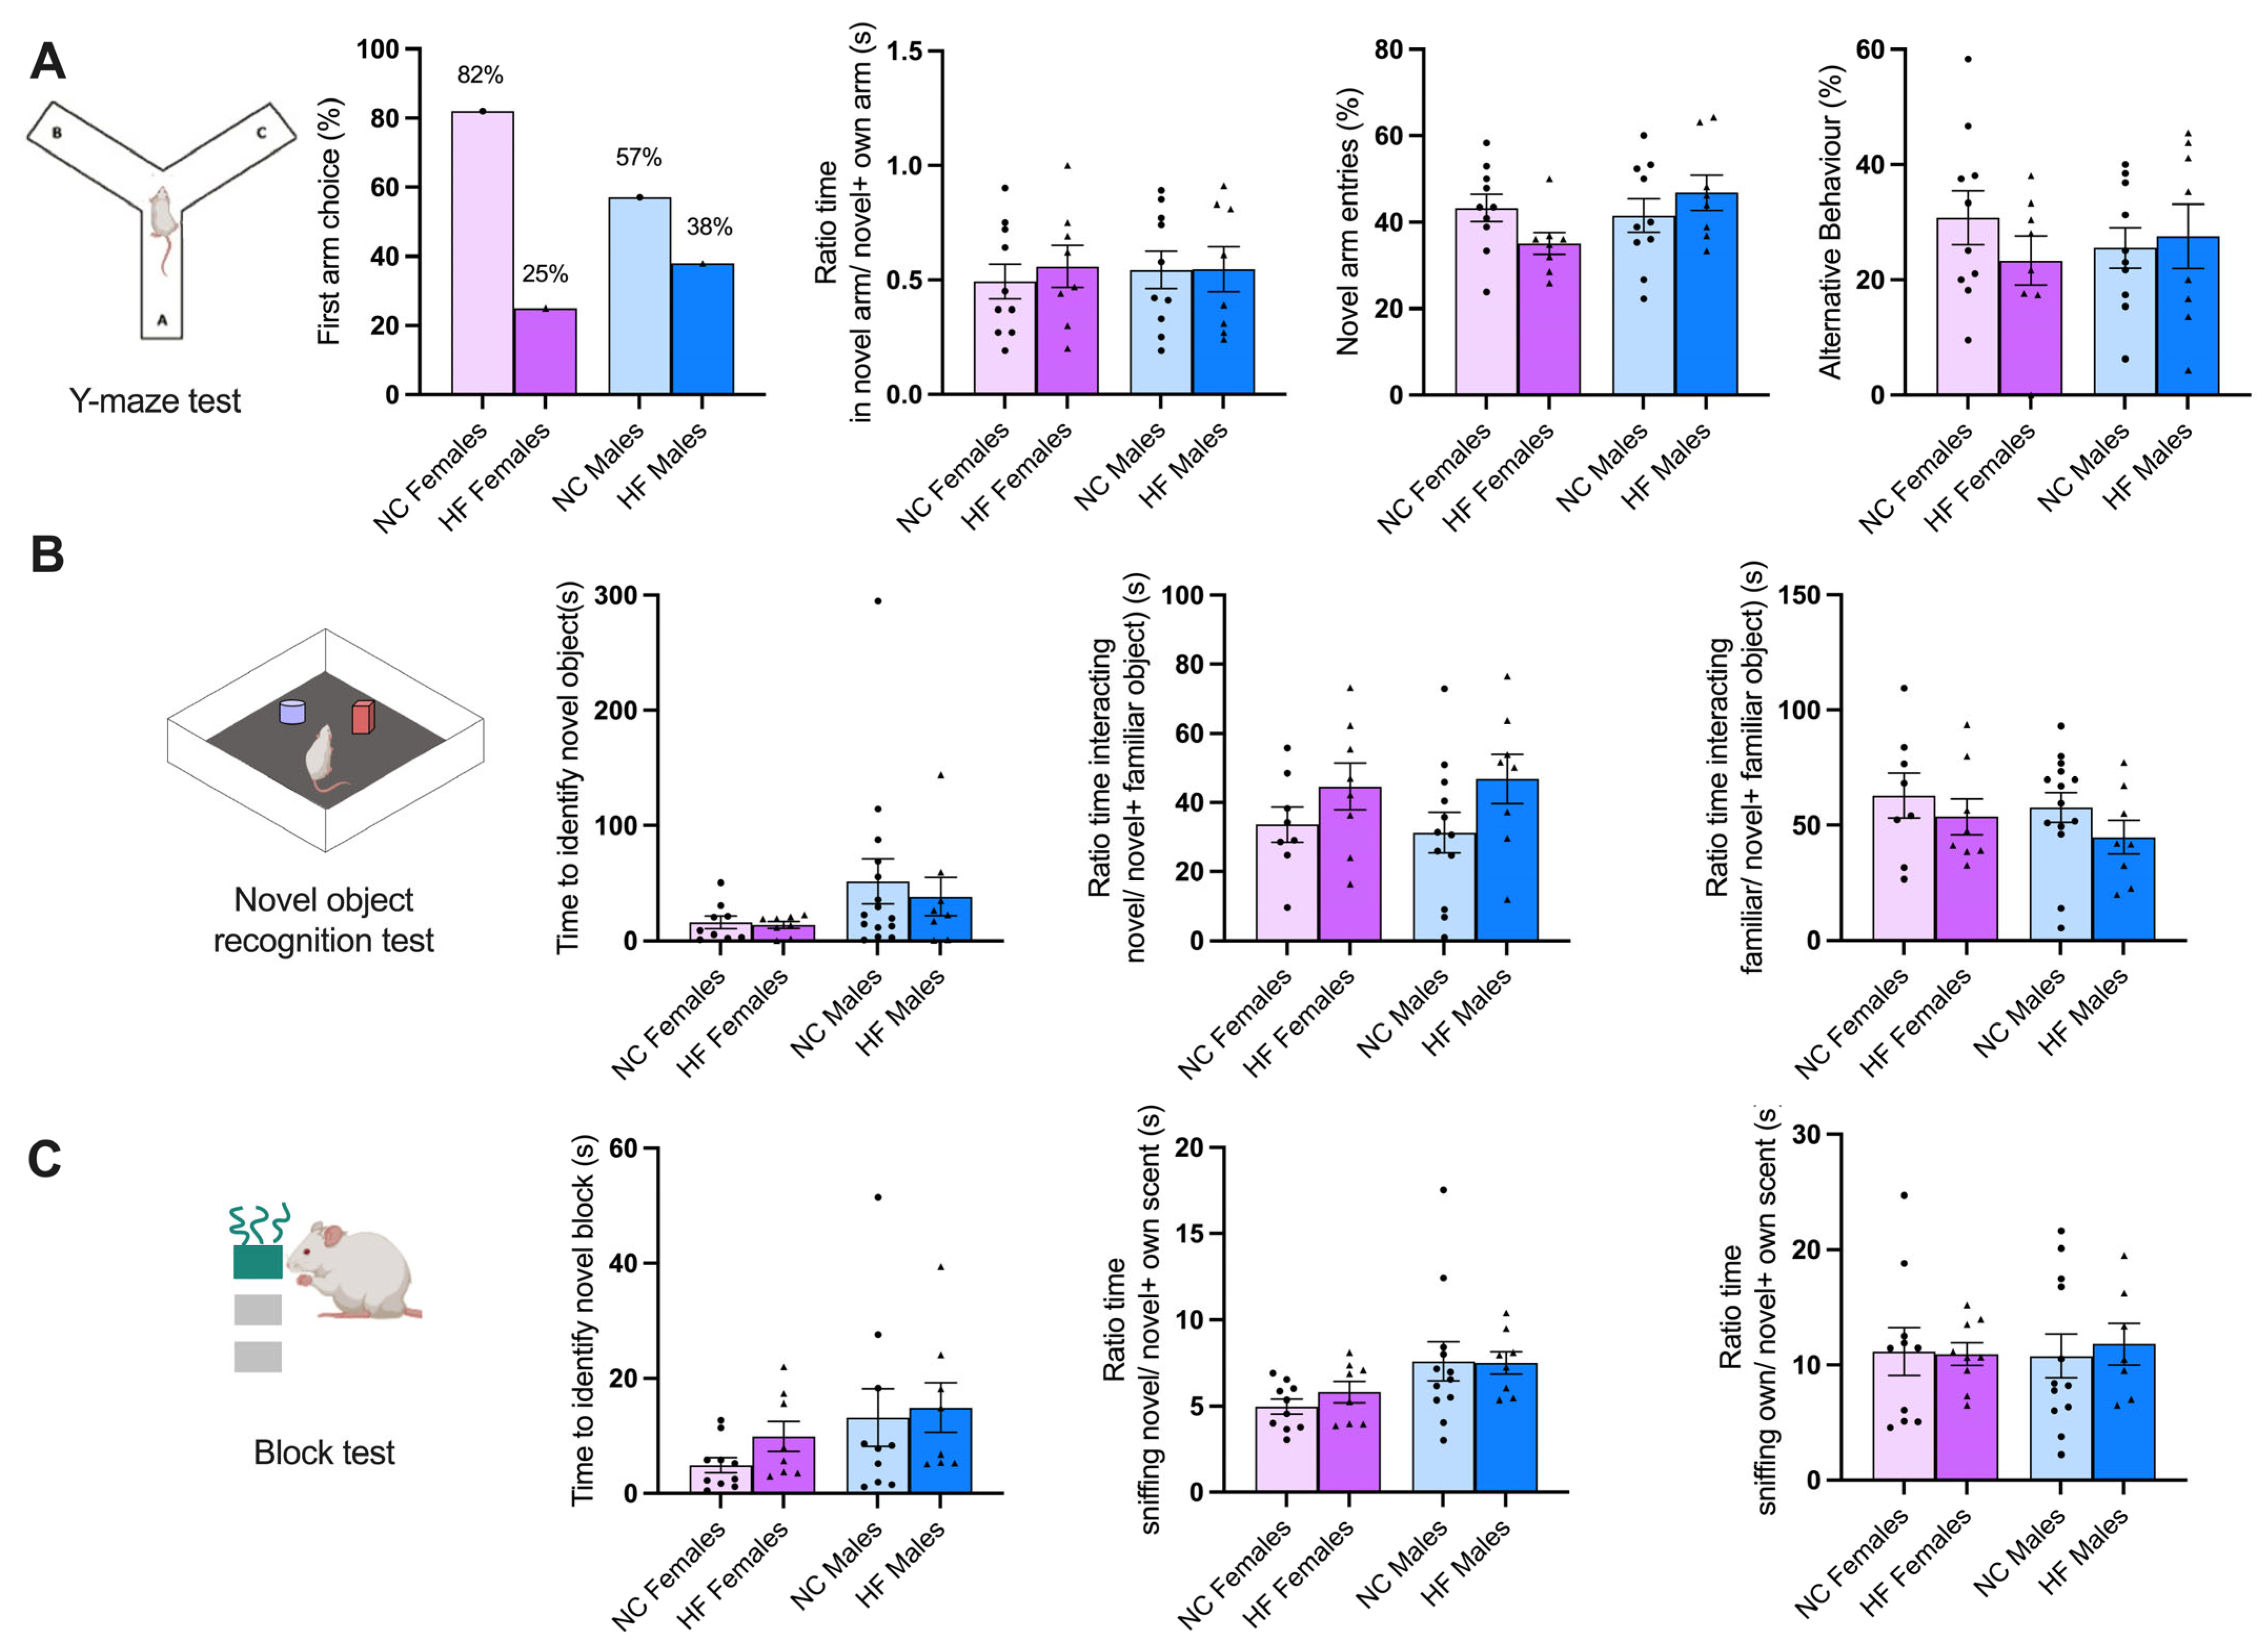
3.3.2. Memory and Learning
3.3.3. Food/Drink Behavior
3.4. Effect of Overnutrition during Pregnancy and Lactation on Hypothalamic, Hippocampal, and Prefrontal Markers of Synaptic Transmission, Metabolic Signaling, and Inflammation
3.4.1. Protein Markers of Synaptic Transmission on the Hypothalamus, Hippocampus, and Prefrontal Cortex
3.4.2. Protein Markers of Metabolism on the Hypothalamus, Hippocampus, and Prefrontal Cortex
3.4.3. Protein Markers of Inflammation on the Hypothalamus, Hippocampus, and Prefrontal Cortex
4. Discussion
4.1. Effect of Overnutrition during Pregnancy and Lactation on Metabolic Function in the Offspring
4.2. Effect of Overnutrition during Pregnancy and Lactation on Behavior and CNS Functions in the Offspring
5. Conclusions
Author Contributions
Funding
Institutional Review Board Statement
Informed Consent Statement
Data Availability Statement
Conflicts of Interest
References
- Alberti, K.G.M.M.; Eckel, R.H.; Grundy, S.M.; Zimmet, P.Z.; Cleeman, J.I.; Donato, K.A.; Fruchart, J.C.; James, W.P.T.; Loria, C.M.; Smith, S.C., Jr. International Diabetes Federation Task Force on Epidemiology and Prevention; Hational Heart, Lung, and Blood Institute; American Heart Association; World Heart Federation; International Atherosclerosis Society; International Association for the Study of Obesity. Harmonizing the metabolic syndrome: A joint interim statement of the international diabetes federation task force on epidemiology and prevention; National heart, lung, and blood institute; American heart association; World heart federation; International atherosclerosis society; And international association for the study of obesity. Circulation 2009, 120, 1640–1645. [Google Scholar] [CrossRef] [PubMed]
- Rojas, M.; Chávez-Castillo, M.; Pirela, D.; Parra, H.; Nava, M.; Chacín, M.; Angarita, L.; Añez, R.; Salazar, J.; Ortiz, R.; et al. Metabolic Syndrome: Is It Time to Add the Central Nervous System? Nutrients 2021, 13, 2254. [Google Scholar] [CrossRef] [PubMed]
- Barker, D.J.P. The origins of the developmental origins theory. J. Intern. Med. 2007, 261, 412–417. [Google Scholar] [CrossRef] [PubMed]
- Marciniak, A.; Patro-Małysza, J.; Kimber-Trojnar, Ż.; Marciniak, B.; Oleszczuk, J.; Leszczyńska-Gorzelak, B. Fetal programming of the metabolic syndrome. Taiwan. J. Obstet. Gynecol. 2017, 56, 133–138. [Google Scholar] [CrossRef] [PubMed]
- Edlow, A.G. Maternal obesity and neurodevelopmental and psychiatric disorders in offspring. Prenat. Diagn. 2017, 37, 95–110. [Google Scholar] [CrossRef] [PubMed]
- Hasebe, K.; Kendig, M.D.; Morris, M.J. Mechanisms Underlying the Cognitive and Behavioural Effects of Maternal Obesity. Nutrients 2021, 13, 240. [Google Scholar] [CrossRef] [PubMed]
- Jantsch, J.; Tassinari, I.D.; Giovenardi, M.; Bambini-Junior, V.; Guedes, R.P.; de Fraga, L.S. Mood Disorders Induced by Maternal Overnutrition: The Role of the Gut-Brain Axis on the Development of Depression and Anxiety. Front. Cell Dev. Biol. 2022, 10, 795384. [Google Scholar] [CrossRef]
- Mulligan, C.M.; Friedman, J.E. Maternal modifiers of the infant gut microbiota: Metabolic consequences. J. Endocrinol. 2017, 235, R1–R12. [Google Scholar] [CrossRef]
- Jašarević, E.; Howard, C.D.; Misic, A.M.; Beiting, D.P.; Bale, T.L. Stress during pregnancy alters temporal and spatial dynamics of the maternal and offspring microbiome in a sex-specific manner. Sci. Rep. 2017, 7, 44182. [Google Scholar] [CrossRef]
- Sousa, D.; Rocha, M.; Amaro, A.; Ferreira-Junior, M.D.; Cavalcante, K.V.N.; Monteiro-Alfredo, T.; Barra, C.; Rosendo-Silva, D.; Saavedra, L.P.J.; Magalhães, J.; et al. Exposure to Obesogenic Environments during Perinatal Development Modulates Offspring Energy Balance Pathways in Adipose Tissue and Liver of Rodent Models. Nutrients 2023, 15, 1281. [Google Scholar] [CrossRef]
- Patro, B.; Liber, A.; Zalewski, B.; Poston, L.; Szajewska, H.; Koletzko, B. Maternal and Paternal Body Mass Index and Offspring Obesity: A Systematic Review. Ann. Nutr. Metab. 2013, 63, 32–41. [Google Scholar] [CrossRef] [PubMed]
- Amaro, A.; Baptista, F.I.; Matafome, P. Programming of future generations during breastfeeding: The intricate relation between metabolic and neurodevelopment disorders. Life Sci. 2022, 298, 120526. [Google Scholar] [CrossRef] [PubMed]
- Leddy, M.A.; Power, M.L.; Schulkin, J. The Impact of Maternal Obesity on Maternal and Fetal Health. Rev. Obstet. Gynecol. 2008, 1, 170. [Google Scholar] [PubMed]
- Hyatt, H.W.; Zhang, Y.; Hood, W.R.; Kavazis, A.N. Lactation has persistent effects on a mother’s metabolism and mitochondrial function. Sci. Rep. 2017, 7, 17118. [Google Scholar] [CrossRef] [PubMed]
- Mezei, G.C.; Ural, S.H.; Hajnal, A. Differential Effects of Maternal High Fat Diet During Pregnancy and Lactation on Taste Preferences in Rats. Nutrients 2020, 12, 3553. [Google Scholar] [CrossRef] [PubMed]
- Gautier, A.; Bonnet, F.; Dubois, S.; Massart, C.; Grosheny, C.; Bachelot, A.; Aubé, C.; Balkau, B.; Ducluzeau, P. Associations between visceral adipose tissue, inflammation and sex steroid concentrations in men. Clin. Endocrinol. 2013, 78, 373–378. [Google Scholar] [CrossRef] [PubMed]
- Kokras, N.; Dalla, C. Preclinical sex differences in depression and antidepressant response: Implications for clinical research. J. Neurosci. Res. 2017, 95, 731–736. [Google Scholar] [CrossRef]
- Monzillo, L.U.; Hamdy, O. Evaluation of Insulin Sensitivity in Clinical Practice and in Research Settings. Nutr. Rev. 2003, 61, 397–412. [Google Scholar] [CrossRef]
- Ribeiro, M.J.; Sacramento, J.F.; Gonzalez, C.; Guarino, M.P.; Monteiro, E.C.; Conde, S.V. Carotid Body Denervation Prevents the Development of Insulin Resistance and Hypertension Induced by Hypercaloric Diets. Diabetes 2013, 62, 2905–2916. [Google Scholar] [CrossRef]
- Seibenhener, M.L.; Wooten, M.C. Use of the open field maze to measure locomotor and anxiety-like behavior in mice. J. Vis. Exp. 2015, 96, e52434. [Google Scholar] [CrossRef]
- Lehmkuhl, A.M.; Dirr, E.R.; Fleming, S.M. Olfactory Assays for Mouse Models of Neurodegenerative Disease. J. Vis. Exp. 2014, 90, e51804. [Google Scholar] [CrossRef]
- Wolf, A.; Bauer, B.; Abner, E.L.; Ashkenazy-Frolinger, T.; Hartz, A.M.S. A Comprehensive Behavioral Test Battery to Assess Learning and Memory in 129S6/Tg2576 Mice. PLoS ONE 2016, 11, e0147733. [Google Scholar] [CrossRef] [PubMed]
- Kennedy, M.B. Synaptic Signaling in Learning and Memory. Cold Spring Harb. Perspect. Biol. 2016, 8, a016824. [Google Scholar] [CrossRef] [PubMed]
- Borrow, A.P.; Stranahan, A.M.; Suchecki, D.; Yunes, R. Neuroendocrine Regulation of Anxiety: Beyond the Hypothalamic-Pituitary-Adrenal Axis. J. Neuroendocr. 2016, 28. [Google Scholar] [CrossRef] [PubMed]
- Sun, Y.; Koyama, Y.; Shimada, S. Inflammation from Peripheral Organs to the Brain: How Does Systemic Inflammation Cause Neuroinflammation? Front. Aging Neurosci. 2022, 14, 903455. [Google Scholar] [CrossRef] [PubMed]
- Won, E.; Kim, Y.-K. Neuroinflammation-Associated Alterations of the Brain as Potential Neural Biomarkers in Anxiety Disorders. Int. J. Mol. Sci. 2020, 21, 6546. [Google Scholar] [CrossRef] [PubMed]
- Neniskyte, U.; Vilalta, A.; Brown, G.C. Tumour necrosis factor alpha-induced neuronal loss is mediated by microglial phagocytosis. FEBS Lett. 2014, 588, 2952–2956. [Google Scholar] [CrossRef]
- McGregor, B.A.; Schommer, J.; Guo, K.; Raihan, M.O.; Ghribi, O.; Hur, J.; Porter, J.E. Corrigendum to ‘Alpha-Synuclein-induced DNA Methylation and Gene Expression in Microglia. Neuroscience 2021, 468, 186–198. [Google Scholar] [CrossRef]
- Boberg, J.; Li, T.; Christiansen, S.; Draskau, M.K.; Damdimopoulou, P.; Svingen, T.; Johansson, H.K.L. Comparison of female rat reproductive effects of pubertal versus adult exposure to known endocrine disruptors. Front. Endocrinol. 2023, 14, 1126485. [Google Scholar] [CrossRef]
- Sanchez-Garrido, M.A.; Ruiz-Pino, F.; Pozo-Salas, A.I.; Castellano, J.M.; Vazquez, M.J.; Luque, R.M.; Tena-Sempere, M. Early overnutrition sensitizes the growth hormone axis to the impact of diet-induced obesity via sex-divergent mechanisms. Sci. Rep. 2020, 10, 13898. [Google Scholar] [CrossRef]
- Şanlı, E.; Kabaran, S. Maternal Obesity, Maternal Overnutrition and Fetal Programming: Effects of Epigenetic Mechanisms on the Development of Metabolic Disorders. Curr. Genom. 2019, 20, 419–427. [Google Scholar] [CrossRef] [PubMed]
- Bianco, M.E.; Josefson, J.L. Hyperglycemia During Pregnancy and Long-Term Offspring Outcomes. Curr. Diabetes Rep. 2019, 19, 143. [Google Scholar] [CrossRef] [PubMed]
- Rosen, E.D.; Kaestner, K.H.; Natarajan, R.; Patti, M.-E.; Sallari, R.; Sander, M.; Susztak, K. Epigenetics and Epigenomics: Implications for Diabetes and Obesity. Diabetes 2018, 67, 1923–1931. [Google Scholar] [CrossRef] [PubMed]
- Shou, J.; Chen, P.-J.; Xiao, W.-H. Mechanism of increased risk of insulin resistance in aging skeletal muscle. Diabetol. Metab. Syndr. 2020, 12, 14. [Google Scholar] [CrossRef]
- Nicholas, L.M.; Nagao, M.; Kusinski, L.C.; Fernandez-Twinn, D.S.; Eliasson, L.; Ozanne, S.E. Exposure to maternal obesity programs sex differences in pancreatic islets of the offspring in mice. Diabetologia 2020, 63, 324–337. [Google Scholar] [CrossRef]
- Eitmann, S.; Németh, D.; Hegyi, P.; Szakács, Z.; Garami, A.; Balaskó, M.; Solymár, M.; Erőss, B.; Kovács, E.; Pétervári, E. Maternal overnutrition impairs offspring’s insulin sensitivity: A systematic review and meta-analysis. Matern. Child Nutr. 2020, 16, e13031. [Google Scholar] [CrossRef]
- Melo, B.F.; Sacramento, J.F.; Capucho, A.M.; Sampaio-Pires, D.; Prego, C.S.; Conde, S.V. Long-Term Hypercaloric Diet Consumption Exacerbates Age-Induced Dysmetabolism and Carotid Body Dysfunction: Beneficial Effects of CSN Denervation. Front. Physiol. 2022, 13, 889660. [Google Scholar] [CrossRef]
- Desai, M.; Han, G.; Mossayebi, E.; Beall, M.H.; Ross, M.G. 552: Programmed insulin resistance of offspring of obese mothers. Am. J. Obstet. Gynecol. 2017, 216, S325–S326. [Google Scholar] [CrossRef][Green Version]
- Mingrone, G.; Manco, M.; Mora, M.E.V.; Guidone, C.; Iaconelli, A.; Gniuli, D.; Leccesi, L.; Chiellini, C.; Ghirlanda, G. Influence of Maternal Obesity on Insulin Sensitivity and Secretion in Offspring. Diabetes Care 2008, 31, 1872–1876. [Google Scholar] [CrossRef]
- van den Beld, A.W.; Kaufman, J.-M.; Zillikens, M.C.; Lamberts, S.W.J.; Egan, J.M.; Van Der Lely, A.J. The physiology of endocrine systems with ageing. Lancet Diabetes Endocrinol. 2018, 6, 647–658. [Google Scholar] [CrossRef]
- Kawasaki, M.; Arata, N.; Miyazaki, C.; Mori, R.; Kikuchi, T.; Ogawa, Y.; Ota, E. Obesity and abnormal glucose tolerance in offspring of diabetic mothers: A systematic review and meta-analysis. PLoS ONE 2018, 13, e0190676. [Google Scholar] [CrossRef] [PubMed]
- Xiang, A.; Carter, S.A.; Lin, J.C.; Chow, T.; Martinez, M.P.; Alves, J.M.; Page, K.A.; Mcconnell, R.; Negriff, S. 251-OR: Maternal Diabetes during Pregnancy and Incidence of Depression and Anxiety in Offspring from Childhood to Young Adulthood. Diabetes 2022, 71 (Suppl. S1), 251-OR. [Google Scholar] [CrossRef]
- Aslani, S.; Vieira, N.; Marques, F.; Costa, P.S.; Sousa, N.; Palha, J.A. The effect of high-fat diet on rat’s mood, feeding behavior and response to stress. Transl. Psychiatry 2015, 5, e684. [Google Scholar] [CrossRef] [PubMed]
- Daniels, R.W.; Miller, B.R.; DiAntonio, A. Increased vesicular glutamate transporter expression causes excitotoxic neurodegeneration. Neurobiol. Dis. 2011, 41, 415–420. [Google Scholar] [CrossRef] [PubMed]
- Sohrabji, F. Guarding the blood–brain barrier: A role for estrogen in the etiology of neurodegenerative disease. Gene Expr. 2006, 13, 311–319. [Google Scholar] [CrossRef] [PubMed]
- Glendining, K.A.; Fisher, L.C.; Jasoni, C.L. Maternal high fat diet alters offspring epigenetic regulators, amygdala glutamatergic profile and anxiety. Psychoneuroendocrinology 2018, 96, 132–141. [Google Scholar] [CrossRef] [PubMed]
- Erbas, O.; Erdogan, M.A.; Khalilnezhad, A.; Gürkan, F.T.; Yiğittürk, G.; Meral, A.; Taskiran, D. Neurobehavioral effects of long-term maternal fructose intake in rat offspring. Int. J. Dev. Neurosci. 2018, 69, 68–79. [Google Scholar] [CrossRef]
- Qi, Y.; Lee, N.J.; Ip, C.K.; Enriquez, R.; Tasan, R.; Zhang, L.; Herzog, H. Agrp-negative arcuate NPY neurons drive feeding under positive energy balance via altering leptin responsiveness in POMC neurons. Cell Metab. 2023, 35, 979–995.e7. [Google Scholar] [CrossRef]
- Qu, N.; He, Y.; Wang, C.; Xu, P.; Yang, Y.; Cai, X.; Liu, H.; Yu, K.; Pei, Z.; Hyseni, I.; et al. A POMC-originated circuit regulates stress-induced hypophagia, depression, and anhedonia. Mol. Psychiatry 2020, 25, 1006–1021. [Google Scholar] [CrossRef]
- Greenman, Y.; Kuperman, Y.; Drori, Y.; Asa, S.L.; Navon, I.; Forkosh, O.; Gil, S.; Stern, N.; Chen, A. Postnatal Ablation of POMC Neurons Induces an Obese Phenotype Characterized by Decreased Food Intake and Enhanced Anxiety-like Behavior. Mol. Endocrinol. 2013, 27, 1091–1102. [Google Scholar] [CrossRef]
- Reichmann, F.; Holzer, P. Neuropeptide Y: A stressful review. Neuropeptides 2016, 55, 99–109. [Google Scholar] [CrossRef] [PubMed]
- Ono, H. Molecular Mechanisms of Hypothalamic Insulin Resistance. Int. J. Mol. Sci. 2019, 20, 1317. [Google Scholar] [CrossRef] [PubMed]
- Esler, M.; Rumantir, M.; Wiesner, G.; Kaye, D.; Hastings, J.; Lambert, G. Sympathetic nervous system and insulin resistance: From obesity to diabetes. Am. J. Hypertens. 2001, 14, S304–S309. [Google Scholar] [CrossRef] [PubMed]
- Wang, B.; Cheng, K.K.-Y. Hypothalamic AMPK as a Mediator of Hormonal Regulation of Energy Balance. Int. J. Mol. Sci. 2018, 19, 3552. [Google Scholar] [CrossRef] [PubMed]
- Kola, B. Role of AMP-Activated Protein Kinase in the Control of Appetite. J. Neuroendocr. 2008, 20, 942–951. [Google Scholar] [CrossRef] [PubMed]
- Mihaylova, M.M.; Shaw, R.J. The AMPK signalling pathway coordinates cell growth, autophagy and metabolism. Nature 2011, 13, 1016–1023. [Google Scholar] [CrossRef] [PubMed]
- Liu, Y.-Z.; Wang, Y.-X.; Jiang, C.-L. Inflammation: The Common Pathway of Stress-Related Diseases. Front. Hum. Neurosci. 2017, 11, 316. [Google Scholar] [CrossRef] [PubMed]
- Burch, K.E.; McCracken, K.; Buck, D.J.; Davis, R.L.; Sloan, D.K.; Curtis, K.S. Relationship Between Circulating Metabolic Hormones and Their Central Receptors During Ovariectomy-Induced Weight Gain in Rats. Front. Physiol. 2022, 12, 800266. [Google Scholar] [CrossRef]
- Fagundes, C.P.; Bennett, J.M.; Derry, H.M.; Kiecolt-Glaser, J.K. Relationships and Inflammation across the Lifespan: Social Developmental Pathways to Disease. Soc. Personal. Psychol. Compass. 2011, 5, 891–903. [Google Scholar] [CrossRef]
- Humberg, A.; Fortmann, I.; Siller, B.; Kopp, M.V.; Herting, E.; Göpel, W.; Härtel, C. Preterm birth and sustained inflammation: Consequences for the neonate Network, German Center for Lung Research and Priming Immunity at the beginning of life (PRIMAL) Consortium. Semin. Immunopathol. 2020, 42, 451–468. [Google Scholar] [CrossRef]
- Schultz, C.; Temming, P.; Bucsky, P.; Göpel, W.; Strunk, T.; Härtel, C. Immature anti-inflammatory response in neonates. Clin. Exp. Immunol. 2003, 135, 130–136. [Google Scholar] [CrossRef] [PubMed]
- Sasaki, A.; de Vega, W.; Sivanathan, S.; St-Cyr, S.; McGowan, P. Maternal high-fat diet alters anxiety behavior and glucocorticoid signaling in adolescent offspring. Neuroscience 2014, 272, 92–101. [Google Scholar] [CrossRef] [PubMed]
- Martin, H.; Mounsey, R.; Sathe, K.; Mustafa, S.; Nelson, M.; Evans, R.; Teismann, P. A peroxisome proliferator-activated receptor-δ agonist provides neuroprotection in the 1-methyl-4-phenyl-1,2,3,6-tetrahydropyridine model of Parkinson’s disease. Neuroscience 2013, 240, 191–203. [Google Scholar] [CrossRef] [PubMed]
 —female;
  —male.
—female; —male.
—male.
—female; —male.


| NC Mothers | HF Mothers | |
|---|---|---|
| Body Weight (g) | 243.2 ± 5.122 | 236.8 ± 2.577 |
| Basal Glycaemia (mg/dL) | 69.14 ± 1.792 | 78.88 ± 3.573 * |
| kITT (% glucose/min) | 4.864 ± 0.3957 | 1.849 ± 0.3188 **** |
| AUC Glycaemia (mg/dL·min) | 18,138 ± 417.4 | 19,612 ± 594.9 |
| Liver (g/kg) | 0.0280 ± 0.001 | 0.0289 ± 0.001 |
| Visceral Adipose Tissue (g/kg) | 0.0057 ± 0.002 | 0.0066 ± 0.002 |
| Perinephric Adipose Tissue (g/kg) | 0.0153 ± 0.002 | 0.0171 ± 0.004 |
| Genital Adipose Tissue (g/kg) | 0.0232 ± 0.002 | 0.0254 ± 0.002 |
| Brown Adipose Tissue (g/kg) | 0.0007 ± 0.000 | 0.0016 ± 0.000 |
| Liver | Visceral AT | Perinephric AT | Genital AT | Brown AT | |
|---|---|---|---|---|---|
| NC Females PD21 | 0.963 ± 0.066 | 0.262 ± 0.026 | 0.105 ± 0.017 | 0.128 ± 0.015 | 0.087 ± 0.010 |
| HF Females PD21 | 1.646 ± 0.139 | 0.278 ± 0.039 | 0.222 ± 0.026 | 0.318 ± 0.098 | 0.130 ± 0.021 |
| NC Females PD28 | 0.978 ± 0.056 | 0.257 ± 0.021 | 0.139 ± 0.012 | 0.114 ± 0.012 | 0.103 ± 0.009 |
| HF Females PD28 | 1.965 ± 0.115 | 0.344 ± 0.042 | 0.303 ± 0.053 | 0.286 ± 0.050 | 0.143 ± 0.015 |
| NC Females PD60 | 1.892 ± 0.118 | 0.406 ± 0.038 | 0.196 ± 0.017 | 0.214 ± 0.033 | 0.135 ± 0.009 |
| HF Females PD60 | 2.670 ± 0.158 | 0.527 ± 0.055 *** | 0.374 ± 0.068 ** | 0.472 ± 0.075 | 0.139 ± 0.010 |
| NC Males PD21 | 2.286 ± 0.086 | 0.376 ± 0.042 | 0.376 ± 0.059 | 0.305 ± 0.033 | 0.146 ± 0.016 |
| HF Males PD21 | 2.717 ± 0.126 ** | 0.561 ± 0.043 | 0.472 ± 0.042 | 0.528 ± 0.054 | 0.144 ± 0.012 |
| NC Males PD28 | 4.872 ± 0.405 | 1.029 ± 0.135 | 1.109 ± 0.212 | 1.993 ± 0.405 | 0.249 ± 0.025 |
| HF Males PD28 | 4.566 ± 0.178 | 1.472 ± 0.065 | 1.879 ± 0.281 | 2.183 ± 0.386 | 0.226 ± 0.026 |
| NC Males PD60 | 6.377 ± 0.326 | 1.216 ± 0.182 | 2.599 ± 0.381 | 2.324 ± 0.375 | 0.269 ± 0.025 |
| HF Males PD60 | 7.218 ± 0.465 * | 1.864 ± 0.152 ** | 3.162 ± 0.422 | 3.642 ± 0.503 ** | 0.284 ± 0.026 |
Disclaimer/Publisher’s Note: The statements, opinions and data contained in all publications are solely those of the individual author(s) and contributor(s) and not of MDPI and/or the editor(s). MDPI and/or the editor(s) disclaim responsibility for any injury to people or property resulting from any ideas, methods, instructions or products referred to in the content. |
© 2023 by the authors. Licensee MDPI, Basel, Switzerland. This article is an open access article distributed under the terms and conditions of the Creative Commons Attribution (CC BY) license (https://creativecommons.org/licenses/by/4.0/).
Share and Cite
Melo, G.M.; Capucho, A.M.; Sacramento, J.F.; Ponce-de-Leão, J.; Fernandes, M.V.; Almeida, I.F.; Martins, F.O.; Conde, S.V. Overnutrition during Pregnancy and Lactation Induces Gender-Dependent Dysmetabolism in the Offspring Accompanied by Heightened Stress and Anxiety. Nutrients 2024, 16, 67. https://doi.org/10.3390/nu16010067
Melo GM, Capucho AM, Sacramento JF, Ponce-de-Leão J, Fernandes MV, Almeida IF, Martins FO, Conde SV. Overnutrition during Pregnancy and Lactation Induces Gender-Dependent Dysmetabolism in the Offspring Accompanied by Heightened Stress and Anxiety. Nutrients. 2024; 16(1):67. https://doi.org/10.3390/nu16010067
Chicago/Turabian StyleMelo, Gonçalo M., Adriana M. Capucho, Joana F. Sacramento, José Ponce-de-Leão, Marcos V. Fernandes, Inês F. Almeida, Fátima O. Martins, and Silvia V. Conde. 2024. "Overnutrition during Pregnancy and Lactation Induces Gender-Dependent Dysmetabolism in the Offspring Accompanied by Heightened Stress and Anxiety" Nutrients 16, no. 1: 67. https://doi.org/10.3390/nu16010067
APA StyleMelo, G. M., Capucho, A. M., Sacramento, J. F., Ponce-de-Leão, J., Fernandes, M. V., Almeida, I. F., Martins, F. O., & Conde, S. V. (2024). Overnutrition during Pregnancy and Lactation Induces Gender-Dependent Dysmetabolism in the Offspring Accompanied by Heightened Stress and Anxiety. Nutrients, 16(1), 67. https://doi.org/10.3390/nu16010067