Abstract
(1) Background: Muscle loss is associated with frailty and a reduction in physical strength and performance, which is caused by increased oxidative stress. Ginger (Zingiber officinale Roscoe) is a potential herb that can be used to reduce the level of oxidative stress. This study aimed to determine the effect of ginger on the expression of metabolites and their metabolic pathways in the myoblast cells to elucidate the mechanism involved and its pharmacological properties in promoting myoblast differentiation. (2) Methods: The myoblast cells were cultured into three stages (young, pre-senescent and senescent). At each stage, the myoblasts were treated with different concentrations of ginger extract. Then, metabolomic analysis was performed using liquid chromatography-tandem mass spectrometry (LCMS/MS). (3) Results: Nine metabolites were decreased in both the pre-senescent and senescent control groups as compared to the young control group. For the young ginger-treated group, 8-shogaol and valine were upregulated, whereas adipic acid and bis (4-ethyl benzylidene) sorbitol were decreased. In the pre-senescent ginger-treated group, the niacinamide was upregulated, while carnitine and creatine were downregulated. Ginger treatment in the senescent group caused a significant upregulation in 8-shogaol, octadecanamide and uracil. (4) Conclusions: Ginger extract has the potential as a pharmacological agent to reduce muscle loss in skeletal muscle by triggering changes in some metabolites and their pathways that could promote muscle regeneration in ageing.
1. Introduction
The world’s ageing population continues to rise at an unprecedented rate. According to Roberts et al. [1], the number of individuals aged 65 years old and above is expected to increase to 1.6 billion by the year 2050. Ageing is characterised by changes in physiological function and a decrease in the immune system, which later results in age-associated diseases such as diabetes, cancer, cardiovascular disease and sarcopenia [2]. Muscle loss, also known as sarcopenia, is one of the major diseases usually associated with ageing people aged 60 years old and above [3]. Sarcopenia is depicted by three characteristics, which are loss of muscle mass, decrease in muscle strength and decline in physical activities [3]. Deterioration in muscle later can contribute to a higher chance of frailty, limit physical activities and increase in the disability among elderly [4].
Oxidative stress is one of the major factors that contribute to muscle loss [5]. Oxidative stress occurs when there is an imbalance between reactive oxygen species (ROS) and antioxidants in the body [6]. ROS consist of superoxide radical (O2·-), hydroxyl radical (·OH), hydrogen peroxide (H2O2), peroxyl radical (ROO.), hydroperoxyl radical (HOO.) and ozone [7]. In general, muscles consume a higher level of oxygen as compared to other organs, which later leads to the existence of high oxidative stress [8]. The presence of a high level of ROS in muscle contributes to the dysfunction of mitochondria and damage in macromolecules (DNA, protein and lipid) and induces cell apoptosis [9]. It also causes an imbalance between protein synthesis and breakdown, which then leads to muscle loss and atrophy [10].
However, this problem can be prevented by practicing a healthy lifestyle. Muscle loss in the older population can be reduced through exercise and the practice of a healthy eating style [11,12]. Tohma et al. [13] have reported that antioxidant-rich food can reduce the level of oxidative stress as well as prevent diseases related to oxidative stress. Ginger (Zingiber officinale Roscoe) is one of the medicinal herbs that can act as an antioxidant agent [14]. The ginger plant comes from the family Zingiberaceae and genus Zingiber. This plant can be found around the subtropical area, tropical Asia, Africa, east Asia, China and India [15]. Ginger extract is not only used as a spice in cooking but also as traditional medicine for many types of diseases including cough, vomiting, nausea and digestive treatment [16]. Ginger consists of several active compounds such as 6-gingerol, 6-shogaol, 10-gingerol, 8-shogaol and paradols [15], which exhibited various types of therapeutic effects. Previous studies have reported that this ginger extract has been proven to act as an antibacterial [17], anticancer [18], anti-inflammatory [19] and antioxidant agent [14].
Metabolomics study is one branch of the omics study that has been used for elucidating the metabolome changes in a complex process. Meanwhile, the metabolite is referred to as the end product of cellular processes, which are affected by lifestyle, environment and genetic changes. Several studies have reported metabolomic changes in aged skeletal muscle. A study performed by Uchitomi et al. [20] reported that there were several metabolism changes that occurred in aged skeletal muscle, including glucose metabolism, phospholipid metabolism and polyamine metabolism. These changes have contributed to the loss of skeletal muscle mass and function in aged mice. Dabaj et al. [21] found that seven metabolites including glycerophosphocholine and adenosine triphosphate were downregulated in the Duchenne biopsies as compared to the control group. Meanwhile, 27 metabolites were upregulated in Duchenne biopsies, which included phosphatidylcholines, phosphatidic acids, sphingomyelin and phosphatidylserine. The dysregulation of these metabolites was related to energy and phospholipid metabolism. In another finding, they reported that nicotinamide riboside supplementation has enhanced the aged human skeletal muscle NAD+ metabolome and decreased an inflammatory signature and transcriptomic changes related to mitochondria [22]. Ohmura et al. [23] mentioned that strenuous exercise upregulated some metabolites associated with the tricarboxylic acid cycle and glycolytic pathway in skeletal muscle. However, the effect of ginger as an antioxidant agent on the metabolic pathways of aged skeletal muscle has still not been reported yet. Our previous study showed that ginger improved myoblast differentiation to myotube in culture [24]. Thus, this study aimed to determine the effect of ginger extract on the metabolic pathways in the myoblast cells for elucidating the mechanism involved and its pharmacological properties in the promotion of myoblast differentiation.
2. Materials and Methods
2.1. Cell Culture and Replicative Senescence
Primary human myoblasts (human skeletal muscle myoblast; HSMM), which were derived from a 17-year-old female, were used in this study. The human myoblast was purchased from Lonza (Walkersville, MD, USA). Myoblast cells were maintained in skeletal muscle growth media-2 (SkGM-2 medium) that consisted of skeletal muscle basal medium (SkBM), growth medium and complete culture media (CCM). SkGM-2 contained L-glutamine, fetal bovine serum, epidermal growth factor (HeGF), dexamethasone and gentamicin/amphotericin B (Lonza, Walkersville, MD, USA). Cells were trypsinised when the cell population reached 70–80% confluency. Prior to incubation in a humid atmosphere at 37 °C containing 5% carbon dioxide (CO2), the cells were cultivated at 5000–7500 cells/cm2 and the medium was warmed to 37 °C. The population doubling (PD) was calculated for each passage by using the formula:
log (N/n) log2
N: number of cells at the time passage; n: number of cells initially plated. The cells were divided into three groups, which were young cells with population doubling (PD) 14, pre-senescent cells with PD 18 and senescent cells with PD 21.
2.2. Ginger (Zingiber officinale Roscoe) Extract Preparation and Treatment Protocol
Zingiber officinale Roscoe (ginger) was extracted using the subcritical water extraction method to obtain the standardised ginger extract (UTM, Malaysia). The optimum condition for the extraction method was 130 °C for 30 min with a solvent-to-solid ratio of 28/2 mL/mg [25]. The stock solutions for ginger extract were freshly prepared in water at a concentration of 10 mg/mL and kept for not more than one month at −20 °C. Ginger extract was diluted with complete culture media (CCM) into a series of concentrations, which were 50, 100, 200 and 300 µg/mL. Different ages of cells were treated with various dosages of ginger extract. Young cells (PD14) were treated with 0, 50, 200 µg/mL ginger extract, pre-senescent cells (PD 18) at 0, 50, 300 µg/mL and senescent cells (PD 21) at 0, 100, 300 µg/mL These dosages were chosen based on the result of a cell viability assay from our previous study [26].
2.3. Sample Preparation
The myoblast cells (~6 × 10⁵) were seeded in a 100 mm plate for 24 h. After 24 h, the treated groups were treated with 6-gingerol or 6-shogaol for 24 h. Meanwhile, for the control group, the medium was replaced with the new medium. Once the treatment was completed, the media were discarded and the cells were washed with 5 mL of cold NaCl 0.9% twice and discarded. Then, 80% methanol: H2O solution with ratio 4:1 was added into the plate with cells. The plate was incubated at −80 °C for 15 min. The cells were then scrapped and transferred into microcentrifuge tubes. The cells were centrifuged at 20,000× g and 4 °C for 10 min. The supernatant was transferred into a new microcentrifuge tube and dried up using a speedvac. The dried metabolites were kept at −80 or reconstituted in 100% methanol for liquid chromatograph mass spectrometry (LCMS) analysis.
2.4. Metabolomic Analysis by UHPLC-MS/MS
The dried metabolite extracts were reconstituted with water and filtered with 0.22 µm regenerated cellulose membrane. Sample reconstitution was normalised to its protein concentration at 0.5 µg/µL protein for every 100 µL of reconstitution buffer. Water was used as a blank sample. A quality control (QC) sample was prepared by pooling 4 µL aliquot from each sample into 1 tube. Each group consisted of 3 biological replicates and was arranged randomly between 2 QC samples. The QC sample was injected at every 9 injections of samples.
Untargeted metabolomics analysis was performed via the Ultra High Performance Liquid Chromatography (UHPLC) system (Dionex Ultimate 3000, Thermo Scientific, Waltham, MA, USA) and Orbitrap-MS (Q-Exactive HF, Thermo Scientific) as described previously [27]. The C18 column (Synchronis, Thermo Scientific) of 100 mm × 1.7 µm was heated at 55 °C, which was run at a flow rate of 0.45 mL/min. Mobile phase A and B solvents were water and acetonitrile containing 0.1% formic acid each. The elution gradient was set at 0.5% B for 1 min, 0.5 to 99.5% B in 15 min, 99.5% B for 4 min and 99.5 to 0.5% B in 2 min. The sample was injected at 2 µL. MS1 resolution was fixed at 60,000, while MS2 was at 15,000 and stepped normalised collision energy (NCE) at 20, 40 and 60 arbitrary units. After the completion of the positive ionisation mode, data acquisition was repeated for the negative ion mode.
2.5. Statistical Analysis
Mass spectrometry (MS) raw data were pre-processed for peak detection, alignment, blank subtraction and annotation using Compound Discoverer 2.0 (Thermo Scientific). Metabolite identification was performed by Compound Discoverer based on the mzCloud database that was incorporated into the software. Only metabolites with accurate mass ≤ 5 ppm and MS2 spectrum match > 70% were reported as confident annotations, as described previously [28] Molecular features with signal intensity, retention time and molecular weight were exported into a CVS file for statistical analysis. MetaboAnalyst 5.0 software was used to identify the differentially expressed metabolites among groups. The univariate t-tests and fold change were used, and a false discovery rate (FDR) less than 0.05 was considered statistically significant [29]. Pathway analysis of the significant metabolites was also determined by using MetaboAnalyst. The pathway was considered significant and impactful when p-value < 0.05 with impact value > 0.1.
3. Results
3.1. Differential Metabolomic Analysis between Control and Treated Myoblast Group
Principle component analysis (PCA) of young control myoblasts (YC) against pre-senescent control myoblast (PSC) generated a 56.3% variation in the negative mode, whereby the PC1 and PC2 scores were 40.9% and 15.4% (Supplementary Materials, Figure S1(1a)). Meanwhile, the PCA score plot for positive mode for this group comparison displayed a variation of 63.0%, with 45.3% of PC1 and 17.7% of PC2 (Supplementary Materials, Figure S1(1b)). The PCA score plots showed good separation between groups.
The PCA score plot between the YC and senescent control myoblasts (SC) showed a 54.1% variation for negative mode, with 40.8% of PC1 and 13.3% of PC2 (Supplementary Materials, Figure S1(2a)). For positive mode, the PCA score plot between these two groups of myoblasts showed a 59.2% variation, which comprises 46.2% for PC1 and 13.1% for PC2 (Supplementary Materials, Figure S1(2b)). Both PCA score plots for the negative and positive modes displayed an overlapping between SC and YC groups.
The PCA score for YC against young myoblast treated with 50 µg/mL ginger extract (YT50) generated a 51.7% variation for negative mode, whereby the PC1 score was 39.9% and the PC2 score was 11.8% (Supplementary Materials, Figure S1(3a)). The PCA score for positive mode showed a 63.2% variation with, PC1 47.6% and PC2 15.6% (Supplementary Materials, Figure S1(3b)). Both PCA displayed an overlapping in negative and positive modes. The PCA score between YC and young myoblast treated with 200 µg/mL ginger extract (YT200) showed a 53.1% variation for the negative mode (Supplementary Materials, Figure S1(4a)), with 41.3% for PC1 and 11.8% for PC2. The positive mode for these two groups exhibited 63.8% variation, with 46.0% for PC1 and 17.8% for PC2 (Supplementary Materials, Figure S1(4b)). There was overlapping for the PCA score plot in both positive and negative modes.
The PCA for PSC against pre-senescent myoblast treated with 50 µg/mL ginger extract (PST50) displayed a 54.4% variation for negative mode, with 42.7% of PC1 and 11.8% of PC2 (Supplementary Materials, Figure S1(5a)). For positive mode, this group comparison generated a 62.8% variation, with 52.4% of PC1 and 10.4% of PC2 (Supplementary Materials, Figure S1(5b)). The PCA score showed an overlapping between PSC and PST50. The PCA score of negative mode for group PSC against pre-senescent myoblast treated with 300 µg/mL ginger extract (PST300) presented a 57.8% variation, which consisted of 45.3% of PC1 and 12.5% of PC2 (Supplementary Materials, Figure S1(6a)). The PCA score for positive mode for PSC against PST300 exhibited 63.2% variation, whereby 53.9% was for PC1 and 9.3% was for PC2 (Supplementary Materials, Figure S1(6b)). The PCA score for negative mode showed an overlapping, while positive mode only displayed a slight overlapping between the PSC and PST300 groups.
The PCA score plot for SC and senescent myoblast treated with 100 µg/mL ginger extract (ST100) generated a 46.2% variation for negative mode (32.7% for PC1 and 13.5% for PC2) (Supplementary Materials, Figure S1(7a)). For positive mode, the comparison between these groups showed a 63.3% variation, with 49.7% of PC1 and 13.65% of PC2 (Supplementary Materials, Figure S1(7b)). There was overlapping in both modes. Meanwhile, the PCA score for negative mode between group SC against senescent myoblast treated with 300 µg/mL ginger extract (ST300) displayed a 51.3% variation, which comprises 36.0% of PC1 and 15.3% of PC2 (Supplementary Materials, Figure S1(8a)). The comparison between these groups generated a 62.6% variation in PCA score for positive mode, whereby 46.4% was for PC1 and 16.2% was for PC2 (Supplementary Materials, Figure S1(8b)). Both modes showed an overlapping between groups.
3.2. Comparison of Metabolites Profile in Control and Ginger-Treated Myoblast Cell
The effect of ageing on metabolites profile was determined based on the comparison between YC, PSC and SC groups. A comparison between PSC and YC showed 36 significant metabolites (Table 1), which were differentially expressed. Meanwhile, a comparison between SC and YC groups generated 18 significant metabolites. Only changes of 10 metabolites were similar in these 2 comparisons (PSC vs. YC and SC vs. YC). Out of the 10 metabolites, only choline with an FDR value less than 0.05 showed a different pattern in these comparisons. Choline was downregulated by 1.25-fold in PSC against YC, while for comparison between SC and YC, this metabolite was upregulated by 1.21-fold in SC. The most upregulated metabolite in the PSC group vs. YC group was adenosine (32.748-fold) followed by adenine (22.804-fold). In the SC group vs. YC group, the most upregulated metabolite was NADH with 2.58-fold. However, the most downregulated metabolite in both comparisons was adipic acid, whereby the fold change was 21.80 and 17.95 for PSC vs. YC and SC vs. YC, respectively.

Table 1.
List of significant metabolites in myoblast control groups.
For the effect of ginger on myoblast cells, our study found that comparison between YC and YT50 showed nine significant metabolites, whereby five metabolites were upregulated and another four metabolites were downregulated (Table 2). For the comparison between YT200 and YC, 14 metabolites were significantly different, consisting of 10 upregulated metabolites and 4 downregulated metabolites. Changes of five metabolites were similar in both comparisons (YT50 vs. YC and YT200 vs. YC), which were 2,2′-methylenebis (4-methyl-6-tert-butylphenol), adipic acid, (8)-shogaol, bis(4-ethylbenzylidene) sorbitol and valine. The most upregulated metabolite in YT50 vs. YC and YT200 vs. YC was (8)-shogaol with fold values 8.21 and 36.1, respectively, followed by valine with fold values 1.37 and 1.47, respectively. Both comparisons also showed a similar change for some of the downregulated metabolites such as adipic acid, bis(4-ethylbenzylidene) sorbitol and 2,2′-methylenebis(4-methyl-6-tert-butylphenol). In YT50 vs. YC, adipic acid, bis(4-ethylbenzylidene) sorbitol and 2,2′-methylenebis(4-methyl-6-tert-butylphenol) were downregulated by 9.07-fold, 2.93-fold and 2.09-fold, respectively. However, adipic acid was more downregulated in YT200 vs. YC by 15.15-fold.
Table 2.
List of significant metabolites in young myoblast groups treated with ginger extract.
For the pre-senescent myoblast groups treated with ginger extract, 11 metabolites were significant in PST50 vs. PSC groups, while 12 significant metabolites were identified in PST300 vs. PSC groups (Table 3). In the PST50 vs. PSC comparison, seven metabolites were upregulated and four metabolites were downregulated. Meanwhile, in the PST300 vs. PSC comparison, eight metabolites were upregulated and four metabolites were downregulated. However, for both comparisons (PST50 vs. PSC and PST300 vs. PSC), only three metabolites were similarly changed, whereby two metabolites were downregulated and another one was upregulated. For PST50 vs. PSC, pyridoxine, phenylalanine and bis(4-ethylbenzylidene) sorbitol were found to be the most upregulated metabolites, with an increase of 3.05-fold, 1.49-fold and 1.482-fold correspondingly. Glutathione (3.05-fold) and citric acid (1.18-fold) were the most downregulated metabolites in PST50 vs. PSC. In PST300 vs. PSC, the most upregulated metabolite was (8)-shogaol, with an increase of 34.32-fold, followed by xanthine (1.78-fold) and uric acid (1.70-fold).
Table 3.
List of significant metabolites in pre-senescent myoblast groups treated with ginger extract.
For senescent cells comparison, there were eight significant metabolites displayed in ST100 against SC groups, consisting of four upregulated metabolites and four downregulated metabolites (Table 4). (8)-Shogaol and octadecanamide were the most upregulated in ST100 vs. SC. In contrast, glutathione was the most downregulated metabolite in ST100 vs. SC, followed by uric acid. In ST300 against SC groups, 20 significant metabolites were recognised. In total, 11 of them were upregulated and 9 were downregulated. (8)-Shogaol, adenosine and adenine were displayed as the most upregulated metabolites in this group. Meanwhile, uric acid, 4-oxoproline and pyroglutamic acid were found to be the most downregulated metabolites. Between the ST100 vs. SC and ST300 vs. SC comparisons, there were five similar metabolites, which were uric acid, (8)-shogaol, carnitine, octadecanamide and uracil. Uric acid was downregulated by 2.51-fold in ST100 against SC and 2.58-fold in ST300 against SC. Meanwhile, (8)-shogaol, octadecanamide and uracil were upregulated in both ST100 vs. SC and ST300 vs. SC comparisons.
Table 4.
List of significant metabolites in senescent myoblast groups treated with ginger extract.
3.3. Biochemical Pathways Analysis of Muscle Metabolomes in Control and Myoblast-Treated Groups
A comparison between the control groups (young, pre-senescent and senescent) generated 28 biochemical pathways, as shown in Figure 1. However, only seven pathways were significant and impactful for this group comparison, which were the alanine, aspartate and glutamate metabolism, phenylalanine, tyrosine and tryptophan biosynthesis, arginine and proline metabolism, D-glutamine and D-glutamate metabolism, phenylalanine metabolism, arginine biosynthesis and citrate cycle (TCA cycle) pathway. (Supplementary Materials, Table S1).
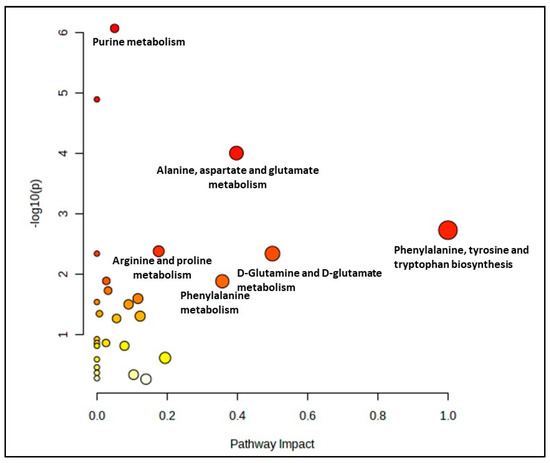
Figure 1.
Biochemical pathway analysis of significant metabolites profile for myoblast control groups (young, pre-senescent and senescent cells).
The effect of ginger extract on the metabolic pathway was evaluated by comparing the metabolome expression in myoblasts treated with and without ginger extract in young, pre-senescent and senescent groups. A significant metabolite profile in the young treatment groups (YT50 or YT200 vs. YC) determined 19 biochemical pathways (Figure 2 and Supplementary Materials, Table S2). However only one pathway identified for this group as a significant and impactful pathway which was alanine, aspartate and glutamate metabolism pathway.
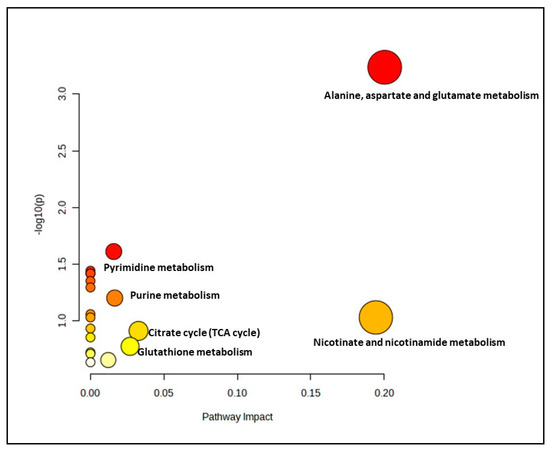
Figure 2.
Biochemical pathway analysis of significant metabolites profile for the young myoblast treated with or without ginger extract.
Meanwhile, for the pre-senescent myoblast groups treated with ginger extract, 23 biochemical pathways were identified. 6 out of 23 pathways were evaluated as significant and impactful pathways in these groups, as shown in Figure 3 and Supplementary Materials, Table S3. The significant and impactful pathways were alanine, aspartate and glutamate metabolism, D-glutamine and D-glutamate metabolism, arginine biosynthesis, citrate cycle (TCA cycle), phenylalanine, tyrosine and tryptophan biosynthesis as well as glutathione metabolism pathways.
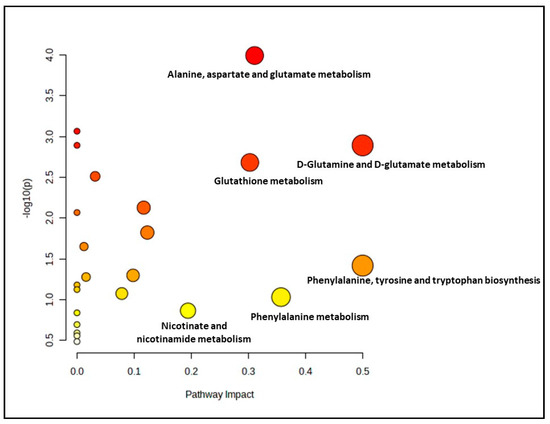
Figure 3.
Biochemical pathway analysis of significant metabolites profile for the pre-senescent myoblast treated with or without ginger extract.
In the senescent myoblast groups treated with gingered extract, only 14 biochemical pathways were generated (Figure 4). However, only two pathways which were glutathione metabolism and alanine, aspartate and glutamate metabolism pathways were identified as significant and impactful pathway (Supplementary Materials, Table S4).
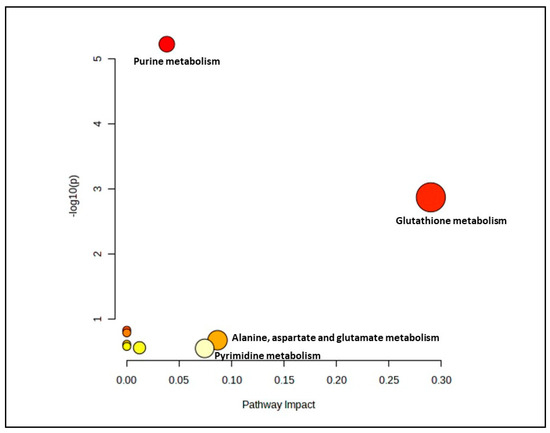
Figure 4.
Biochemical pathway analysis of significant metabolites profile for the senescent myoblast groups treated with or without ginger extract.
4. Discussion
Muscle loss is a common problem that occurs among the older population, and this can be reflected by the changes in various types of metabolites. Therefore, the determination of metabolites in aged (senescent) skeletal muscle cells could be useful for understanding the mechanism of muscle loss among the older population. In this study, the comparison between the control groups at a different PD of myoblast cells has been performed to determine the effect of ageing on the metabolite changes of skeletal muscle. The current study showed that some metabolites including adipic acid, succinic acid, leucine and methionine were downregulated in both the pre-senescent and senescent control groups as compared to the young control group. After treatment with ginger extract, metabolites such as succinic acid, leucine, valine, carnitine and glutamine were changed, which may indicate the positive effect of ginger treatment in aged myoblasts. Our previous study showed that ginger treatment contributes to the prevention of cellular senescence and the promotion of myoblast regenerative capacity [24].
Adipic acid is one of the products of lysine metabolism, which come from the catabolism of lysine, which involves fatty acid oxidation [30]. Lysine could be catabolised into saccharopine and then converted into aminoadipic acid by enzymes L-lysine ketoglutarate reductase and saccharopine dehydrogenase [31]. Our current finding showed that adipic acid was downregulated in pre-senescent and senescent control groups, which was similar to the previous study. Munasinghe et al. [32] reported that ageing resulted in a significant reduction in adipic acid in C. elegans. This is because during ageing, there was impaired fatty acid beta oxidation, which may lead to decreased adipic acid production. Wanders et al. [33] showed that the defect in the oxidation of long-chain fatty acid has a risk of developing cardiac and skeletal muscle abnormalities such as cardiomyopathy and arrhythmias. The level of adipic acid was also decreased in the young treatment group. This may also indicate the impairment in fatty acid oxidation. However, the downregulation of adipic acid in the treatment group was lower than in the control group, which may indicate the positive effect of ginger on fatty acid oxidation impairment.
Succinic acid or succinate is an intermediate in a tricarboxylic acid (TCA) cycle, which generates energy in the form of ATP [34]. A previous study reported that this metabolite was essential in regulating mitochondrial function as well as reducing the level of oxidative stress and inflammation [35]. Succinic acid has potential in skeletal muscle fiber-type transition by inducing a conversion from fast-twitch to slow-twitch fibers [36]. This transition could be seen through the enhancement of calcium and some vital transcriptional factors including MEF2, calcineurin and NFATc1, which are essential in skeletal muscle fiber switching. Succinic acid also increases the expression of PGC-1α and mitochondrial content, thereby improving oxygen uptake in skeletal muscle cells [36]. In another study, it was found that this metabolite could activate the G-protein-coupled receptor SUNCR1 [36]. The activation of SUNCR1 by succinic acid leads to the elevation of platelet, hemoglobin and neutrophils as well as increased immunity. The results of our current study showed that this metabolite was downregulated in pre-senescent and senescent control groups as compared to the young control group. This may occur due to ageing effects, whereby the ageing process could lead to mitochondrial dysfunction and higher levels of oxidative stress and inflammation [6,37]. The ability of ginger to improve mitochondrial function, improve of platelet, hemoglobin, and neutrophils as well as increase immunity could be seen via upregulation of succinic acid in the young and pre-senescent myoblast cells after treatment with ginger extract. This was in line with previous studies that found ginger could promote mitochondrial biogenesis [38] and the immune system [39].
Another important metabolite found to be significant in this study was uric acid. Uric acid is the final product of purine metabolism and could exhibit antioxidant properties [40]. Purine metabolism is essential for the synthesis of building blocks of DNA and RNA, providing energy as well as promoting cell survival and proliferation [40]. A previous study has reported a positive association between uric acid and muscle mass in the older population [41]. They suggested that uric acid could be a protective factor for muscle strength in the elderly. However, a study by Nahas et al. [42] found that uric acid was not connected with the appendicular muscle mass of young and middle-aged adults. The different results found between young and old adults may be due to the effect of uric acid on the muscle, which varies according to its composition and is known to be altered during ageing. As individuals age, the decline in fast-twitch muscle fibers exceeds the reduction observed in slow-twitch muscle fibers, which exhibit relatively low sensitivity to acute oxidative stress [43].
Furthermore, the positive connection between uric acid and muscle function identified in elderly individuals could be influenced by uric acid’s ability to act as an antioxidant within the central nervous system, particularly against motor neurons’ death during ageing [44]. In another study, a positive correlation was observed between uric acid level and handgrip strength in the aged population [45]. The low uric acid level contributed to the low handgrip strength, which represents the overall muscle strength in the elderly population. This was in line with this current study, which found that uric acid was downregulated in the pre-senescent control group. Meanwhile, the senescent control group did not show any changes. A previous study found that uric acid level in skeletal muscle of aged mice remained constant from 12–30 months [46]. This may be due to the decline of uricase activity during ageing. The ginger treatment in myoblasts caused an upregulation of uric acid in pre-senescent myoblasts treated with ginger at a high concentration. The possible mechanism that explained the beneficial impact of uric acid on muscle and bone might be due to the antioxidant capacity of uric acid itself [47]. However, uric acid was downregulated in senescent myoblasts treated with ginger at both concentrations. This may be due to the properties of ginger itself as a xanthine oxidase inhibitor [48]. Xanthine oxidase is involved in the production of uric acid, whereby uric acid levels decrease together with the reduction of xanthine oxidase [49].
Guanidinosuccinic acid (GSA) is a derivative of L-arginine and a precursor of creatine [50]. The findings of this current study showed that GSA was downregulated in the control myoblast groups with increasing PD. This is because the GSA did not link directly to skeletal muscle regeneration, but it could contribute to the many types of metabolic disorders. A previous study has reported that this metabolite accumulates in patients with metabolic disorder [51]. Arnold et al. [52] found that GSA was elevated in patients with chronic kidney function, and this metabolite is also considered a uremic toxin [52]. GSA would target specific receptors in brains and could function as neurotoxins or excitotoxins. Their binding on the N-methyl-D-aspartate (NMDA) receptor leads to the overstimulation of certain neurons and enhanced intracellular level of ionised calcium before increasing the level of ROS, which could contribute to apoptosis and cell death [53].
Leucine and valine are essential amino acids for muscle protein synthesis and maintenance. A previous study has suggested that leucine was altered in the aged muscle, which was similar to the findings of the present study [54]. In this study, leucine was downregulated in the control groups with increasing PD, maybe due to the ageing effect. Opazo et al. [55] found that the level of leucine was reduced in sarcopenic individuals as compared to the control group. This was supported by another study, which found that the older adults who were supplemented with leucine improved their muscle strength and function [56]. Chae et al. [57] reported that there was a positive association between supplementation of branched-chain amino acids (BCAA), which include leucine and valine, and skeletal muscle index among middle-aged and pre-elderly adults. This may be due to the ability of leucine and valine themselves to stimulate muscle synthesis. Muscle protein synthesis by leucine and valine could be seen through the activation of the mechanistic target of mTORC1 and the activated translational process from mRNA to protein [58,59]. Meanwhile, Petrocelli et al. [60] reported that the administration of leucine to aged mice suppressed muscle atrophy by increasing the satellite cells and collagen remodeling. These changes occur due to the increment pathway that is related to oxidative phosphorylation as well as the decreased inflammatory pathway. The positive effect of ginger treatment in inducing skeletal muscle synthesis could be observed through the upregulation of valine in the young ginger-treated group as well as leucine in the pre-senescent myoblast ginger-treated group.
The findings of the current study also showed a downregulation of methionine in the control groups with increasing PD. Methionine is also considered a vital amino acid in protein synthesis. It carries cellular functions such as the regulation of gene expression and antioxidant defense [61]. This metabolite enhanced protein that is related to the mitochondrial function such as the electron transport chain, TCA cycle and respiration [62]. The expression of genes associated with this metabolite was altered in the muscle of aged rats [63]. Methionine restriction could increase lifespan by postponing cellular senescence [64]. One of the possible mechanisms of methionine restriction is by influencing insulin/IGF-1 and mTORC1 signaling [65]. By restricting methionine, the mTORC1 did not activate and then inhibited the suppression of autophagy [66]. However, all the ginger-treated groups did not show any significant effect on this metabolite.
Furthermore, the downregulation of octadecanamide in the control groups with increasing PD also reflected the ageing effect. In contrast, ginger supplementation on myoblast cells has upregulated this metabolite in the senescent group. Octadecanamide is a fatty acid amide also known as oleamide. This metabolite has been proven to increase anti-inflammatory activity and microglial phagocytosis [67]. A study performed by Zhang et al. [68] found that exercise leads to the increment of octadecanamide in skeletal muscle, which suggested that this metabolite may act as a signaling molecule in skeletal muscle. Supplementation of octadecanamide has been proven to restore tibialis anterior muscle atrophy in mice by activating Akt/mTOR signaling [69].
Pyridoxine, also known as vitamin B6, is an essential co-factor for various biochemical reactions in cellular metabolism involving synthesis and catabolism of amino acids, neurotransmitters and fatty acids as well as reducing the level of reactive oxygen species [70]. Due to the ageing effect, this current study showed that pyridoxine was downregulated in the control groups with increasing PD. Surprisingly, after 50 µg/mL ginger extract treatment, pyridoxine was upregulated in the pre-senescent group. A study performed by Kumar et al. [71] reported that pyridoxal, one of the metabolites of vitamin B6, was upregulated during myoblast differentiation. This upregulation contributes to the modulation of myokines, Nrf2-related factors, myogenin and HSP60 [72]. Thus, the upregulation of pyridoxine found in this study may also show a similar effect on myoblast differentiation, which indicated the potential of ginger in promoting skeletal muscle differentiation. In addition, this metabolite could regulate the function of muscle satellite cells together with the improvement of muscle regeneration by inducing proliferation and preventing apoptosis of satellite cells [73]. Deficiency of this metabolite will lead to the impairment of transcellular signaling between neurons and causes muscular convulsions, peripheral neuropathy and hyperirritability [74]. Zhou and Effiong [75] reported that a deficiency of pyridoxine leads to muscle spasms in patients with type 2 diabetes.
Niacinamide, also known as nicotinamide, was upregulated in the young and pre-senescent myoblasts treated with ginger extract. However, niacinamide was also increased in the senescent control group as compared to young control group, which contradicts the ginger treatment effect. This was in contrast with a previous study, which showed that nicotinamide adenine dinucleotide (NAD) decreased progressively during ageing in humans and rodents. [76]. The increase of niacinamide in senescent myoblasts found in this study may reflect the attempt to respond to the oxidative stress and reduce the production of senescence-associated secretory phenotype (SASP) in aged myoblasts. This is because niacinamide is one of the amides of vitamin B3 (niacin), which consists of antioxidant properties and can reduce oxidative stress as well as the SASP factor [77,78,79]. This metabolite could regulate the NF-Kβ-mediated transcription of signaling molecules via inhibition of nuclear poly (ADP-ribose) polymerase-1 (PARP-1). In previous research, it was found that nicotinamide riboside (NR) supplementation decreased the circulating inflammatory cytokines in older individuals [22]. The level of interleukin-6, interleukin-5, interleukin-2 and tumor necrosis factor-alpha (TNF-α) decreased after supplementation with NR, which may reflect the same effect of ginger treatment. Niacinamide also has been proven for reducing muscle dysfunction-related diseases. A study done by Sahin et al. [80] reported that niacinamide supplementation reduced inflammation response in rats with osteoarthritis.
(8)-Shogaol is one of the bioactive compounds in ginger, which exhibited many therapeutic effects [81]. A study done by Shieh et al. [82] found that (8)-shogaol induced apoptosis and inhibited growth in human leukemia cells by several mechanisms. Firstly, (8)-shogaol triggers the excessive production of ROS and interferes with mitochondrial functions during the initial phases of apoptosis; subsequently, it stimulates caspase-9 activation. The elevated ROS production leads to a depletion of glutathione levels, ultimately playing a role in triggering apoptosis. (8)-Shogaol could inhibit rheumatoid arthritis by reversing pathologies of rheumatoid arthritis [83]. (8)-Shogaol has been proven to inhibit IL-1β, TNF-α and IL-17 by targeting transforming growth factor β-activated kinase 1 (TAK1). In addition, (8)-shogaol exhibited an anti-inflammatory effect on DSS-induced colitis in mice by regulating NF-Kβ signaling [84]. From this study, we can observe that (8)-shogaol was upregulated in all groups of myoblast cells treated with ginger extract, indicating its positive effect particularly on improving muscle regeneration in aged skeletal muscle, as this metabolite was more upregulated in senescent myoblasts than the young myoblasts.
Glutamine is a major energy source for proliferating cells such as cancer cells and hematopoietic stem cells [85]. Glutamine is converted to glutamate in the mitochondria by glutaminase [86]. Then, glutamate is converted into α-ketoglutarate, which is the TCA cycle intermediate by glutamate dehydrogenase or by alanine or aspartate transaminase. A previous study reported that glutamine reduced muscle tissue degradation by activating satellite cells, especially after exercise [87]. In another study, it was found that glutamine improved skeletal muscle cell differentiation as well as inhibited myotube atrophy by regulating p38 MAPK [88]. Our current study showed the downregulation of glutamine in the pre-senescent control group. In contrast, the young and pre-senescent ginger-treated groups displayed an upregulation, which indicated the potential of ginger extract in promoting muscle regeneration.
Carnitine is an amino acid derivative, which is essential in fatty acid β-oxidation. In fatty acid β-oxidation, this metabolite would transport long-chain fatty acids from the cytosol to the mitochondrial matrix [89]. The products of β-oxidation, which are a two-carbon molecule, will be used by the Krebs cycle to produce energy in the form of adenosine triphosphate (ATP) [90]. In our study, this metabolite was increased in the pre-senescent ginger-treated group at a concentration 50 µg/mL, which demonstrated the positive effect of ginger treatment. A previous study reported that carnitine suppressed the loss of skeletal muscle mass in patients with liver cirrhosis [91]. In another study, combined supplementation of L-carnitine, creatine and leucine had significantly increased muscle mass and strength through increment of mTOR protein level [92]. In our study, the senescent ginger-treated group displayed a downregulation of carnitine, which was similar to the pre-senescent and senescent control groups as compared to the young control group. One possible factor that contributed to this increment was a compensatory response to aged-related changes in energy metabolism and production. As ageing occurred, there was a decline in the mitochondrial function, which may contribute to the decrease in energy availability in the form of ATP [93]. This later leads to an increase in the demand for fatty acid oxidation to produce energy. Treatment of ginger extract in the senescent group probably did not improve the mitochondrial function during ageing. The significant metabolic changes in the control group are summarised in Figure 5. Meanwhile, the summaries of significant metabolic changes for the young, pre-senescent and senescent ginger-treated groups are shown in Figure 6, Figure 7 and Figure 8, respectively.
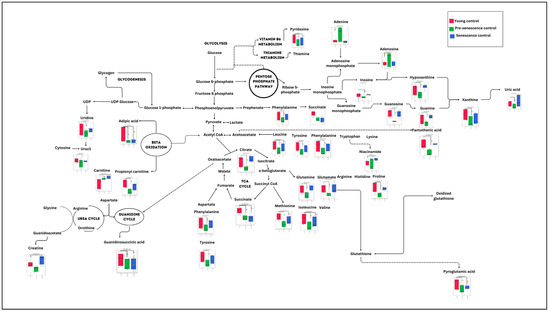
Figure 5.
Summary of significant metabolic changes during ageing in myoblast cells. a p < 0.05: significantly different for pre-senescent control group vs. young control group. b p < 0.05: significantly different for senescent control group vs. young control group.
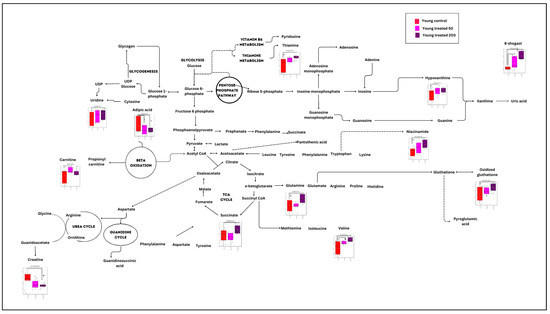
Figure 6.
Summary of significant metabolic changes after ginger treatment in the young myoblast cells. c p < 0.05: significantly different for young treatment group at concentration of 50 µg/mL vs. young control group. d p < 0.05: significantly different for young treatment group at concentration of 200 µg/mL vs. young control group.
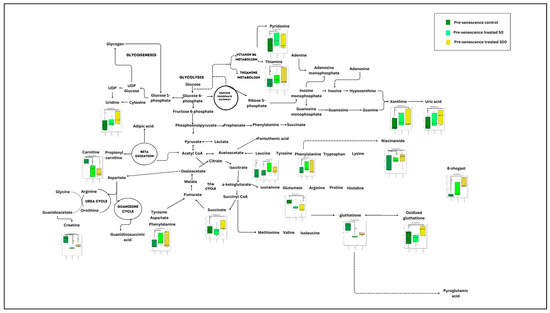
Figure 7.
Summary of significant metabolic changes after ginger treatment in the pre-senescent myoblast cells. e p < 0.05: significantly different for pre-senescent treatment group at concentration of 50 µg/mL vs. pre-senescent control group. f p < 0.05: significantly different for pre-senescent treatment group at concentration of 300 µg/mL vs. pre-senescent control group.
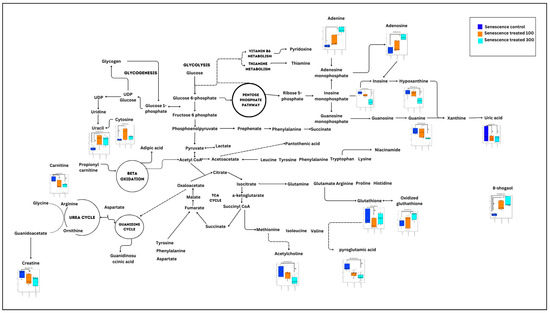
Figure 8.
Summary of significant metabolic changes after ginger treatment in the senescent myoblast cells. g p < 0.05: significantly different for senescent treatment group at concentration of 100 µg/mL vs. senescent control group. h p < 0.05: significantly different for senescent treatment group at concentration of 300 µg/mL vs. senescent control group.
This is the first study highlighting the metabolic alterations in the skeletal muscle cells following ginger extract treatment. The findings of this study could provide valuable insights into the precise mechanisms through which ginger impacts muscle cells and enhancing our comprehension of its potential benefits. Nonetheless, the outcomes of this research may differ across various models, including both animal and human models, since each model displays varying metabolic responses to ginger extract. Hence, conducting additional research on metabolic changes induced by ginger extract in different models may be necessary to gain a better understanding of how ginger influences the loss of skeletal muscle in elderly individuals.
5. Conclusions
In conclusion, ginger treatment has contributed to the changes of some metabolites such as leucine, valine, carnitine, pyridoxine, niacinamide and glutamine, whereby most of these metabolites were downregulated due to the ageing effect. These changes may indicate the potential pharmacological properties of ginger in improving muscle regeneration and energy production of aged skeletal muscle. In future research, it may be necessary to integrate metabolomics data with genomics, transcriptomics and proteomics data to attain a more comprehensive understanding of how ginger extract affects skeletal muscle systems.
Supplementary Materials
The following supporting information can be downloaded at: https://www.mdpi.com/article/10.3390/nu15214520/s1, Figure S1: PCA score plots for young control group (red filled circle) and pre-senescent control group (green filled circle) in negative mode (1a) and positive mode (1b), PCA score plot between senescent control group (green filled circle) and young control group (red filled circle) in negative mode (2a) and positive mode (2b), PCA score plot between young treatment group at concentration 50 (green filled circle) with young control group (red filled circle) in negative mode (3a) and positive mode (3b), PCA score plot between young treatment group at concentration 200 (green filled circle) and young control group (red filled circle) in negative mode (4a) and positive mode (4b), PCA score plot between pre-senescent treatment group at concentration 50 (green filled circle) with pre-senescent control group (red filled circle) in negative mode (5a) and positive mode (5b), PCA score plot between pre-senescent treatment group at concentration 300 (green filled circle) with pre-senescent control group (red filled circle) in negative mode (6a) and positive mode (6b), PCA score plot between senescent treatment group at concentration 100 (green filled circle) with senescent control group (red filled circle) in negative mode (7a) and positive mode (7b), PCA score plot between senescent treatment group at concentration 300 (green filled circle) with senescent control group (red filled circle) in negative mode (8a) and positive mode (8b). Table S1: List of biochemical pathways of significant metabolites profile for myoblast control groups (young, pre-senescent and senescent cells); Table S2: List of biochemical pathways of significant metabolites profile for the young myoblast treated with or without ginger extract; Table S3: List of biochemical pathways of significant metabolites profile for the pre-senescent myoblast treated with or without ginger extract; Table S4: List of biochemical pathways of significant metabolites profile for the senescent myoblast groups treated with or without ginger extract.
Author Contributions
S.M. contributed to the experimental design and supervised the work. N.F.N.M.S. and F.J. performed the experimentation. S.M., J.K.T., N.F.N.M.S. and F.J. were involved in data analysis and interpretation. N.F.N.M.S. drafted the manuscript. S.M., J.K.T. and M.F.M.N. revised and corrected the manuscript for publication. All authors have read and agreed to the published version of the manuscript.
Funding
This research was supported by the Ministry of Higher Education Research Grant with project code: FRGS/1/2019/SKK08/UKM/01/4.
Institutional Review Board Statement
Not applicable.
Informed Consent Statement
Not applicable.
Data Availability Statement
The datasets used and/or analysed during the current study are available from the corresponding author on reasonable request.
Acknowledgments
The authors are thankful for the contribution of all the researchers and staff of the Department of Biochemistry, Faculty of Medicine, Universiti Kebangsaan Malaysia.
Conflicts of Interest
The authors declare that they have no conflict of interest.
References
- Roberts, A.W.; Ogunwole, S.U.; Blakeslee, L.; Rabe, M.A. The Population 65 Years and Older in the United States: 2016; US Department of Commerce, Economics and Statistics Administration; US Census Bureau: Washington, DC, USA, 2018.
- Hou, Y.; Dan, X.; Babbar, M.; Wei, Y.; Hasselbalch, S.G.; Croteau, D.L.; Bohr, V.A. Ageing as a risk factor for neurodegenerative disease. Nat. Rev. Neurol. 2019, 15, 565–581. [Google Scholar] [CrossRef] [PubMed]
- Cruz-Jentoft, A.J.; Bahat, G.; Bauer, J.; Boirie, Y.; Bruyère, O.; Cederholm, T.; Cooper, C.; Landi, F.; Rolland, Y.; Sayer, A.A. Sarcopenia: Revised European consensus on definition and diagnosis. Age Ageing 2019, 48, 16–31. [Google Scholar] [CrossRef]
- Larsson, L.; Degens, H.; Li, M.; Salviati, L.; Lee, Y.I.; Thompson, W.; Kirkland, J.L.; Sandri, M. Sarcopenia: Aging-Related Loss of Muscle Mass and Function. Physiol. Rev. 2019, 99, 427–511. [Google Scholar] [CrossRef]
- Serra, A.J.; Prokić, M.D.; Vasconsuelo, A.; Pinto, J.R. Oxidative Stress in Muscle Diseases: Current and Future Therapy. Oxid. Med. Cell Longev. 2018, 2018, 6439138. [Google Scholar] [CrossRef]
- Liguori, I.; Russo, G.; Curcio, F.; Bulli, G.; Aran, L.; Della-Morte, D.; Gargiulo, G.; Testa, G.; Cacciatore, F.; Bonaduce, D.; et al. Oxidative stress, aging, and diseases. Clin. Interv. Aging 2018, 13, 757–772. [Google Scholar] [CrossRef] [PubMed]
- Sahoo, B.M.; Banik, B.K.; Borah, P.; Jain, A. Reactive Oxygen Species (ROS): Key Components in Cancer Therapies. Anticancer. Agents Med. Chem. 2022, 22, 215–222. [Google Scholar] [CrossRef] [PubMed]
- Wang, F.; Wang, X.; Liu, Y.; Zhang, Z. Effects of Exercise-Induced ROS on the Pathophysiological Functions of Skeletal Muscle. Oxid. Med. Cell Longev. 2021, 2021, 3846122. [Google Scholar] [CrossRef] [PubMed]
- Murata, M. Inflammation and cancer. Environ. Health Prev. Med. 2018, 23, 50. [Google Scholar] [CrossRef]
- Watanabe, H.; Enoki, Y.; Maruyama, T. Sarcopenia in Chronic Kidney Disease: Factors, Mechanisms, and Therapeutic Interventions. Biol. Pharm. Bull. 2019, 42, 1437–1445. [Google Scholar] [CrossRef]
- Cartee, G.D.; Hepple, R.T.; Bamman, M.M.; Zierath, J.R. Exercise Promotes Healthy Aging of Skeletal Muscle. Cell Metab. 2016, 23, 1034–1047. [Google Scholar] [CrossRef]
- Papaioannou, K.G.; Nilsson, A.; Nilsson, L.M.; Kadi, F. Healthy Eating Is Associated with Sarcopenia Risk in Physically Active Older Adults. Nutrients 2021, 13, 2813. [Google Scholar] [CrossRef] [PubMed]
- Tohma, H.; Gülçin, İ.; Bursal, E.; Gören, A.C.; Alwasel, S.H.; Köksal, E. Antioxidant activity and phenolic compounds of ginger (Zingiber officinale Rosc.) determined by HPLC-MS/MS. J. Food Meas. Charact. 2017, 11, 556–566. [Google Scholar] [CrossRef]
- Si, W.; Chen, Y.P.; Zhang, J.; Chen, Z.-Y.; Chung, H.Y. Antioxidant activities of ginger extract and its constituents toward lipids. Food Chem. 2018, 239, 1117–1125. [Google Scholar] [CrossRef] [PubMed]
- Kiyama, R. Nutritional implications of ginger: Chemistry, biological activities and signaling pathways. J. Nutr. Biochem. 2020, 86, 108486. [Google Scholar] [CrossRef]
- Yasodai, R.; Kavimani, M.; Prabhu, K. Phytochemical analysis and quantitative nutritional evaluvation of Zingiber Officinale Roscae (Ginger). Int. J. Pharm. Sci. Res. 2020, 11, 2090–2094. [Google Scholar] [CrossRef][Green Version]
- Kirdat, P.; Dandge, P.; Hagwane, R.; Nikam, A.; Mahadik, S.; Jirange, S. Synthesis and characterization of ginger (Z. officinale) extract mediated iron oxide nanoparticles and its antibacterial activity. Mater. Today Proc. 2021, 43, 2826–2831. [Google Scholar] [CrossRef]
- Pashaei-Asl, R.; Pashaei-Asl, F.; Mostafa Gharabaghi, P.; Khodadadi, K.; Ebrahimi, M.; Ebrahimie, E.; Pashaiasl, M. The Inhibitory Effect of Ginger Extract on Ovarian Cancer Cell Line; Application of Systems Biology. Adv. Pharm. Bull. 2017, 7, 241–249. [Google Scholar] [CrossRef] [PubMed]
- Ezzat, S.M.; Ezzat, M.I.; Okba, M.M.; Menze, E.T.; Abdel-Naim, A.B. The hidden mechanism beyond ginger (Zingiber officinale Rosc.) potent in vivo and in vitro anti-inflammatory activity. J. Ethnopharmacol. 2018, 214, 113–123. [Google Scholar] [CrossRef]
- Uchitomi, R.; Hatazawa, Y.; Senoo, N.; Yoshioka, K.; Fujita, M.; Shimizu, T.; Miura, S.; Ono, Y.; Kamei, Y. Metabolomic Analysis of Skeletal Muscle in Aged Mice. Sci. Rep. 2019, 9, 10425. [Google Scholar] [CrossRef]
- Dabaj, I.; Ferey, J.; Marguet, F.; Gilard, V.; Basset, C.; Bahri, Y.; Brehin, A.-C.; Vanhulle, C.; Leturcq, F.; Marret, S.; et al. Muscle metabolic remodelling patterns in Duchenne muscular dystrophy revealed by ultra-high-resolution mass spectrometry imaging. Sci. Rep. 2021, 11, 1906. [Google Scholar] [CrossRef]
- Elhassan, Y.S.; Kluckova, K.; Fletcher, R.S.; Schmidt, M.S.; Garten, A.; Doig, C.L.; Cartwright, D.M.; Oakey, L.; Burley, C.V.; Jenkinson, N.; et al. Nicotinamide Riboside Augments the Aged Human Skeletal Muscle NAD(+) Metabolome and Induces Transcriptomic and Anti-inflammatory Signatures. Cell Rep. 2019, 28, 1717–1728.e1716. [Google Scholar] [CrossRef] [PubMed]
- Ohmura, H.; Mukai, K.; Takahashi, Y.; Takahashi, T. Metabolomic analysis of skeletal muscle before and after strenuous exercise to fatigue. Sci. Rep. 2021, 11, 11261. [Google Scholar] [CrossRef] [PubMed]
- Mohd Sahardi, N.F.N.; Jaafar, F.; Mad Nordin, M.F.; Makpol, S. Zingiber Officinale Roscoe Prevents Cellular Senescence of Myoblasts in Culture and Promotes Muscle Regeneration. Evid. Based Complement. Alternat Med. 2020, 2020, 1787342. [Google Scholar] [CrossRef] [PubMed]
- Sarip, M. Subcritical Water Extraction of 6-Gingerol and 6-Shogaol from Zingiber officinale. Master’s Thesis, Universiti Teknologi Malaysia, Skudai, Malaysia, 2012. [Google Scholar]
- Sahardi, N.; Jaafar, F.; Zakaria, S.; Tan, J.; Nordin, M.; Makpol, S. Comparison of the Antioxidant Activity of Malaysian Ginger (Zingiber officinale Roscoe) Extracts with that of Selected Natural Products and its Effect on the Viability of Myoblast Cells in Culture. Sains Malays. 2021, 50, 1445–1456. [Google Scholar] [CrossRef]
- Osman, E.; Mohammad Zahariluddin, A.S.; Sharip, S.; Md Idris, Z.; Tan, J.K. Metabolomic Profiling Reveals Common Metabolic Alterations in Plasma of Patients with Toxoplasma Infection and Schizophrenia. Genes 2022, 13, 1482. [Google Scholar] [CrossRef] [PubMed]
- Tan, J.K.; Zakaria, S.N.A.; Gunasekaran, G.; Abdul Sani, N.F.; Nasaruddin, M.L.; Jaafar, F.; Abu Bakar, Z.H.; Amir Hamzah, A.I.Z.; Nor Aripin, K.N.; Mohd Rani, M.D.; et al. Metabolomics Profiling of Age-Associated Metabolites in Malay Population. Oxid. Med. Cell Longev. 2023, 2023, 4416410. [Google Scholar] [CrossRef]
- Xia, J.; Wishart, D.S. Using MetaboAnalyst 3.0 for Comprehensive Metabolomics Data Analysis. Curr. Protoc. Bioinform. 2016, 55, 14.10.11–14.10.91. [Google Scholar] [CrossRef]
- Ju, J.-H.; Oh, B.-R.; Heo, S.-Y.; Lee, Y.-U.; Shon, J.-h.; Kim, C.-H.; Kim, Y.-M.; Seo, J.-W.; Hong, W.-K. Production of adipic acid by short- and long-chain fatty acid acyl-CoA oxidase engineered in yeast Candida tropicalis. Bioprocess. Biosyst. Eng. 2020, 43, 33–43. [Google Scholar] [CrossRef]
- Matthews, D.E. Review of Lysine Metabolism with a Focus on Humans. J. Nutr. 2020, 150, S2548–S2555. [Google Scholar] [CrossRef]
- Munasinghe, M.; Afshari, R.; Heydarian, D.; Almotayri, A.; Dias, D.A.; Thomas, J.; Jois, M. Effects of cocoa on altered metabolite levels in purine metabolism pathways and urea cycle in Alzheimer’s disease in C. elegans. Transl. Med. Aging 2022, 6, 14–24. [Google Scholar] [CrossRef]
- Wanders, R.J.A.; Visser, G.; Ferdinandusse, S.; Vaz, F.M.; Houtkooper, R.H. Mitochondrial Fatty Acid Oxidation Disorders: Laboratory Diagnosis, Pathogenesis, and the Complicated Route to Treatment. J. Lipid Atheroscler. 2020, 9, 313–333. [Google Scholar] [CrossRef] [PubMed]
- Huffman, K.M.; Koves, T.R.; Hubal, M.J.; Abouassi, H.; Beri, N.; Bateman, L.A.; Stevens, R.D.; Ilkayeva, O.R.; Hoffman, E.P.; Muoio, D.M.; et al. Metabolite signatures of exercise training in human skeletal muscle relate to mitochondrial remodelling and cardiometabolic fitness. Diabetologia 2014, 57, 2282–2295. [Google Scholar] [CrossRef] [PubMed]
- Chouchani, E.T.; Pell, V.R.; Gaude, E.; Aksentijević, D.; Sundier, S.Y.; Robb, E.L.; Logan, A.; Nadtochiy, S.M.; Ord, E.N.J.; Smith, A.C.; et al. Ischaemic accumulation of succinate controls reperfusion injury through mitochondrial ROS. Nature 2014, 515, 431–435. [Google Scholar] [CrossRef]
- Wang, T.; Xu, Y.Q.; Yuan, Y.X.; Xu, P.W.; Zhang, C.; Li, F.; Wang, L.N.; Yin, C.; Zhang, L.; Cai, X.C.; et al. Succinate induces skeletal muscle fiber remodeling via SUNCR1 signaling. EMBO Rep. 2019, 20, e47892. [Google Scholar] [CrossRef] [PubMed]
- Picca, A.; Guerra, F.; Calvani, R.; Bucci, C.; Lo Monaco, M.R.; Bentivoglio, A.R.; Coelho-Júnior, H.J.; Landi, F.; Bernabei, R.; Marzetti, E. Mitochondrial Dysfunction and Aging: Insights from the Analysis of Extracellular Vesicles. Int. J. Mol. Sci. 2019, 20, 805. [Google Scholar] [CrossRef] [PubMed]
- Deng, X.; Zhang, S.; Wu, J.; Sun, X.; Shen, Z.; Dong, J.; Huang, J. Promotion of mitochondrial biogenesis via activation of AMPK-PGC1ɑ signaling pathway by Ginger (Zingiber officinale Roscoe) extract, and its major active component 6-Gingerol. J. Food Sci. 2019, 84, 2101–2111. [Google Scholar] [CrossRef] [PubMed]
- Ballester, P.; Cerdá, B.; Arcusa, R.; Marhuenda, J.; Yamedjeu, K.; Zafrilla, P. Effect of ginger on inflammatory diseases. Molecules 2022, 27, 7223. [Google Scholar] [CrossRef]
- Maiuolo, J.; Oppedisano, F.; Gratteri, S.; Muscoli, C.; Mollace, V. Regulation of uric acid metabolism and excretion. Int. J. Cardiol. 2016, 213, 8–14. [Google Scholar] [CrossRef]
- Nahas, P.C.; Rossato, L.T.; de Branco, F.M.S.; Azeredo, C.M.; Rinaldi, A.E.M.; de Oliveira, E.P. Serum uric acid is positively associated with muscle strength in older men and women: Findings from NHANES 1999-2002. Clin. Nutr. 2021, 40, 4386–4393. [Google Scholar] [CrossRef]
- Nahas, P.C.; de Branco, F.M.S.; Azeredo, C.M.; Rinaldi, A.E.M.; de Oliveira, E.P. Serum uric acid is not associated with appendicular muscle mass index in young and middle-aged adults: Results from NHANES 2011-2012. Clin. Nutr. ESPEN 2022, 52, 262–269. [Google Scholar] [CrossRef]
- Drey, M. Sarcopenia—Pathophysiology and clinical relevance. Wien. Med. Wochenschr. 2011, 161, 402–408. [Google Scholar] [CrossRef] [PubMed]
- Abraham, A.; Drory, V.E. Influence of serum uric acid levels on prognosis and survival in amyotrophic lateral sclerosis: A meta-analysis. J. Neurol. 2014, 261, 1133–1138. [Google Scholar] [CrossRef] [PubMed]
- Lee, J.; Hong, Y.S.; Park, S.H.; Kang, K.Y. High serum uric acid level is associated with greater handgrip strength in the aged population. Arthritis Res. Ther. 2019, 21, 73. [Google Scholar] [CrossRef]
- Iwama, M.; Kondo, Y.; Shimokado, K.; Maruyama, N.; Ishigami, A. Uric acid levels in tissues and plasma of mice during aging. Biol. Pharm. Bull. 2012, 35, 1367–1370. [Google Scholar] [CrossRef] [PubMed]
- Batta, A. Uric Acid is a Significant Antioxidant. Eur. J. Pharm. Med. Res. 2016, 2016, 242–248. [Google Scholar]
- Nile, S.H.; Park, S.W. Chromatographic analysis, antioxidant, anti-inflammatory, and xanthine oxidase inhibitory activities of ginger extracts and its reference compounds. Ind. Crops Prod. 2015, 70, 238–244. [Google Scholar] [CrossRef]
- Packer, M. Uric acid is a biomarker of oxidative stress in the failing heart: Lessons learned from trials with allopurinol and SGLT2 inhibitors. J. Card. Fail. 2020, 26, 977–984. [Google Scholar] [CrossRef]
- Ostojic, S.M.; Premusz, V.; Nagy, D.; Acs, P. Guanidinoacetic acid as a novel food for skeletal muscle health. J. Funct. Foods 2020, 73, 104129. [Google Scholar] [CrossRef]
- Wu, H.; Tang, D.; Yun, M.; Liu, H.; Huang, S.; Yun, C.; Hocher, B.; Zhang, X.; Liu, F.; Yin, L. Metabolic dysfunctions of intestinal fatty acids and tryptophan reveal immuno-inflammatory response activation in IgA nephropathy. Front. Med. 2022, 9, 22. [Google Scholar] [CrossRef]
- Arnold, R.; Issar, T.; Krishnan, A.V.; Pussell, B.A. Neurological complications in chronic kidney disease. JRSM Cardiovasc. Dis. 2016, 5, 2048004016677687. [Google Scholar] [CrossRef]
- Wishart, D.S. Metabolomics for investigating physiological and pathophysiological processes. Physiol. Rev. 2019, 99, 1819–1875. [Google Scholar] [CrossRef] [PubMed]
- Tessari, P. Leucine Transamination Is Lower in Middle-Aged Compared with Younger Adults. J. Nutr. 2017, 147, 2025–2030. [Google Scholar] [CrossRef] [PubMed][Green Version]
- Opazo, R.; Angel, B.; Márquez, C.; Lera, L.; Cardoso Dos Santos, G.R.; Monnerat, G.; Albala, C. Sarcopenic metabolomic profile reflected a sarcopenic phenotype associated with amino acid and essential fatty acid changes. Metabolomics 2021, 17, 83. [Google Scholar] [CrossRef]
- Lin, C.-C.; Shih, M.-H.; Chen, C.-D.; Yeh, S.-L. Effects of adequate dietary protein with whey protein, leucine, and vitamin D supplementation on sarcopenia in older adults: An open-label, parallel-group study. Clin. Nutr. 2021, 40, 1323–1329. [Google Scholar] [CrossRef] [PubMed]
- Chae, M.; Park, H.S.; Park, K. Association between dietary branched-chain amino acid intake and skeletal muscle mass index among Korean adults: Interaction with obesity. Nutr. Res. Pract. 2020, 15, 203–212. [Google Scholar] [CrossRef] [PubMed]
- Yoshizawa, F.; Mochizuki, S.; Sugahara, K. Differential dose response of mTOR signaling to oral administration of leucine in skeletal muscle and liver of rats. Biosci. Biotechnol. Biochem. 2013, 77, 839–842. [Google Scholar] [CrossRef]
- Duan, Y.; Zeng, L.; Li, F.; Wang, W.; Li, Y.; Guo, Q.; Ji, Y.; Tan, B.e.; Yin, Y. Effect of branched-chain amino acid ratio on the proliferation, differentiation, and expression levels of key regulators involved in protein metabolism of myocytes. Nutrition 2017, 36, 8–16. [Google Scholar] [CrossRef]
- Petrocelli, J.J.; Mahmassani, Z.S.; Fix, D.K.; Montgomery, J.A.; Reidy, P.T.; McKenzie, A.I.; de Hart, N.M.; Ferrara, P.J.; Kelley, J.J.; Eshima, H. Metformin and leucine increase satellite cells and collagen remodeling during disuse and recovery in aged muscle. FASEB J. 2021, 35, e21862. [Google Scholar] [CrossRef]
- Parkhitko, A.A.; Jouandin, P.; Mohr, S.E.; Perrimon, N. Methionine metabolism and methyltransferases in the regulation of aging and lifespan extension across species. Aging Cell 2019, 18, e13034. [Google Scholar] [CrossRef]
- Tripodi, F.; Castoldi, A.; Nicastro, R.; Reghellin, V.; Lombardi, L.; Airoldi, C.; Falletta, E.; Maffioli, E.; Scarcia, P.; Palmieri, L.; et al. Methionine supplementation stimulates mitochondrial respiration. Biochim. Biophys. Acta Mol. Cell Res. 2018, 1865, 1901–1913. [Google Scholar] [CrossRef]
- Perrone, C.E.; Mattocks, D.A.L.; Jarvis-Morar, M.; Plummer, J.D.; Orentreich, N. Methionine restriction effects on mitochondrial biogenesis and aerobic capacity in white adipose tissue, liver, and skeletal muscle of F344 rats. Metabolism 2010, 59, 1000–1011. [Google Scholar] [CrossRef]
- Kozieł, R.; Ruckenstuhl, C.; Albertini, E.; Neuhaus, M.; Netzberger, C.; Bust, M.; Madeo, F.; Wiesner, R.J.; Jansen-Dürr, P. Methionine restriction slows down senescence in human diploid fibroblasts. Aging Cell 2014, 13, 1038–1048. [Google Scholar] [CrossRef]
- Sanchez-Roman, I.; Barja, G. Regulation of longevity and oxidative stress by nutritional interventions: Role of methionine restriction. Exp. Gerontol. 2013, 48, 1030–1042. [Google Scholar] [CrossRef] [PubMed]
- Kim, J.; Guan, K.-L. mTOR as a central hub of nutrient signalling and cell growth. Nat. Cell Biol. 2019, 21, 63–71. [Google Scholar] [CrossRef] [PubMed]
- Ano, Y.; Ozawa, M.; Kutsukake, T.; Sugiyama, S.; Uchida, K.; Yoshida, A.; Nakayama, H. Preventive effects of a fermented dairy product against Alzheimer’s disease and identification of a novel oleamide with enhanced microglial phagocytosis and anti-inflammatory activity. PLoS ONE 2015, 10, e0118512. [Google Scholar] [CrossRef] [PubMed]
- Zhang, J.; Bhattacharyya, S.; Hickner, R.C.; Light, A.R.; Lambert, C.J.; Gale, B.K.; Fiehn, O.; Adams, S.H. Skeletal muscle interstitial fluid metabolomics at rest and associated with an exercise bout: Application in rats and humans. Am. J. Physiol. Endocrinol. Metab. 2019, 316, E43–E53. [Google Scholar] [CrossRef]
- Kobayashi, Y.; Watanabe, N.; Kitakaze, T.; Sugimoto, K.; Izawa, T.; Kai, K.; Harada, N.; Yamaji, R. Oleamide rescues tibialis anterior muscle atrophy of mice housed in small cages. Br. J. Nutr. 2021, 126, 481–491. [Google Scholar] [CrossRef]
- Ueland, P.M.; McCann, A.; Midttun, Ø.; Ulvik, A. Inflammation, vitamin B6 and related pathways. Mol. Aspects Med. 2017, 53, 10–27. [Google Scholar] [CrossRef]
- Kumar, A.; Kumar, Y.; Sevak, J.K.; Kumar, S.; Kumar, N.; Gopinath, S.D. Metabolomic analysis of primary human skeletal muscle cells during myogenic progression. Sci. Rep. 2020, 10, 11824. [Google Scholar] [CrossRef]
- Suidasari, S.; Uragami, S.; Yanaka, N.; Kato, N. Dietary vitamin B6 modulates the gene expression of myokines, Nrf2-related factors, myogenin and HSP60 in the skeletal muscle of rats. Exp. Ther. Med. 2017, 14, 3239–3246. [Google Scholar] [CrossRef]
- Kumrungsee, T.; Onishi, K.; Komaru, T.; Yanaka, N.; Kato, N. Vitamin B6 Regulates Muscle Satellite Cell Function: A Novel Possible Role of Vitamin B6 in Muscle Regeneration. Curr. Dev. Nutr. 2020, 4, 4141818. [Google Scholar] [CrossRef]
- Calderón-Ospina, C.A.; Nava-Mesa, M.O. B Vitamins in the nervous system: Current knowledge of the biochemical modes of action and synergies of thiamine, pyridoxine, and cobalamin. CNS Neurosci. Ther. 2020, 26, 5–13. [Google Scholar] [CrossRef] [PubMed]
- Zhou, J.; Effiong, U. Isolated Pyridoxine Deficiency Presenting as Muscle Spasms in a Patient With Type 2 Diabetes: A Case Report and Literature Review. Am. J. Med. Sci. 2021, 361, 791–794. [Google Scholar] [CrossRef] [PubMed]
- Yoshino, J.; Baur, J.A.; Imai, S.-i. NAD+ intermediates: The biology and therapeutic potential of NMN and NR. Cell Metab. 2018, 27, 513–528. [Google Scholar] [CrossRef]
- Wohlrab, J.; Kreft, D. Niacinamide—Mechanisms of action and its topical use in dermatology. Skin. Pharmacol. Physiol. 2014, 27, 311–315. [Google Scholar] [CrossRef]
- Villeda-González, J.D.; Gómez-Olivares, J.L.; Baiza-Gutman, L.A.; Manuel-Apolinar, L.; Damasio-Santana, L.; Millán-Pacheco, C.; Ángeles-Mejía, S.; Cortés-Ginez, M.C.; Cruz-López, M.; Vidal-Moreno, C.J.; et al. Nicotinamide reduces inflammation and oxidative stress via the cholinergic system in fructose-induced metabolic syndrome in rats. Life Sci. 2020, 250, 117585. [Google Scholar] [CrossRef]
- Bierman, J.C.; Laughlin, T.; Tamura, M.; Hulette, B.C.; Mack, C.E.; Sherrill, J.D.; Tan, C.Y.R.; Morenc, M.; Bellanger, S.; Oblong, J.E. Niacinamide mitigates SASP-related inflammation induced by environmental stressors in human epidermal keratinocytes and skin. Int. J. Cosmet. Sci. 2020, 42, 501–511. [Google Scholar] [CrossRef]
- Sahin, K.; Kucuk, O.; Orhan, C.; Tuzcu, M.; Durmus, A.S.; Ozercan, I.H.; Sahin, N.; Juturu, V. Niacinamide and undenatured type II collagen modulates the inflammatory response in rats with monoiodoacetate-induced osteoarthritis. Sci. Rep. 2021, 11, 14724. [Google Scholar] [CrossRef]
- Unuofin, J.O.; Masuku, N.P.; Paimo, O.K.; Lebelo, S.L. Ginger from farmyard to town: Nutritional and pharmacological applications. Front. Pharmacol. 2021, 12, 779352. [Google Scholar] [CrossRef]
- Shieh, P.-C.; Chen, Y.-O.; Kuo, D.-H.; Chen, F.-A.; Tsai, M.-L.; Chang, I.-S.; Wu, H.; Sang, S.; Ho, C.-T.; Pan, M.-H. Induction of Apoptosis by (8)-Shogaol via Reactive Oxygen Species Generation, Glutathione Depletion, and Caspase Activation in Human Leukemia Cells. J. Agric. Food Chem. 2010, 58, 3847–3854. [Google Scholar] [CrossRef]
- Jo, S.; Samarpita, S.; Lee, J.S.; Lee, Y.J.; Son, J.E.; Jeong, M.; Kim, J.H.; Hong, S.; Yoo, S.-A.; Kim, W.-U.; et al. 8-Shogaol inhibits rheumatoid arthritis through targeting TAK1. Pharmacol. Res. 2022, 178, 106176. [Google Scholar] [CrossRef] [PubMed]
- Kim, H.-R.; Noh, E.-M.; Kim, S.-Y. Anti-inflammatory effect and signaling mechanism of 8-shogaol and 10-shogaol in a dextran sodium sulfate-induced colitis mouse model. Heliyon 2023, 9, e12778. [Google Scholar] [CrossRef] [PubMed]
- Shen, Y.; Zhang, Y.; Li, W.; Chen, K.; Xiang, M.; Ma, H. Glutamine metabolism: From proliferating cells to cardiomyocytes. Metabolism 2021, 121, 154778. [Google Scholar] [CrossRef]
- Yoo, H.C.; Yu, Y.C.; Sung, Y.; Han, J.M. Glutamine reliance in cell metabolism. Exp. Mol. Med. 2020, 52, 1496–1516. [Google Scholar] [CrossRef]
- van de Vyver, M.; Myburgh, K.H. Cytokine and satellite cell responses to muscle damage: Interpretation and possible confounding factors in human studies. J. Muscle Res. Cell Motil. 2012, 33, 177–185. [Google Scholar] [CrossRef] [PubMed]
- Girven, M.; Dugdale, H.F.; Owens, D.J.; Hughes, D.C.; Stewart, C.E.; Sharples, A.P. l-glutamine Improves Skeletal Muscle Cell Differentiation and Prevents Myotube Atrophy After Cytokine (TNF-α) Stress Via Reduced p38 MAPK Signal Transduction. J. Cell Physiol. 2016, 231, 2720–2732. [Google Scholar] [CrossRef]
- Gnoni, A.; Longo, S.; Gnoni, G.V.; Giudetti, A.M. Carnitine in human muscle bioenergetics: Can carnitine supplementation improve physical exercise? Molecules 2020, 25, 182. [Google Scholar] [CrossRef]
- Fielding, R.; Riede, L.; Lugo, J.P.; Bellamine, A. L-carnitine supplementation in recovery after exercise. Nutrients 2018, 10, 349. [Google Scholar] [CrossRef]
- Ohara, M.; Ogawa, K.; Suda, G.; Kimura, M.; Maehara, O.; Shimazaki, T.; Suzuki, K.; Nakamura, A.; Umemura, M.; Izumi, T. L-carnitine suppresses loss of skeletal muscle mass in patients with liver cirrhosis. Hepatol. Commun. 2018, 2, 910–922. [Google Scholar] [CrossRef]
- Evans, M.; Guthrie, N.; Pezzullo, J.; Sanli, T.; Fielding, R.A.; Bellamine, A. Efficacy of a novel formulation of L-Carnitine, creatine, and leucine on lean body mass and functional muscle strength in healthy older adults: A randomized, double-blind placebo-controlled study. Nutr. Metab. 2017, 14, 7. [Google Scholar] [CrossRef]
- Amorim, J.A.; Coppotelli, G.; Rolo, A.P.; Palmeira, C.M.; Ross, J.M.; Sinclair, D.A. Mitochondrial and metabolic dysfunction in ageing and age-related diseases. Nat. Rev. Endocrinol. 2022, 18, 243–258. [Google Scholar] [CrossRef] [PubMed]
Disclaimer/Publisher’s Note: The statements, opinions and data contained in all publications are solely those of the individual author(s) and contributor(s) and not of MDPI and/or the editor(s). MDPI and/or the editor(s) disclaim responsibility for any injury to people or property resulting from any ideas, methods, instructions or products referred to in the content. |
© 2023 by the authors. Licensee MDPI, Basel, Switzerland. This article is an open access article distributed under the terms and conditions of the Creative Commons Attribution (CC BY) license (https://creativecommons.org/licenses/by/4.0/).