

Sex Specific Differences in Response to Calorie Restriction in Skeletal Muscle of Young Rats

 ,
,  ,
,  ,
,  and
and
Abstract
1. Introduction
2. Materials and Methods
2.1. Animals and Diets
2.2. Total Protein Extraction
2.3. Western Blot Analysis
2.4. Determination of ATPase Enzymatic Activity
2.5. RT-qPCR
2.6. String Analysis
2.7. Statistical Analysis
3. Results
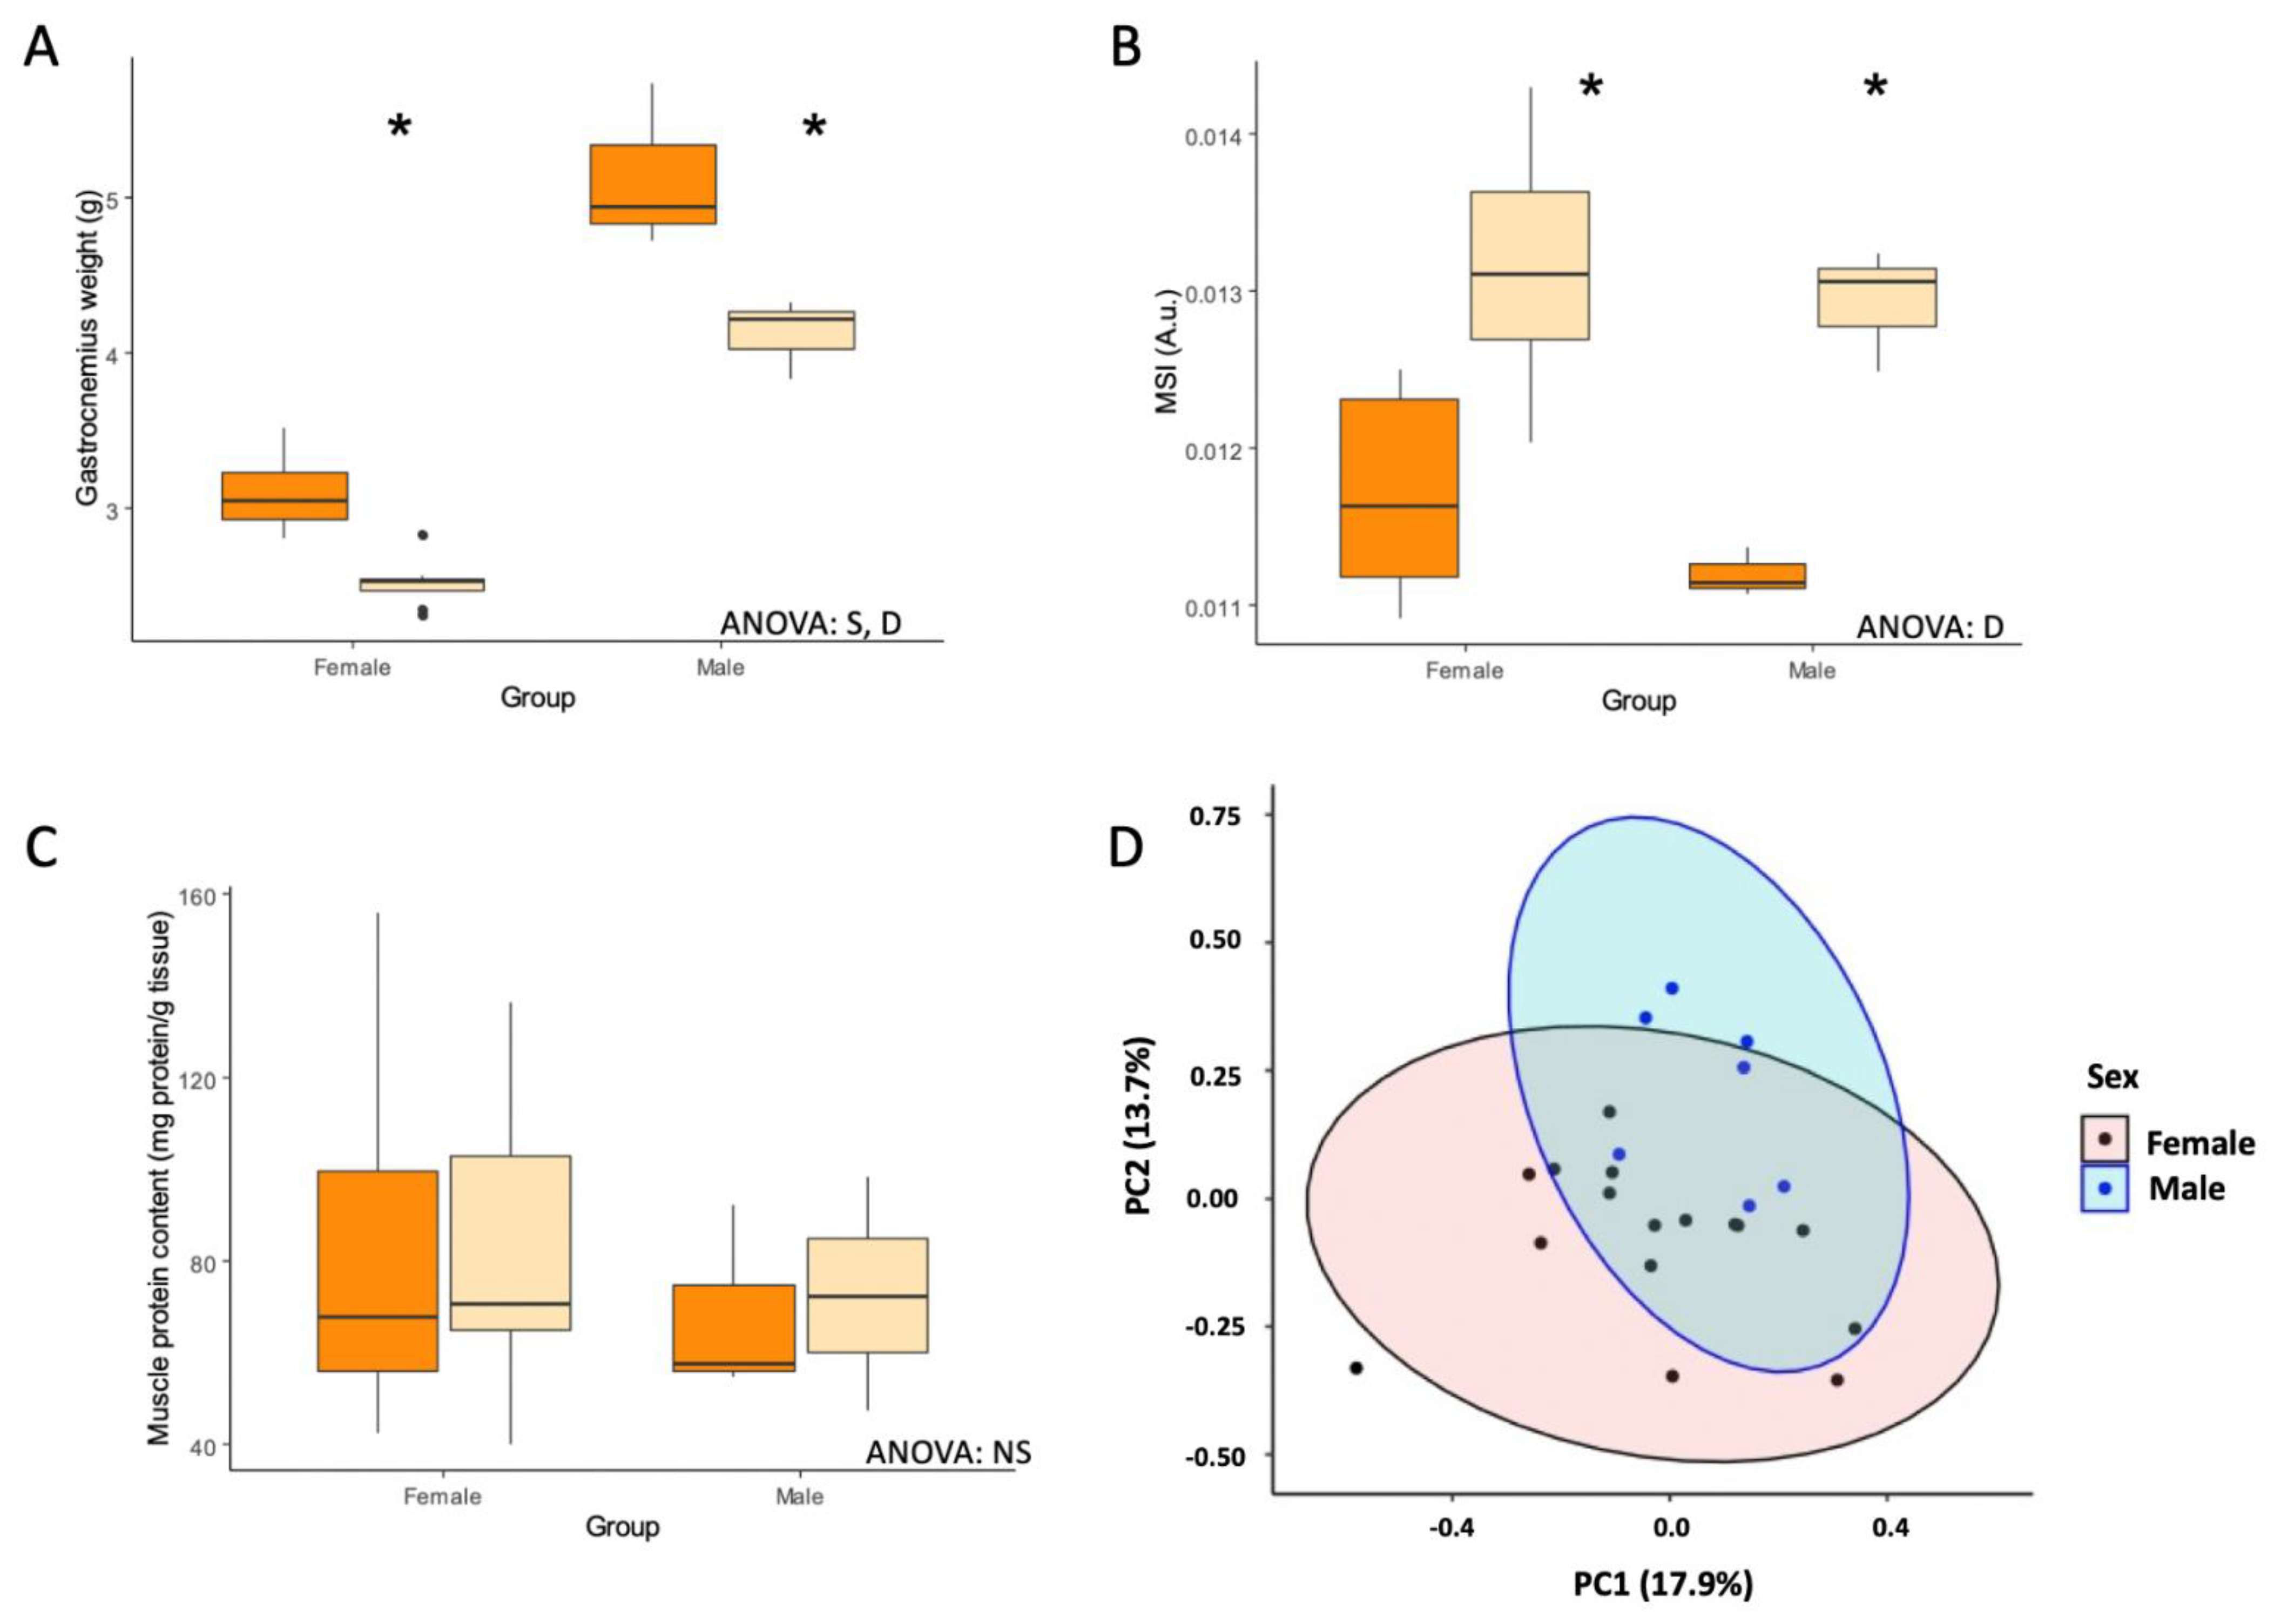
3.1. CR Reduced Body and Tissue Weights
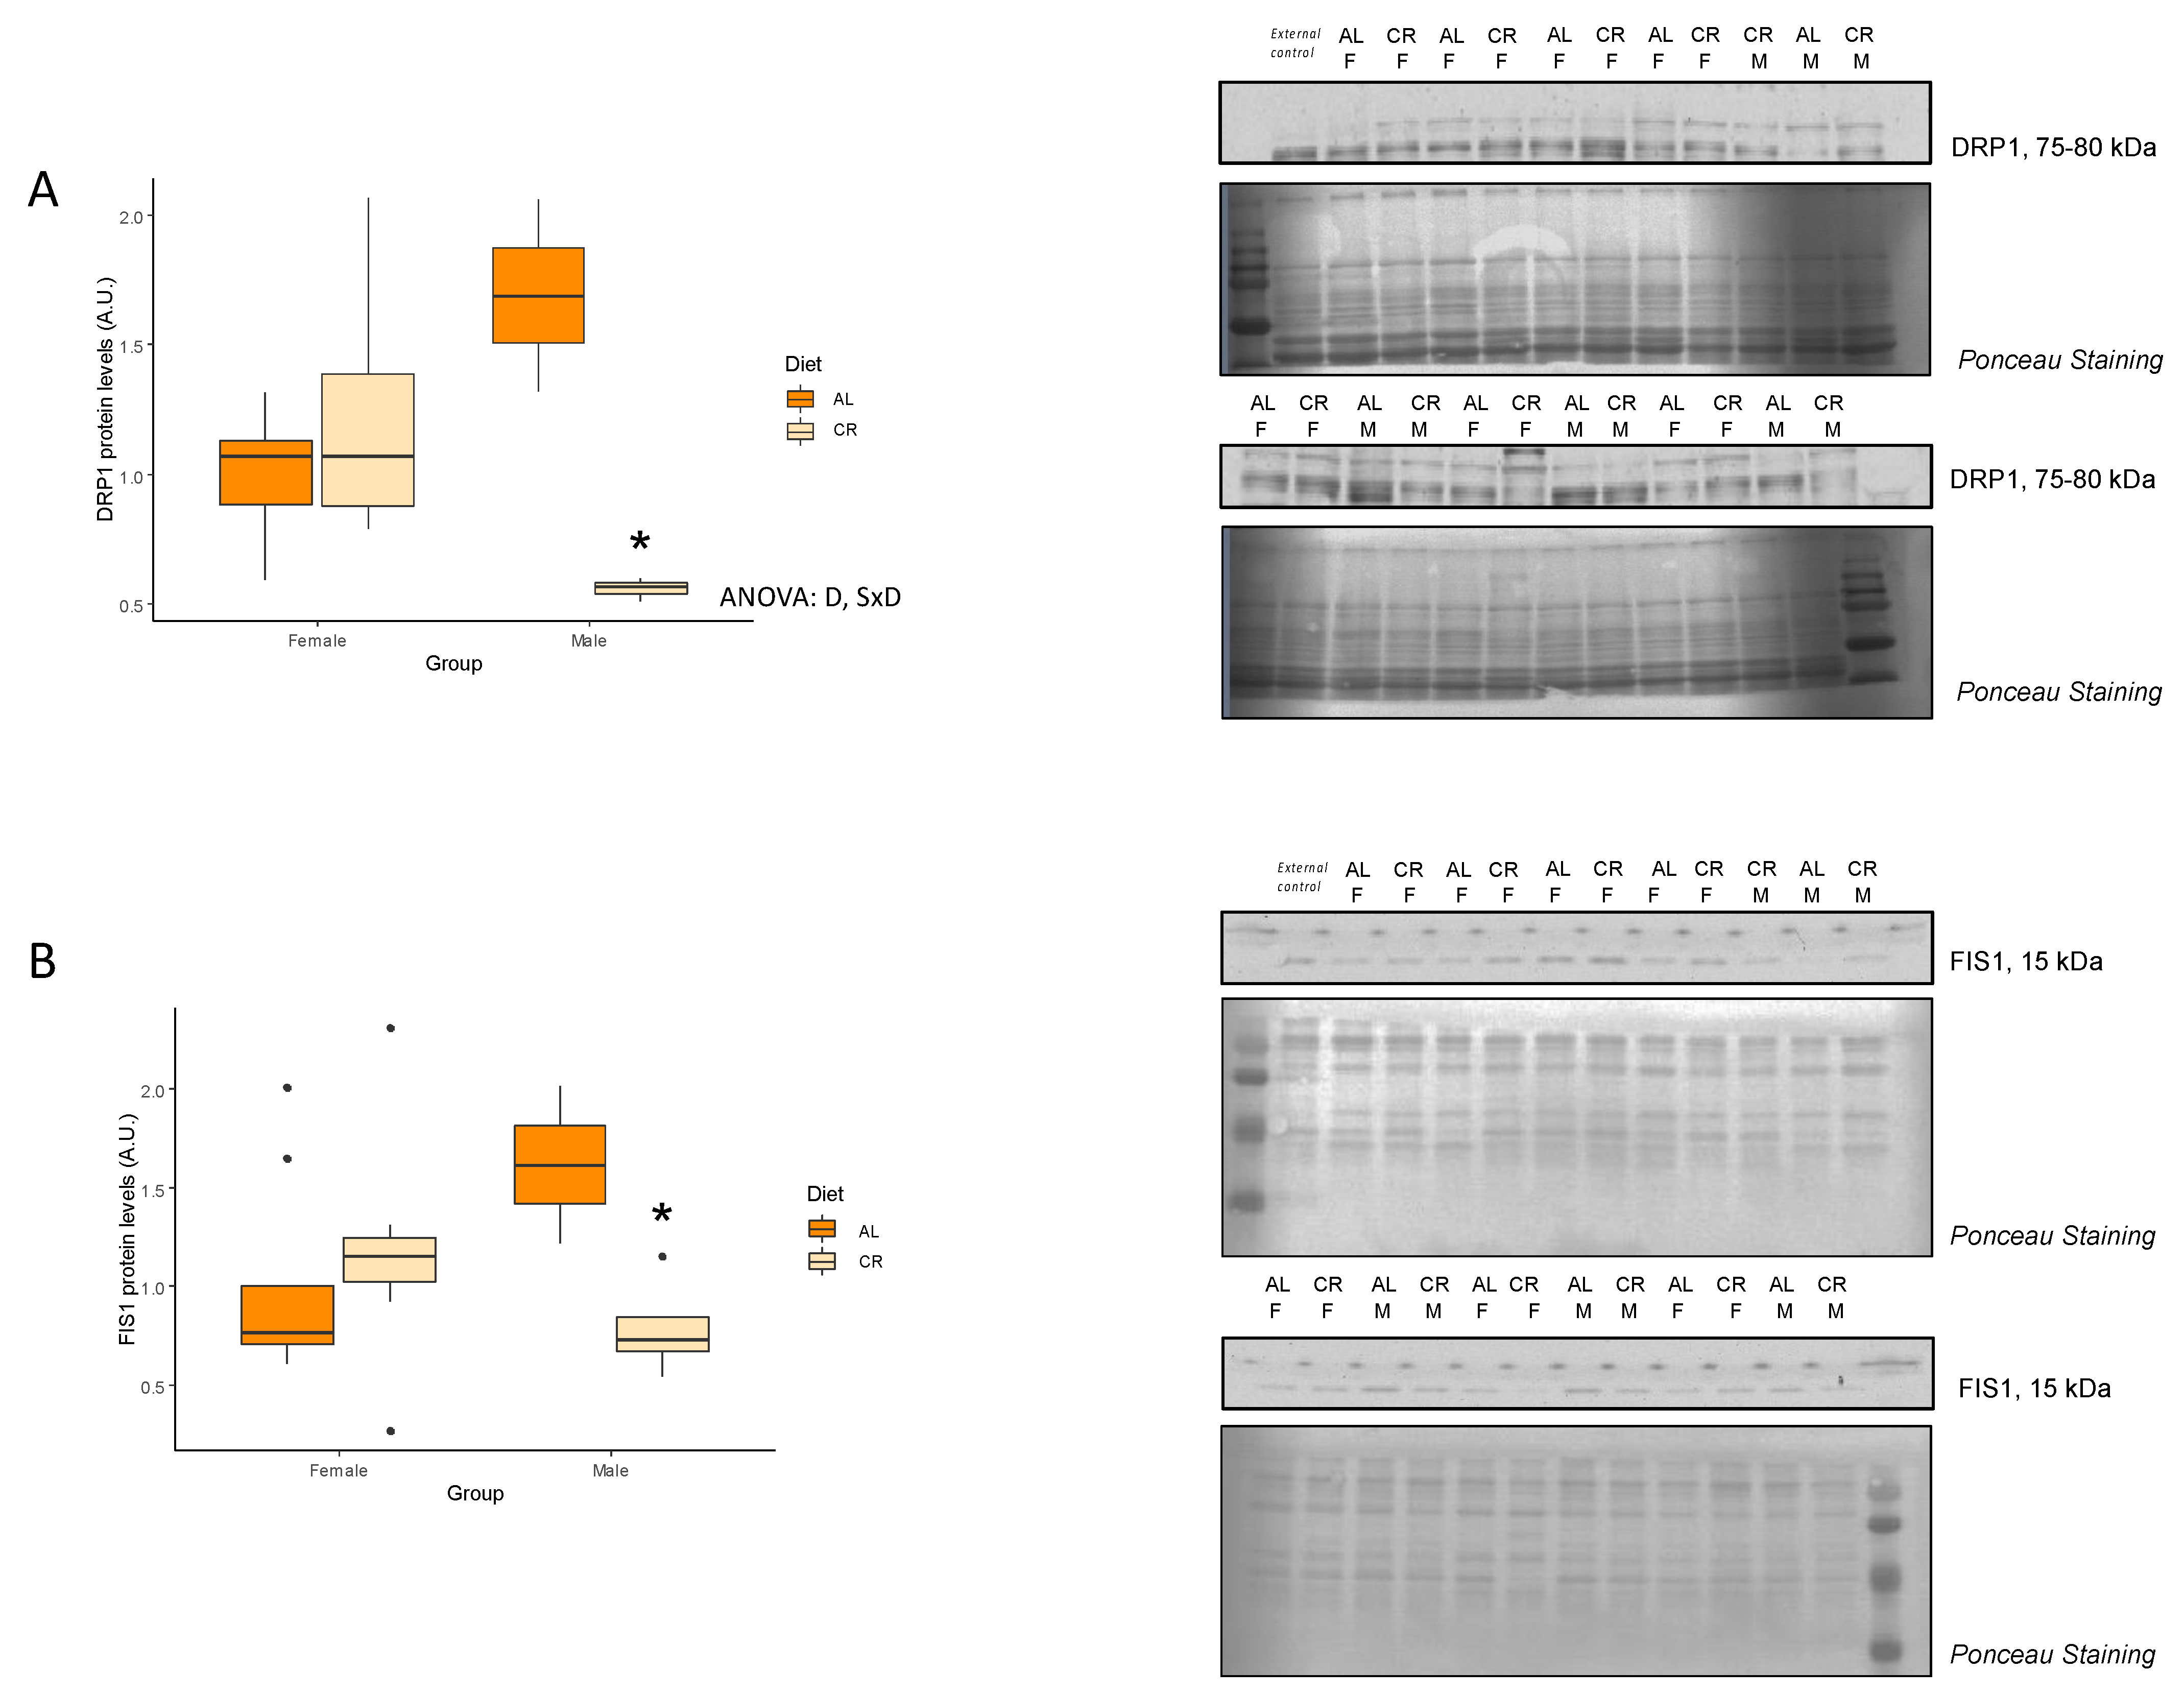
3.2. CR Effects on Mitochondrial Function and Dynamics
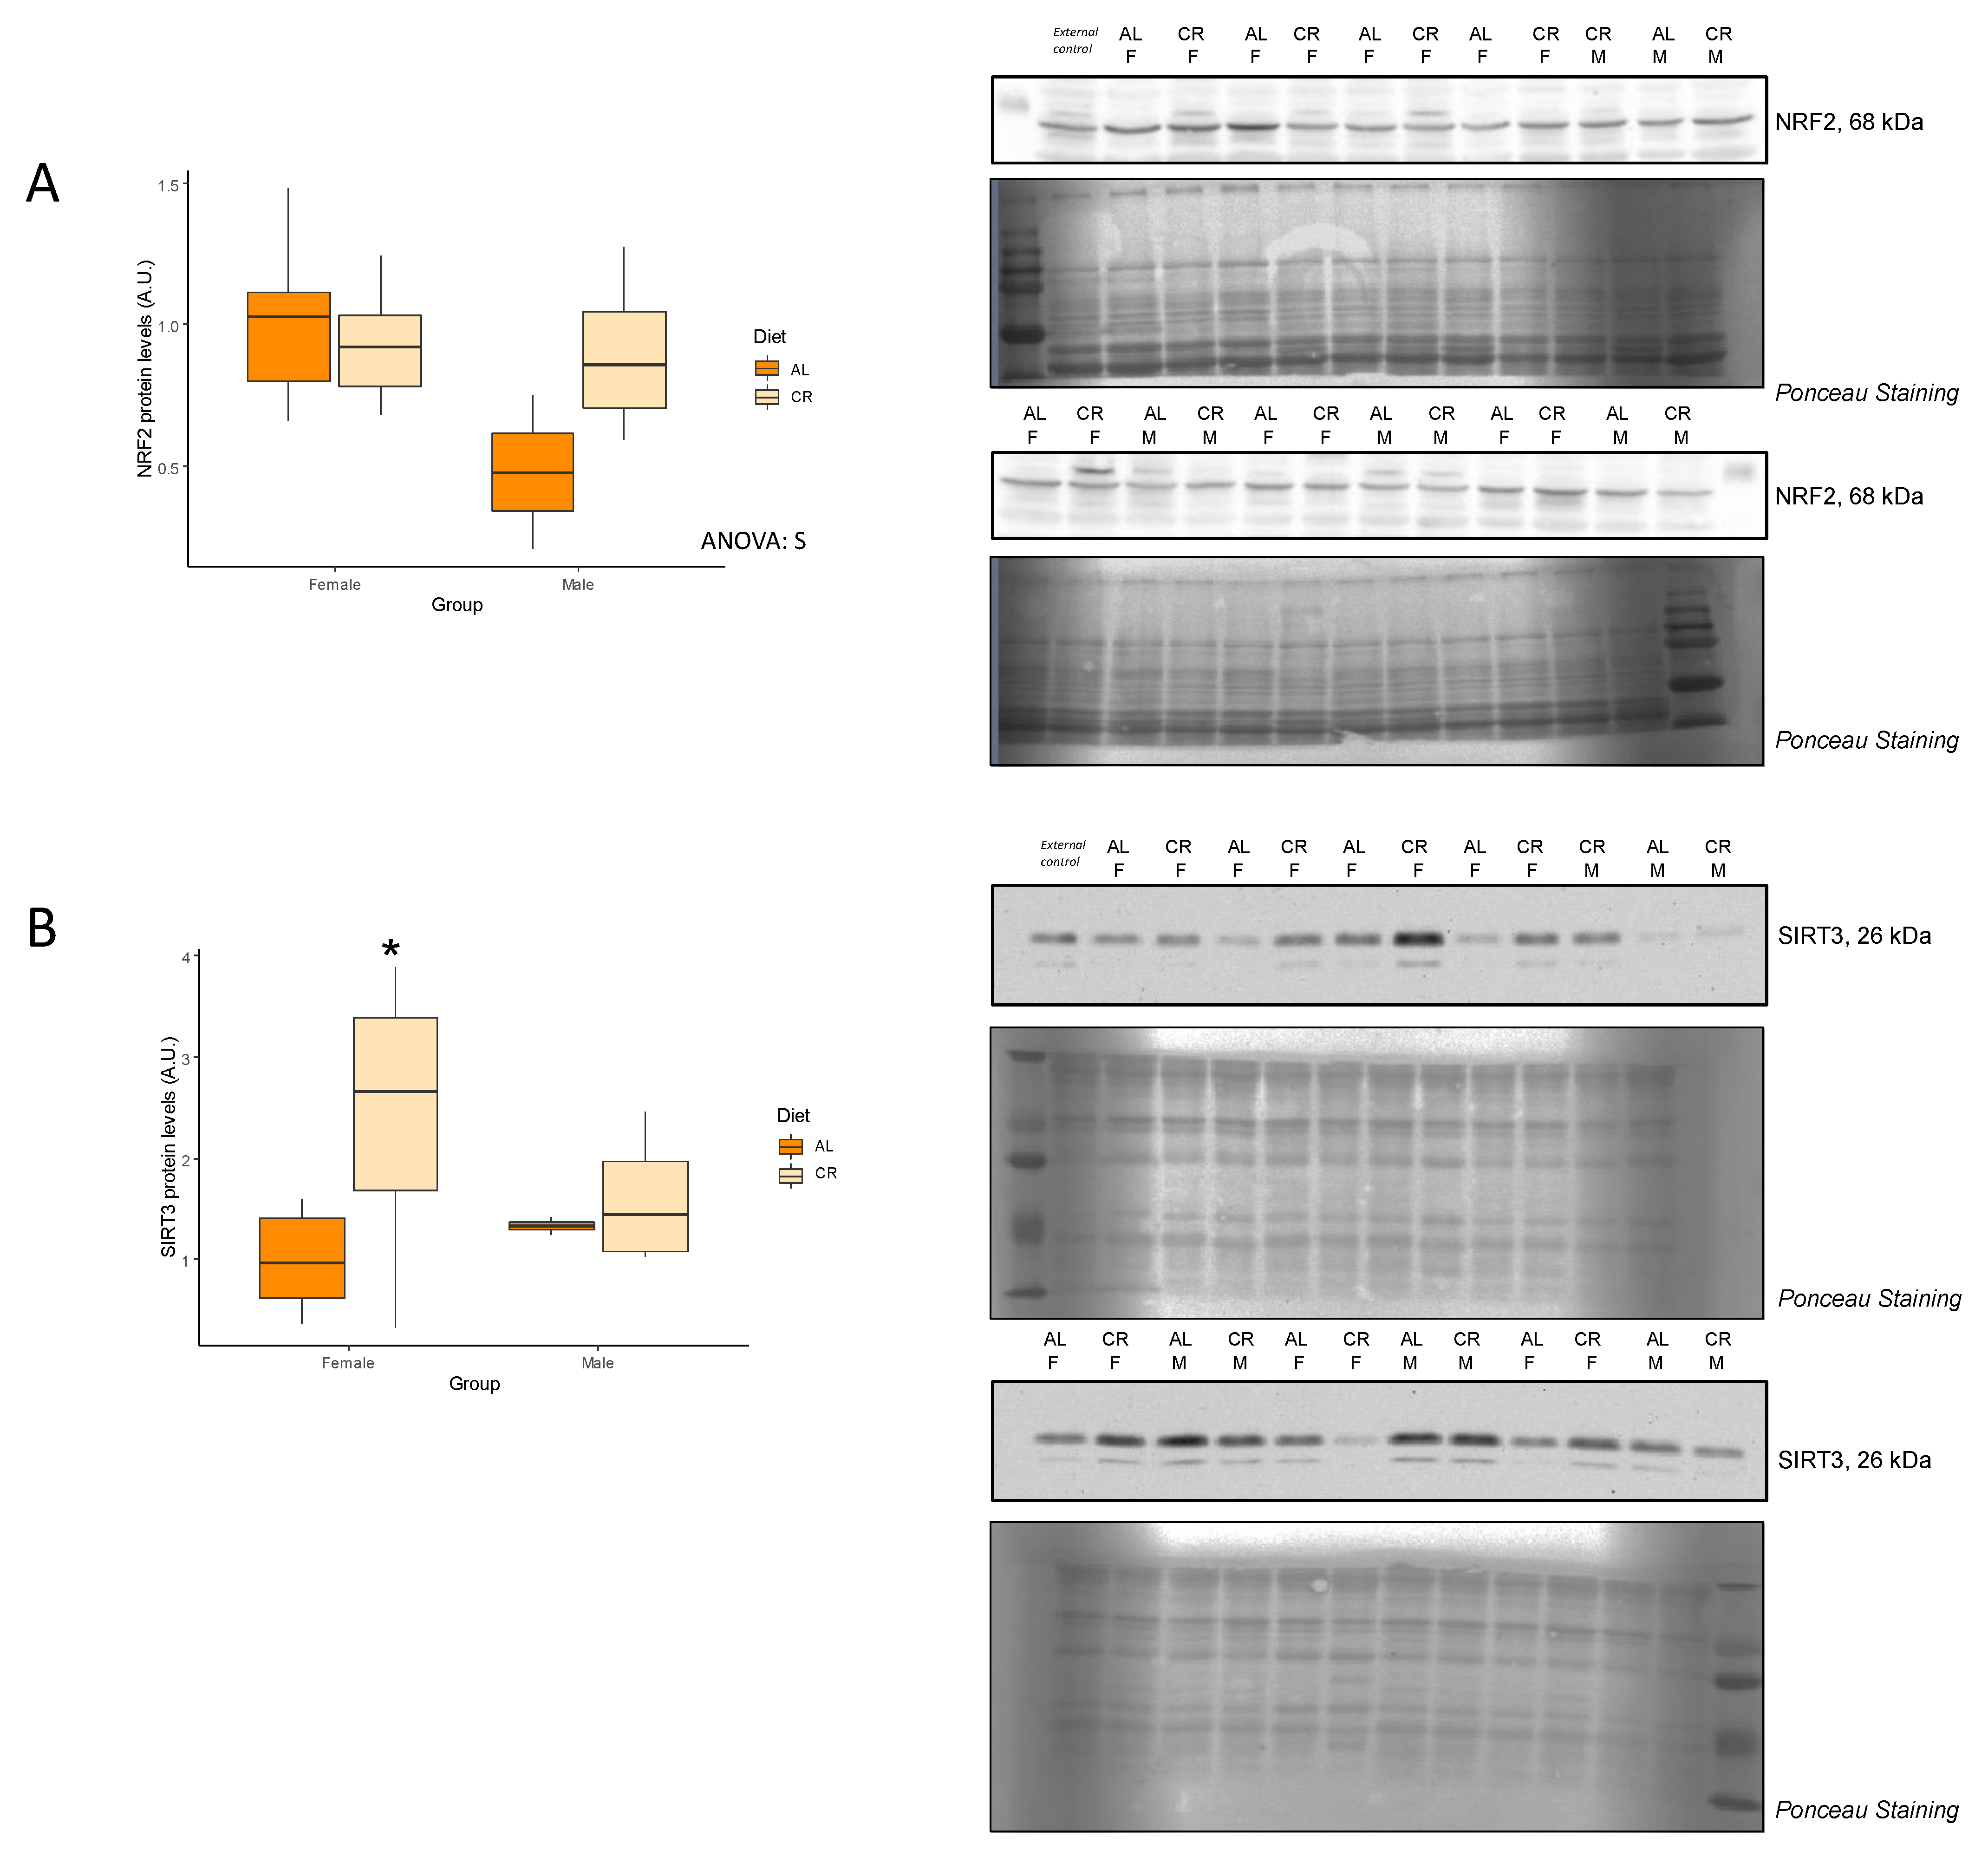
3.3. Antioxidant Proteins
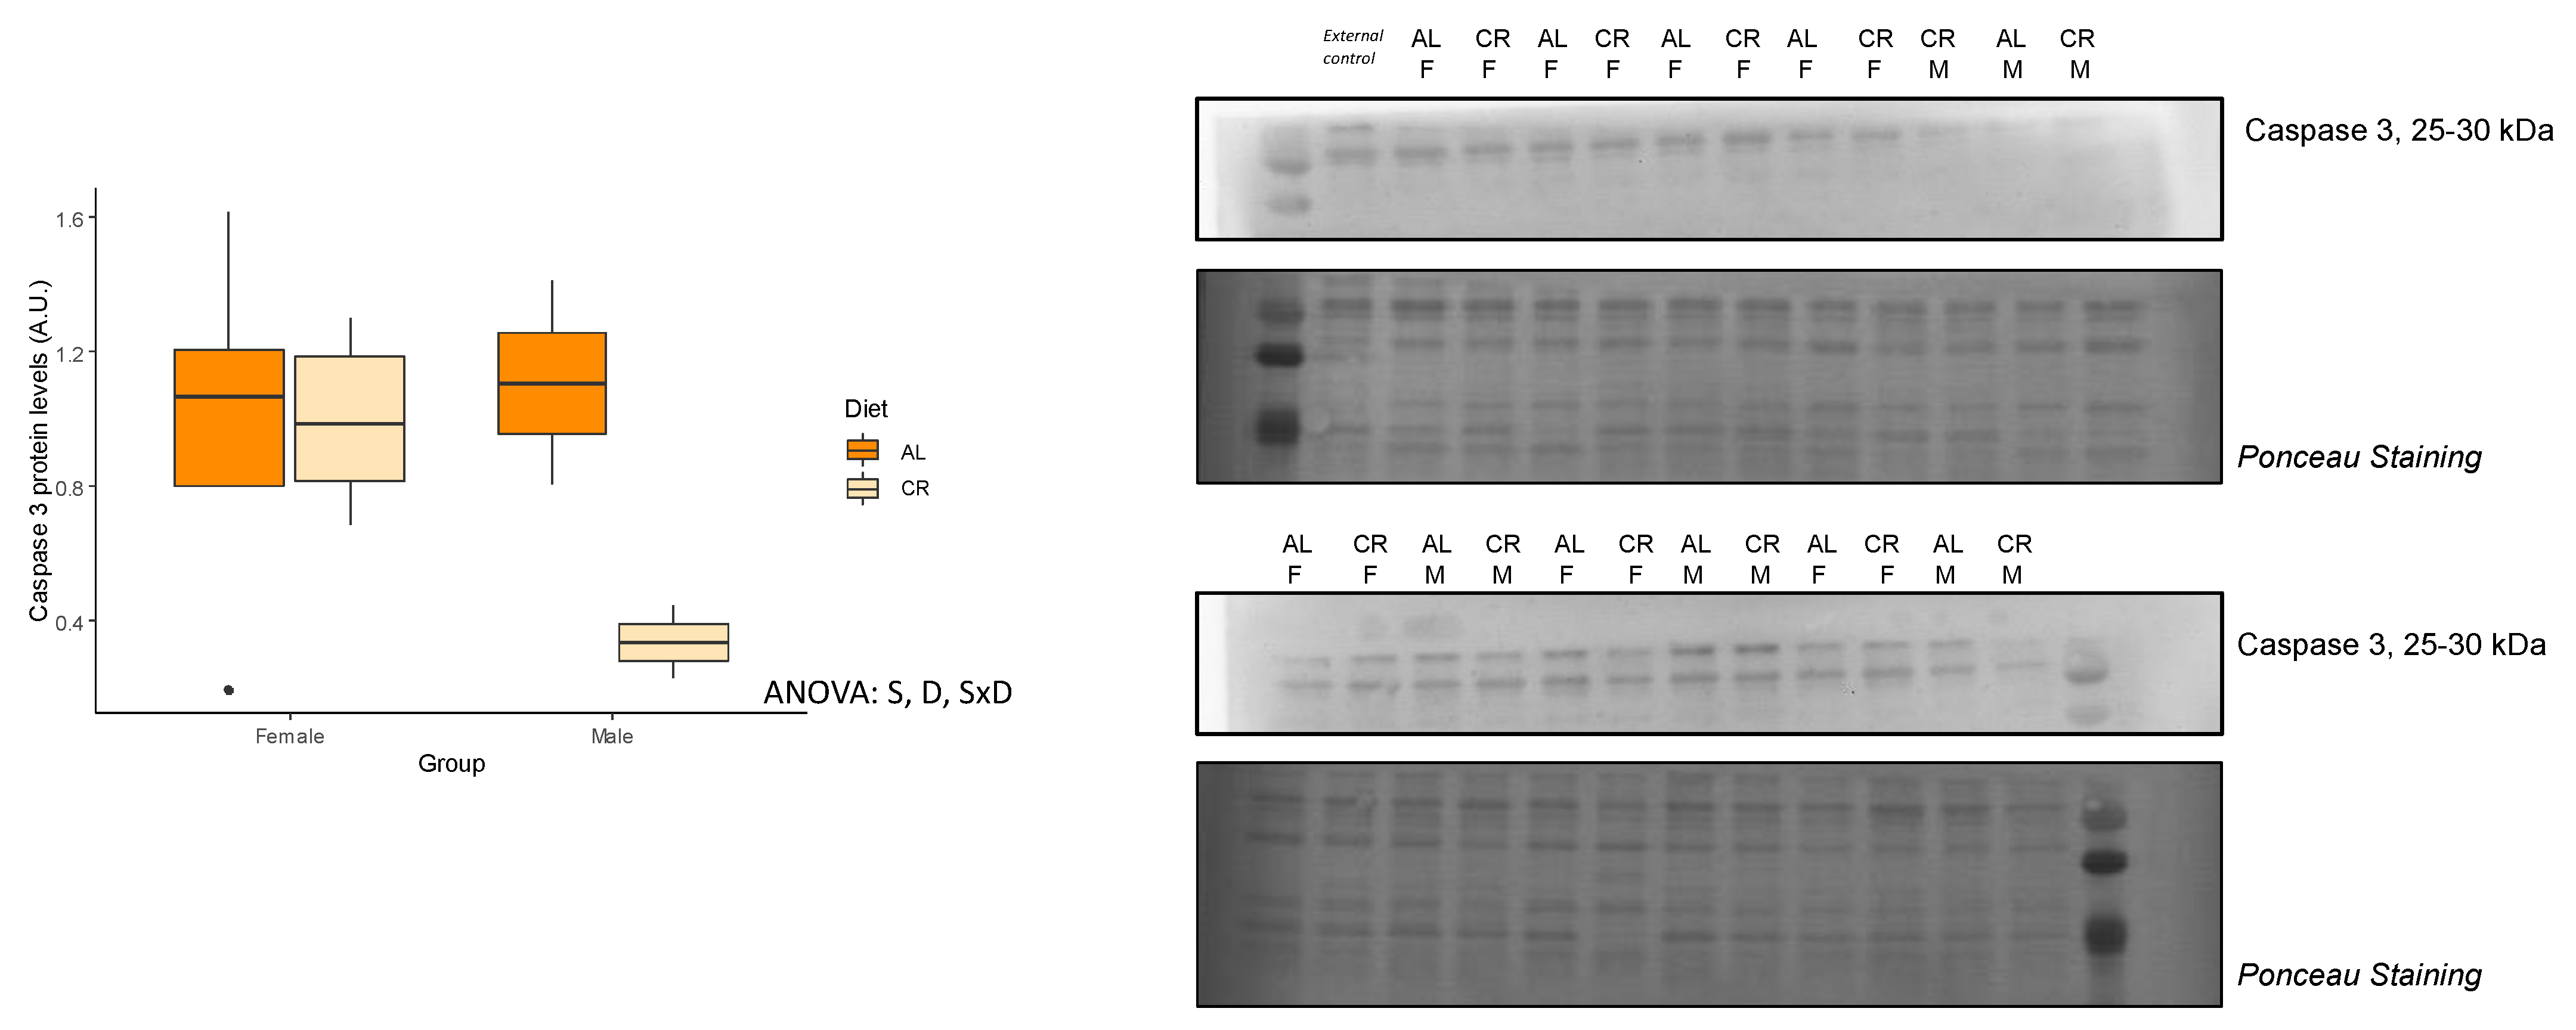
3.4. Autophagy and Apoptosis
3.5. Nutrient-Sensing Pathways
3.6. Inflammation and Senescence
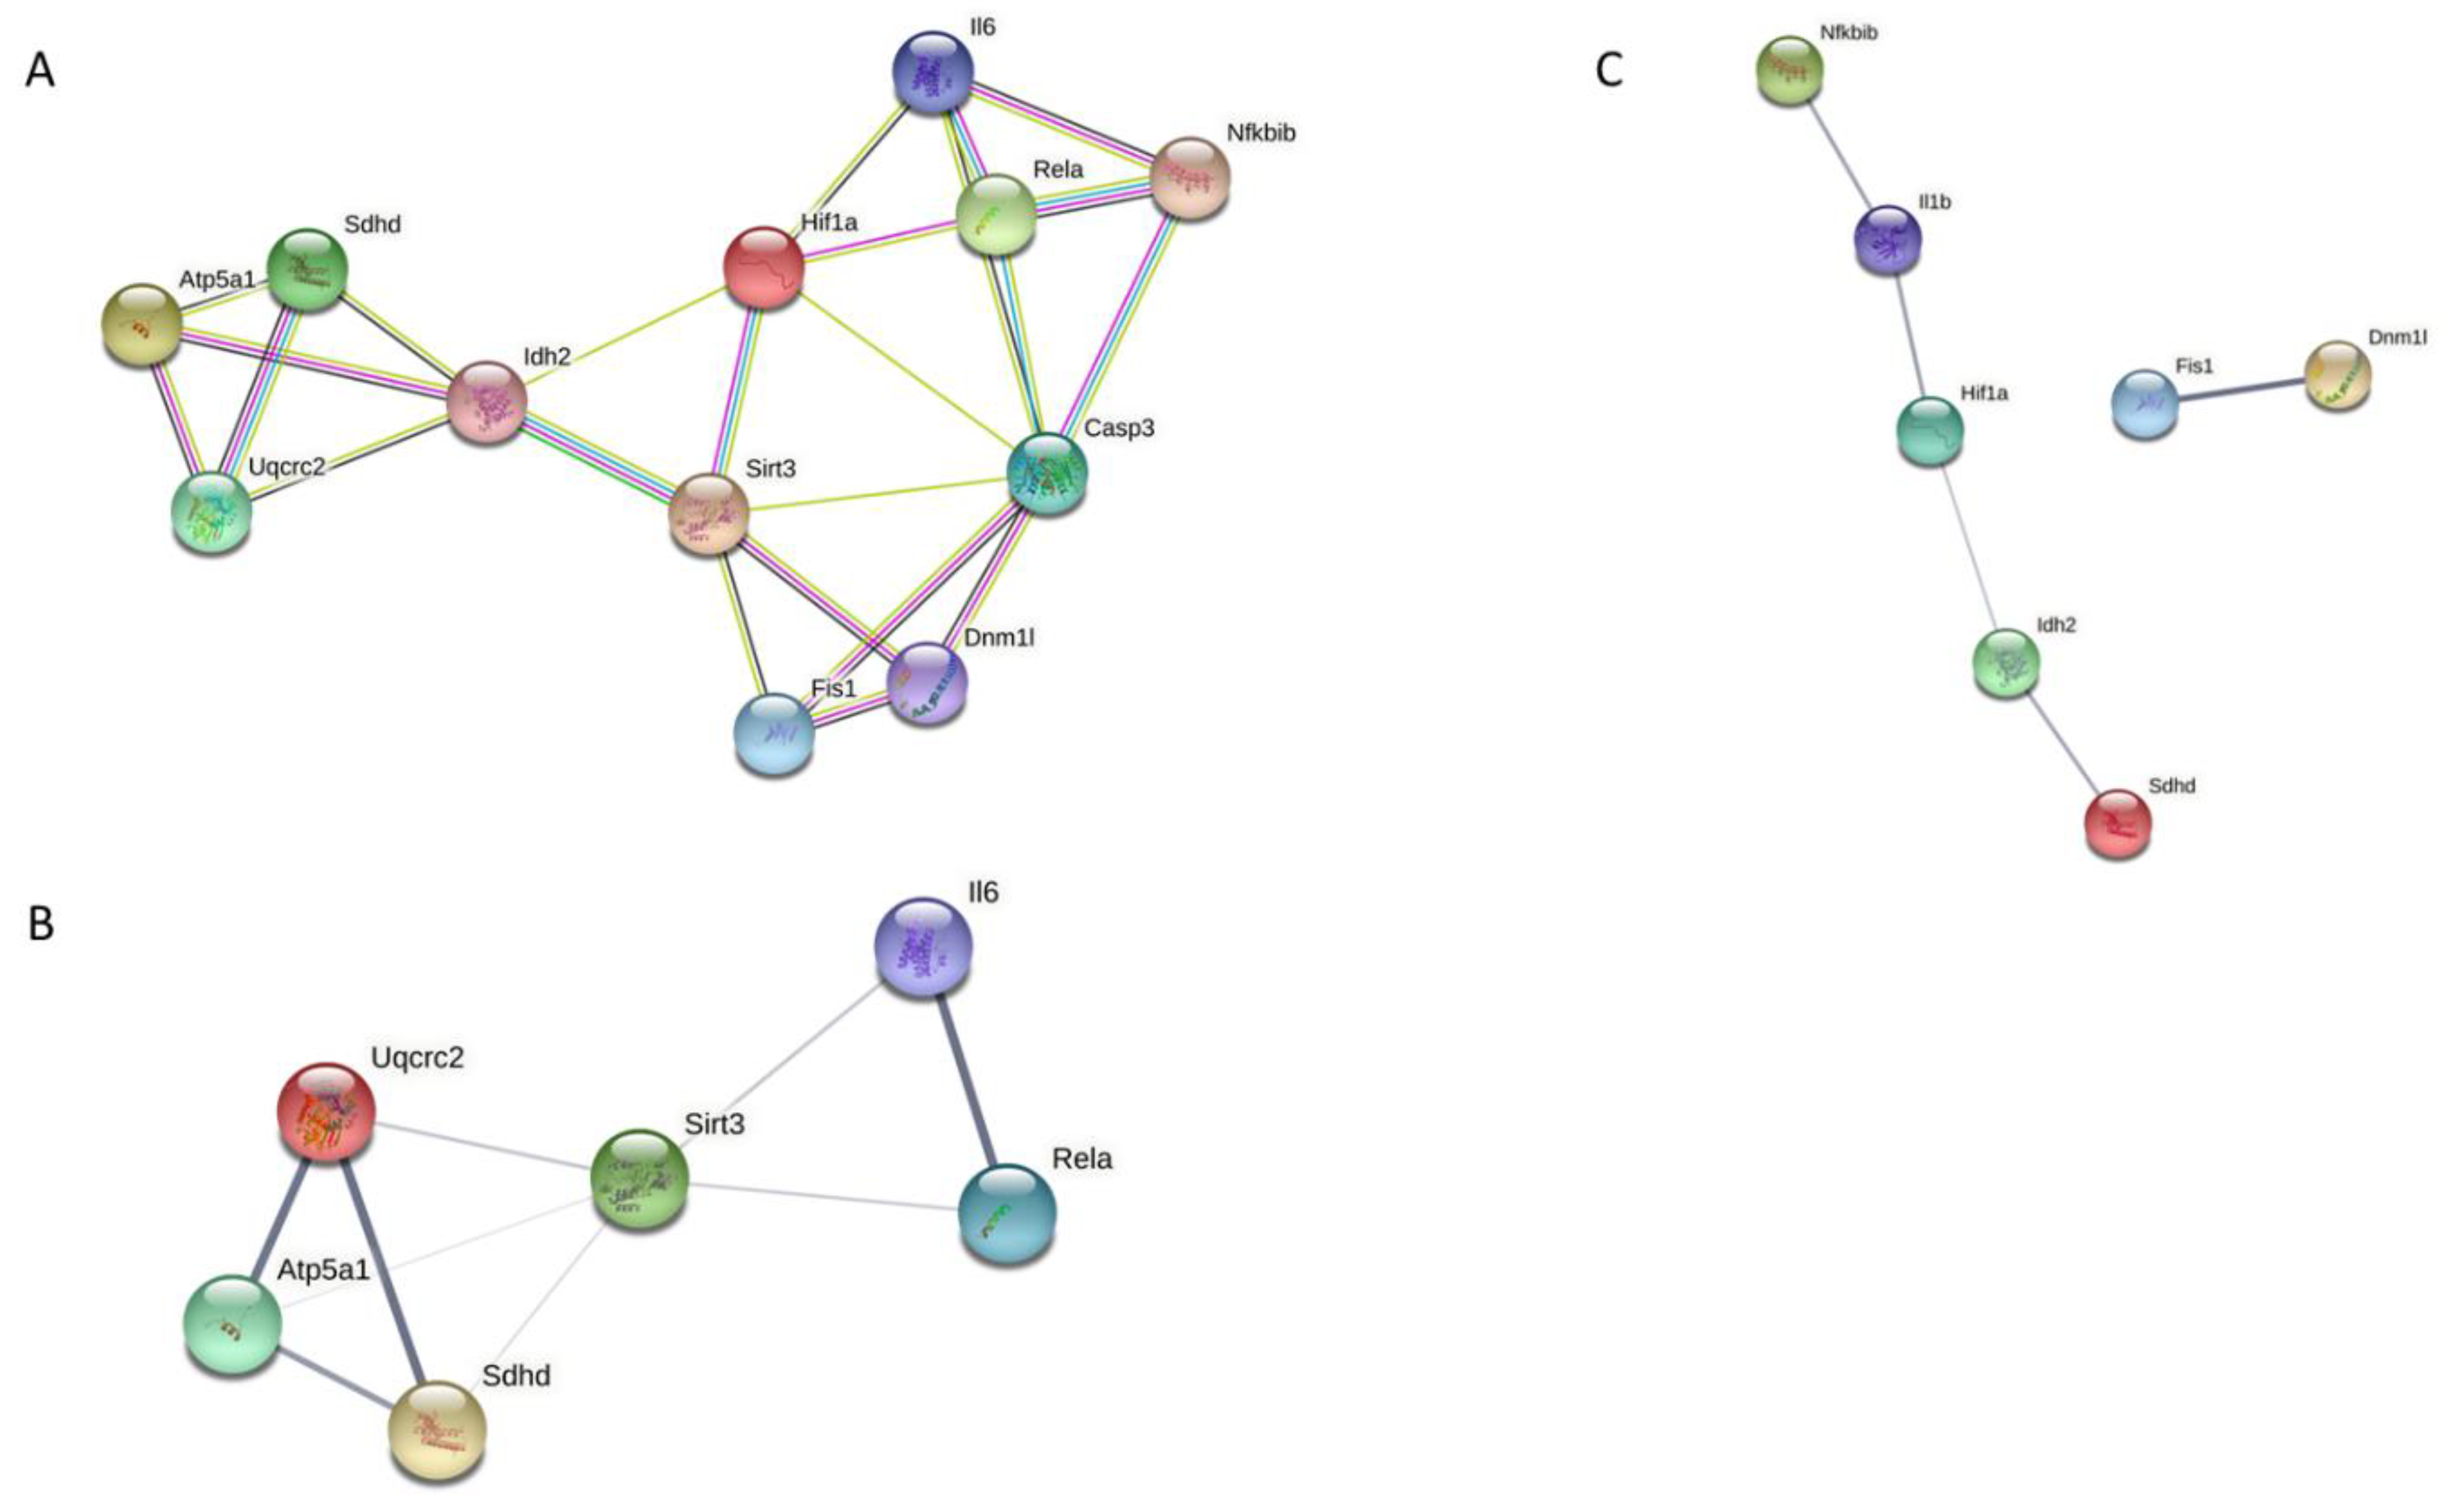
3.7. Analysis of Protein–Protein Interaction
4. Discussion
5. Conclusions
Supplementary Materials
Author Contributions
Funding
Institutional Review Board Statement
Data Availability Statement
Acknowledgments
Conflicts of Interest
References
- Giacomello, E.; Toniolo, L. The potential of calorie restriction and calorie restriction mimetics in delaying aging: Focus on experimental models. Nutrients 2021, 13, 2346. [Google Scholar] [CrossRef] [PubMed]
- Mitchell, S.J.; Madrigal-Matute, J.; Scheibye-Knudsen, M.; Fang, E.; Aon, M.; González-Reyes, J.A.; Cortassa, S.; Kaushik, S.; Gonzalez-Freire, M.; Patel, B.; et al. Effects of Sex, Strain, and Energy Intake on Hallmarks of Aging in Mice. Cell Metab. 2016, 23, 1093–1112. [Google Scholar] [CrossRef] [PubMed]
- Balasubramanian, P.; Howell, P.R.; Anderson, R.M. Aging and Caloric Restriction Research: A Biological Perspective with Translational Potential. EBioMedicine 2017, 21, 37–44. [Google Scholar] [CrossRef]
- Hoshino, S.; Kobayashi, M.; Higami, Y. Mechanisms of the anti-aging and prolongevity effects of caloric restriction: Evidence from studies of genetically modified animals. Aging 2018, 10, 2243–2251. [Google Scholar] [CrossRef] [PubMed]
- Xie, W.Q.; Xiao, W.F.; Tang, K.; Wu, Y.X.; Hu, P.W.; Li, Y.S.; Duan, Y.; Lv, S. Caloric restriction: Implications for sarcopenia and potential mechanisms. Aging 2020, 12, 24441–24452. [Google Scholar] [CrossRef]
- Hancock, C.R.; Han, D.; Higashida, K.; Kim, S.H.; Holloszy, J.O. Does calorie restriction induce mitochondrial biogenesis? A reevaluation. FASEB J. 2011, 25, 785–791. [Google Scholar] [CrossRef]
- Lanza, I.R.; Zabielski, P.; Klaus, K.A.; Morse, D.M.; Heppelmann, C.J.; Bergen, H.R., 3rd; Dasari, S.; Walrand, S.; Short, K.R.; Johnson, M.L.; et al. Chronic Caloric Restriction Preserves Mitochondrial Function in Senescence without Increasing Mitochondrial Biogenesis. Cell Metab. 2012, 16, 777–788. [Google Scholar] [CrossRef]
- Hepple, R.T.; Qin, M.; Nakamoto, H.; Goto, S. Caloric restriction optimizes the proteasome pathway with aging in rat plantaris muscle: Implications for sarcopenia. Am. J. Physiol. Regul. Integr. Comp. Physiol. 2008, 295, 1231–1237. [Google Scholar] [CrossRef]
- Yang, L.; Licastro, D.; Cava, E.; Veronese, N.; Spelta, F.; Rizza, W.; Bertozzi, B.; Villareal, D.T.; Hotamisligil, G.S.; Holloszy, J.O.; et al. Long-Term Calorie Restriction Enhances Cellular Quality-Control Processes in Human Skeletal Muscle. Cell Rep. 2016, 14, 422–428. [Google Scholar] [CrossRef]
- Makino, N.; Maeda, T. Calorie restriction delays cardiac senescence and improves cardiac function in obese diabetic rats. Mol. Cell. Biochem. 2021, 476, 221–229. [Google Scholar] [CrossRef]
- Hernández-Saavedra, D.; Moody, L.; Tang, X.; Goldberg, Z.J.; Wang, A.P.; Chen, H.; Pan, Y.-X. Caloric restriction following early-life high fat-diet feeding represses skeletal muscle TNF in male rats. J. Nutr. Biochem. 2021, 91, 108598. [Google Scholar] [CrossRef] [PubMed]
- Colom, B.; Alcolea, M.P.; Valle, A.; Oliver, J.O.; Roca, P.; García-Palmer, F.J. Skeletal muscle of female rats exhibit higher mitochondrial mass and oxidative-phosphorylative capacities compared to males. Cell. Physiol. Biochem. 2007, 19, 205–212. [Google Scholar] [CrossRef] [PubMed]
- Chen, C.-N.J.; Lin, S.-Y.; Liao, Y.-H.; Li, Z.-J.; Wong, A.M.-K. Late-onset caloric restriction alters skeletal muscle metabolism by modulating pyruvate metabolism. Am. J. Physiol. Endocrinol. Metab. 2015, 308, E942–E949. [Google Scholar] [CrossRef]
- Chen, C.-N.; Liao, Y.-H.; Tsai, S.-C.; Thompson, L.V. Age-dependent effects of caloric restriction on mTOR and ubiquitin-proteasome pathways in skeletal muscles. GeroScience 2019, 41, 871–880. [Google Scholar] [CrossRef]
- Valle, A.; Guevara, R.; Garcia-Palmer, F.J.; Roca, P.; Oliver, J.O. Sexual dimorphism in liver mitochondrial oxidative capacity is conserved under caloric restriction conditions. Am. J. Physiol. Cell Physiol. 2007, 293, 1302–1308. [Google Scholar] [CrossRef] [PubMed]
- Valle, A.; Català-Niell, A.; Colom, B.; Garcia-Palmer, F.J.; Oliver, J.O.; Roca, P. Sex-related differences in energy balance in response to caloric restriction. Am. J. Physiol. Endocrinol. Metab. 2005, 289, 15–22. [Google Scholar] [CrossRef][Green Version]
- Vidal, A.; Rios, R.; Pineda, C.; Lopez, I.; Raya, A.; Aguilera-Tejero, E.; Rivero, J.-L. Increased 1,25(OH)2-Vitamin D Concentrations after Energy Restriction Are Associated with Changes in Skeletal Muscle Phenotype. Nutrients 2021, 13, 607. [Google Scholar] [CrossRef]
- Faitg, J.; Leduc-Gaudet, J.-P.; Reynaud, O.; Ferland, G.; Gaudreau, P.; Gouspillou, G. Effects of aging and caloric restriction on fiber type composition, mitochondrial morphology and dynamics in rat oxidative and glycolytic muscles. Front. Physiol. 2019, 10, 420. [Google Scholar] [CrossRef]
- Miller, B.F.; Robinson, M.M.; Bruss, M.D.; Hellerstein, M.; Hamilton, K.L. A comprehensive assessment of mitochondrial protein synthesis and cellular proliferation with age and caloric restriction. Aging Cell 2012, 11, 150–161. [Google Scholar] [CrossRef]
- Chanséaume, E.; Morio, B. Potential mechanisms of muscle mitochondrial dysfunction in aging and obesity and cellular consequences. Int. J. Mol. Sci. 2009, 10, 306–324. [Google Scholar] [CrossRef]
- López-Otín, C.; Blasco, M.A.; Partridge, L.; Serrano, M.; Kroemer, G. The Hallmarks of Aging. Cell 2013, 153, 1194–1217. [Google Scholar] [CrossRef]
- Serna, J.D.C.; Da Silva, C.C.C.; Kowaltowski, A.J. Functional changes induced by caloric restriction in cardiac and skeletal muscle mitochondria. J. Bioenerg. Biomembr. 2020, 52, 269–277. [Google Scholar] [CrossRef] [PubMed]
- Wang, H.; Arias, E.B.; Yu, C.S.; Verkerke, A.R.P.; Cartee, G.D. Effects of Calorie Restriction and Fiber Type on Glucose Uptake and Abundance of Electron Transport Chain and Oxidative Phosphorylation Proteins in Single Fibers from Old Rats. J. Gerontol. Ser. A Biol. Sci. Med. Sci. 2017, 72, 1638–1646. [Google Scholar] [CrossRef] [PubMed]
- Gutiérrez-Casado, E.; Khraiwesh, H.; López-Domínguez, J.A.; Montero-Guisado, J.; López-Lluch, G.; Navas, P.; De Cabo, R.; Ramsey, J.J.; González-Reyes, J.A.; Villalba, J.M. The impact of aging, calorie restriction and dietary fat on autophagy markers and mitochondrial ultrastructure and dynamics in mouse skeletal muscle. J. Gerontol. Ser. A Biol. Sci. Med. Sci. 2019, 74, 760–769. [Google Scholar] [CrossRef] [PubMed]
- Chimienti, G.; Picca, A.; Fracasso, F.; Russo, F.; Orlando, A.; Riezzo, G.; Leeuwenburgh, C.; Pesce, V.; Lezza, A. The age-sensitive efficacy of calorie restriction on mitochondrial biogenesis and mtdna damage in rat liver. Int. J. Mol. Sci. 2021, 22, 1665. [Google Scholar] [CrossRef] [PubMed]
- Seo, D.Y.; Lee, S.R.; Kim, N.; Ko, K.S.; Rhee, B.D.; Han, J. Age-related changes in skeletal muscle mitochondria: The role of exercise. Integr. Med. Res. 2016, 5, 182–186. [Google Scholar] [CrossRef]
- Kadharusman, M.M.; Antarianto, R.D.; Hardiany, N.S. A review of the impact of calorie restriction on stem cell potency. Malays. J. Med. Sci. 2021, 28, 5–13. [Google Scholar] [CrossRef]
- Rigillo, G.; Basile, V.; Belluti, S.; Ronzio, M.; Sauta, E.; Ciarrocchi, A.; Latella, L.; Saclier, M.; Molinari, S.; Vallarola, A.; et al. The transcription factor NF-Y participates to stem cell fate decision and regeneration in adult skeletal muscle. Nat. Commun. 2021, 12, 1–17. [Google Scholar]
- Cerletti, M.; Jang, Y.C.; Finley, L.W.; Haigis, M.C.; Wagers, A.J. Short-term calorie restriction enhances skeletal muscle stem cell function. Cell Stem Cell 2012, 10, 515–519. [Google Scholar] [CrossRef]
- Abreu, P.; Serna, J.D.; Munhoz, A.C.; Kowaltowski, A.J. Calorie restriction changes muscle satellite cell proliferation in a manner independent of metabolic modulation. Mech. Ageing Dev. 2020, 192, 111362. [Google Scholar] [CrossRef]
- La Russa, D.; Marrone, A.; Mandalà, M.; Macirella, R.; Pellegrino, D. Antioxidant/anti-inflammatory effects of caloric restriction in an aged and obese rat model: The role of adiponectin. Biomedicines 2020, 8, 532. [Google Scholar] [CrossRef] [PubMed]
- Shalini, S.; Dorstyn, L.; Dawar, S.; Kumar, S. Old, new and emerging functions of caspases. Cell Death Differ. 2015, 22, 526–539. [Google Scholar] [CrossRef] [PubMed]
- Fernando, P.; Kelly, J.F.; Balazsi, K.; Slack, R.S.; Megeney, L.A. Caspase 3 activity is required for skeletal muscle differentiation. Proc. Natl. Acad. Sci. USA 2002, 99, 11025–11030. [Google Scholar] [CrossRef]
- Bell, R.A.V.; Al-Khalaf, M.; Megeney, L.A. The beneficial role of proteolysis in skeletal muscle growth and stress adaptation. Skelet. Muscle 2016, 6, 1–13. [Google Scholar]
- Kim, H.J.; Jung, K.J.; Yu, B.P.; Cho, C.G.; Choi, J.S.; Chung, H.Y. Modulation of redox-sensitive transcription factors by calorie restriction during aging. Mech. Ageing Dev. 2002, 123, 1589–1595. [Google Scholar] [CrossRef]
- Tripathi, M.; Yen, P.M.; Singh, B.K. Estrogen-related receptor alpha: An under-appreciated potential target for the treatment of metabolic diseases. Int. J. Mol. Sci. 2020, 21, 1645. [Google Scholar] [CrossRef]
- Horrillo, D.; Sierra, J.; Arribas, C.; Frutos, M.G.S.; Carrascosa, J.M.; Lauzurica, N.; Fernández-Agulló, T.; Ros, M. Age-associated development of inflammation in Wistar rats: Effects of caloric restriction. Arch. Physiol. Biochem. 2011, 117, 140–150. [Google Scholar] [CrossRef]
- Wang, X.-H.; Ao, Q.-G.; Cheng, Q.-L. Caloric restriction inhibits renal artery ageing by reducing endothelin-1 expression. Ann. Transl. Med. 2021, 9, 979. [Google Scholar] [CrossRef]
- Bai, H.; Kang, P.; Hernandez, A.M.; Tatar, M. Activin Signaling Targeted by Insulin/dFOXO Regulates Aging and Muscle Proteostasis in Drosophila. PLoS Genet. 2013, 9, e1003941. [Google Scholar] [CrossRef]
- Jiao, J.; Demontis, F. Skeletal muscle autophagy and its role in sarcopenia and organismal aging. Curr. Opin. Pharmacol. 2017, 34, 1–6. [Google Scholar] [CrossRef]
- Demontis, F.; Piccirillo, R.; Goldberg, A.L.; Perrimon, N. The influence of skeletal muscle on systemic aging and lifespan. Aging Cell 2013, 12, 943–949. [Google Scholar] [CrossRef] [PubMed]
- Simar, D.; Chen, H.; Lambert, K.; Mercier, J.; Morris, M. Interaction between maternal obesity and post-natal over-nutrition on skeletal muscle metabolism. Nutr. Metab. Cardiovasc. Dis. 2012, 22, 269–276. [Google Scholar] [CrossRef]
- Xu, J.; Knutson, M.D.; Carter, C.S.; Leeuwenburgh, C. Iron accumulation with age, oxidative stress and functional decline. PLoS ONE 2008, 3, e2865. [Google Scholar] [CrossRef] [PubMed]
- Carter, C.S.; Leeuwenburgh, C.; Daniels, M.; Foster, T.C. Influence of calorie restriction on measures of age-related cognitive decline: Role of increased physical activity. J. Gerontol. A Biol. Sci. Med. Sci. 2009, 64, 850–859. [Google Scholar] [CrossRef] [PubMed]
- Ham, D.J.; Börsch, A.; Chojnowska, K.; Lin, S.; Leuchtmann, A.B.; Ham, A.S.; Thürkauf, M.; Delezie, J.; Furrer, R.; Burri, D.; et al. Distinct and additive effects of calorie restriction and rapamycin in aging skeletal muscle. Nat. Commun. 2022, 13, 1–20. [Google Scholar]
- McKiernan, S.H.; Bua, E.; McGorray, J.; Aiken, J. Early-onset calorie restriction conserves fiber number in aging rat skeletal muscle. FASEB J. 2004, 18, 580–581. [Google Scholar] [CrossRef] [PubMed]


| Female | Male | ||||||
|---|---|---|---|---|---|---|---|
| ad libitum | Restricted | p-Value | ad libitum | Restricted | p-Value | Statistics | |
| Body mass (g) | 264 ± 6 | 192 ± 5 * | <0.001 | 484 ± 13 | 322 ± 8 * | 0.001 | S, D, SxD |
| Liver weight (g) | 8.21 ± 0.24 | 5.64 ± 0.17 * | <0.001 | 14.7 ± 0.5 | 9.77 ± 0.29 * | 0.005 | S, D, SxD |
| Gastrocnemius weight (g) | 3.09 ± 0.08 | 2.52 ± 0.05 * | <0.001 | 5.21 ± 0.18 | 4.26 ± 0.12 * | 0.021 | S, D |
| WAT weight (g) | 12.7 ± 1.5 | 4.81 ± 0.5 * | <0.001 | 30.4 ± 2.4 | 11.1 ± 0.8 * | <0.001 | S, D, SxD |
| Muscle Somatic Index ×100 (A.u.) | 11.7 ± 0.2 | 13.1 ± 0.3 * | <0.001 | 11.2 ± 0.1 | 12.9 ± 0.2 * | 0.001 | D |
| Glucose (mg/dL) | 153 ± 14 | 142 ± 7 | 0.222 | 176 ± 7 | 161 ± 9 | 0.272 | NS |
| Triglycerides (mg/dL) | 256 ± 85 | 182 ± 10 | 0.183 | 330 ± 52 | 179 ± 17 | 0.024 * | NS |
| Female | Male | ||||||
|---|---|---|---|---|---|---|---|
| ad libitum | Restricted | p-Value | ad libitum | Restricted | p-Value | Statistics | |
| Complex I subunuit NDUFB8 (A.u.) | 1.00 ± 0.13 | 1.06 ± 0.05 | 0.35 | 0.59 ± 0.28 | 0.93 ± 0.19 | 0.17 | NS |
| Complex II 30 kDa subunit (A.u.) | 1.00 ± 0.17 | 1.44 ± 0.17 | 0.04 * | 0.99 ± 0.40 | 0.94 ± 0.13 | 0.45 | NS |
| Complex III, Core protein 2 (A.u.) | 1.00 ± 0.26 | 1.64 ± 0.20 | 0.04 * | 2.13 ± 0.03 | 1.02 ± 0.26 | 0.02 * | SxD |
| Complex IV subunit I (A.u.) | 1.00 ± 0.37 | 2.11 ± 0.65 | 0.08 | 1.74 ± 1.01 | 2.10 ± 0.48 | 0.37 | NS |
| Complex V alpha subunit (A.u.) | 1.00 ± 0.10 | 1.25 ± 0.09 | 0.04 * | 1.15 ± 0.38 | 1.07 ± 0.12 | 0.41 | NS |
| Complex IV/Complex V ratio | 1.76 ± 0.59 | 3.30 ± 1.16 | 0.14 | 1.97 ± 1.02 | 3.32 ± 0.85 | 0.19 | NS |
| DRP1 (A.u.) | 1.00 ± 0.09 | 1.23 ± 0.18 | 0.14 | 1.69 ± 0.37 | 0.56 ± 0.03 | 0.01 * | D, SxD |
| FIS1 (A.u.) | 1.00 ± 0.18 | 1.17 ± 0.20 | 0.26 | 1.61 ± 0.40 | 0.79 ± 0.13 | 0.02 * | NS |
| Female | Male | ||||
|---|---|---|---|---|---|
| Restricted vs. ad libitum (Fold-Change) | p-Value | Restricted vs. ad libitum (Fold-Change) | p-Value | Statistics | |
| Sod1 | −0.15 ± 0.28 | 0.26 | 0.25 ± 0.22 | 0.35 | NS |
| Sod2 | −0.48 ± 0.32 | 0.15 | 0.30 ± 0.19 | 0.20 | NS |
| Sirt3 | −0.21 ± 0.13 | 0.15 | −0.16 ± 0.04 | 0.17 | NS |
| Nfe2l2 | 0.19 ± 0.11 | 0.18 | −0.10 ± 0.17 | 0.40 | NS |
| Foxo3 | 0.10 ± 0.21 | 0.38 | 0.27 ± 0.08 | 0.05 | NS |
| Female | Male | ||||||
|---|---|---|---|---|---|---|---|
| ad libitum | Restricted | p-Value | ad libitum | Restricted | p-Value | Statistics | |
| SOD 2 (A.u.) | 1.00 ± 0.29 | 0.96 ± 0.20 | 0.46 | 1.44 ± 0.68 | 1.13 ± 0.59 | 0.38 | NS |
| Acetylated SOD2 (A.u.) | 1.00 ± 0.18 | 1.33 ± 0.20 | 0.12 | 1.43 ± 0.21 | 1.22 ± 0.21 | 0.28 | NS |
| Acetylated SOD2/Total SOD2 ratio | 9.3 ± 1.0 | 11 ± 1.1 | 0.11 | 9.4 ± 3.2 | 12 ± 3.4 | 0.31 | NS |
| SIRT3 (A.u.) | 1.00 ± 0.19 | 2.46 ± 0.42 | 0.01 * | 1.33 ± 0.08 | 1.60 ± 0.34 | 0.31 | NS |
| NRF2 (A.u.) | 1.00 ± 0.10 | 0.93 ± 0.07 | 0.27 | 0.48 ± 0.27 | 0.90 ± 0.15 | 0.10 | S |
| FOXO3A (A.u.) | 1.00 ± 0.36 | 0.93 ± 0.38 | 0.45 | 0.43 ± 0.27 | 0.72 ± 0.22 | 0.23 | NS |
| Female | Male | ||||
|---|---|---|---|---|---|
| Restricted vs. ad libitum (Fold-Change) | p-Value | Restricted vs. ad libitum (Fold-Change) | p-Value | Statistics | |
| Map1lc3a | 0.89 ± 0.25 | 0.13 | 0.34 ± 0.23 | 0.15 | NS |
| Sqstm1 | −0.07 ± 0.13 | 0.36 | 0.26 ± 0.08 | 0.06 | NS |
| Female | Male | ||||||
|---|---|---|---|---|---|---|---|
| ad libitum | Restricted | p-Value | ad libitum | Restricted | p-Value | Statistics | |
| LC3 I (A.u.) | 1.00 ± 0.13 | 1.19 ± 0.12 | 0.16 | 0.59 ± 0.10 | 0.82 ± 0.08 | 0.07 | NS |
| LC3 II (A.u.) | 1.00 ± 0.16 | 1.35 ± 0.18 | 0.08 | 0.85 ± 0.20 | 1.09 ± 0.20 | 0.22 | NS |
| LC3-II/LC3-I ratio | 0.34 ± 0.03 | 0.4 ± 0.05 | 0.14 | 0.49 ± 0.05 | 0.44 ± 0.04 | 0.24 | NS |
| Caspase 3 (A.u.) | 1.00 ± 0.15 | 1.00 ± 0.09 | 0.49 | 1.11 ± 0.30 | 0.34 ± 0.11 | 0.07 | S, D, SxD |
| Female | Male | ||||
|---|---|---|---|---|---|
| Restricted vs. ad libitum (Fold-Change) | p-Value | Restricted vs. ad libitum (Fold-Change) | p-Value | Statistics | |
| Pik3ca | 0.41 ± 0.21 | 0.08 | 0.01 ± 0.22 | 0.49 | NS |
| Akt1 | 0.44 ± 0.42 | 0.22 | −0.69 ± 0.43 | 0.12 | NS |
| Gsk3b | 0.10 ± 0.24 | 0.36 | −0.23 ± 0.13 | 0.16 | NS |
| mTOR | 0.79 ± 0.57 | 0.15 | 0.04 ± 0.29 | 0.46 | NS |
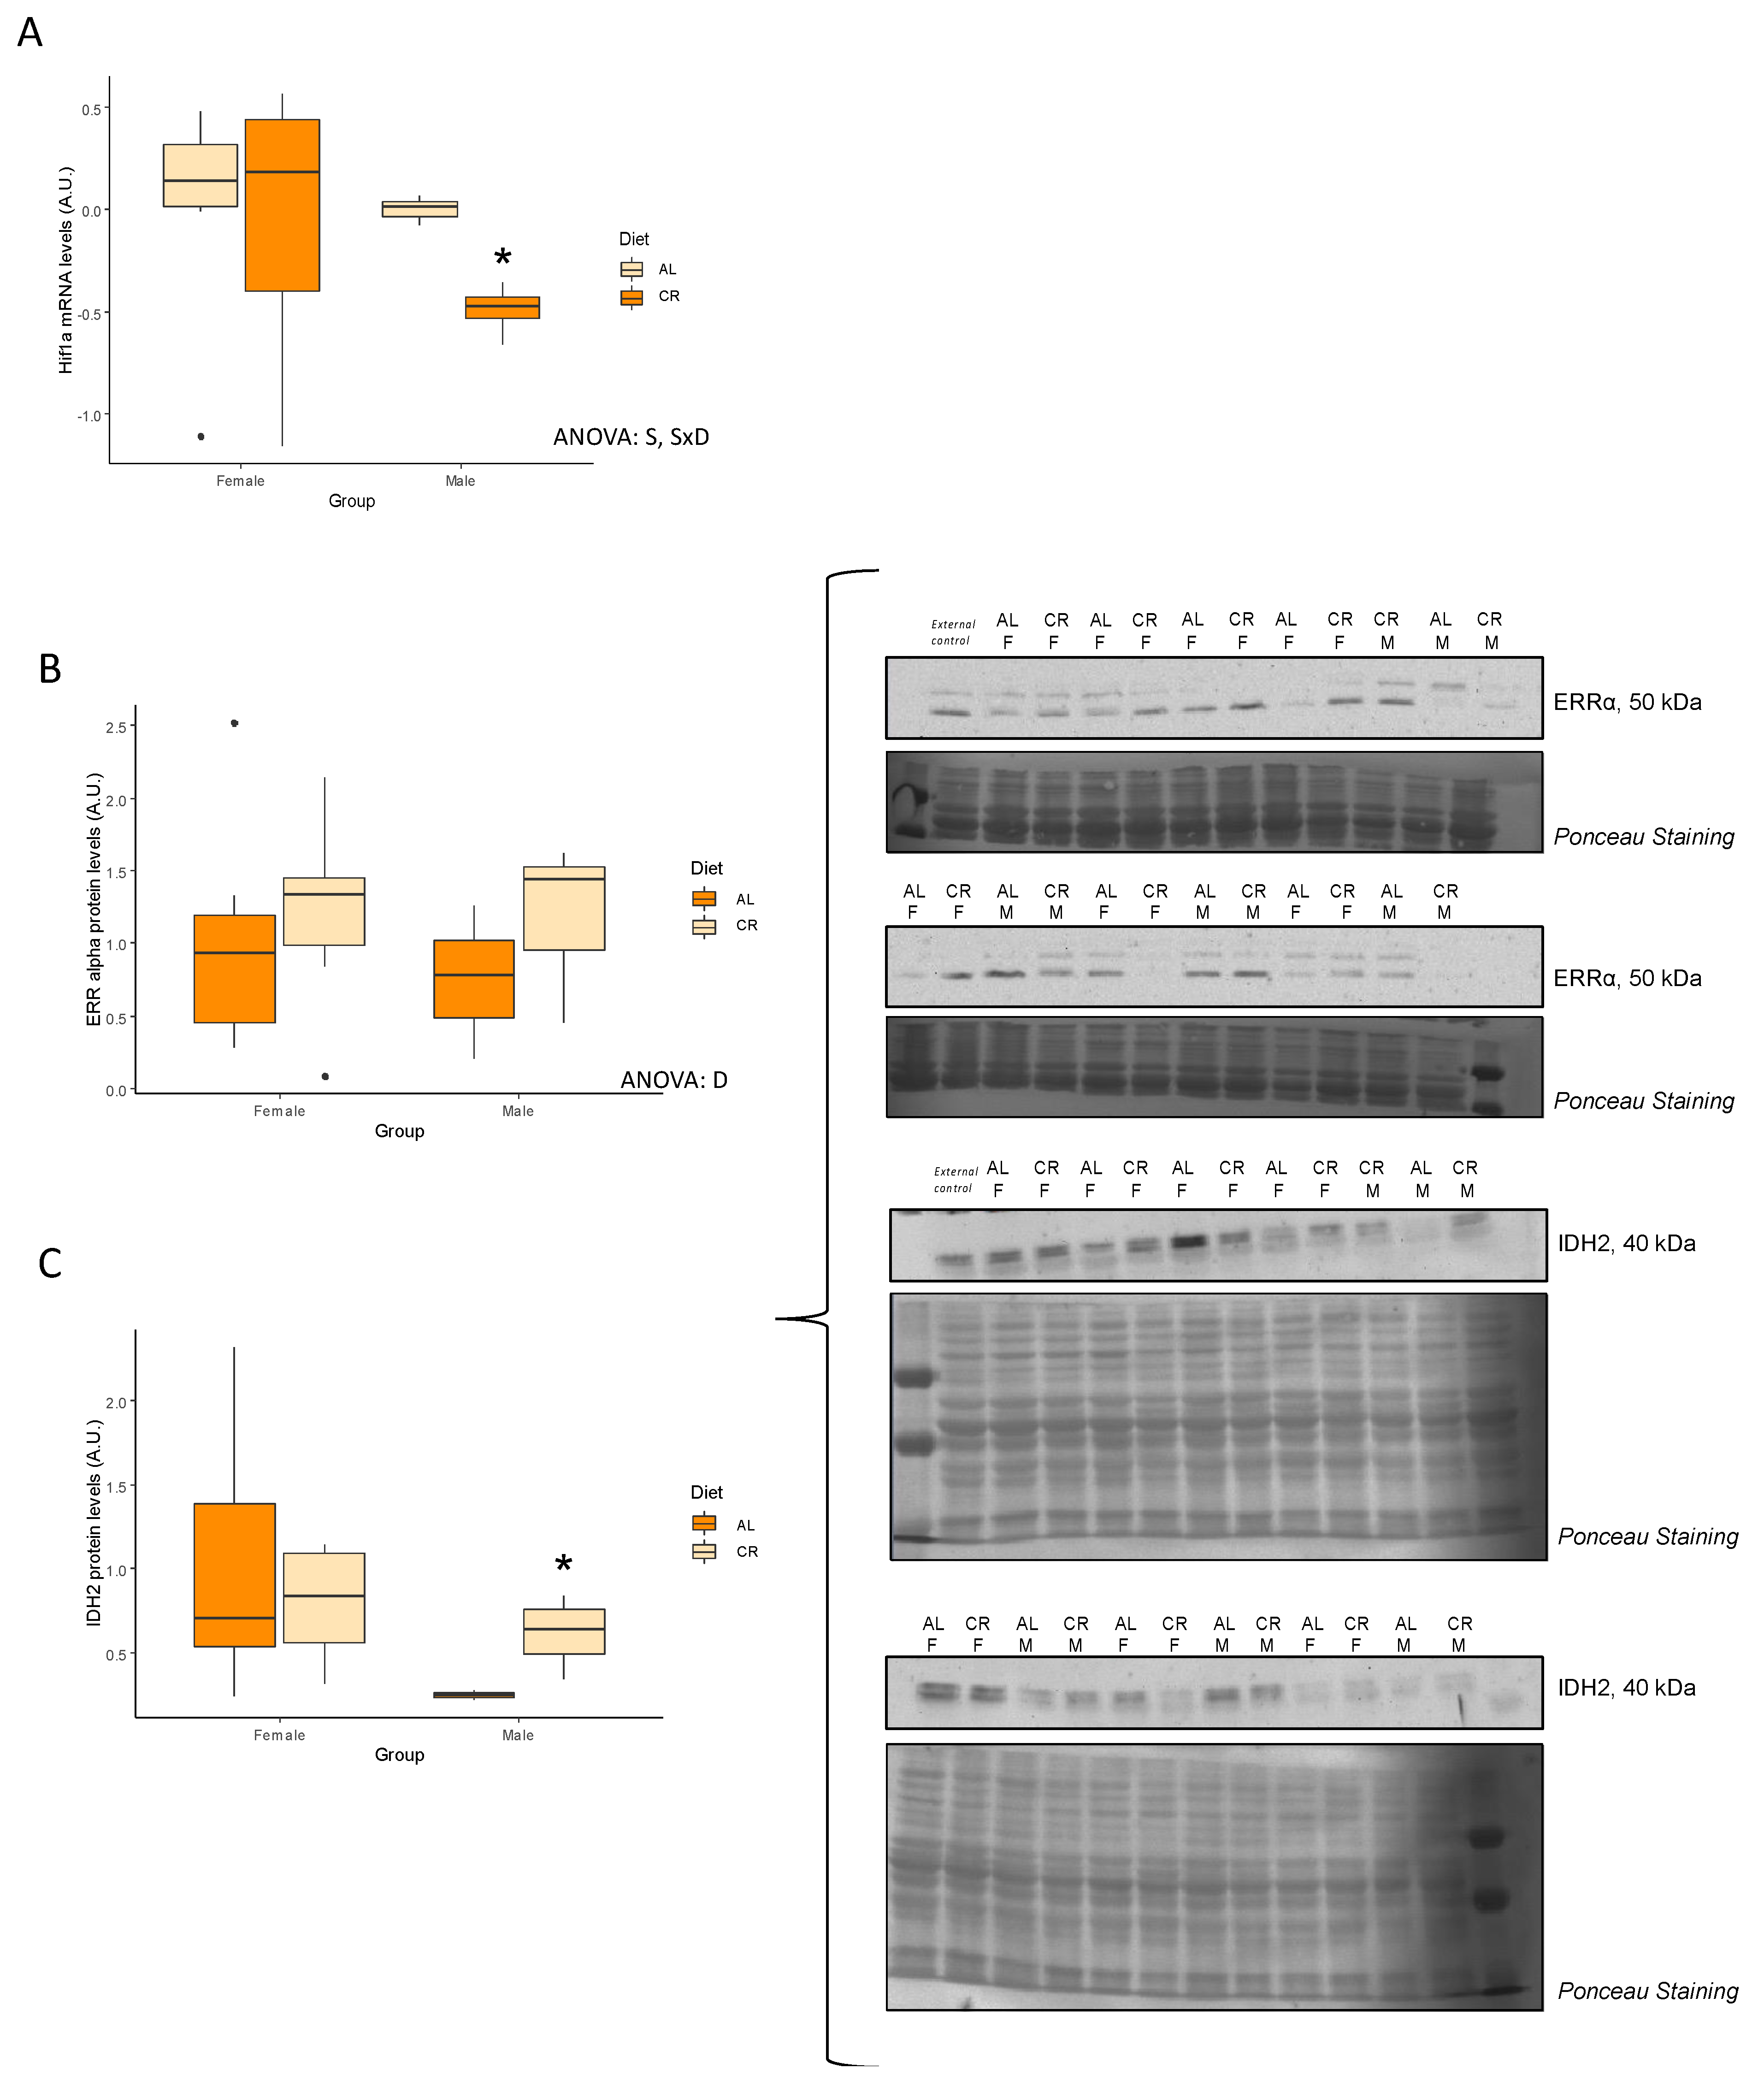
| Hif1a | −0.05 ± 0.25 | 0.45 | −0.49 ± 0.06 | <0.01 * | S, SxD |
| Female | Male | ||||||
|---|---|---|---|---|---|---|---|
| ad libitum | Restricted | p-Value | ad libitum | Restricted | p-Value | Statistics | |
| IRb (A.u.) | 1.00 ± 0.27 | 1.22 ± 0.20 | 0.26 | 0.74 ± 0.36 | 0.63 ± 0.09 | 0.38 | NS |
| IRS1 (A.u.) | 1.00 ± 0.39 | 0.53 ± 0.10 | 0.16 | 0.64 ± 0.29 | 0.79 ± 0.18 | 0.33 | NS |
| AMPK (A.u.) | 1.00 ± 0.12 | 0.76 ± 0.08 | 0.07 | 1.03 ± 0.13 | 0.56 ± 0.34 | 0.19 | NS |
| LKB1 (A.u.) | 1.00 ± 0.14 | 0.79 ± 0.11 | 0.14 | 1.07 ± 0.06 | 0.90 ± 0.33 | 0.37 | NS |
| AKT (A.u.) | 1.00 ± 0.15 | 0.90 ± 0.08 | 0.28 | 1.10 ± 0.21 | 1.01 ± 0.19 | 0.28 | NS |
| GSK (A.u.) | 1.00 ± 0.24 | 0.51 ± 0.15 | 0.05 | 0.36 ± 0.09 | 0.50 ± 0.02 | 0.10 | NS |
| ERRA (A.u.) | 1.00 ± 0.26 | 1.21 ± 0.21 | 0.27 | 0.75 ± 0.31 | 1.17 ± 0.36 | 0.21 | D |
| LDHA (A.u.) | 1.00 ± 0.16 | 0.75 ± 0.10 | 0.10 | 0.77 ± 0.01 | 0.49 ± 0.12 | 0.10 | NS |
| IDH2 (A.u.) | 1.00 ± 0.25 | 0.79 ± 0.12 | 0.23 | 0.25 ± 0.03 | 0.61 ± 0.11 | 0.04 * | NS |
| Female | Male | ||||
|---|---|---|---|---|---|
| Restricted vs. ad libitum (Fold-Change) | p-Value | Restricted vs. ad libitum (Fold-Change) | p-Value | Statistics | |
| Rela | 0.20 ± 0.12 | 0.25 | 0.05 ± 0.09 | 0.25 | NS |
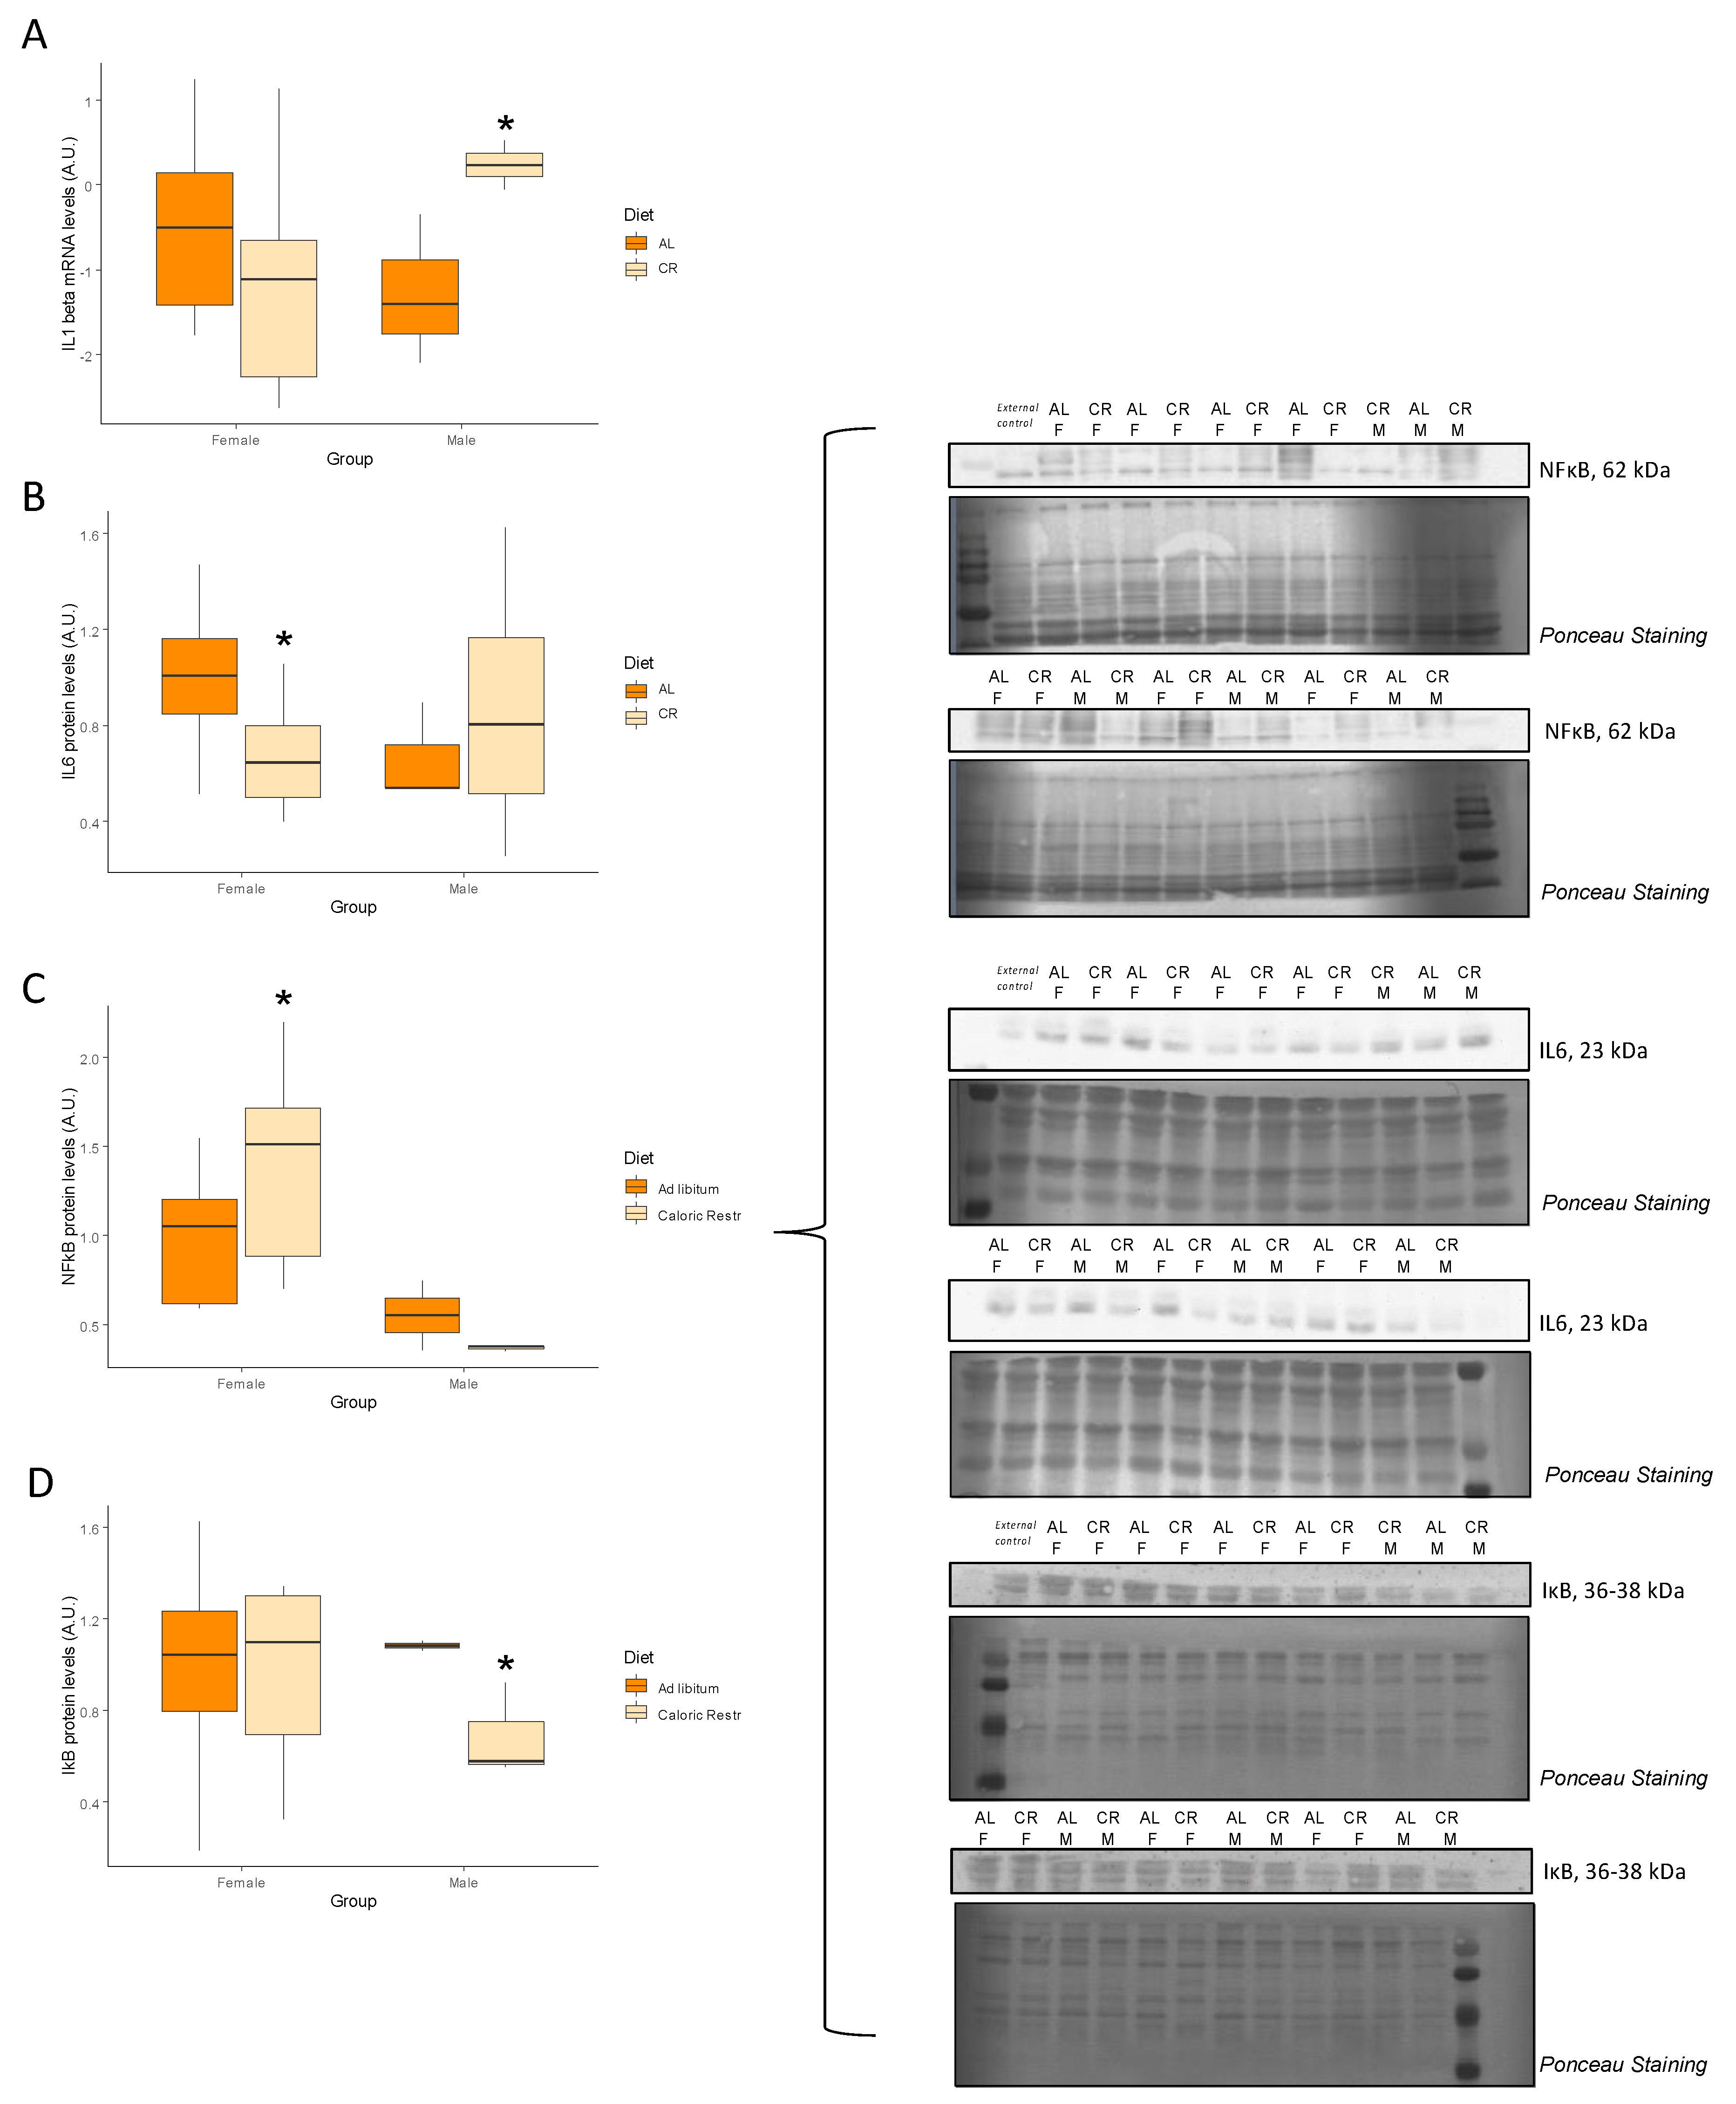
| Il1b | −1.20 ± 0.50 | 0.16 | 0.24 ± 0.28 | 0.04 * | NS |
| Tgfb1 | 0.49 ± 0.35 | 0.15 | −0.63 ± 0.69 | 0.26 | NS |
| Tnf | −0.17 ± 0.54 | 0.39 | −0.23 ± 0.51 | 0.36 | NS |
| Female | Male | ||||||
|---|---|---|---|---|---|---|---|
| ad libitum | Restricted | p-Value | ad libitum | Restricted | p-Value | Statistics | |
| IL1R (A.u.) | 1.00 ± 0.16 | 1.13 ± 0.20 | 0.30 | 0.52 ± 0.04 | 0.89 ± 0.28 | 0.17 | NS |
| IL6 (A.u.) | 1.00 ± 0.10 | 0.67 ± 0.08 | 0.01 * | 0.66 ± 0.12 | 0.87 ± 0.29 | 0.29 | NS |
| NF-κB (A.u.) | 1.00 ± 0.13 | 1.42 ± 0.20 | 0.04 * | 0.55 ± 0.19 | 0.37 ± 0.01 | 0.15 | NS |
| IκB (A.u.) | 1.00 ± 0.16 | 0.97 ± 0.13 | 0.45 | 1.09 ± 0.02 | 0.68 ± 0.12 | 0.04 * | NS |
| Female | Male | ||||
|---|---|---|---|---|---|
| Restricted vs. ad libitum (Fold-Change) | p-Value | Restricted vs. ad libitum (Fold-Change) | p-Value | Statistics | |
| Cdkn1a | 0.14 ± 0.26 | 0.43 | 1.28 ± 0.37 | 0.07 | NS |
| Cdkn2a | 1.11 ± 0.62 | 0.09 | −0.50 ± 0.44 | 0.21 | NS |
| Tp53 | 0.74 ± 0.54 | 0.12 | −0.56 ± 0.38 | 0.17 | NS |
| Sirt6 | 0.78 ± 0.07 | 0.20 | −0.43 ± 0.28 | 0.14 | NS |
Publisher’s Note: MDPI stays neutral with regard to jurisdictional claims in published maps and institutional affiliations. |
© 2022 by the authors. Licensee MDPI, Basel, Switzerland. This article is an open access article distributed under the terms and conditions of the Creative Commons Attribution (CC BY) license (https://creativecommons.org/licenses/by/4.0/).
Share and Cite
Torrens-Mas, M.; Navas-Enamorado, C.; Wahl, D.; Sanchez-Polo, A.; Picca, A.; Oliver, J.; Roca, P.; Gonzalez-Freire, M. Sex Specific Differences in Response to Calorie Restriction in Skeletal Muscle of Young Rats. Nutrients 2022, 14, 4535. https://doi.org/10.3390/nu14214535
Torrens-Mas M, Navas-Enamorado C, Wahl D, Sanchez-Polo A, Picca A, Oliver J, Roca P, Gonzalez-Freire M. Sex Specific Differences in Response to Calorie Restriction in Skeletal Muscle of Young Rats. Nutrients. 2022; 14(21):4535. https://doi.org/10.3390/nu14214535
Chicago/Turabian StyleTorrens-Mas, Margalida, Cayetano Navas-Enamorado, Devin Wahl, Andres Sanchez-Polo, Anna Picca, Jordi Oliver, Pilar Roca, and Marta Gonzalez-Freire. 2022. "Sex Specific Differences in Response to Calorie Restriction in Skeletal Muscle of Young Rats" Nutrients 14, no. 21: 4535. https://doi.org/10.3390/nu14214535
APA StyleTorrens-Mas, M., Navas-Enamorado, C., Wahl, D., Sanchez-Polo, A., Picca, A., Oliver, J., Roca, P., & Gonzalez-Freire, M. (2022). Sex Specific Differences in Response to Calorie Restriction in Skeletal Muscle of Young Rats. Nutrients, 14(21), 4535. https://doi.org/10.3390/nu14214535