Abstract
Exclusive enteral nutrition (EEN) can induce remission in patients with pediatric Crohn’s disease (CD). This study aims to depict EEN’s modification of bile acid (BA) metabolism in pediatric CD and explores the effect of the EEN-enriched BA in inhibiting the inflammatory response. The twelve enrolled pediatric CD patients showed BA dysmetabolism, represented by decreased levels of fecal secondary and unconjugated BAs as determined by UPLC–TQMS, which were accompanied by gut microbiota dysbiosis and reduced BA-metabolizing bacteria including Eubacterium and Ruminococcus genera, assessed by shotgun metagenomic sequencing. EEN treatment induced remission in these patients at eight weeks, and nine patients remained in stable remission for longer than 48 weeks. EEN improved BA dysmetabolism, with some enriched BAs, including hyocholic acid (HCA), α-muricholic acid (αMCA), strongly associated with decreased severity of CD symptoms. These BAs were significantly correlated with the increased abundance of certain bacteria, including Clostridium innocuum and Hungatella hathewayi, which express 3β-hydroxysteroid dehydrogenase and 5β-reductase. HCA could suppress TNF-α production by CD4+ T cells in the peripheral blood mononuclear cells (PBMCs) of CD patients. Moreover, intraperitoneal injection of HCA could attenuate dextran sulfate sodium (DSS)-induced mouse colitis. Our data suggests that BA modification may contribute to the EEN-induced remission of pediatric CD.
1. Introduction
A steadily increasing incidence of inflammatory bowel disease (IBD) worldwide over the past four decades indicates its emergence as a global disease [1,2]. Crohn’s disease (CD) is characterized by transmural inflammation, causing thickening and narrowing of the gastrointestinal tract (GI) wall and eventually leading to the disabling development of deep ulcerations, fistulae, strictures, and abscesses. A defect in barrier integrity is closely associated with profound alterations in the intestinal metabolome, including a shortage of short-chain fatty acids (SCFA) [3], altered concentrations of amino acids and lipid acids [4], and dysregulation of bile acid (BA) pool composition [5]. These metabolic abnormalities are proved to be partially driven by gut microbiota dysbiosis [6,7,8,9].
Clinical studies [10,11] and meta-analyses [12,13] demonstrated that exclusive enteral nutrition (EEN) was equivalent to corticosteroids for induction of remission and mucosal healing in children and adolescents with active CD, and had fewer side effects. In addition, EEN has the advantages of improving nutritional indices, managing IBD-related complications such as abscesses, fistulae and stenosis, and facilitating avoidance of surgery [14]. Accordingly, consensus guidelines of the European Crohn’s and Colitis Organization (ECCO)/European Society for Pediatric Gastroenterology, Hepatology and Nutrition (ESPGHAN) recommend using EEN for 6–8 weeks as the initial induction of remission therapy in mild to moderate active pediatric CD [15]. The mechanisms by which EEN attenuates physiological markers of inflammation and promotes mucosal healing in CD are yet to be elucidated. Nevertheless, growing evidence supports that EEN works by modifying gut microbial communities and host–microbiota co-metabolism within the gut [16,17].
BAs, especially secondary BAs, play an important role in modulating the inflammatory responses within the gut. In CD, a deficit of active BA transporters in the ileum is responsible for BA malabsorption and consequently results in increased fecal loss and an altered BA pool composition, such as higher conjugated and lower secondary BA concentrations [5]. Deconjugated BAs and secondary BAs can interact with nuclear receptors, including the farnesoid X receptor (FXR), G protein-coupled bile acid receptor 1 (TGR5), vitamin D receptor (VDR), and retinoic acid-related orphan receptor-γt (RORγt), which have been shown to have protective functions in CD by inhibiting intestinal inflammation and preserving epithelial barrier integrity [18,19,20]. Two recent animal studies showed that BAs could regulate the ratio of anti-inflammatory regulatory T cells (Tregs) to proinflammatory effector helper T cells (specifically Th17) [21,22]. In specific, 3-oxo-LCA (3-keto-LCA) can bind RORγt to inhibit the differentiation of Th17 cells, thereby attenuating intestinal inflammation. These data suggest an important immune regulatory role of microbial BA metabolites in controlling inflammation.
In this context, we hypothesized that EEN modifies BA pool composition, thereby regulating intestinal immune responses and enhancing remission in pediatric CD patients. We conducted a longitudinal observational study of EEN therapy in twelve pediatric CD patients. Fecal samples were collected prior to and after EEN for analysis of fecal microbiota with shotgun metagenomic sequencing and quantification of fecal BA using ultra-performance liquid chromatography coupled with triple quadrupole mass spectrometry (UPLC–TQMS). All patients achieved remission after eight weeks of EEN induction therapy. We identified multiple BAs associated with the therapeutic outcomes of EEN, and their lives were significantly correlated with the relative abundance of several gut bacteria that express important BA-metabolizing enzymes. Among the EEN-enriched BAs, we explored and demonstrated the anti-inflammatory properties of hyocholic acid (HCA) both in vitro with peripheral blood mononuclear cells (PBMCs) isolated from CD patients, and in vivo with a dextran sulfate sodium (DSS)-induced mouse colitis model.
2. Materials and Methods
2.1. Study Design, Subjects, and Sample Collection
The study was approved by the Institutional Review Board of Shanghai Children’s Hospital (approval No. 2020R034-E02) and adhered to the tenets of the Declaration of Helsinki. Twelve pediatric CD patients, aged from 6–17 years, participated in this longitudinal observational study for EEN therapy during June 2016–May 2020 at Shanghai Children’s Hospital. The diagnosis of CD was confirmed based on established clinical criteria and a combination of endoscopic, histological, and radiological criteria and/or biochemical investigations [23]. All patients received EEN administrated via oral route or nasogastric tube.
Patients’ demographics, disease location, laboratory parameters, and medications were recorded at baseline (BSL), four weeks, and eight weeks of EEN. Sixteen healthy subjects age- and gender-matched to the CD patients, without a previous history of chronic disease, allergies, or medications (antibiotics in particular) within the past six months, were enrolled in the study as healthy controls (HC). Each HC provided a single stool. A total of 29 fecal samples were collected from 12 pediatric CD patients, including 10, 8, and 11 samples at BSL, four weeks, and eight weeks of EEN treatment, respectively. All stool samples were stored at −80 °C immediately after collection.
2.2. DNA Preparation, Metagenomic Sequencing, and Taxonomic Annotation
Genomic DNA was extracted using the QIAamp DNA Stool Mini Kit (Qiagen, Hilden, Germany) combined with the bead-beating method, as per the manufacturer’s recommendations. DNA quantity was determined using the BR dsDNA Qubit Assay kit (Invitrogen, Carlsbad, CA, USA) according to the manufacturer’s instructions. Sequencing libraries were constructed using the NEBNext Ultra DNA Library Prep Kit for Illumina (NEB, Ipswich, MA, USA). Briefly, 1 µg of genomic DNA was sheared to obtain an average fragment size of 350 bp using a sonicator (Covaris, Woburn, MA, USA). The fragments were end-polished, A-tailed, and ligated with a full-length adapter for Illumina sequencing, followed by further polymerase chain reaction (PCR) amplification. Libraries were pooled and diluted to 2 ng/μL, analyzed for molecular length using an Agilent 2100 Bioanalyzer, and quantified using real-time PCR. Following library preparation, sequencing was performed on an Illumina NovaSeq 6000 platform (Illumina, USA) via the PE150 strategy.
The adaptor was trimmed using Trim Galore v.0.6.5 (https://github.com/FelixKrueger/TrimGalore, accessed on 19 November 2019), after which Fastp [24] was used to filter reads with more than 10 N bases, Q20 < 20%, or length shorter than 60 bp. Bowtie2 [25] was used to further filter human genomic reads by mapping the metagenomic reads against the latest human genome reference (hg19) [26]. MetaPhlAn3 [27] was applied to profile the composition of microbial communities determined from metagenomic shotgun sequencing, and taxonomic annotation was generated using version v20 of the database with default parameters.
2.3. Analysis of Fecal Microbiota with Shotgun Metagenomic Sequencing
MicrobiomeAnalyst [28] was used to analyze the bacterial community composition data [29]. Data with low count (minimum count < 4 and prevalence in samples < 20%) and low variance (less than 10% inter-quantile range measure of variance) were filtered and were further normalized based on centered log-ratio (clr) transformation to account for the compositional nature of the metagenomic data. Microbiome alpha diversity was measured using the Shannon’s, Chao1, Simpson’s, and Inverse Simpson’s indexes. The beta diversity among samples was calculated through principal coordinate analysis (PCoA) to Euclidean distance based on clr. Permutational multivariate analysis of variance (PERMANOVA) was carried out to test whether the gut microbiome structure was significantly different. Statistical differences in alpha diversity and abundances of taxa were assessed via Mann–Whitney U tests and Kruskal–Wallis tests, with p-values adjusted using the Benjamini–Hochberg correction procedure for controlling the false discovery rate (FDR).
2.4. Quantification of Fecal Bile Acids with Ultra-Performance Liquid Chromatography Coupled with Triple Quadrupole Mass Spectrometry
Fecal samples were kept frozen at −80 °C and then lyophilized overnight in a freeze dryer system (Labconco FreeZone 2.5 Plus, Kansas City, MO, USA). BAs were extracted using a two-step extraction procedure as previously described [30,31]. In brief, an aliquot of 10 mg of lyophilized feces from each sample was homogenized in 20 mL of deionized water. Then, 180 μL of acetonitrile:methanol = 80:20 containing the six internal standards (CA-d4, GCA-d4, GCDCA-d4, GDCA-d4, LCA-d4, and UDCA-d4 at 50 nM each) was added, homogenized for 5 min, and centrifuged at 13,200 rpm at 4 °C for 15 min. After transferring the supernatant to a 1.5 mL Eppendorf tube, the residue was further extracted by adding 180 μL acetonitrile:methanol = 80:20 containing the six internal standards as the first extraction solvent. The two supernatants were combined and vortexed for 3 min before centrifugation at 13,200 rpm at 4 °C for 15 min.
BA analysis was performed via the UPLC–TQMS system. The elution solvents were water + 0.01% formic acid (A) and acetonitrile:methanol = 19:1 + 0.01% formic acid (B). A total of 46 types of BAs were separated on a reverse column by gradient elution over 20 min at a flow rate of 450 μL/min as follows: 0–2 min (20% B), 2–3 min (20–25% B), 3–6 min (25% B), 6–8 min (25–35% B), 8–11.5 min (35% B), 11.5–18 min (35–99% B), 18–19 min (99% B), and 19–20 min (99–20% B). Mass spectrometry (MS) was performed in negative electrospray ionization mode. The cone voltage and collision energy were optimized for each BA using a QuanOptimize application manager (Waters Corp., Milford, MA, USA).
MetaboAnalyst 5.0 [32] was used for statistics and feature selection of the metabolomic data. Univariate statistical analysis was performed using Mann–Whitney U tests and Kruskal–Wallis tests with p-values adjusted using the Benjamini–Hochberg correction procedure for controlling FDR.
2.5. Peripheral Blood Mononuclear Cell Isolation and Stimulation
Heparin whole blood was collected from five adult treatment-naïve CD patients. PBMCs were isolated from the whole blood by centrifugation using Biocoll Separating Solution (BiochromGmbH, Berlin, Germany). All samples were incubated for 4 h in a medium consisting of RPMI with 10% fetal bovine serum and 1% penicillin–streptomycin (all three: Gibco, Carlsbad, CA, USA) at 37 °C in HERA Cell 150 (Thermo Fisher Scientific, Waltham, MA, USA) after adding CD3/CD28-coated magnetic beads (1 μg/mL). In addition, Brefeldin A (Sigma-Aldrich, St. Louis, MO, USA) dissolved in dimethyl sulfoxide (Sigma-Aldrich) was added to all flow cytometry samples after 2 h to prevent cells from secreting tumor necrosis factor-α (TNF-α) and interferon-γ (IFN-γ).
2.6. Flow Cytometry
For flow cytometry analysis, single-cell suspensions were stained with the following antibodies: BV605 anti-mouse CD4 and Alexa Fluor 700 CD8 (Biolegend, San Diego, CA, USA). For intracellular staining, cells were stimulated for 4 h at room temperature with PMA (50 ng/mL), ionomycin (1 µg/mL), and Brefeldin A. Following fixation and permeabilization, cells were stained with Alexa Fluor 647 anti-human IFN-γ and PE anti-human TNF-α (Biolegend, San Diego, CA, USA). Cells were acquired with a NovoCyte Quanteon (Agilent Technologies, Santa Clara, CA, USA), and data analysis was performed with FlowJo software (Version 10.8, FlowJo, Ashland, OR, USA).
2.7. Enzyme-Linked Immunosorbent Assay
The cytokine production from PBMCs was assessed using ELISA assay (BioGems, Westlake Village, CA, USA) following the manufacturer’s instructions. Supernatant and standard controls (100 μL prepared according to kit instructions) were transferred to a pre-coated primary antibody (IFN-γ or TNF-α) stripwell microplate, incubated at 37 °C for 90 min, and washed. The avidin–biotin–peroxidase complex was added at 100 µL/well and incubated at 37 °C for 30 min. After additional washes, 90 µL of color developing reagent was added to each well and incubated in the dark for 30 min. The reaction was terminated by the addition of 100 µL stop solution, and O.D. absorbance was read with a microplate reader at 450 nm.
2.8. Dextran Sulfate Sodium Colitis Model
C57/BL6 male mice (6–7 weeks old) were purchased from GemPharmatech (Nanjing, China). For acute colitis induction, mice were administered 3% (w/v) DSS (36–50 kDa; MP Biomedicals, Santa Ana, CA, USA) in drinking water for nine days. For the treatment groups, HCA (30 mg/kg body weight, Sigma-Aldrich, St. Louis, MO, USA) was intraperitoneally injected from day four to day nine. Saline was injected as the vehicle in the control group. Body weight was monitored daily to assess the severity of intestinal colitis. The colon length was measured at sacrifice, which was performed on day nine. The animal experimental procedures were approved by the Laboratory Animal Ethics Committee of Shenzhen University.
2.9. Statistical Analysis
Continuous variables were presented as medians with interquartile range (IQRs, 25th to 75th percentiles), and categorical variables were summarized as absolute numbers with percentages. SPSS software (version 20.0) was used for statistical analyses. Nonparametric Mann–Whitney U tests and Kruskal–Wallis tests were used to analyze continuous variables between two groups and among multiple groups, respectively. The categorical variables were compared using the chi-squared test. The p-values were adjusted using the Benjamini-Hochberg correction procedure for controlling FDR. Statistical significance was defined by a p-value of less than 0.05.
3. Results
3.1. Characteristics and Responses of Pediatric CD to EEN Therapy
Demographic and clinical characteristics of the 12 patients that participated in this study are presented in Table 1. Among these patients (eight boys and four girls), the median age at BSL was 13 years (IQR, 11–13 years). Disease location within the GI tract was similar across all patients, with the majority (10/12) having ileocolonic disease (L3). Four patients had comorbidities, including three with perianal fistula and one with hypothyroidism. Ten patients received EEN via oral administration, while two were treated via nasogastric tube. After eight weeks of EEN therapy, significant decreases in erythrocyte sedimentation rate (ESR), white blood cells (WBC), platelet count (PLT), C-reactive protein (CRP), and fecal calprotectin (FCP) were observed (baseline vs. 8 W: 109.5 (93.3, 120) mm/h vs. 23 (9, 23) mm/h, p < 0.0001, q = 0.0004 for ESR; 11.9 (7.6, 13.4) × 109/L vs. 6.3 (5.0, 7.9) × 109/L, p = 0.0014, q = 0.0025 for WBC; 522.53 (479.8, 552.8) × 109/L vs. 324 (261.3, 352.5) × 109/L, p = 0012, q = 0.0025 for PLT; 42 (26,73.5) mg/L vs. 5 (5, 5) mg/L, p < 0.0001, q = 0.0004 for CRP; 1800 (1800, 1800) μg/g vs. 410 (264.5, 1275) μg/g, p = 0.032, q = 0.045 for FCP) (Table 1). The hemoglobin (HB), albumin (ALB), and prealbumin (PA) levels significantly increased after EEN therapy (baseline vs. 8 W: 98 (86.8, 105) g/L vs. 117.5 (111.3, 126) g/L, p = 0.0013, q = 0.003 for HB; 31.5 (24, 34.7) g/L vs. 41.11 (40.5, 44.2) g/L, p < 0.0001, q = 0.0004 for ALB; 73 (53.1, 130.6) mg/dL vs. 216 (170.6, 256.6) mg/dL, p = 0015, q = 0.003 for PA) (Table 1). However, there was no significant change in BMI (baseline vs. 8 W: 13.7 (12.8, 15.4) vs. 15.4 (13.8, 18.0), p = 0.1135, q = 0.1314) and Screening Tool for the Assessment of Malnutrition in Pediatrics (STAMP) score (baseline vs. 8 W: 4.50 (2, 6.50) vs. 3 (3, 6), p = 0.1135, q = 0.1314) (Table 1).

Table 1.
Demographic and clinical characteristics of the pediatric CD patients before and after EEN treatment.
All patients achieved remission (PCDAI scores < 12) after eight weeks of EEN induction therapy (baseline vs. 8 W: 38.8 (21.9, 44.4) vs. 4.5 (2, 5), p < 0.0001, q = 0.0004), and the Crohn’s Disease Index of Severity (CDEIS) scores of eight patients dropped below 10 (baseline vs. 8 W: 14 (13, 15) vs. 7 (3.8, 12), p < 0.0008, q = 0.0025) (Table 1; Figure 1b). Mucosal healing was observed through endoscopy (Supplementary Figure S1). During follow-up assessments, 3 out of 12 (25%) patients subsequently relapsed by week 48 (Figure 1b) and received re-induction treatment of steroids or infliximab. Nine patients remained in remission throughout the study period (>48 weeks).

Figure 1.
Pediatric CD patients achieved remission after ENN induction therapy. (a) PCDAI and (b) CDEIS scores at baseline and at week eight of EEN in 12 CD patients. (c) Kaplan–Meier survival curve showing time to relapse in 12 CD patients who remained in remission after EEN treatment. CD, Crohn’s disease; EEN, exclusive enteral nutrition; PCDAI, Pediatric Crohn’s Disease Activity Index; CDEIS, Crohn’s Disease Endoscopic Index of Severity.
3.2. Gut Microbiota Dysbiosis and Bile Acid Dysmetabolism in Pediatric CD Patients
The enrolled pediatric patients with CD showed an altered gut microbiota profile compared to healthy individuals, which was characterized by a reduction in biodiversity (Figure 2). Decreased abundance at the bacterial species level, including Anaerostipes hadrus, Blautia wexlerae, Faecalibacterium prausnitzii, Bacteroides uniformis, Eubacterium hallii, Ruminococcus bromii, Fusicatenibacter saccharivorans, Bifidobacterium longum, and Bifidobacterium pseudocatenulatum (Figure 3), and enrichment of genera Escherichia, Peptostreptococcus, and Morganella, which are known to contain a variety of opportunistic pathogens, were observed in pediatric CD patients (Supplementary Figure S2).
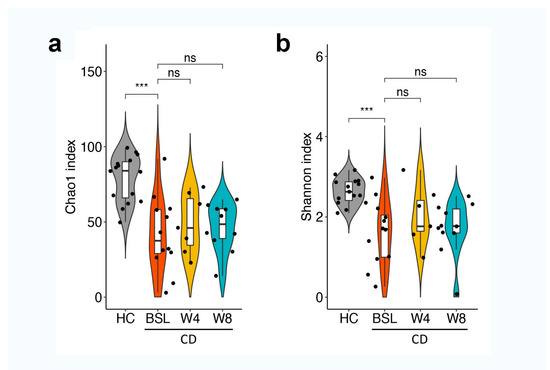
Figure 2.
Alpha diversity in healthy children and pediatric CD patients before and after four and eight weeks of EEN treatment. Alpha diversity was measured using the Chao1 index (a) and Shannon index (b). Statistical differences were assessed via Mann–Whitney U tests and Kruskal–Wallis tests with p-values adjusted with the Benjamini–Hochberg correction procedure for controlling false discovery rate. *** p < 0.001. HC, healthy controls; CD, Crohn’s disease; BSL, baseline.
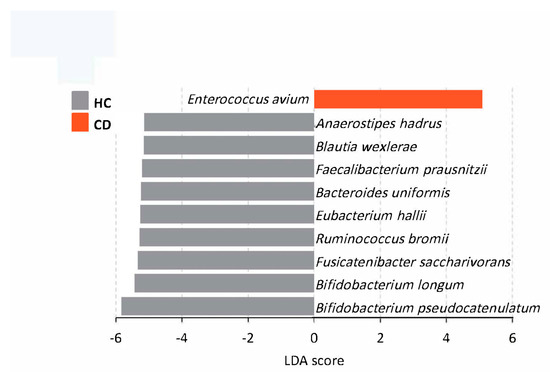
Figure 3.
LEfSe identified representative species in healthy controls and CD patients at baseline. Species that fell below FDR < 0.05 and log LDA cutoff ≥ 5.0 were considered significant for feature level comparisons. HC, healthy controls; CD, Crohn’s disease.
By analyzing fecal BA profiles, we found that pediatric CD patients had dysregulated fecal BA profiles that featured reduced levels of secondary and unconjugated BAs and an increased level of conjugated BAs (Figure 4). Moreover, the ratios of secondary/primary BAs and unconjugated/conjugated BAs were also significantly decreased in CD samples (Figure 4). In addition, pediatric CD patients had decreased levels of α-hyodeoxycholic acid (HDCA), β-hyodeoxycholic acid (βHDCA), apocholic acid (apoCA), 3-epideoxycholic acid (EDCA), α-muricholic acid (αMCA), dehydrolithocholic acid (dehydroLCA), 23-nordeoxycholic acid (NorDCA), taurolithocholic acid (TLCA), lithocholic acid (LCA), isolithocholic acid (isoLCA), and deoxycholic acid (DAC) (Figure 5).
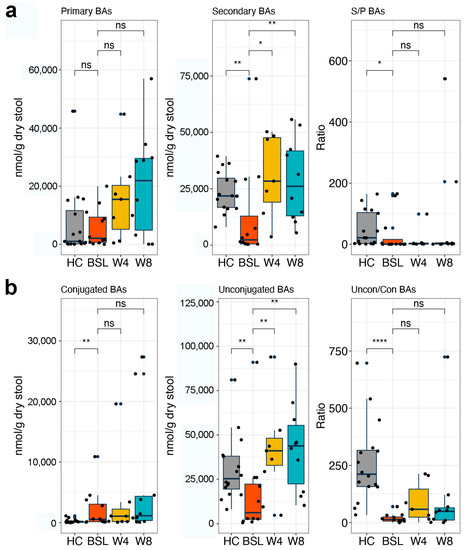
Figure 4.
Analysis of fecal bile acid concentrations in pediatric CD patients during EEN induction therapy. (a) Primary and secondary BA levels, and ratio of secondary to primary BAs. (b) Conjugated and unconjugated BA levels, and ratio of unconjugated to conjugated BAs. Significance was determined via Mann–Whitney U test. * p < 0.05; ** p < 0.01; **** p < 0.0001. BAs, bile acids; HC, healthy controls; BSL, baseline.
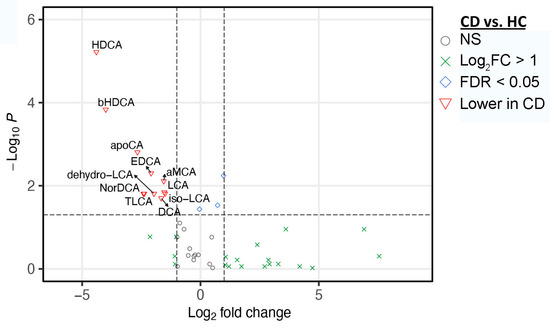
Figure 5.
Significant differences in fecal BAs between CD and HC. Volcano plot represents the difference in fecal BAs between CD and HC at baseline. Statistical significance was determined using the two-tailed Mann Whitney U–test with FDR < 0.05 and fold difference > 2.0. HC, healthy controls; CD, Crohn’s disease; FDR, false discovery rate; HDCA, α-hyodeoxycholic acid; bHDCA, β-hyodeoxycholic acid; apoCA, apocholic acid; EDCA, 3-dpideoxycholic acid; aMCA, α-muricholic acid; LCA, lithocholic acid; dehydro-LCA, dehydrolithocholic acid; isoLCA, isolithocholic acid; DCA, deoxycholic acid; NorDCA, 23-nordeoxycholic acid; TLCA, taurolithocholic acid.
3.3. EEN Induced CD Remission Is Associated with Coordinated Modifications in Gut Microbiota Composition and Bile Acid Metabolism
Significant changes in gut microbiota composition, but not in alpha diversity, were observed after EEN treatment (Figure 2 and Figure 6). EENtreated CD patients showed increased relative abundance of Hungatella, Parvimonas, Clostridioides, Solobacterium, Clostridium, and Enterococcus genera after four or eight weeks of EEN (Supplementary Figure S2). At the species level, increased abundance of Actinomyces sp oral taxon 414, Clostridium innocuum, Clostridium perfringens, Clostridioides difficile, Hungatella hathewayi, Parvimonas micra, and Solobacterium moorei, and decreased levels of Bacteroides stercoris, Haemophilus parainfluenzae, and Veillonella atypica were detected after four or eight weeks of EEN treatment (Figure 6). It is worth noting that neither toxin (TcdA and TcdB) was detected in the stool samples, nor were diarrhea or infection symptoms observed in these CD patients.
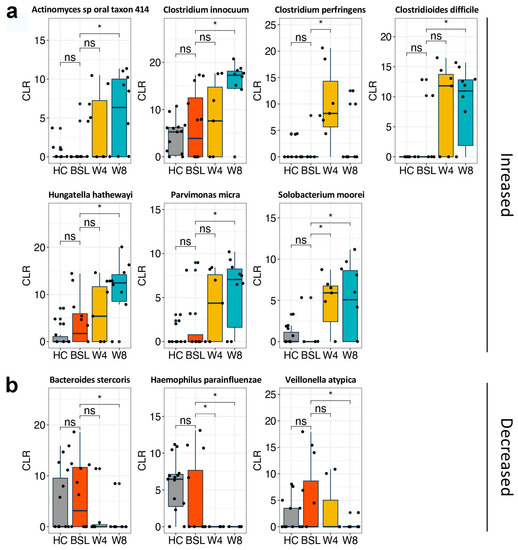
Figure 6.
Metagenomic analysis of gut microbiota profiles in CD patients before and after EEN induction therapy. Boxplots demonstrate significantly increased (a) and decreased (b) bacterial species after either 4 w or 8 w of EEN therapy. Significance was determined via Welch’s t-test based on CLR-transformed counts. * p < 0.05. HC, healthy controls; BSL, baseline; CLR, centered log-ratio.
EEN treatment induced remarkable changes in fecal BA metabolism in pediatric CD patients. Both primary and secondary BA levels increased after EEN treatment, but statistical significance was only achieved for secondary BAs (Figure 4a). However, the ratio of secondary to primary BAs did not significantly change after EEN treatment. The level of unconjugated BAs as well as the ratio of unconjugated to conjugated BAs increased significantly at four weeks post EEN treatment and maintained throughout the eight weeks of the therapeutic period (Figure 4b). Among the significantly increased BAs, the levels of HCA, αMCA, and 6-keto-lithocholic acid (6-ketoLCA) were elevated after four weeks of EEN in the pediatric CD patients, and persisted for eight weeks after EEN therapy (Mann–Whitney U-test, q < 0.05 and fold change > 2.0; Figure 7). Most notable is the higher concentration of HCA compared to the other BAs at week eight (mean ± sd, 123.88 ± 47.57 nmol/g). In addition, HDCA, one of HCA species, was also significantly enriched after eight weeks of EEN (Mann–Whitney U-test, q < 0.05 and fold change > 2.0; Figure 7).
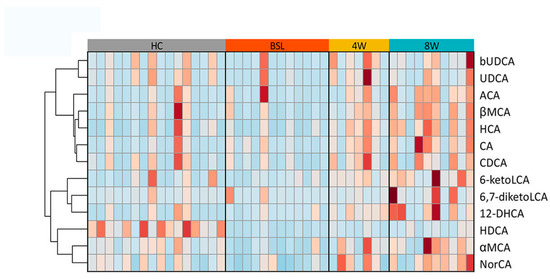
Figure 7.
Significantly changed BAs in CD patients after EEN therapy. Heatmap demonstrating significantly changed BAs (all upregulated) in CD patients after EEN induction therapy with fold changes > 2.0. Statistical significance was determined using two-tailed Mann–Whitney U-tests, with FDR < 0.05 and fold difference > 2.0. bUDCA, 3β-ursodeoxycholic acid; UDCA, ursodeoxycholic acid; ACA, allocholic acid; βMCA, β-muricholic acid; HCA, hyocholic acid; CA, cholic acid; CDCA, chenodeoxycholic acid; 6-ketoLCA, 6-ketolithocholic acid; 6,7-diketoLCA, 6,7-diketolithocholic acid; 12-DHCA, 12-dehydrocholic acid; HDCA, α-hyodeoxycholic acid; aMCA, α-muricholic acid; NorCA, norcholic acid.
Further analysis indicated that the simultaneous changes in gut microbiota and BA metabolism were closely associated with CD symptom improvement and severity reduction induced by EEN treatment (Figure 8, Figure 9 and Figure S2). The increased levels of HCA, HDCA, αMCA, βMCA, NorCA, 6-ketoLCA, 3β-ursodeoxycholic acid (bUDCA), UDCA, 12-dehydrocholic acid (12-DHCA), allocholic acid (ACA), and 6,7-diketolithocholic acid (6,7-diketoLCA) showed a negative correlation with decreased PCDAI scores (p < 0.05 and Spearman correlation coefficient r < −0.5; Figure 8). In addition, these BAs were also negatively correlated with FCP, WBC, PLT, CRP, CDEIS, and ESR, indicating their potential contributions in improving CD symptoms (Supplementary Figure S3a). The relative abundance of Eggerthella lenta, Clostridium innocuum, and Gordonibacter pamelaeae inversely correlated with levels of PCDAI, FCP, WBC, and ESR (Supplementary Figure S3b). Peptostreptococcus stomatis and Anaerostipes caccae were positively correlated with ESR, and Peptostreptococcus stomatis was also positively correlated with PCDAI, suggesting a pathogenic/pro-inflammatory potential in these species.
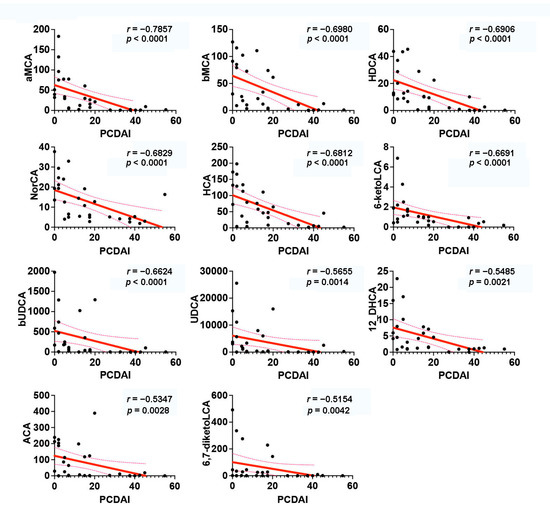
Figure 8.
Interrelationships between bile acid profiles and PCDAI in CD. Significant correlations were identified by Spearman correlations with p < 0.05 and |r| > 0.5. CD, Crohn’s disease; PCDAI, Pediatric Crohn’s Disease Activity Index; aMCA, α-muricholic acid; βMCA, β-muricholic acid; HDCA, α-hyodeoxycholic acid; NorCA, norcholic acid; HCA, hyocholic acid; 6-ketoLCA, 6-ketolithocholic acid; bUDCA, 3β-ursodeoxycholic acid; UDCA, ursodeoxycholic acid; 12-DHCA, 12-dehydrocholic acid; ACA, allocholic acid; 6,7-diketoLCA, 6,7-diketolithocholic acid.
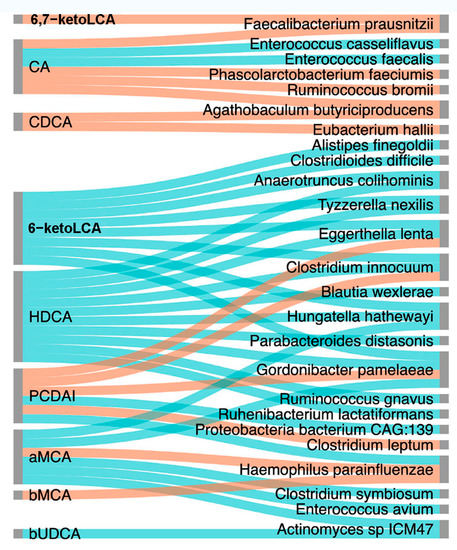
Figure 9.
Interrelationships among bile acid profiles, PCDAI and gut microbiota. Sankey plot constructed using NAMAP with Spearman’s rank correlations between PCDAI, gut microbiota (species level), and fecal BAs that were significantly enriched after EEN induction therapy. The network shows associations that are statistically significant with a cutoff of p < 0.05 and r > 0.7 based on bootstrapping of 100 iterations. Direct correlations are indicated as blue edges and inverse correlations as red edges. 6,7-ketoLCA, 6,7-ketolithocholic acid; CA, cholic acid; CDCA, chenodeoxycholic acid; 6-ketoLCA, 6-ketolithocholic acid; HDCA, α-hyodeoxycholic acid; PCDAI, Pediatric Crohn’s Disease Activity Index; aMCA, α-muricholic acid; βMCA, β-muricholic acid; bUDCA, 3β-ursodeoxycholic acid.
We next tried to identify associations between changed gut bacteria and BAs in CD patients using Spearman’s rank correlation coefficient. The results show that certain gut bacteria were correlated with eight kinds of BAs that increased in CD patients after EEN therapy. For example, Hungatella hathewayi showed positive correlations with HDCA, 6-ketoLCA, and αMCA, Haemophilus parainfluenzae showed negative correlations with αMCA and βMCA, and Actinomyces sp ICM47 positively correlated with bUDCA and αMCA. Notably, there was a relative abundance of gut bacteria that were negatively corrected with PCDAI, including Eggerthella lenta, Clostridium innocuum, and Gordonibacter pamelaeae, which were positively correlated with levels of HDCA (Figure 9).
3.4. HCA Suppresses TNF Production in CD4 T Lymphocytes within Peripheral Blood of CD Patients
We hypothesized that specific EEN-enriched BAs could contribute to CD remission by suppressing intestinal inflammatory immune responses. To test this hypothesis, we further analyzed the immunity modulation effects of HCA in vitro. PBMCs isolated from five CD patients, and their characteristics and clinical information were included in Supplementary Table S1. The addition of HCA significantly suppressed TNF-α production in PBMCs, while not affecting the levels of IFN-γ (Figure 10a). Moreover, flow cytometry analysis demonstrated that the incidences of IFN-γ- and TNF-α- producing cells in the CD4+ T cell population were significantly decreased due to HCA intervention (Figure 10b), while their incidences in CD8+ T cells were not affected in most of the tested cases (Figure 10c).

Figure 10.
HCA suppresses the inflammatory response in PBMCs isolated from CD patients. (a) TNF-α and IFN-γ production was measured via ELISA and compared between HCA- and DMSO-treated PBMCs (isolated from seven CD patients) after stimulation with CD3/CD28-coated magnetic beads. Proportions of TNF-α+ and IFN-γ+ subsets in (b) CD4+ and (c) CD8+ T cells measured by flow cytometry. The paired samples t-test was used to compare the two groups. * p < 0.015; ** p < 0.01. CD, Crohn’s disease; PBMCs, peripheral blood mononuclear cells; TNF-α, tumor necrosis factor-α; IFN-γ, interferon-γ.
3.5. HCA Relieves DSS-Induced Colitis in Mice
We used the DSS-induced mouse colitis model to further access the potential of HCA against colonic inflammation. We induced colitis in C57BL/6 mice by administering 3% DSS in drinking water for nine days. HCA was administrated on day four via intraperitoneal injection for five days at a daily dose of 20 mg/kg body weight. DSS-induced body weight loss was relieved by HCA administration (Figure 11a). On day nine, the average colon length was longer in the HCA-treated mice than in the DSS group, but a statistical difference was not achieved (Figure 11b). Thus, HCA treatment could alleviate DSS-induced colonic colitis in mice to a certain extent, suggesting a potential protective/anti-inflammatory effect of HCA.
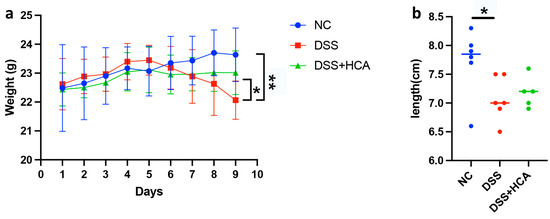
Figure 11.
HCA attenuates DSS-induced colitis. (a) Body weight changes during the course of the experiment. (b) The colon lengths of mice as measured at sacrifice on day nine. Comparisons among the control, DSS, and DSS + HCA groups were performed using Mann–Whitney tests. * p < 0.05; ** p < 0.01. NC: normal control; DSS: dextran sodium sulfate; HCA: hyocholic acid.
4. Discussion
EEN was first introduced to treat active IBD in the 1970s and became the frontline therapy in the 1990s [33]. Current evidence indicates that EEN improves outcomes in CD patients by ameliorating micronutrient and macronutrient deficiencies, reducing antigenic load, exerting direct anti-inflammatory effects, and correcting gut microbiota dysbiosis [16,34]. However, the mechanisms of action of EEN remain elusive. In this study, we reported the therapeutic outcomes of EEN in pediatric CD, characterized the differences in gut microbiota and the altered BA pool in pediatric CD patients during EEN therapy, and explored the effect of EEN-enriched HCA in inhibiting the inflammatory response. After eight weeks of EEN therapy, 91.7% (11/12) of pediatric CD patients achieved clinical remission, and 75% (9/12) achieved endoscopic remission, which was similar to previous studies [10,13,15]. EEN treatment significantly decreased serum and fecal inflammatory markers, including ESR, WBC, PLT, CRP, and FCP. Although BMI and STAMP scores displayed no significant improvement, other nutritional indexes (i.e., HB, ALB, and PA) significantly increased after EEN. Overall, our data revealed that EEN could induce clinical remission and endoscopic remission, decrease inflammatory markers, and partially improve the nutrition status of pediatric CD patients.
IBD-associated gut microbiota dysbiosis and impaired microbiota enzymatics lead to dysmetabolism, including reduced SCFA production and modifications in luminal BA pool composition [5,35]. Gut microbiota dysbiosis was repeatedly reported in pediatric CD patients and recognized as a crucial factor involved in the inflammation process and affecting the responses to multiple therapeutics [36]. In line with previous findings, the gut microbiota of pediatric CD patients showed decreased biodiversity, reduced levels of beneficial taxa such Bifidobacterium spp. and Faecalibacterium prausnitzii, and increased levels of proinflammatory bacteria such as Escherichia. Moreover, a reduced abundance of multiple BA-metabolizing bacteria, such as Eubacterium (which possess 7α-dehydroxylation) and Ruminococcus (which exhibit both 7α- and 7β- hydroxysteroid dehydrogenase (HSDH)) was detected in accordance with declined fecal levels of secondary and unconjugated BAs, confirming impaired BA metabolism. Our previous study suggested that the effects of anti-TNF agents for CD might be partially mediated by upregulating gut bacteria that produce bile salt hydrolases (BSH), thereby restoring BA metabolism and inhibiting inflammation [35]. In the present study, we observed that a range of BA-metabolizing bacteria increased in the gut microbiota of pediatric CD patients after EEN treatment, including several species of Clostridium (C. innocuum, C. difficile, and C. perfringens). Notably, Clostridium spp. are carriers of a range of genes involved in BA deconjugation and dehydroxylation [37]. For example, C. innocuum carries genes encoding enzymes 3β- HSDH, 7α-HSDH, 7β-HSDH and 5β-reductase (5BR) [38,39], thereby participating in BA transformations such as the production of oxo (keto) BAs. Gordonibacter pamelaeae and Hungatella hathewayi, two additional bacterial species increased under EEN, were also suggested to carry 3α/3β-HSDH and 5BR [39], respectively. Thus, EEN increased certain bacteria with enzymes involved in the production of these enriched BAs.
Gut microbiota dysbiosis in IBD can result in a profound impact in BA metabolism, including deficiencies in the deconjugation, dehydrogenation, and dehydroxylation of primary BAs. Altered BA metabolism, especially a reduced level of secondary BAs, is suggested to contribute to a pro-inflammatory state [21]. Deficiencies in DCA, LCA, and their metabolites, such as oxo derivatives, were suggested to promote intestinal inflammation in UC patients [40]. Duboc et al. reported increased levels of fecal conjugated BAs in active IBD, while secondary BAs were decreased [5]. Previous studies showed that some secondary bile acids, such as isoalloLCA, LCA, UDCA, and tauroursodeoxycholic acid (TUDCA), play important roles in maintaining intestinal homeostasis [41,42,43]. Connors et al. noted that patients who achieved and sustained remission after EEN had a fecal BA profile dominated by secondary BAs [44]. Our analysis also indicated a significant increase in secondary BA and unconjugated BA concentrations after EEN therapy. In addition, there were multiple EEN-enriched BAs that showed close associations with improvements in CD patients’ inflammatory and nutritional indexes. Interestingly, we found that the concentration of HCA increased and persisted after eight weeks of EEN in pediatric CD patients, and HDCA also significantly increased after eight weeks EEN.
Previous studies suggested that some BAs could regulate host immune responses by modulating the Th17 and Treg balance [22,45]. On this basis, we attempted to explore the role of HCA in suppressing intestinal inflammatory immune responses. HCA was recently found to simultaneously activate TGR5 while inhibiting FXR in enteroendocrine cells [46], and both receptors were found to modulate the inflammation occurring in IBD [47]. CD has been associated with an inflammatory CD4+ T cell phenotype [48]. Our data showed an anti-inflammatory effect of HCA through inhibiting TNF-α production in human PBMCs stimulated with anti-CD/anti-CD28 monoclonal antibodies, which revealed the role of HCA in attenuating the inflammatory response. Moreover, the administration of HCA alleviated DSS-induced acute colitis in mice, suggesting a potential protective/anti-inflammatory effect of HCA. Further experiments are required to access the anti-inflammatory capacities of other EEN-enriched BAs, and the results may lead to targets for the development of new therapies for IBD.
Recent studies indicate that BA receptors are involved in regulating both innate and adaptive immunity [49,50,51]. We found that some EEN-enriched BAs in CD patients are agonists/antagonists of some BA receptors, such as FXR, TGR5, VDR, and RORγt (Supplementary Table S2). TGR5 activation promotes the differentiation of macrophages towards M2 phenotypes, thereby enhancing the development of Treg cells via IL-10 production and inhibiting the M1 phenotype, which is known to produce pro-inflammatory cytokines [52]. Activating FXR via its agonist was also shown to prevent gut barrier dysfunction [53]. FXR knockout mice developed an IBD-like phenotype and exhibited pronounced hepatic inflammation and fibrosis [54]. Among the BAs enriched after EEN treatment, CA and CDCA are agonists of FXR while the MACs including αMCA, βMCA, and HCA were found to inhibit FXR as antagonists [46,49]. In our previous study, B. longum CECT 7894 improved the efficacy of infliximab for DSS-induced colitis and increased the expression of FXR via regulating the gut microbiota composition and bile acid metabolism [55]. Vitamin D deficiency is associated with the onset and activity of IBD, mainly because vitamin D exerts a regulatory role in mucosal immunity and host defenses via VDR [56]. As a subset of CD4+ T cells, Th17 cells produce IL-17A, IL-17F, IL-21, IL-22, IL-26, and the chemokine CCL20, which are critically involved in the mucosal inflammation observed CD. The oxo- (or keto-) derivatives of BAs are shown to be antagonists of RORγt [21], and the EEN-enriched 6-keto-LCA and 6,7-diketo-LCA may inhibit the proinflammatory activities of Th17 cells in a RORγt-dependent manner. Taken together, these EEN-enriched BAs and the BA receptors they activate/inhibit are versatile in modulating the development and functions of the innate and adaptive immune system and thereby contributing to colitis remission and mucosa repair in pediatric CD patients.
This study has some limitations. First, this study was conducted at a single center with a relatively small cohort. Multicenter randomized controlled trials could be performed to minimize confounding factors. Second, the assessment of gut microbiota and BAs was not performed in sustained and non-sustained remission CD patients after EEN therapy. Third, for research on the mechanism by which EEN enriches BAs, we only demonstrated that HCA could inhibit pro-inflammatory cytokine production by regulating CD4+ T cells in vitro. Thus, further experiments are required to explore and detect which BA receptors HCA stimulates/inhibits to perform its immune regulatory functions.
5. Conclusions
In summary, we showed that EEN therapy altered microbiota composition and the BA pool in pediatric CD patients. EEN treatment induced remission in children with active CD partially by increasing a number of secondary BAs, such as HCA, which could suppress TNF-α production by CD4+ T cells in PBMCs of CD patients and attenuate DSS-induced acute colitis in mice. These BAs are likely produced by increased levels of certain bacteria, including Clostridium innocuum and Hungatella hathewayi, which express 3β-hydroxysteroid dehydrogenase and 5β-reductase. Thus, certain BAs may provide a possibility for improving anti-inflammatory and immunity modulation effects in pediatric CD patients in the future.
Supplementary Materials
The following supporting information can be downloaded at: https://www.mdpi.com/article/10.3390/nu14214463/s1, Supplementary Table S1. Clinical characteristics of PBMC donors with active CD. Supplementary Table S2. EEN-enriched bile acids are natural ligands of various receptors that are distributed across different immune cells. Supplementary Figure S1. EEN-induced endoscopic improvement in pediatric CD. Endoscopic images showing the transverse colon in two patients and the ileocecal junction in one patient at baseline and eight weeks after EEN treatment. Supplementary Figure S2. Metagenomic analysis of the gut microbiota profiles in CD patients before and after EEN induction therapy. Heatmap demonstrates changes in the relative abundances of gut bacteria at the genus level during eight weeks of EEN induction therapy. Significance was determined by Mann–Whitney U test with p < 0.05 based on the clr-transformed counts. # Significantly different between CD and HC at baseline. * Significantly changed after either 4 w or 8 w of EEN therapy. Supplementary Figure S3. EEN-induced changes in gut microbiota and bile acid metabolism are closely associated with CD symptom improvement. Heatmap showing the Spearman correlations between the serum inflammatory markers and severity indexes of pediatric CD (PCDAI and CDEIS), and (a) BAs and (b) gut bacterial species. Significance was determined by t-test. * p < 0.05; ** p < 0.01; *** p < 0.001.
Author Contributions
X.G. and T.Z. designed the study; F.X. and X.G. analyzed the omics data and created figures; F.X., H.H. and J.L. collected and interpreted the clinical data; Y.C. and X.S. performed the animal experiments; Y.X. and Z.L. performed the in vitro experiment and flow cytometry analysis; F.X. and X.G. interpreted the experimental data and drafted the manuscript; Y.W. and T.Z. revised the manuscript; all authors read and approved the final manuscript. All authors have read and agreed to the published version of the manuscript.
Funding
This work was supported by grants from the National Natural Science Foundation of China (grant number 81870373, 81900474), Shanghai Science and Technology Committee (grant number 19140904300), Shenzhen Key Laboratory Foundation (grant number ZDSYS20200811143757022), and Peacock Talent Programs Research Start-up Grant (grant number 802-012677).
Institutional Review Board Statement
This study conformed to the ethical guidelines of the 1964 Declaration of Helsinki and its later amendments. The Institutional Review Board of Shanghai Children’s Hospital approved the study protocol (No. 2020R034-E02, approval date 19 June 2020). The animal experimental procedures were approved by the Laboratory Animal Ethics Committee of Shenzhen University.
Informed Consent Statement
Informed consent was obtained from all subjects involved in the study.
Data Availability Statement
The data that support the findings of this study are available from figshare at the DOI https://doi.org/10.6084/m9.figshare.19665972.v1. The raw data from this study will be published after acceptance of this paper for publication.
Conflicts of Interest
The authors declare that they have no conflict of interest.
References
- Ng, S.C.; Shi, H.Y.; Hamidi, N.; Underwood, F.E.; Tang, W.; Benchimol, E.I.; Panaccione, R.; Ghosh, S.; Wu, J.C.Y.; Chan, F.K.L.; et al. Worldwide incidence and prevalence of inflammatory bowel disease in the 21st century: A systematic review of population-based studies. Lancet 2018, 390, 2769–2778. [Google Scholar] [CrossRef]
- Qiao, Y.; Ran, Z. Potential influential factors on incidence and prevalence of inflammatory bowel disease in mainland China. JGH Open Open Access J. Gastroenterol. Hepatol. 2020, 4, 11–15. [Google Scholar] [CrossRef] [PubMed]
- Parada Venegas, D.; De la Fuente, M.K.; Landskron, G.; Gonzalez, M.J.; Quera, R.; Dijkstra, G.; Harmsen, H.J.M.; Faber, K.N.; Hermoso, M.A. Short Chain Fatty Acids (SCFAs)-Mediated Gut Epithelial and Immune Regulation and Its Relevance for Inflammatory Bowel Diseases. Front Immunol. 2019, 10, 277. [Google Scholar] [CrossRef]
- Scoville, E.A.; Allaman, M.M.; Brown, C.T.; Motley, A.K.; Horst, S.N.; Williams, C.S.; Koyama, T.; Zhao, Z.; Adams, D.W.; Beaulieu, D.B.; et al. Alterations in Lipid, Amino Acid, and Energy Metabolism Distinguish Crohn’s Disease from Ulcerative Colitis and Control Subjects by Serum Metabolomic Profiling. Metabolomics 2018, 14, 17. [Google Scholar] [CrossRef] [PubMed]
- Duboc, H.; Rajca, S.; Rainteau, D.; Benarous, D.; Maubert, M.A.; Quervain, E.; Thomas, G.; Barbu, V.; Humbert, L.; Despras, G.; et al. Connecting dysbiosis, bile-acid dysmetabolism and gut inflammation in inflammatory bowel diseases. Gut 2013, 62, 531–539. [Google Scholar] [CrossRef] [PubMed]
- Ni, J.; Wu, G.D.; Albenberg, L.; Tomov, V.T. Gut microbiota and IBD: Causation or correlation? Nat. Rev. Gastroenterol. Hepatol. 2017, 14, 573–584. [Google Scholar] [CrossRef] [PubMed]
- Gevers, D.; Kugathasan, S.; Denson, L.A.; Vazquez-Baeza, Y.; Van Treuren, W.; Ren, B.; Schwager, E.; Knights, D.; Song, S.J.; Yassour, M.; et al. The treatment-naive microbiome in new-onset Crohn’s disease. Cell Host Microbe 2014, 15, 382–392. [Google Scholar] [CrossRef]
- Sokol, H.; Leducq, V.; Aschard, H.; Pham, H.P.; Jegou, S.; Landman, C.; Cohen, D.; Liguori, G.; Bourrier, A.; Nion-Larmurier, I.; et al. Fungal microbiota dysbiosis in IBD. Gut 2017, 66, 1039–1048. [Google Scholar] [CrossRef]
- El Mouzan, M.; Wang, F.; Al Mofarreh, M.; Menon, R.; Al Barrag, A.; Korolev, K.S.; Al Sarkhy, A.; Al Asmi, M.; Hamed, Y.; Saeed, A.; et al. Fungal Microbiota Profile in Newly Diagnosed Treatment-naive Children with Crohn’s Disease. J. Crohns Colitis 2017, 11, 586–592. [Google Scholar] [CrossRef]
- Rubio, A.; Pigneur, B.; Garnier-Lengline, H.; Talbotec, C.; Schmitz, J.; Canioni, D.; Goulet, O.; Ruemmele, F.M. The efficacy of exclusive nutritional therapy in paediatric Crohn’s disease, comparing fractionated oral vs. continuous enteral feeding. Aliment. Pharm. 2011, 33, 1332–1339. [Google Scholar] [CrossRef]
- Lee, D.; Baldassano, R.N.; Otley, A.R.; Albenberg, L.; Griffiths, A.M.; Compher, C.; Chen, E.Z.; Li, H.; Gilroy, E.; Nessel, L.; et al. Comparative Effectiveness of Nutritional and Biological Therapy in North American Children with Active Crohn’s Disease. Inflamm. Bowel Dis. 2015, 21, 1786–1793. [Google Scholar] [CrossRef] [PubMed]
- Dziechciarz, P.; Horvath, A.; Shamir, R.; Szajewska, H. Meta-analysis: Enteral nutrition in active Crohn’s disease in children. Aliment Pharm. 2007, 26, 795–806. [Google Scholar] [CrossRef] [PubMed]
- Grover, Z.; Muir, R.; Lewindon, P. Exclusive enteral nutrition induces early clinical, mucosal and transmural remission in paediatric Crohn’s disease. J. Gastroenterol. 2014, 49, 638–645. [Google Scholar] [CrossRef] [PubMed]
- Swaminath, A.; Feathers, A.; Ananthakrishnan, A.N.; Falzon, L.; Li Ferry, S. Systematic review with meta-analysis: Enteral nutrition therapy for the induction of remission in paediatric Crohn’s disease. Aliment. Pharm. 2017, 46, 645–656. [Google Scholar] [CrossRef]
- Ruemmele, F.M.; Veres, G.; Kolho, K.L.; Griffiths, A.; Levine, A.; Escher, J.C.; Amil Dias, J.; Barabino, A.; Braegger, C.P.; Bronsky, J.; et al. Consensus guidelines of ECCO/ESPGHAN on the medical management of pediatric Crohn’s disease. J Crohns Colitis 2014, 8, 1179–1207. [Google Scholar] [CrossRef] [PubMed]
- MacLellan, A.; Moore-Connors, J.; Grant, S.; Cahill, L.; Langille, M.G.I.; Van Limbergen, J. The Impact of Exclusive Enteral Nutrition (EEN) on the Gut Microbiome in Crohn’s Disease: A Review. Nutrients 2017, 9, 447. [Google Scholar] [CrossRef]
- Diederen, K.; Li, J.V.; Donachie, G.E.; de Meij, T.G.; de Waart, D.R.; Hakvoort, T.B.M.; Kindermann, A.; Wagner, J.; Auyeung, V.; Te Velde, A.A.; et al. Exclusive enteral nutrition mediates gut microbial and metabolic changes that are associated with remission in children with Crohn’s disease. Sci. Rep. 2020, 10, 18879. [Google Scholar] [CrossRef]
- Gadaleta, R.M.; van Erpecum, K.J.; Oldenburg, B.; Willemsen, E.C.; Renooij, W.; Murzilli, S.; Klomp, L.W.; Siersema, P.D.; Schipper, M.E.; Danese, S.; et al. Farnesoid X receptor activation inhibits inflammation and preserves the intestinal barrier in inflammatory bowel disease. Gut 2011, 60, 463–472. [Google Scholar] [CrossRef]
- Yoneno, K.; Hisamatsu, T.; Shimamura, K.; Kamada, N.; Ichikawa, R.; Kitazume, M.T.; Mori, M.; Uo, M.; Namikawa, Y.; Matsuoka, K.; et al. TGR5 signalling inhibits the production of pro-inflammatory cytokines by in vitro differentiated inflammatory and intestinal macrophages in Crohn’s disease. Immunology 2013, 139, 19–29. [Google Scholar] [CrossRef]
- Gisbert-Ferrandiz, L.; Cosin-Roger, J.; Hernandez, C.; Macias-Ceja, D.C.; Ortiz-Masia, D.; Salvador, P.; Esplugues, J.V.; Hinojosa, J.; Navarro, F.; Calatayud, S.; et al. Diminished Vitamin D Receptor Protein Levels in Crohn’s Disease Fibroblasts: Effects of Vitamin, D. Nutrients 2020, 12, 973. [Google Scholar] [CrossRef]
- Song, X.; Sun, X.; Oh, S.F.; Wu, M.; Zhang, Y.; Zheng, W.; Geva-Zatorsky, N.; Jupp, R.; Mathis, D.; Benoist, C.; et al. Microbial bile acid metabolites modulate gut RORgamma(+) regulatory T cell homeostasis. Nature 2020, 577, 410–415. [Google Scholar] [CrossRef] [PubMed]
- Hang, S.; Paik, D.; Yao, L.; Kim, E.; Trinath, J.; Lu, J.; Ha, S.; Nelson, B.N.; Kelly, S.P.; Wu, L.; et al. Bile acid metabolites control TH17 and Treg cell differentiation. Nature 2019, 576, 143–148. [Google Scholar] [CrossRef] [PubMed]
- Levine, A.; Koletzko, S.; Turner, D.; Escher, J.C.; Cucchiara, S.; de Ridder, L.; Kolho, K.L.; Veres, G.; Russell, R.K.; Paerregaard, A.; et al. ESPGHAN revised porto criteria for the diagnosis of inflammatory bowel disease in children and adolescents. J. Pediatr. Gastroenterol. Nutr. 2014, 58, 795–806. [Google Scholar] [CrossRef] [PubMed]
- Chen, S.; Zhou, Y.; Chen, Y.; Gu, J. fastp: An ultra-fast all-in-one FASTQ preprocessor. Bioinformatics 2018, 34, i884–i890. [Google Scholar] [CrossRef]
- Langmead, B.; Salzberg, S.L. Fast gapped-read alignment with Bowtie 2. Nat. Methods 2012, 9, 357–359. [Google Scholar] [CrossRef] [PubMed]
- Church, D.M.; Schneider, V.A.; Graves, T.; Auger, K.; Cunningham, F.; Bouk, N.; Chen, H.C.; Agarwala, R.; McLaren, W.M.; Ritchie, G.R.; et al. Modernizing reference genome assemblies. PLoS Biol. 2011, 9, e1001091. [Google Scholar] [CrossRef]
- Segata, N.; Waldron, L.; Ballarini, A.; Narasimhan, V.; Jousson, O.; Huttenhower, C. Metagenomic microbial community profiling using unique clade-specific marker genes. Nat. Methods 2012, 9, 811–814. [Google Scholar] [CrossRef]
- Chong, J.; Liu, P.; Zhou, G.; Xia, J. Using MicrobiomeAnalyst for comprehensive statistical, functional, and meta-analysis of microbiome data. Nat. Protoc. 2020, 15, 799–821. [Google Scholar] [CrossRef]
- Zakrzewski, M.; Proietti, C.; Ellis, J.J.; Hasan, S.; Brion, M.J.; Berger, B.; Krause, L. Calypso: A user-friendly web-server for mining and visualizing microbiome-environment interactions. Bioinformatics 2017, 33, 782–783. [Google Scholar] [CrossRef]
- Zheng, X.; Huang, F.; Zhao, A.; Lei, S.; Zhang, Y.; Xie, G.; Chen, T.; Qu, C.; Rajani, C.; Dong, B.; et al. Bile acid is a significant host factor shaping the gut microbiome of diet-induced obese mice. BMC Biol. 2017, 15, 120. [Google Scholar] [CrossRef]
- Wang, Y.; Gao, X.; Zhang, X.; Xiao, Y.; Huang, J.; Yu, D.; Li, X.; Hu, H.; Ge, T.; Li, D.; et al. Gut Microbiota Dysbiosis Is Associated with Altered Bile Acid Metabolism in Infantile Cholestasis. mSystems 2019, 4, e00463-19. [Google Scholar] [CrossRef]
- Chong, J.; Soufan, O.; Li, C.; Caraus, I.; Li, S.; Bourque, G.; Wishart, D.S.; Xia, J. MetaboAnalyst 4.0: Towards more transparent and integrative metabolomics analysis. Nucleic Acids Res. 2018, 46, W486–W494. [Google Scholar] [CrossRef]
- Ashton, J.J.; Gavin, J.; Beattie, R.M. Exclusive enteral nutrition in Crohn’s disease: Evidence and practicalities. Clin. Nutr. 2019, 38, 80–89. [Google Scholar] [CrossRef] [PubMed]
- Mitrev, N.; Huang, H.; Hannah, B.; Kariyawasam, V.C. Review of exclusive enteral therapy in adult Crohn’s disease. BMJ Open Gastroenterol. 2021, 8, e000745. [Google Scholar] [CrossRef]
- Wang, Y.; Gao, X.; Zhang, X.; Xiao, F.; Hu, H.; Li, X.; Dong, F.; Sun, M.; Xiao, Y.; Ge, T.; et al. Microbial and metabolic features associated with outcome of infliximab therapy in pediatric Crohn’s disease. Gut Microbes 2021, 13, 1865708. [Google Scholar] [CrossRef]
- Wang, Y.; Gao, X.; Ghozlane, A.; Hu, H.; Li, X.; Xiao, Y.; Li, D.; Yu, G.; Zhang, T. Characteristics of Faecal Microbiota in Paediatric Crohn’s Disease and Their Dynamic Changes During Infliximab Therapy. J. Crohns Colitis 2018, 12, 337–346. [Google Scholar] [CrossRef]
- Jia, W.; Xie, G.; Jia, W. Bile acid-microbiota crosstalk in gastrointestinal inflammation and carcinogenesis. Nat. Rev. Gastroenterol. Hepatol. 2018, 15, 111–128. [Google Scholar] [CrossRef]
- Marion, S.; Desharnais, L.; Studer, N.; Dong, Y.; Notter, M.D.; Poudel, S.; Menin, L.; Janowczyk, A.; Hettich, R.L.; Hapfelmeier, S.; et al. Biogeography of microbial bile acid transformations along the murine gut. J. Lipid Res. 2020, 61, 1450–1463. [Google Scholar] [CrossRef]
- Sato, Y.; Atarashi, K.; Plichta, D.R.; Arai, Y.; Sasajima, S.; Kearney, S.M.; Suda, W.; Takeshita, K.; Sasaki, T.; Okamoto, S.; et al. Novel bile acid biosynthetic pathways are enriched in the microbiome of centenarians. Nature 2021, 599, 458–464. [Google Scholar] [CrossRef] [PubMed]
- Sinha, S.R.; Haileselassie, Y.; Nguyen, L.P.; Tropini, C.; Wang, M.; Becker, L.S.; Sim, D.; Jarr, K.; Spear, E.T.; Singh, G.; et al. Dysbiosis-Induced Secondary Bile Acid Deficiency Promotes Intestinal Inflammation. Cell Host Microbe 2020, 27, 659–670 e655. [Google Scholar] [CrossRef] [PubMed]
- Li, W.; Hang, S.; Fang, Y.; Bae, S.; Zhang, Y.; Zhang, M.; Wang, G.; McCurry, M.D.; Bae, M.; Paik, D.; et al. A bacterial bile acid metabolite modulates Treg activity through the nuclear hormone receptor NR4A1. Cell Host Microbe 2021, 29, 1366–1377 e1369. [Google Scholar] [CrossRef] [PubMed]
- Ward, J.B.J.; Lajczak, N.K.; Kelly, O.B.; O’Dwyer, A.M.; Giddam, A.K.; Ni Gabhann, J.; Franco, P.; Tambuwala, M.M.; Jefferies, C.A.; Keely, S.; et al. Ursodeoxycholic acid and lithocholic acid exert anti-inflammatory actions in the colon. Am. J. Physiol. Gastrointest. Liver Physiol. 2017, 312, G550–G558. [Google Scholar] [CrossRef] [PubMed]
- Laukens, D.; Devisscher, L.; Van den Bossche, L.; Hindryckx, P.; Vandenbroucke, R.E.; Vandewynckel, Y.P.; Cuvelier, C.; Brinkman, B.M.; Libert, C.; Vandenabeele, P.; et al. Tauroursodeoxycholic acid inhibits experimental colitis by preventing early intestinal epithelial cell death. Lab. Investig. 2014, 94, 1419–1430. [Google Scholar] [CrossRef] [PubMed]
- Connors, J.; Dunn, K.A.; Allott, J.; Bandsma, R.; Rashid, M.; Otley, A.R.; Bielawski, J.P.; Van Limbergen, J. The relationship between fecal bile acids and microbiome community structure in pediatric Crohn’s disease. ISME J. 2020, 14, 702–713. [Google Scholar] [CrossRef]
- Chen, M.L.; Takeda, K.; Sundrud, M.S. Emerging roles of bile acids in mucosal immunity and inflammation. Mucosal. Immunol. 2019, 12, 851–861. [Google Scholar] [CrossRef]
- Zheng, X.; Chen, T.; Jiang, R.; Zhao, A.; Wu, Q.; Kuang, J.; Sun, D.; Ren, Z.; Li, M.; Zhao, M.; et al. Hyocholic acid species improve glucose homeostasis through a distinct TGR5 and FXR signaling mechanism. Cell Metab. 2021, 33, 791–803.e7. [Google Scholar] [CrossRef]
- Hu, J.; Wang, C.; Huang, X.; Yi, S.; Pan, S.; Zhang, Y.; Yuan, G.; Cao, Q.; Ye, X.; Li, H. Gut microbiota-mediated secondary bile acids regulate dendritic cells to attenuate autoimmune uveitis through TGR5 signaling. Cell Rep. 2021, 36, 109726. [Google Scholar] [CrossRef]
- Calderon-Gomez, E.; Bassolas-Molina, H.; Mora-Buch, R.; Dotti, I.; Planell, N.; Esteller, M.; Gallego, M.; Marti, M.; Garcia-Martin, C.; Martinez-Torro, C.; et al. Commensal-Specific CD4(+) Cells From Patients With Crohn’s Disease Have a T-Helper 17 Inflammatory Profile. Gastroenterology 2016, 151, 489–500.e3. [Google Scholar] [CrossRef]
- Fiorucci, S.; Biagioli, M.; Zampella, A.; Distrutti, E. Bile Acids Activated Receptors Regulate Innate Immunity. Front Immunol. 2018, 9, 1853. [Google Scholar] [CrossRef]
- Sayin, S.I.; Wahlstrom, A.; Felin, J.; Jantti, S.; Marschall, H.U.; Bamberg, K.; Angelin, B.; Hyotylainen, T.; Oresic, M.; Backhed, F. Gut microbiota regulates bile acid metabolism by reducing the levels of tauro-beta-muricholic acid, a naturally occurring FXR antagonist. Cell Metab. 2013, 17, 225–235. [Google Scholar] [CrossRef]
- Campbell, C.; McKenney, P.T.; Konstantinovsky, D.; Isaeva, O.I.; Schizas, M.; Verter, J.; Mai, C.; Jin, W.B.; Guo, C.J.; Violante, S.; et al. Bacterial metabolism of bile acids promotes generation of peripheral regulatory T cells. Nature 2020, 581, 475–479. [Google Scholar] [CrossRef] [PubMed]
- Biagioli, M.; Carino, A.; Cipriani, S.; Francisci, D.; Marchiano, S.; Scarpelli, P.; Sorcini, D.; Zampella, A.; Fiorucci, S. The Bile Acid Receptor GPBAR1 Regulates the M1/M2 Phenotype of Intestinal Macrophages and Activation of GPBAR1 Rescues Mice from Murine Colitis. J. Immunol. 2017, 199, 718–733. [Google Scholar] [CrossRef] [PubMed]
- Verbeke, L.; Farre, R.; Verbinnen, B.; Covens, K.; Vanuytsel, T.; Verhaegen, J.; Komuta, M.; Roskams, T.; Chatterjee, S.; Annaert, P.; et al. The FXR agonist obeticholic acid prevents gut barrier dysfunction and bacterial translocation in cholestatic rats. Am. J. Pathol. 2015, 185, 409–419. [Google Scholar] [CrossRef] [PubMed]
- Wang, Y.D.; Chen, W.D.; Wang, M.; Yu, D.; Forman, B.M.; Huang, W. Farnesoid X receptor antagonizes nuclear factor kappaB in hepatic inflammatory response. Hepatology 2008, 48, 1632–1643. [Google Scholar] [CrossRef]
- Xiao, F.; Dong, F.; Li, X.; Li, Y.; Yu, G.; Liu, Z.; Wang, Y.; Zhang, T. Bifidobacterium longum CECT 7894 Improves the Efficacy of Infliximab for DSS-Induced Colitis via Regulating the Gut Microbiota and Bile Acid Metabolism. Front Pharm. 2022, 13, 902337. [Google Scholar] [CrossRef]
- Dimitrov, V.; White, J.H. Vitamin D signaling in intestinal innate immunity and homeostasis. Mol. Cell Endocrinol. 2017, 453, 68–78. [Google Scholar] [CrossRef]
Publisher’s Note: MDPI stays neutral with regard to jurisdictional claims in published maps and institutional affiliations. |
© 2022 by the authors. Licensee MDPI, Basel, Switzerland. This article is an open access article distributed under the terms and conditions of the Creative Commons Attribution (CC BY) license (https://creativecommons.org/licenses/by/4.0/).